Embed Size (px)
Citation preview

Environmental Modelling & Software 22 (2007) 951e965www.elsevier.com/locate/envsoft
IRA-WDS: A GIS-based risk analysis tool forwater distribution systems
K. Vairavamoorthy a,b,*, Jimin Yan a, Harshal M. Galgale a, Sunil D. Gorantiwar a
a Department of Civil and Building Engineering, Loughborough University, LE11 3TU, UKb Department of Urban Water and Sanitation, UNESCO-IHE Institute for Water Education, P.O. Box 3015,
2601 DA, Delft, The Netherlands
Received 16 June 2005; received in revised form 30 March 2006; accepted 30 May 2006
Available online 13 December 2006
Abstract
This paper presents the development of a new software tool IRA-WDS. This GIS-based software predicts the risks associated with contam-inated water entering water distribution systems from surrounding foul water bodies such as sewers, drains and ditches. Intermittent water dis-tribution systems are common in developing countries and these systems are prone to contamination when empty. During the non-supply hourscontaminants from pollution sources such as sewers, open drains and surface water bodies enter into the water distribution pipes through leaksand cracks. Currently there are no tools available to help engineers identify the risks associated with contaminant intrusion into intermittentwater distribution systems. Hence it is anticipated that IRA-WDS will find wide application in developing countries. The paper summarisesthe details of the mathematical models that form the basis of IRA-WDS. It also describes the software architecture, the main modules, andthe integration with GIS using a tight coupling approach. A powerful GUI has been developed that enables data for the models to be retrievedfrom the spatial databases and the outputs to be converted into tables and thematic maps. This is achieved seamlessly through DLL calling func-tions within the GIS. This paper demonstrates the application of the software to a real case study in India. The outputs from IRA-WDS are riskmaps showing the risk of contaminant intrusion into various parts of the water distribution system. The outputs also give an understanding of themain factors that contribute to the risk.� 2006 Elsevier Ltd. All rights reserved.
Keywords: Water supply; Risk assessment; Contaminant intrusion; Developing countries; Intermittent water supply; GIS; Tight coupling
1. Introduction
Contamination of drinking water due to exposure tobiological and chemical pollutants is a major cause of illnessand mortality. Recent evidence has demonstrated that exter-nal contaminant intrusion into a water distribution networkmay be more frequent and of a greater importance thanpreviously suspected (LeChevallier, 1999). The problem ofexternal contaminant intrusion is more aggravated in devel-oping countries where the pollution sources crisscross with
* Corresponding author. Department of Urban Water and Sanitation,
UNESCO-IHE Institute for Water Education, P.O. Box 3015, 2601 DA, Delft,
The Netherlands. Tel.: þ31 15 2151780; fax: þ31 15 2122921.
E-mail address: [email protected] (K. Vairavamoorthy).
1364-8152/$ - see front matter � 2006 Elsevier Ltd. All rights reserved.
doi:10.1016/j.envsoft.2006.05.027
water distribution systems and intermittent water suppliesare prevalent (Choe and Varley, 1997; Seckler et al., 1998;Rosegrant et al., 2002).
A serious problem arising from intermittent supplies, whichis generally ignored, is the associated high level of contamina-tion which occurs in networks where there are prolonged pe-riods of interruption of supply due to negligible or zeropressure in the system. Such problems lead to increased healthrisks as water becomes contaminated with pathogens due tothe intrusion from surrounding foul water bodies (e.g. sewers,ditches), through joints and cracks in the deteriorated waterdistribution pipes. Hence in developing countries the distribu-tion network has become a point at which contamination fre-quently occurs to unacceptably high levels, posing a threat topublic health (Swerdlow et al., 1992; Besser et al., 1995).
952 K. Vairavamoorthy et al. / Environmental Modelling & Software 22 (2007) 951e965
Currently there are no software tools available to help engi-neers identify the risks associated with contaminant intrusioninto intermittent water distribution systems. The need forsuch tools has resulted in the development of the ImprovedRisk Assessment of Water Distribution Systems (IRA-WDS)tool. The application of this tool will enable engineers to bettermanage water quality by developing appropriate control mea-sures to minimise these risks by, for example, prioritising theiroperational maintenance strategies.
Previous studies mainly focussed on risk due to breakage ofpipes. All these risk assessment methodologies are based onthe principle of regression (Clark et al., 1982; Shamir andHoward, 1979; Walski, 1987; Walski and Pelliccia, 1982) orprobability analysis (Andreou et al., 1987a; Andreou et al.,1987b; Deb et al., 1998; Eisenbeis et al., 1999; Herz, 1996;Herz, 1998; Lei, 1997) and need large amounts of historicaldata. But the data needed for this purpose is extremely rareand insufficient (Ang and Tang, 1984; Guymon and Yen,1990). Moreover these studies were developed for the waterdistribution systems which operate at high pressures wherethe problem is one of leakage rather than contaminant intru-sion. But, as stated earlier, pressures in water distribution sys-tems in developing countries are often negligible due tointermittent water supply and contaminants may enter the sys-tem through the deteriorated pipes during the periods of lowpressure. As the techniques developed for risk assessmentdue to breakage do not highlight the contaminant intrusion,these are not applicable for intermittent water distribution sys-tems. The techniques developed to consider contaminant intru-sion under low or negative pressure resulting from transientuse rely on the leakage or breakage data as a surrogate forthe intrusion pathway (Boyd et al., 2004a,b; Funk et al.,1999; LeChevallier et al., 2003). But these methods have gen-erally assumed that contaminant sources exist around all waterdistribution pipes and were applied to continuous systems.
Lindley and Buchberger (2002) developed a technique toidentify the locations in the water distribution systems thatmay be susceptible to unintended contaminant intrusion.They argued that three susceptibility conditions must be metfor an intrusion into a water distribution system to occur.These are: an adverse pressure gradient, an intrusion pathwayand a contaminant source. However, the technique developedby Lindley and Buchberger simply performs a spatial analysisto produce a combination of the three susceptibility conditionsand does not model the susceptibility conditions for contami-nant intrusion.
Unlike the previous methods, the IRA-WDS assesses therisk of contaminant intrusion into the water distribution systemby modelling the process of contaminant transport from pollu-tion sources such as sewers, open drains and foul water bodies.In addition it includes a pipe-condition assessment model thatis used to indicate intrusion pathways. This model uses over20 indicators to estimate pipe condition.
Risk assessment of water distribution systems due to pollu-tion sources is a spatial process as the risk components such ashazard (due to pollution sources) and vulnerability (due to thewater distribution system) are both spatially diverse and need
large volumes of spatially diverse data. The pollution sourcessuch as the sewer system, open drains and surface water bodiesare parts of the urban sanitation infrastructure and geo-spatially referenced. In addition, the vulnerability (conditionin terms of deterioration) of the water distribution system isspatially distributed since the deterioration attributes are spa-tial in nature. The risk of contaminant intrusion into a waterdistribution system is a product of the interaction betweenthe hazard and vulnerability components and is therefore a spa-tial process. Hence it is necessary to know the spatial outputsin the form of maps representing the degree of severity of theassociated risk to the water distribution system so that decisionmakers can draw up priorities for the rehabilitation of thewater distribution system.
Geographical information systems (GIS) are powerful toolsfor handling spatial data, performing spatial analysis and ma-nipulating spatial outputs. A GIS also provides a consistentvisualisation environment for displaying the input data and re-sults of a model. This ability of GIS is very useful in a deci-sion-making process. The integration of GIS and externalmodels enables the utilisation of the advantages of both(Goodchild et al., 1992, 1993, 1996; Fotheringham and Roger-son, 1994; Fischer et al., 1996; Longley and Batty, 1996; Fo-theringham and Wegener, 2000; Argent, 2004). Since GISallows the input of spatial data into a model and providesthe outputs in spatial forms, it was decided to integratea GIS into the tool developed for risk assessment. The combi-nation of GIS and modelling tools enables the conversion oflarge amounts of data into information and then into practicalknowledge that is useful for risk assessment. The intrinsicability of GIS to store, analyze and display large amounts ofspatial data enables it to make a significant contribution torisk assessment.
This paper presents the development of a new softwaretool: the Improved Risk Assessment of Water DistributionSystems (IRA-WDS). The software consists of three models:the contaminant ingress model, the pipe-condition assessmentmodel and the risk assessment model. The models are devel-oped in the Cþþ language and integrated with the GIS usinga tight-coupling approach. This paper highlights the differentintegration methodologies available for the integration of envi-ronmental models with GIS and describes the integrationmethodology used for developing the IRA-WDS; the model-ling tools of IRA-WDS and their integration with GIS. Theuses of IRA-WDS and a case study of its application aredescribed.
2. Method
This section presents the methodology used for the im-proved risk assessment for water distribution systems due tocontaminant intrusion. Three risk factors have been identifiedfor contaminant intrusion into a water distribution system.These are: the section of pipe in the contaminant zone(SPCZ), the contaminant concentration and the condition ofthe water distribution pipes in terms of deterioration. Theserisk factors are established by the associated models, namely,
953K. Vairavamoorthy et al. / Environmental Modelling & Software 22 (2007) 951e965
contaminant ingress (contaminant zone and contaminant seep-age) and pipe condition assessment models. The three risk fac-tors obtained from these models are combined to obtain a riskindex for each pipe by the use of a risk assessment model.
Fig. 1 presents the conceptual model for IRA-WDS. Con-taminants from the pollution sources (e.g. leaky sewers,drains) seep through the soil and percolate down. In this pro-cess, these pollution sources develop a contamination zone(CZ) and if all or part of a water distribution system’s pipework passes through the contamination zone, contaminantsmay find entry into the pipes through such entry points ascracks and leaky joints. Hence, there is a risk of contaminantintrusion if a water pipe lies in a contaminant zone and at thesame time the condition of the pipe has been compromised soas to allow contaminant entry.
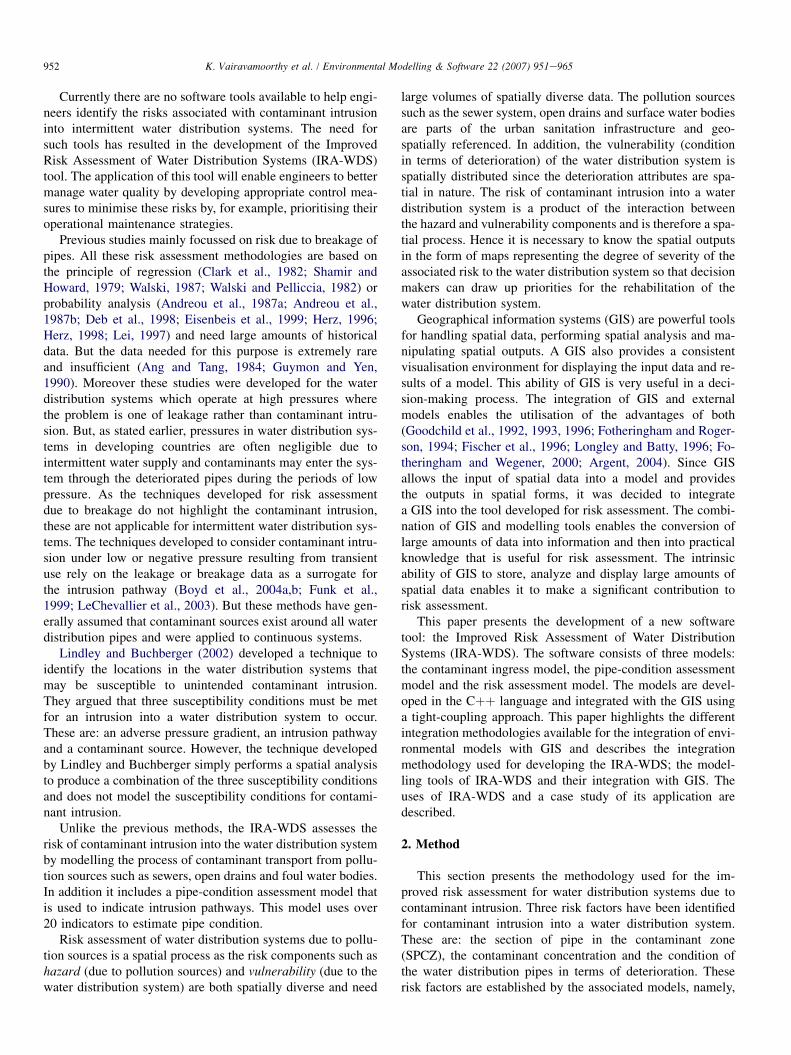
Thus the methodology consists of developing and integrat-ing the following three separate models as shown in Fig. 2.
Fig. 1. Conceptual model for IRA-WDS.
Models Risk factors
Contaminant Seepage Model
Predict the contaminantconcentration along SPCZ of waterdistribution sste
Contaminant Zone Model
Obtain the zone of contaminationfor different pollution sources todetermine the potential pollutionareas (PPAs)
Pipe Condition Assessment Model
Assess the condition of water pipein term of deterioration todetermine the contaminant intrusionpotential
Section ofwater pipe in
contaminationzone (SPCZ)
Contaminantconcentrationalong SPCZ
Contaminantintrusionpotential
Risk assessm
ent model
Fig. 2. Components of IRA-WDS modelling tools.
2.1. Contaminant ingress
The contaminant ingress model estimates the contaminantzone of the pollution sources (sewer pipes, open drains/canalsand surface water bodies), and identifies the section of the wa-ter distribution pipes passing through the contaminant zone(SPCZ). This model consists of two parts: the contaminantzone and contaminant transport.
The contaminant zone model predicts the envelope of pol-lution emanating from pollution sources: the contaminantzone. The model is based on the seepage process, which formspart of the theory of soil mechanics. It is assumed that theseepage of contaminants from pollution sources such as un-lined canals/drains and surface water bodies follow a saturatedflow while that from pollution sources such as sewer pipelinesand lined canals/drains follows an unsaturated flow. The sep-arate sets of equations for the estimation of a contaminantzone were developed for saturated and unsaturated flows bymodifying the approach presented by Harr (1962). The detailsof the development of these equations can be found in Yanet al. (2002). Once the contaminant zones formed due to pol-lution sources are established, the model uses spatial tech-niques to estimate the sections of the water distributionpipes that intersect with the contaminant zone (SPCZ). Thisis achieved using geometric algorithms. The algorithmscalculate the length of contaminated pipe (LC) in the contam-inant zone using the upstream and downstream points of inter-section between the contaminant zone and the segment of thewater pipe passing through the contaminant zone, as given inEq. (1):
LCk ¼��upkdpk
����!��; k ¼ 1; 2; .;NP ð1Þ
where LCk is the length of the kth pipe in the contaminant zone(m); upk and dpk are the upstream and downstream intersectionpoints of the kth pipe with the contaminant zone and NP is thenumber of water distribution pipes.
The contaminant transport model simulates the water fluxand the variable concentration of the contaminants withinthe contaminant zone and then predicts the contaminantloading on the SPCZ. This is done by modelling the con-taminant transportation process through the soil from thepollution sources towards the water distribution pipes. Twoseparate models were developed for estimation of the waterflux: the unsaturated flow model for pollution sources suchas sewer pipes and lined drains/canals and the saturatedflow model for unlined drains/canals and surface waterbodies.
For the saturated flow model the flow region is divided intoa flownet and for each cell of the flownet the pore-water veloc-ity vi is estimated by combining the velocity potential and Dar-cy’s equation (Fetter, 1999). For the unsaturated flow model,the pore water velocity is calculated using the water flux ob-tained from the GreeneAmpt model and the projected watercontent (Green and Ampt, 1911).
These pore-water velocities are then used by the contami-nant transport model to calculate the variable contaminant
954 K. Vairavamoorthy et al. / Environmental Modelling & Software 22 (2007) 951e965
concentration in soil. In this paper, an analytical solution forthe advection-diffusion-reaction equation developed by Bear(1972) is used, as given in Eq. (2):
RC¼ 1
2
(exph nz
2Dð1�GÞ
ierfc
z� ðnt=RÞG
2ffiffiffiffiffiffiffiffiffiffiffiDt=R
p!
þ exph nz
2Dð1þGÞ
ierfc
zþ ðnt=RÞG
2ffiffiffiffiffiffiffiffiffiffiffiDt=R
p!)
ð2Þ
where
G¼ffiffiffiffiffiffiffiffiffiffiffiffiffiffi1þ 2Hp
H ¼ 2lD
n2
R¼ 1þ rbKd
n
where RC is the relative concentration, t is time (hours), z isthe depth along the flow path (cm), D is the dispersion coeffi-cient (cm2/day), n is the pore-water velocity (cm/h), rb is thebulk density (g/cm3); Kd is a sorption constant, n is the poros-ity, S is the solid-phase concentration (mg/l), and l is the first-order decay coefficient in the liquid phase (1/h).
The contaminant transport model estimates the profile ofthe contaminant concentration in the soil. The contaminant
concentration along the SPCZ is the average concentrationat its start and end intersection points as given by Eq. (3).
CCK ¼RCupk
þRCdpk
2; k ¼ 1;2;.;NP ð3Þ
where CCk is the average contaminant concentration alongSPCZ of pipe k, RCupk
is the contaminant concentration atthe upstream intersection point and RCudk
is the contaminantconcentration at the downstream intersection point of pipe k.
2.2. Pipe condition assessment
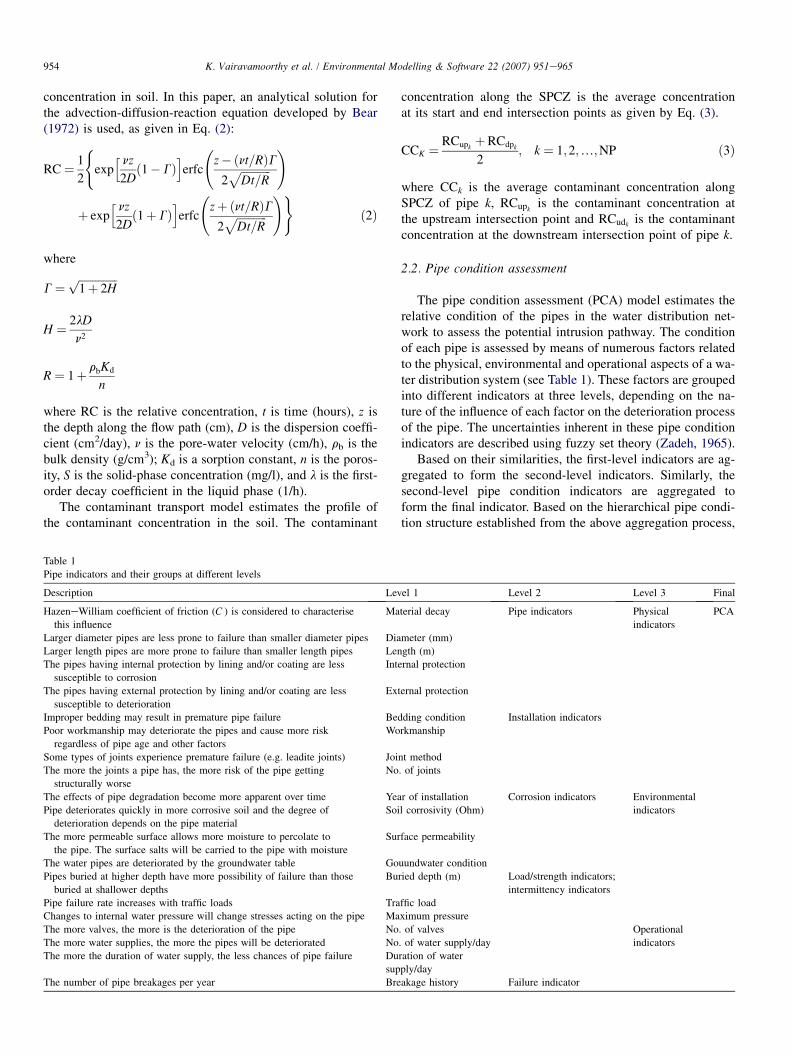
The pipe condition assessment (PCA) model estimates therelative condition of the pipes in the water distribution net-work to assess the potential intrusion pathway. The conditionof each pipe is assessed by means of numerous factors relatedto the physical, environmental and operational aspects of a wa-ter distribution system (see Table 1). These factors are groupedinto different indicators at three levels, depending on the na-ture of the influence of each factor on the deterioration processof the pipe. The uncertainties inherent in these pipe conditionindicators are described using fuzzy set theory (Zadeh, 1965).
Based on their similarities, the first-level indicators are ag-gregated to form the second-level indicators. Similarly, thesecond-level pipe condition indicators are aggregated toform the final indicator. Based on the hierarchical pipe condi-tion structure established from the above aggregation process,
Table 1
Pipe indicators and their groups at different levels
Description Level 1 Level 2 Level 3 Final
HazeneWilliam coefficient of friction (C ) is considered to characterise
this influence
Material decay Pipe indicators Physical
indicators
PCA
Larger diameter pipes are less prone to failure than smaller diameter pipes Diameter (mm)
Larger length pipes are more prone to failure than smaller length pipes Length (m)
The pipes having internal protection by lining and/or coating are less
susceptible to corrosion
Internal protection
The pipes having external protection by lining and/or coating are less
susceptible to deterioration
External protection
Improper bedding may result in premature pipe failure Bedding condition Installation indicators
Poor workmanship may deteriorate the pipes and cause more risk
regardless of pipe age and other factors
Workmanship
Some types of joints experience premature failure (e.g. leadite joints) Joint method
The more the joints a pipe has, the more risk of the pipe getting
structurally worse
No. of joints
The effects of pipe degradation become more apparent over time Year of installation Corrosion indicators Environmental
indicatorsPipe deteriorates quickly in more corrosive soil and the degree of
deterioration depends on the pipe material
Soil corrosivity (Ohm)
The more permeable surface allows more moisture to percolate to
the pipe. The surface salts will be carried to the pipe with moisture
Surface permeability
The water pipes are deteriorated by the groundwater table Gouundwater condition
Pipes buried at higher depth have more possibility of failure than those
buried at shallower depths
Buried depth (m) Load/strength indicators;
intermittency indicators
Pipe failure rate increases with traffic loads Traffic load
Changes to internal water pressure will change stresses acting on the pipe Maximum pressure
The more valves, the more is the deterioration of the pipe No. of valves Operational
indicatorsThe more water supplies, the more the pipes will be deteriorated No. of water supply/day
The more the duration of water supply, the less chances of pipe failure Duration of water
supply/day
The number of pipe breakages per year Breakage history Failure indicator
955K. Vairavamoorthy et al. / Environmental Modelling & Software 22 (2007) 951e965
fuzzy composite programming (Bardossy and Duckstein,1992; Bender and Simonovic, 2000) is used to compute an‘‘indicator distance metric’’ for each indicator, and finally an‘‘overall distance metric’’ is obtained using Eq. (4).
Lj ¼(Xnj
i�1
"w
pj
j;i
fj;i� f w
j;i
f bj;i� f w
j;i
!pj#)1=pj
ð4Þ
where Lj is the distance metric of pipe j, wj,i is the weighting ofindicator i in group j, pj is a balance factor among the indica-tors for group j, f b
j,j is the best value for indicator i in group j,f w
j,i is the worst value for indicator i in group j, and fj,i is theactual value for indicator i in group j.
The weightings are assigned to indicate the relative impor-tance of the various pipe indicators in a particular group. Theyare generated by following an analytical hierarchy process(AHP) (Saaty, 1980). Balance factors that determine the de-gree of compromise between indicators of the same groupare assigned to different groups.
The final overall distance metric is a fuzzy number repre-sented by a membership function and is defuzzified usingthe maximising and minimising sets (Chen, 1985). The defuz-zified numbers thus rank the pipes according to their condi-tions. This metric will be used as a surrogate for thevulnerability of the water distribution pipe (Eq. 5). The detailscan be found in Yan and Vairavamoorthy (2003).
VUk ¼ dfðTFkÞ; k ¼ 1;2;.;NP ð5Þ
where VUk is the vulnerability of the water distribution pipe k,df is the method for defuzzification and TFk is the trapezoidalfuzzy number for pipe k.
2.3. Risk assessment
The risk of contaminant intrusion into the water distributionsystem results from the interaction between the hazard agentand the vulnerability of the water distribution pipe. The riskassessment model calculates this risk of contaminant intrusionby combining the outputs from the above two models.
In this study, the hazard agent is the contaminant loadingalong the section of pipes in the contaminant zone. The con-taminant loading is obtained from the length of the sectionof pipe in the contaminant zone and the concentration of con-taminants along this section of pipe (Eq. (6)). As stated earlier,these parameters (SPCZ and the contaminant concentration)are obtained with the help of the contaminant ingress model.
HAk ¼ LCK �p� rk �CCk; k ¼ 1;2;.;NP ð6Þ
where HAk is the estimation of hazard for pipe k, LCk is thenormalised length of the polluted pipe k, obtained from Eq.(1), rk is the normalised radius of pipe k and CCk is the normal-ised contaminant concentration of pipe k, obtained from Eq.(3).
The condition of the water distribution pipe, which is calcu-lated with the help of the pipe condition assessment model
(Eq. (5)), is used as a surrogate of the water pipe’s vulnerabil-ity to intrusion.
The combination of hazard agent and the vulnerability ofthe water pipe produces the risk index for contaminant intru-sion into the water distribution system. This paper uses a con-ventional multiple criteria evaluation (MCE), the weightedlinear combination (WLC), to calculate the risk index.
RIk ¼ ðwh�HAkÞ þ ðwv�VUkÞ; k ¼ 1;2;.;NP ð7Þ
where RI is the risk index, wh is the weighting for hazardagent, wv is the weighting for the vulnerability of the waterpipe, VUk is the vulnerability of the water pipe, obtainedfrom Eq. (5) and HAk is obtained from Eq. (6).
3. Software development
The three models were developed in the Cþþ program-ming language and integrated with ArcView 3.2 GIS, usinga tight-coupling approach (achieved with the Avenue program-ming language and dynamic link libraries (DLLs)). This GIS-based tool is the spatial decision support system, which hasbeen named as the Improved Risk Assessment-Water Distribu-tion System (IRA-WDS).
ArcView Dialog Designer has been used to design thegraphical user interfaces that enable seamless interaction ofthe user with the models developed. The interface allows theinput and retrieval of data to and/or from the model ina user-friendly way. The GUI also provides the functionalitiesfor generating input files, running external models and con-verting and displaying model outputs from formats such asASCII files to thematic maps.
The section below describes the main components of thesoftware. The software includes several modules based onmathematical models and a GIS-based interface.
3.1. Contaminant ingress model
The contaminant ingress model consists of three modules:the contaminant zone, contaminant seepage, and contaminanttransport. The data required for this model includes water dis-tribution system data, pollution source data (sewer, canal, andfoul water bodies) and soil data. The details of modules are de-scribed in Table 2.
The contaminant zone module predicts the contaminantzone for a particular pollution source (sewers, open drainsand foul water bodies). The SPCZ for the water distributionsystem is then identified using spatial analysis involving con-taminant zones and water distribution pipes.
The contaminant seepage module predicts flow velocity forboth saturated and unsaturated flows, using Darcy’s law andthe Green Ampt model respectively. The flow velocities are in-puts for the contaminant transport module.
The contaminant transport module calculates the contami-nant concentration along the SPCZ for steady and unsteadystate conditions. These outputs represent the hazard factorsin the risk assessment model.

956 K. Vairavamoorthy et al. / Environmental Modelling & Software 22 (2007) 951e965
Table 2
Module descriptions for contaminant ingress model
Module Purpose Input Output
Contaminant
zone
To determine the contaminant zone of pollution sources
and SPCZ along water distribution pipe. SPCZ is one of
the risk factors in risk assessment model
Networks data for pollution sources and
water distribution system
SPCZ along water distribution
pipe (m)
Contaminant
seepage
To calculate flow velocity due to the pollution sources.
The flow velocity is used for contaminant transport model
Properties for soil and pollution sources Pore-water velocity (cm/h)
Contaminant
transport
To calculate contaminant concentration above water
distribution system. The concentration is another factors
in risk assessment model
Properties for soil and pollution sources Relative contaminant
concentration
3.2. Pipe condition assessment model
The pipe condition assessment model consists of fivemodules: the fuzzy calculator; criteria normalisation; theweighting generator; the fuzzy composite programme; andthe classification module. The data required for the pipe con-dition assessment model concerns the water distribution sys-tem, the pipe deterioration indicator along with groundwaterand pressure zone data. The details of these modules aredescribed in Table 3.
The fuzzy calculator module performs fuzzy arithmetic cal-culations. Both triangular and trapezoidal fuzzy numbers areconsidered by this module. Various operators (e.g. addition,subtraction, multiplication, division, power), are overloadedso that normal arithmetic operators (þ, �, �, /) can be used.
The criteria normalisation module normalises pipe deterio-ration factors using criteria A, B, C or D that are used in thecomposite programming.
The weighting generator module generates weightings andbalance factors. The weights and balance factors (used forpipe condition indictors and groups) are either assigned di-rectly by the user or generated using the analytical hieraticalprocess (AHP). In addition, default weightings obtained by in-terviewing engineers and practitioners working on networkoperations have been given.
The fuzzy composite programming module aggregates thenormalised deterioration indicators, weightings and balancefactors to calculate a pipe condition index for each pipe.Each class in this module performs this operation for a specificlevel of the composite hierarchy structure.
The ranking and classification module defuzzifies the fuzzypipe-condition index, obtained from the fuzzy composite
programming module for each pipe and ranks/groups pipesaccording to their defuzzified pipe-condition index.
3.3. Risk assessment model
The risk assessment model consists of four modules: riskfactors normalisation; weighting generator; risk estimatorand the classification module. The details of these modulesare described in Table 4.
The risk factor normalisation module normalises a particularrisk factor. For example the SPCZ and contaminant concentra-tion risk factors are normalised and used to calculate the haz-ard. The hazard and vulnerability risk factors are thennormalised and used to assess risk.
The weighting generator module generates weightings foreach of the risk factors. These are either assigned directly bythe user or generated using the analytical hieratical process(AHP).
The risk estimator module generates the risk index for eachpipe by using a weighted linear combination (WLC).
The ranking and classification module ranks and groupspipes according to their risk index (the number of groups arespecified by the user).
3.4. Integration into the GIS
The integration of environmental models with GIS has beendiscussed by several researchers (Goodchild et al., 1992, 1993;Stuart and Stocks, 1993; Batty and Xie, 1994; Fotheringhamand Rogerson, 1994; Fischer et al., 1996; Goodchild et al.,1996; Karimi and Houston, 1996; Longley and Batty, 1996;Fotheringham and Wegener, 2000). In addition, Karimi and
Table 3
Module descriptions for pipe condition assessment model
Module Purpose Input Output
Fuzzy calculator To perform fuzzy arithmetic Fuzzy membership functions Aggregated fuzzy number
Criteria normalisation To normalise deterioration factors to the same
scale and used for composite programming
Properties for soil and pollution sources Normalised criteria for composite
programming
Weight generator To generate weights for deterioration factors
using either analytical hieratical process (AHP)
or assign weight directly and balance factors
Pair-wise comparison from interviewing
experts
Weight and balance factor
Fuzzy composite
programming
To calculate condition index using deterioration
indicators
Pipe deterioration data for water distribution
system
Pipe condition index
Ranking and
classification
Rank pipe condition index that are fuzzy
numbers and classify into groups given by user
Pipe condition index from composite
programming
Condition group classifications

957K. Vairavamoorthy et al. / Environmental Modelling & Software 22 (2007) 951e965
Table 4
Module descriptions for risk assessment model
Module Purpose Input Output
Criteria normalisation To normalise risk factors to the same scale
and used for risk estimator
Outputs from ingress model and pipe
condition assessment model
Normalised risk factors
Weight generator To generate weights for risk factors using
either analytical hieratical process (AHP) or
assign weight directly
Pair-wise comparison from interviewing
experts
Weight for risk factors
Risk estimator To generate risk index using the risk factors
obtained from ingress model and pipe condition
assessment model
Normalised risk factors Risk index
Ranking and
classification
Rank pipe risk index and classify into groups
given by user
Risk index from risk estimator Risk group classifications
Houston (1996) and Tait et al. (2004) also attempted to clas-sify different integration methodologies. In general, threemethods of integration or coupling are used to link environ-mental models with GIS. These are: loose coupling, tight cou-pling and embedded coupling. These three integrationmethods differ in their architectural characteristics and this de-pends on the degree and form of data exchange or sharing be-tween the GIS and the external models (Goodchild et al., 1992,1993; Nyerges, 1992; Fedra, 1993). With loose coupling, theGIS serves as both a pre-processor and a postprocessor tothe modelling system, while tight coupling is the integrationof the models and GIS under a common interface. In embed-ded coupling, the models are developed within the GIS envi-ronment or alternatively a GIS component is added to themodelling system (Huang and Jiang, 2002). Where complexmodels of different domains are to be integrated with GIS,tight coupling is needed (Karimi and Houston, 1996). Thetight coupling approach also offers full control to the experi-enced user and minimal interaction to the novice. Accordingto Tait et al. (2004), through tight coupling, modellers canspend more of their effort on building the models themselves.Therefore the tight coupling approach has been adopted in thedevelopment of IRA-WDS. Fig. 3 illustrates the integration ofmodels with GIS.
The GUI enables the data to be retrieved from the spatialdatabases, and then passed to the required models. The outputs
Ingress model
PCA model
Risk model
Geographic Database
Extraction Storage ProcessingMapping
Datainput
User Interface(GUI)
Display +reporting
GIS DSS
Fig. 3. Integration of models with GIS.
from the models are then converted and presented as tablesand thematic maps. This is all achieved seamlessly throughDLL calling functions within the GIS.
A Document Graphical User Interface (DocGUI) for IRA-WDS (Fig. 4) has been created based on the View DocumentGUI of ArcView. Hence the GUI has similar functionalities toView document, namely allowing the user to display, explore,query and analyze geographic data in IRA-WDS.
This IRA-WDS document GUI includes a selection of con-trols such as menus, buttons and tools that can be used to in-teract within the IRA-WDS document GUI. The menusprovide sub-menus for generating and loading the input files,for executing the models (through DLL) and viewing themodel outputs in tabular or thematic map formats. The modeloutputs are stored in both ASCII and shape file format (usingAvenue script written in the IRA-WDS). The main menus inIRA-WDS launch various important dialog boxes:
� The data preparation menu launches dialog boxes (Fig. 5)that allow the user to convert data from one format to an-other and to upload relevant shape files and tables into theIRA-WDS platform.� The contaminant ingress menu launches dialog boxes
(Fig. 6) that allow the uploading of the relevant shape-filesfor the model (i.e. water distribution network; sewer net-work; canal network; surface water bodies and soil type(note that there is a default database of soils)).� The pipe condition assessment menu launches several dia-
logs boxes (Fig. 7) that allow uploading of the relevantshape-files for the model (i.e. water distribution system,soil data, groundwater table and hydraulic pressure). Theuser can specify the pipe indicators to be considered for
Generate contaminant zone to locate potential pollution areas and predict contaminant concentration
Assess the condition of water distribution pipe in term of deterioration
Assess the risk of contaminant intrusion into water distribution pipe
Fig. 4. The major components of GIS-based IRA-WDS.

958 K. Vairavamoorthy et al. / Environmental Modelling & Software 22 (2007) 951e965
Fig. 5. Addition of shape files through ‘Data Preparation’menu.
the condition assessment and their respective crisp/fuzzyvalues (fuzzy values are inputted by means of a suitablemembership function). Note that there is a default data-base for pipe materials. The user can specify the weight-ings and balance factors for the pipe indicators (note thisdialog box will launch another that will allow the
weightings to be generated by the AHP method) and a localor global analysis and then input the range of values to beused (minimum and maximum). Note that there is a defaultdatabase for the ranges.� The risk assessment menu launches a dialog box (Fig. 8)
that allows uploading of the relevant output files from
Fig. 6. The main interface for ‘Contaminant Ingress Model’.

959K. Vairavamoorthy et al. / Environmental Modelling & Software 22 (2007) 951e965
Fig. 7. The main interface for ‘Pipe Condition Assessment Model’.
the contaminant ingress and pipe condition assessmentmodel. In addition it allows the user to specify the weightsrequired for hazard and vulnerability (note that this dialogbox will launch another that will allow the weights to begenerated by the AHP method).
4. Application of IRA-WDS
IRA-WDS was applied to one of the ten zones of the Gun-tur Municipal Corporation, Guntur, Andhra Pradesh, India.This zone is the ‘B. R. Stadium Zone’ and called Zone VIII.
Fig. 8. The main interface for ‘Risk Assessment Model’.

960 K. Vairavamoorthy et al. / Environmental Modelling & Software 22 (2007) 951e965
This zone has a population of about 60,000 and an area of4 km2. As in most parts of the country, an intermittent watersupply system is prevalent in this area. Water is suppliedthrough pipe networks for about 1 h per day.
The drinking water supplies in this area are prone to con-tamination due to the various pollution sources that exist inthis zone. Therefore the authorities responsible for managingthis system are keen to understand the risks to the water supplyassociated with the hazards described above and to developa maintenance strategy that will provide maximum improve-ments to water quality within their limited budget.
At several locations, underground sewer pipes run close,parallel and above the water distribution pipes. Frequent leaksare reported in the sewer network due to blockages. Sewerpipes only cover a small part of the case study area. Most sew-age is directly discharged into open drains and canals. Consid-erable amounts of seepage occur from these open drains and,since they are at ground level, this seepage can reach the waterdistribution pipes. Stagnant water is also present in natural de-pressions in the study area.
4.1. Data collection
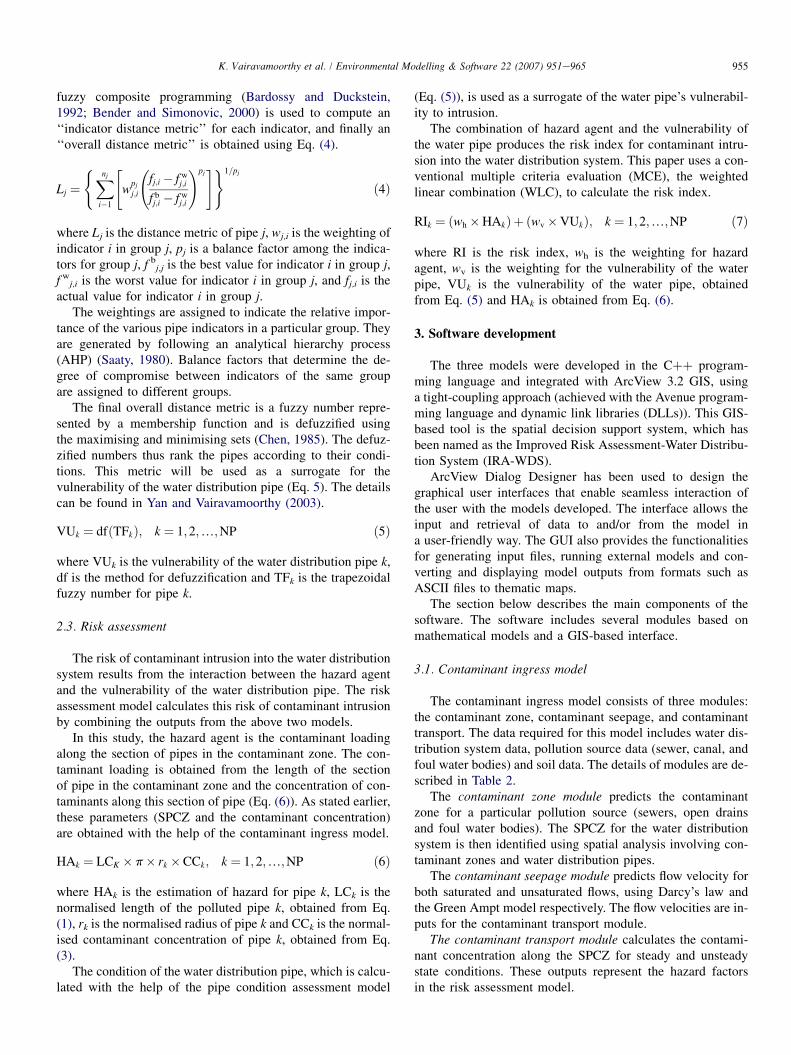
The application of IRA-WDS to the Guntur case study re-quired the construction of several databases. The details of thedata requirements of IRA-WDS are given in Table 5. Thesedatabases were constructed using data collected over a periodof 12 months from June 2002 with the assistance of the localauthorities and a local NGO. Four thematic maps were con-structed related to: the water distribution network; the sewernetwork; the network of canals/open drains and the surfacewater bodies (see Fig. 9).
The three models of IRA-WDS (contaminant ingress, pipecondition assessment and risk assessment model) extract the
necessary information from the corresponding databases ofeach theme in order to run the simulations. The outputs ofeach model are returned back to the geo-database where thecorresponding output themes are generated.
In this study, three output themes are generated namely: theSPCZ theme generated from the ingress model; the pipe con-dition theme generated from the pipe condition assessmentmodel and the risk assessment theme generated from therisk assessment model.
4.2. Results
The outputs of IRA-WDS (SPCZ, pipe condition and riskmaps) for the Guntur case study area are discussed in thissection.
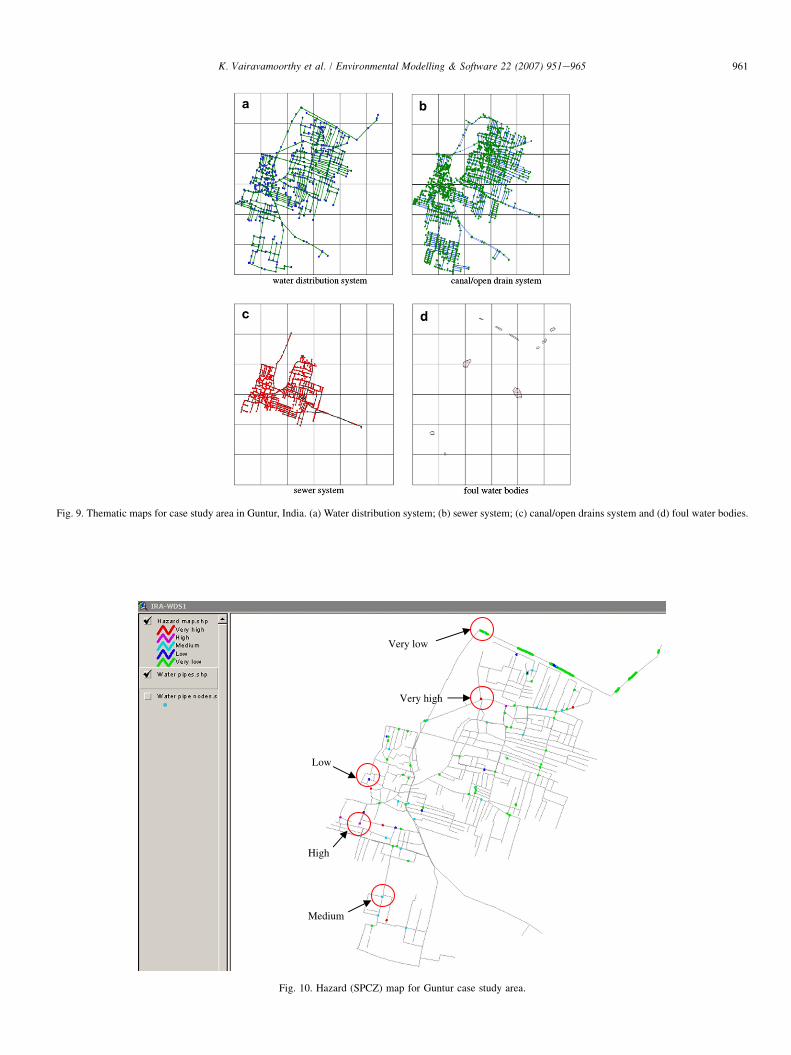
4.2.1. SPCZ MapThe SPCZ map shown in Fig. 10, indicates the section of
pipes in the water distribution system that are within the con-taminant zone of pollution sources (sewers, canals/open drainsand foul water bodies). In addition, the relative contaminantloading on the SPCZ is also shown. Therefore this output givesan indication of the sections of water pipes in danger of beingcontaminated.
4.2.2. Pipe condition mapThe pipe condition map (Fig. 11) gives the details of the
pipe condition in terms of the relative condition of eachpipe. It should be noted that the pipe conditions for the casestudy area are divided into five groups ranging from verybad to very good. From Fig. 11, it can be seen that the mainfactor affecting the condition of this system is the number ofjoints and service connections in the main pipes. This is be-cause the number of joints and service connections is
Table 5
The data requirement of IRA-WDS
Water distribution systems Network map (link and node coordinates in metres) and for each pipe of network: length of pipe, joint
method, material type, traffic load, surface type, internal protection, external protection, bedding condition,
workmanship, diameter of pipe, installation year, bury depth of start node, bury depth of start node, no of
connections, no of breaks per year, number of valves, duration of water supply per day (h/day), number
of times water supplied per day
Pollution sources The possible pollution sources and the data needed for each pollution sources is described below. Underground
sewer pipe: network map (link and node coordinates), and for each pipe its length, bury depth, material, leakage
rate (m/day) and diameter. Lined open ditch/drain: network map (link and node coordinates), and for each
ditch/drain of network, its length, material, depth and leakage rate. Unlined open ditch/drain: network map (link and
node coordinates), and for each ditch/drain of network, its length, depth, soil type and seepage rate. Surface water
bodies: surface water bodies map and for each surface water body, its area, depth, soil type and seepage rate
Soil Different soil types and for each soil type: saturated volumetric water content, initial volumetric water content,
saturated hydraulic conductivity (cm/h), soil characteristic curve coefficient, soil porosity, air entry head (cm),
pore size index, bulk density (g/cm3)and fraction organic content
Contaminant/pollutant For each pollution source: liquid phase decay (/h), diffusion coefficient (cm2/day), organic carbon partition
coefficient of the pollutant
Pipe material Different types of pipe material used and for each type: corrosion index, maximum pressure rating (kg/cm2), maximum
load rating (m-kg/m), design life, maximum diameter (mm), minimum diameter (mm) and the variation of
HazeneWilliam coefficient (C ) of friction with the age of pipe
Groundwater Groundwater zones in the area and for each zone, average depth to groundwater table (m) and average fluctuation of
groundwater (m)
Pressure zone Pressure zones in the water distribution system network and for each zone the pressure in the system
961K. Vairavamoorthy et al. / Environmental Modelling & Software 22 (2007) 951e965
Fig. 9. Thematic maps for case study area in Guntur, India. (a) Water distribution system; (b) sewer system; (c) canal/open drains system and (d) foul water bodies.
Very low
Very high
Low
High
Medium
Fig. 10. Hazard (SPCZ) map for Guntur case study area.

962 K. Vairavamoorthy et al. / Environmental Modelling & Software 22 (2007) 951e965
Very bad Bad
Medium
Good
Very good
Fig. 11. Water pipe condition map for Guntur case study area.
a significant deterioration indicator since they providepotential portals for contaminant intrusion. Clearly theresults from this model enable decision makers to prioritisetheir investments in rehabilitation depending on the pipecondition.
4.2.3. Risk map for contaminant intrusionThe risk map generated for the Guntur case study area is
shown in Fig. 12. This figure indicates that most of the waterpipes have a medium or low risk. However, a small number ofpipes have a high risk of contamination. From the risk map in
A
B
C
E
D
Fig. 12. Risk map for contaminant intrusion for Guntur case study area.

963K. Vairavamoorthy et al. / Environmental Modelling & Software 22 (2007) 951e965
Fig. 12, several recommendations were made to reduce therisk of contaminant intrusion. These suggested that the author-ities should:
� replace/rehabilitate AC pipes which are found to be in badcondition and hence have a very high susceptibility to con-taminant intrusion (e.g. risk area A).� undertake a leakage detection and repair programme in
areas with many joints and connections (e.g. risk area B);� inspect open drains and reline where necessary (e.g. risk
area C);� provide protection to water pipes in areas where they are
close to the open drains (risk areas D);� de-water and fill foul water bodies in the north east (e.g.
risk area E).
Though the results obtained for the case study area couldnot be validated with actual field data, nevertheless the IRA-WDS provides engineers with valuable insights into the riskof water contamination in a water distribution system. Oneof the major benefits of using IRA-WDS, is that it is possiblefor the decision makers to gauge the impacts of the above rec-ommendations on the risk index. This can be achieved by sim-ply modifying the database appropriately and rerunning themodel. However, as there may be several other objectives re-lated to an investment strategy for the water distribution sys-tem, these should also be considered. For example, it wouldbe prudent to combine the outputs of this model with a hydrau-lic model to establish the most significant pipes in terms ofboth the risk of contaminant intrusion and changes requiredto improve the hydraulic carrying capacity of the system.
5. Conclusions
This paper recognises the need of municipal engineers indeveloping countries for a tool to assess the risk of contami-nant intrusion into a water distribution system so as to priori-tise risk mitigation actions. Currently there are no toolsavailable to enable engineers to identify the risks associatedwith contaminant intrusion into intermittent water distributionsystems. This research has identified a sourceepathwayereceptor approach for establishing the risk of contaminantintrusion and developed a powerful tool, IRA-WDS for thispurpose. This tool enables decision-makers to prioritise theirinvestments in relation to water quality management.
IRA-WDS consists of three separate models. The contami-nant ingress model establishes the hazard by estimating thecontaminant loading on a section of water distribution pipespassing through a contaminant zone. The pipe condition as-sessment model establishes the vulnerability by estimatingthe relative condition of pipes using fuzzy composite program-ming techniques. The risk assessment model then calculatesrisk by combining the outputs from the above two models(hazard and vulnerability).
The three models were developed in the Cþþ program-ming language and integrated with GIS using a tight-couplingapproach (achieved with the Avenue programming language
and dynamic link libraries (DLLs)). IRA-WDS also has a pow-erful GUI that enables data for the models to be retrieved fromthe spatial databases and the outputs from the models to beconverted and presented as tables and thematic maps. This isall achieved seamlessly through DLL calling functions withinthe GIS.
IRA-WDS has been applied to a water distribution networkin south India and the outputs used to generate several the-matic maps. These maps identified sections of the systemthat were most at risk and also provided an understanding ofthe main factors that contributed to the risk. The outcome ofusing this tool enables engineers to prioritise maintenancefor risk mitigation and also provides decision-makers witha better understanding of the process of contaminant intrusion.
It is anticipated that IRA-WDS will find wide applicationamong water utilities, especially in developing countrieswhere intermittent water supplies are the norm.
References
Andreou, S.A., Marks, D.H., Clark, R.M., 1987a. A new methodology for
modeling break failure patterns in deteriorating water distribution system:
theory. Advances in Water Resources 10, 2e10.
Andreou, S.A., Marks, D.H., Clark, R.M., 1987b. A new methodology for
modelling break failure patterns in deteriorating water distribution sys-
tems: applications. Advances in Water Resources 10, 11e20.
Ang, A.H., Tang, W.H., 1984. Probability Concepts in Engineering Planning
and Design. Wiley, New York.
Argent, R.M., 2004. An overview of model integration for environmental ap-
plication e components, frameworks and semantics. Environmental Mod-
elling and Software 19 (3), 219e234.
Bardossy, A., Duckstein, L., 1992. Analysis of a karstic aquifer management
problem by fuzzy composite programming. Water Resources Bulletin 28
(1), 63e73.
Batty, M., Xie, Y., 1994. Urban analysis in a GIS environment: population den-
sity modelling using ARC/INFO. In: Spatial Analysis and GIS. Taylor &
Francis, Bristol, pp. 189e220.
Bender, M.J., Simonovic, S.P., 2000. A fuzzy compromise approach to water
resource systems planning under uncertainty. Fuzzy Sets and Systems 115,
35e44.
Bear, J., 1972. Dynamics of fluids in porous media. In: Biswas, A.K. (Ed.),
Environmental Science Series. Elsevier, New York.
Besser, R.E., Moscoso, R.B., Cabanillas, A.O., Gonzalez, V.L., Minaya, L.P.,
Rodriguez, P.M., Saldana, S.W., Seminario, C.J.L., Highsmith, A.K.,
Tauxe, R.V., 1995. Prevention of cholera transmission: rapid evaluation
of the quality of municipal water in Trujillo, Peru. Boletin de la Oficina
Sanitariums Panamericana 119 (3), 189e194.
Boyd, G.R., Wang, H., Britton, M.D., Howie, D.C., Wood, D.J., Funk, J.E.,
Friedman, M.J., 2004a. Intrusion within a simulated water distribution sys-
tem due to hydraulic transients I: Description of test rig and chemical
tracer method. Journal of Environmental Engineering, ASCE 130,
774e777.
Boyd, G.R., Wang, H., Britton, M.D., Howie, D.C., Wood, D.J., Funk, J.E.,
Friedman, M.J., 2004b. Intrusion within a simulated water distribution sys-
tem due to hydraulic transients II: Volumetric method and comparison of
results. Journal of Environmental Engineering, ASCE 130, 778e783.
Chen, S.H., 1985. Ranking fuzzy numbers with maximizing set and minimiz-
ing set. Fuzzy Sets and Systems 17, 113e129.
Choe, K., Varley, R., 1997. Conservation and pricing-does raising tariffs to an
economic price for water make the people worse off? Prepared for the Best
Management Practice for Water Conservation Workshop, South Africa.
Clark, R.M., Stafford, C.L., Goodrich, J.A., 1982. Water distribution system:
a spatial and cost evaluation. Journal of Water Resources Planning and
Management, ASCE 108 (3), 243e256.

964 K. Vairavamoorthy et al. / Environmental Modelling & Software 22 (2007) 951e965
Deb, A.K., Hasit, Y., Grablutz, J.F.M., Herz, R.K., 1998. Quantifying Future
Rehabilitation and Replacement Needs of Water Mains. AWWA Research
Foundation, Denver, Co.
Eisenbeis, P., Rostum, J., Le Gat, Y., 1999. Statistical models for assessing the
technical state of water networks e some European experiences. Proceed-
ings of the AWWA Annual Conference, Chicago.
Fedra, K., 1993. GIS and environmental modelling. Environmental Modelling
with GIS. Oxford University Press, New York, pp. 35e50.
Fetter, C.W., 1999. Contaminant Hydrogeology, second ed. Prentice Hall,
Upper Saddle River, NJ.
Fischer, M., Scholten, H.J., Unwin, D., 1996. Spatial Analytical Perspectives
on GIS. Taylor & Francis, London.
Fotheringham, S., Rogerson, P., 1994. Spatial Analysis and GIS. Taylor &
Francis, London.
Fotheringham, S., Wegener, M. (Eds.), 2000. Spatial Models and GIS: New
Potential and New Models. Taylor & Francis, London.
Funk, J.E., Wood, D.J., Van Vuuren, S.J., LeChevallier, M.W., 1999. Pathogen
intrusion into water distribution systems due to transient. In: Proc. 3rd
ASME/JSME Joint Fluids Engineering Conference, San Francisco.
ASME, Fairfield, NJ.
Green, W.H., Ampt, G.A., 1911. Studies in soil physics. I. The flow of air and
water through soils. Journal of Agriculture Science 4, 1e24.
Goodchild, M.F., Haining, R., Wise, S., 1992. Integrating GIS and spatial data
analysis: problems and possibilities. International Journal of Geographic
Information Systems 6, 407e423.
Goodchild, M.F., Park, B.O., Steyaert, L.T. (Eds.), 1993. Environmental Mod-
elling with GIS. Oxford University Press, New York.
Goodchild, M.F., Steyaert, L.T., Park, B.O., Johnson, C.A., Maidment, D.R.,
Crane, M.F., Glendinning, S. (Eds.), 1996. GIS and Environmental
Modelling: Progress and Research Issues. GIS World Books, Fort
Collins, CO.
Guymon, G.L., Yen, C.C., 1990. An efficient deterministic-probabilistic ap-
proach to modeling regional groundwater-flow. 2. Application to Owens-
Valley, California. Water Resources Research 26 (7), 1569e1581.
Harr, M.E., 1962. Groundwater and Seepage. McGraw-Hill, New York.
Herz, R.K., 1996. Ageing processes and rehabilitation needs and strategies for
drinking water distribution networks. Journal of Water Supply Research
and Technology - Aqua 45 (5), 221e231.
Herz, R.K., 1998. Exploring rehabilitation needs and strategies for water dis-
tribution networks. Journal of Water Supply Research and Technology -
Aqua 47 (6), 275e283.
Huang, B., Jiang, B., 2002. AVTOP: a full integration of TOPMODEL into
GIS. Environmental Modelling and Software 17, 261e268.
Karimi, H.A., Houston, B.H., 1996. Evaluating strategies for integrating envi-
ronmental models with GIS: current trends and future needs. computers.
Environmental and Urban Systems 20 (6), 413e425.
LeChevallier, M.W., 1999. The case for maintaining a disinfectant residual.
Journal American Water Works Association 91 (1), 86e94.
LeChevallier, M.W., Gullick, R.W., Karim, M.R., Friedman, M., Funk, J.E.,
2003. The potential for health risks from intrusion of contaminants into
the distribution system from pressure transients. Journal of Water and
Health 1 (1), 3e13.
Lei, J., 1997. Statistical approach for describing lifetimes of water mains eCase Trondheim Municipality. Report No. 22F007.28, SINTEF Civil and
Environmental Engineering, Trondheim, Norway.
Lindley, T.R., Buchberger, S.G., 2002. Assessing intrusion susceptibility in
distribution systems. Journal of the American Water Works Association
94 (6), 66e79.
Longley, P., Batty, M. (Eds.), 1996. Spatial Analysis: Modelling in a GIS En-
vironment. Geoinformation International, Cambridge.
Nyerges, T., 1992. Coupling GIS and spatial analytical models. In: Proceed-
ings of 5th International Symposium on Spatial Data Handling. Humani-
ties and Social Sciences Computing Laboratory, University of South
Carolina, Columbia, SC, pp. 534e543.
Rosegrant, M.W., Cai, X., Cline, S.A., 2002. Averting an Impending Crisis.
Global Water Outlook to 2025, Food Policy Report. International Water
Management Institute (IWMI), Colombo, Sri Lanka.
Saaty, T.L., 1980. The Analytic Hierarchy Process. McGraw-Hill, New York.
Seckler, D., Molden, D., Arker, R., 1998. Water Scarcity in the Twenty First
Century. IWMI Water Brief 1. International Water Management Institute
(IWMI), Colombo, Sri Lanka.
Shamir, U., Howard, C.D.D., 1979. An analytic approach to scheduling
pipe replacement. Journal American Water Works Association 71 (5),
248e258.
Stuart, N., Stocks, C., 1993. Hydrological modeling within GIS: an integrated
approach. Application of Geographic Information System in Hydrology
and Water resources. Velp, The Netherlands, pp. 319e329.
Swerdlow, D.L., Mintz, E.D., Rodriguez, M., Tejada, E., Ocampo, C.,
Espejo, L., Greene, K.D., Saldana, W., Seminario, L., Tauxe, R.V.,
Wells, J.G., Bean, N.H., Ries, A.A., Pollack, M., Vertiz, B., Blake, P.A.,
1992. Waterborne transmission of epidemic cholera in Trujillo, Peru e
lessons for a continent at risk. Lancet 340 (8810), 28e32.
Tait, N.G., Davison, R.M., Whittaker, J.J., Leharne, S.A., Lerner, D.N., 2004.
Borehole optimisation system (BOS) e a GIS based risk analysis tool for
optimising the use of urban groundwater. Environmental Modelling and
Software 19, 1111e1124.
Walski, T.M., 1987. Replacement rules for water mains. Journal of the Amer-
ican Water Works Association 79 (11), 33e37.
Walski, T.M., Pelliccia, A., 1982. Economic analysis of water main breaks.
Journal of the American Water Works Association 74 (3), 140e147.
Yan, J.M., Vairavamoorthy, K., Lin, Z., 2002. Modelling contaminant intrusion
into intermittent water distribution system. In Proceedings of the Water
Resources Planning and Management, ASCE, 19e22 May 2002, Roanoke,
VA.
Yan, J.M., Vairavamoorthy, K., 2003. Prioritising water mains rehabilitation
under uncertainty. In Proceedings of the International Conference on Com-
puting and Control for the Water Industry (CCWI), 15e18 September
2003, Imperial College, London, UK.
Zadeh, L.A., 1965. Fuzzy sets. Information and Control 8 (3), 338e353.
Dr. Kalanithy Vairavamoorthy (email: [email protected]) is
Professor of Sustainable Urban Infrastructure Systems at UNESCO-IHE Insti-
tute for Water Education and Scientific Director of the European Integrated
Project SWITCH. He is a specialist in water-related infrastructure systems.
A particular aspect of his background and expertise is the combination of
a thorough understanding of water related urban infrastructure systems in
low and middle income countries, coupled with strong skills in mathematical
modelling, optimisation, and risk management. Main research areas are in the
development and application of risk based decision support systems and opti-
misation tools for the design, operation and management of water-related in-
frastructure systems. Dr. Kalanithy Vairavamoorthy may be contacted at
UNESCO-IHE Institute for Water Education, P.O. Box 3015, 2601 DA, Delft,
The Netherlands.
Jimin Yan (email: [email protected]) is a research scholar at Water Engi-
neering Development Centre, Department of Civil Engineering, Loughbor-
ough University. He has a MSc degree in Civil Engineering from Harbin
Institute of Technology (HIT), China. He has expertise in hydraulic and wa-
ter quality modelling of water distribution system, underground water asset
management and unaccounted for water (UFW) management. Jimin Yan
may be contacted at WEDC, Loughborough University, Leicestershire,
LE11 3TU.
Harshal Galgale (email: [email protected]) is a research scholar at
WEDC, Department of Civil and Building Engineering, Loughborough Uni-
versity, UK. He has completed Master of Technology with specialisation in Ir-
rigation and Drainage Engineering from Mahatma Phule Agricultural
University, Rahuri, India. After his masters he worked for a year at National
Environmental Engineering Research Institute (NEERI), Nagpur, India on us-
ing Remote Sensing and GIS techniques for in environmental impact assess-
ment studies and for about six months at Indian Agricultural Research
Institute (IARI), New Delhi, India on the design and development of GeoIn-
focrop model for spatial prediction of crop yields on regional scales. Harshal
Galgale may be contacted at WEDC, Loughborough University, Leicester-
shire, LE11 3TU.

965K. Vairavamoorthy et al. / Environmental Modelling & Software 22 (2007) 951e965
Dr. Sunil D. Gorantiwar (email: [email protected]) who is cur-
rently Academic Visitor to Water Engineering and Development Centre
(WEDC), Loughborough University is Associate Professor and Research En-
gineer, Groundwater Research Project in the Department of Irrigation and
Drainage Engineering, Mahatma Phule Agricultural University, Rahuri, India.
He has a M Tech degree in Water Resources Development and Management
from IIT, Kharagpur, India and PhD in Water Resources Engineering and Man-
agement from Loughborough University, Loughborough, UK. He has expertise
in water management of irrigation schemes in developing counties, micro irri-
gation methods and utilisation of groundwater for agriculture. Dr. Sunil D.
Gorantiwar may be contacted at WEDC, Loughborough University, Leicester-
shire, LE 11 3TU, UK.