Embed Size (px)
Citation preview

Page 1 of 78
Bellanaboy Bridge Gas Terminal IPPC Application. Reg No. 738 Responses to Request for Information dated 07 February, 01 March, 24 June 2005 Tranche 3 for 31 March 2006 Response presented according to headings in EPA letters of 07 February, 01 March and 24
June 2005
For
insp
ectio
n pur
pose
s only
.
Conse
nt of
copy
right
owne
r req
uired
for a
ny ot
her u
se.
EPA Export 25-07-2013:18:45:24

Page 2 of 78
IPPC - Item Bc Give details of the legal consent required and its status, for the wastewater discharge pipeline over land
This response replaces the response issued 8
th August 2005 (alterations made to the final bullet
point).
In November 2001, Shell E&P Ireland Limited (then named Enterprise Energy Ireland) applied for consent under Section 40 of the Gas Act 1976 (as amended) from the then Department of Marine and Natural Resources (DOMNR) to construct and operate an upstream pipeline which includes both the offshore and onshore elements of the pipeline including the Bellanboy Terminal waste water outfall overland pipeline. Consent was sought by means of “Application for Consent to Construct – Design Premise (November 2001) and Application for Consent to Construct – Scope and Drawings (November 2001). The status of the consent is that it was granted by DOMNR in April 2002.
The definition of ‘upstream’ pipelines for the purposes of section 40 of the Gas Acts 1976 to 2000 includes all the components of an upstream pipeline including the offshore and onshore elements. The components that make up the Corrib Field Development upstream pipeline are:
• 20” diameter carbon steel gas pipeline from the offshore field manifold laid subsea to the landfall and laid onshore to the Bellanboy Terminal
• Electro-hydraulical umbilical from the offshore field manifold laid subsea to the landfall and laid onshore to the Bellanboy Terminal
• Effluent outfall line laid onshore to the landfall and then subsea to 12.7km offshore of Broadhaven Bay where the outfall terminates at a water depth of 68.5m depth in a steel diffuser
For
insp
ectio
n pur
pose
s only
.
Conse
nt of
copy
right
owne
r req
uired
for a
ny ot
her u
se.
EPA Export 25-07-2013:18:45:24
Page 3 of 78
IPPC - Item Bd Provide a site plan of the installation to include the discharge pipeline (SW1). The boundary of the site shall be outlined in red and the plan shall be scaled and contain grid references.
Please find maps attached to show pipeline route location. The approximate grid references for the outfall diffuser location are: 435827E, 6020339N 54° 19’ 36.7” N 9° 59’ 12.3” W Please note that the final outfall location may be subject to slight adjustment due to local conditions and topography.
For
insp
ectio
n pur
pose
s only
.
Conse
nt of
copy
right
owne
r req
uired
for a
ny ot
her u
se.
EPA Export 25-07-2013:18:45:24

Page 4 of 78
IPPC - Item Da-3 Reference the BATNEEC guidance note for refinery oil or gas, and the BREF note on refining, justify the flaring of maintenance gas and venting of gas. In particular the cold venting of incondensibles from the MeOH regeneration, the compression trains, relief valves and fuel gas systems.
The design and operation of the vent and flare system at the Terminal has been driven by the requirement to balance the guidance given in the EPA Guidance note (Class 9.3) “Refining Petroleum or Gas”, and the Mineral Oil and Gas Refineries BAT Reference Note with site specific considerations at Bellanaboy. It is recognised that the use of flaring for safe disposal of natural gas from relief valves, compression trains and fuel gas systems is preferred in BREF note guidance, because it provides lower greenhouse gas emissions from the generation of carbon dioxide than as a non-combusted release of methane. The preference to route to flare the potential incondensable gas stream from the methanol regeneration activity is also recognised in the EPA BATNEEC Guidance and the aforementioned BREF note. It should be noted however that the release of methanol regeneration incondensables is not expected under normal operating conditions. The over-riding influence on the decision to permit these releases to be cold vented is the commitment to the local community and the Planning Authority, presented in the Environmental Impact Statement, and arrived at after extensive consultation during the planning application process, to reduce to a minimum the visual intrusion and disturbance that could arise from the operation of a flare in the what is a rural area. Details of the frequency of the emissions from these various sources are addressed in responses to a number of other requests for information. It is therefore concluded that BAT for these releases at the Terminal is delivered by the proposed design and operating philosophy.
For in
spec
tion p
urpo
ses o
nly.
Conse
nt of
copy
right
owne
r req
uired
for a
ny ot
her u
se.
EPA Export 25-07-2013:18:45:24
Page 5 of 78
IPPC - Item Db-1 Describe the management of the wells over the lifespan to ensure liquid surges are within design capacity of the gas plant.
Process simulations using steady state and dynamic models determine pipeline liquid hold-up across field life. These have indicated that liquid surges are only expected during ramp-up operations. Terrain induced slugging (slugging caused by changing seabed and hence pipeline elevations) is not expected. Production behaviour is not expected to cause flow induced dynamic slugging. Production ramp-up is a controlled and proceduralised operation. The well head choke valves will be used to provide direct control of production from each well, to mitigate effects of liquid surges and ensure that they are within the slug handling and liquids processing capacity of the gas plant. The most significant influence on pipeline liquid flow is formation water production. A combination of sub-sea and onshore surveillance will be used to identify the onset of formation water production. Well production will be cut-back at the wellhead choke valves as required to limit water production from individual wells as required.
For
insp
ectio
n pur
pose
s only
.
Conse
nt of
copy
right
owne
r req
uired
for a
ny ot
her u
se.
EPA Export 25-07-2013:18:45:24
Page 6 of 78
IPPC - Item Db 2 As the pressure drops over time, give details of the management of operating pressures at the gas plant.
The arrival pressure of produced fluids at the Terminal will decrease with reservoir depletion during the field life. The Terminal facilities are designed to handle the decrease in Terminal inlet pressure over the field life. During early years of production, the arrival pressure is high enough to letdown via Joule Thompson (JT) valve to condition the gas to meet sales gas specification. Following pressure letdown, the sales gas is compressed to export pipeline pressure in order to discharge into the export pipeline. When the arrival pressure decreases, initially the gas / gas exchanger is brought into service to pre-cool the inlet gas as much as possible in order to lower the required pressure drop across the JT valve and hence reduce compression power. When the inlet pressure falls further, expected around year 6 of production, the sales gas compressors will be re-wheeled to enable compression of sales gas to pipeline export pressure. Re-wheeling of a compressor involves the modification of internals to ensure efficient operation is maintained as arrival pressure and flow rates change over the life of the field. Following further decrease in inlet pressure, currently estimated to occur around year 10, a mechanical refrigeration unit or an alternative device could be installed to provide the cooling required to meet sales gas specification. Depending on the flow-rate and arrival pressures, further re-wheeling of the compressor is anticipated from year 10. Note: Application of mechanical refrigeration (or alternative technology) would be progressed in accordance with the IPPC variation process.
For
insp
ectio
n pur
pose
s only
.
Conse
nt of
copy
right
owne
r req
uired
for a
ny ot
her u
se.
EPA Export 25-07-2013:18:45:25

Page 7 of 78
IPPC - Item Db-3 Consider the need for a flame trap on the closed drains system.
The Closed Drain Drum is connected to the LP Flare via the LP Flare Header, which is only open to the atmosphere at the flare discharge point. The LP Flare Header has a continuous nitrogen purge backed up by a fuel gas purge to ensure exclusion of air. This is normal design practice for vent and flare systems. Addition of a flame trap is not believed necessary and is considered not to be appropriate since it would introduce a restriction in what is intended to be an unrestricted flow path.
For
insp
ectio
n pur
pose
s only
.
Conse
nt of
copy
right
owne
r req
uired
for a
ny ot
her u
se.
EPA Export 25-07-2013:18:45:25

Page 8 of 78
IPPC - Item Dc-2 Give details of any considerations given to the Corrib gas pipeline materials of the construction and lining in relation to corrosion and debris control
Corrosion Control The Corrib reservoir contains a sweet gas with an expected condensate yield of less than 0.5 bbls/mmscf, with 0.3% carbon dioxide (CO2). No Hydrogen sulphide (H2S) has been detected. This fluid is suitable for pipeline material made from traditional high-yield carbon steel grades. Following standard oil industry practice, calculations were undertaken to determine the appropriate corrosion and erosion allowance in the definition of pipeline wall thickness. These calculations take into account pressure and temperature variations that will occur along the length of the pipeline and variations over time as gas production declines. The calculations also make an allowance for potentially lower efficiency operation of the corrosion inhibitor chemical. At initial start-up of the wells a small quantity of sand may be produced and enter the pipeline. The specified pipeline wall thicknesses also take account of this factor and suitable corrosion allowance has been made. Internal corrosion control within the pipeline will be provided during operation by continuous injection of chemical corrosion inhibitor that is specifically selected to meet the particular conditions within the Corrib pipeline. Additionally, on line corrosion monitoring will be available, by way of a monitoring spool which will be placed offshore, close to the production manifold. Debris Control Prior to its operation, small quantities of weld and other debris that may be present after construction will be cleared from the pipeline by running a pig (pipeline cleaning, inspection and gauging device) through it. This debris is collected in a temporary pig trap inside the terminal, and collected for safe disposal. Following this pipe cleaning process, the permanent pig trap is connected to the pipeline prior to pipeline commissioning. Other than the initial occurrence of sand referred to above, no sources of debris are anticipated to arise in the pipeline during its operation.
For
insp
ectio
n pur
pose
s only
.
Conse
nt of
copy
right
owne
r req
uired
for a
ny ot
her u
se.
EPA Export 25-07-2013:18:45:25

Page 9 of 78
IPPC - Item Dc-3 Provide summary details of process parts (valves, flanges, pumps etc) to demonstrate that low emission technology has been selected
The principal sources of emissions from equipment and fittings in the terminal are pumps, compressors, flanges and valves. All items are subject to leak tightness checks with the aim of minimising unplanned emissions. The design, construction/fabrication methods and testing of equipment and piping systems all have their emphasis on eliminating potential hydrocarbon emissions. Piping Systems The design of piping systems is in accordance with established industry standard codes of practice, in particular ASME B31.3 Process Piping. This sets out requirements for the design of individual components, including criteria for selection of appropriate material and calculations to ensure sufficient wall thickness for pressure containment. Piping design has sought to minimise the number of non-welded joints in hydrocarbon containing systems. Requirements for flexibility analysis of piping systems are covered in ASME B31.3, with analyses having been carried out for all critical piping systems on the project. This ensures that the piping system design is suitable for all modes of operation and all appropriate loading combinations, e.g. wind loading, ground settlement etc. Forces and moments at equipment connections and at flanged joints are examined as part of the flexibility analysis, to ensure these are within allowable limits (usually to a code of practice, e.g. API 610 for pumps, API 617 for compressors). This will ensure that emissions from joints are minimised. Any piping systems with the potential for opening to atmosphere, e.g. vents and drains are designed in accordance with the project isolation philosophy, and require at least two means of isolation (e.g. valve and blind flange). Construction/Fabrication Piping systems are fabricated in accordance with ASME IX Welding and Brazing Qualification (and other standards.) Weld Procedure Qualifications and Procedure Qualification Records are required for all welding. Welders are required to be qualified to the appropriate parts of ASME IX. Welding is subject to non-destructive testing and inspection as appropriate. Hydrocarbon gas systems are all subject to visual inspection, radiography, magnetic particle inspection and dye penetrant inspection of all welds. Hydrocarbon containment welding wil be subject to 100% inspection and NDT. Bolted joints in piping systems are minimised, with welded connections used wherever practical, in order to minimise the number of potential leak paths. Piping systems with design pressure above 425 barg use ‘ring type joints’ at bolted connections, utilising ‘pressure energised’ solid metal gaskets. Trained personnel assemble any bolted joints, with detailed records kept of every joint made. Specialist equipment and materials are used, such as hydraulic tensioning tools on large diameter bolts to maintain specified bolt stress levels. Even tensioning improves the quality of seal achieved between flanges.
For
insp
ectio
n pur
pose
s only
.
Conse
nt of
copy
right
owne
r req
uired
for a
ny ot
her u
se.
EPA Export 25-07-2013:18:45:25

Page 10 of 78
Valves The project philosophy is to minimise the use of rising stem valve types in hydrocarbon service. Quarter turn valves (eg ball valves) have been specified where appropriate. Valves in piping systems are also required to comply with applicable codes of practice for their design, e.g. API 6D. Valves with rising stems incorporate a live loading gland design to maintain packing integrity. Piping valves are subject to stringent pressure testing by the manufacturer. This is generally to BS 6755 “Testing of Valves”, with any additional requirements over and above this specified in the purchase order. Valves are subject to assembled hydrostatic body tests at 150% of the design pressure, as well as internal seat leakage tests. Block valves are subject to high pressure gas testing on 10% of all valves by type. Testing After installation, and prior to operation, the complete piping system is subject to pressure testing in accordance with ASME B31.3. A hydrostatic test at a pressure equal to 150% of the highest design pressure (highest possible operating pressure) is performed on all hydrocarbon pipe-work. A Leak test is performed on all systems, once fully assembled. This involves pressurising the system with a Nitrogen-Helium mix, and using gas detection equipment to identify any leakage at flanged joints. Pumps and Compressors The process pumps have been designed to international recognised standards (e.g. API etc) for the process fluid being handled. International standards are based on the accumulated knowledge and experience of manufactures and users of equipment in the petroleum, natural gas and chemical industries. International standards define requirements for materials of construction, pressure & temperature rating, sealing systems and hydrostatic & performance testing to ensure maximum mechanical integrity & safe operation of the equipment with minimal environmental impact. The process pumps were originally designed and manufactured four years ago to api 610 centrifugal pumps, with API 682 Pump Sealing Systems. Since that time API 682 has been revised and, to enhance the pump sealing systems for the pumps handling flammable fluids (hydrocarbon condensate, methanol, etc), the relevant pumps will have their sealing systems upgraded to a double seal arrangement incorporating the latest API 682 Plan 53b Sealing Arrangement. This will improve the pump sealing system safety standard, and reduce potential emissions. Centrifugal compressors are provided with tandem dry gas seals. Degradation in primary seal performance is monitored by trending of pressure drop across restriction orifice in the inter-seal bleed line to flare. Reciprocating compressors each have two rod seals. The inter seal cavity is purged with inert gas and alarms in the event of seal degradation. Operational Surveillance A formal Leak Detection and Repair (LDAR) programme will be developed which will incorporate the checks identified above, in addition to periodic monitoring by an intrinsically safe, hand held analyzer to detect any hydrocarbon loss from valves, flanges and pump seals. The LDAR programme will include the determination of the type of measurement, frequency, type of components to be checked, what leaks should be repaired and how fast action should take place
For
insp
ectio
n pur
pose
s only
.
Conse
nt of
copy
right
owne
r req
uired
for a
ny ot
her u
se.
EPA Export 25-07-2013:18:45:25

Page 11 of 78
(as per BREF note). Internal leakages across passing critical valves will be noticed via the increased rate above background (eg nitrogen purge) levels.
For
insp
ectio
n pur
pose
s only
.
Conse
nt of
copy
right
owne
r req
uired
for a
ny ot
her u
se.
EPA Export 25-07-2013:18:45:25
Page 12 of 78
IPPC - Item Dd-2 Describe the process of pressure inspection gauges (PIGS) launching and retrieval including details of process control, environmental emissions, the predicted frequency of such events and that conditions that instigate pigs launch. Give details of the typical volumes of liquid slugs to be catered for during and after such an operation.
Pipeline cleaning, inspection and gauging tools (pigs) are fluid propelled vehicles which can be sent through the pipeline for multiple purposes, such as inspection (intelligent pigging), cleaning, swabbing (liquid puddle removal) or dewatering (bulk liquid removal). The Corrib pipeline design facilitates transmission of cleaning pigs during commissioning, and subsequent inspection pigs or swabbing pigs. After installation, prior to bringing the pipeline into operation, a cleaning pig will be run through the pipeline. This operation will be conducted from the land to a temporary subsea pig trap. This will remove any debris left in the pipe after welding together the separate lengths of pipe. It is unlikely to generate more than 1m
3 - 5m
3 of grit, as it is planned for the pipe to be water-jetted before
load-out to the lay barge. The subsea pig trap will be later returned to a surface support vessel before the trap is taken to an onshore location for disposal of waste. Subsequent to commissioning, a fundamental element of the pipeline operating philosophy is that pigging of the pipeline will only be required infrequently during its operational life. Pigging is anticipated to be limited to an initial baseline survey plus the possibility of a subsequent intelligent inspection pig after the first 3 to 5 years of operation to confirm corrosion control and wall thickness. Routine liquid swabbing is not planned. Prior to running the intelligent pig referred to above, a dummy pig would be run to check that there are no restrictions in the pipeline. The intelligent pig run would typically require a reduction in pipeline operating pressure and terminal throughput. There would likely be only an insignificant and temporary reduction of emissions and discharges from the Terminal. As the function of the pig is not to brush or swab the pipeline walls, only a very small quantity of grit (typically less than 1m
3) may accumulate ahead of the pig during this operation, and will be collected in the pig trap
on its receipt in the Terminal. This would be assessed and managed according to Terminal waste management procedures to ensure safe and appropriate disposal. The pig receiver is located within a paved area so that at the end of pigging operations, (including draining liquids in the pig trap to the closed drains) on opening the pig trap, any remaining liquid within the pig trap will be discharged to the drainage system and ultimately routed via the surface water treatment plant for processing. As pigging is therefore planned to be a very rare event, calculations of the precise liquid slug size would be made during detailed planning of the operation, when relevant pipeline flow conditions would be accurately known. Detailed procedures would also be prepared for the pigging exercise prior to commissioning and integrated as part of the site Environmental Management System, when best available data regarding pipeline and plant conditions are available. The slug catcher sizing has been calculated based on modelling of the range of flow conditions that are expected during the life of the field. Pigging procedures would normally involve a planned reduction in pipeline liquid hold-up prior to pigging. Experience with other sub-sea systems shows that the liquid volume that would be pushed in front of the pig would be within the normal operating envelope of the slug catcher. Processing emissions and discharges would also be expected to remain within the normal range.
For
insp
ectio
n pur
pose
s only
.
Conse
nt of
copy
right
owne
r req
uired
for a
ny ot
her u
se.
EPA Export 25-07-2013:18:45:25

Page 13 of 78
IPPC - Item De-2 Give the liquid surge capacity of the slug catcher. Describe the separation process of the aqueous phase from the hydrocarbon condensate in the slug catcher Consider the need for a three phase separator to improve separation.
Slug Catcher - Surge Capacity Dynamic simulation of pipeline operations has concluded that terrain induced slugging (slugging caused by changing seabed and hence pipeline elevations e.g. higher elevation to lower elevation and then to a higher elevation again) is not expected. Production behaviour is not expected to cause flow induced dynamic slugging. However, some liquid surges can be expected during ramp-up operations. Production ramp up is a planned and controllable operation and hence surge volumes are both predictable and controllable. Slug catcher working volume for accommodation of liquid surges = 150 m
3.
When a slug enters the slug catcher and the level in the slugcatcher rises a level controller will increase the liquid withdrawal rate up to 200 m
3/h. In the event that the liquid level rises to the
pre-determined High-High liquid level, the inlet valve to the slugcatcher closes to prevent any liquid carryover into the gas system.
Slug Catcher - Description of Liquid Separation Process (Refer also to response to item Dd-1) See schematic of slug catcher below.
Produced well fluids will normally arrive as a multiphase mixture of liquid and gas. The liquid
phase comprises a hydrocarbon and aqueous phase. Gross separation of liquids from the gas
phase is achieved mainly in the inlet manifold and separation chamber, with some additional degassing achieved in the liquid fingers.
Separation is achieved by allowing sufficient residence time for the different “settling velocities” of
each phase to deliver the required separation. Typically, gas density will be less than 150kg/m3,
condensate density is approx 600 kg/m3 and aqueous phase density is approx. 1000 kg/m
3.
For
insp
ectio
n pur
pose
s only
.
Conse
nt of
copy
right
owne
r req
uired
for a
ny ot
her u
se.
EPA Export 25-07-2013:18:45:25

Page 14 of 78
Consider the need for a three phase separator to improve separation The slug catcher design provides three phase separation allowing bulk separation of gas and liquid streams, producing the following streams as shown in the schematic above, namely
• wet gas stream (with some entrained liquid)
• aqueous methanol stream (with some dissolved gas and condensate)
• condensate stream (with some dissolved gas and water/methanol) Each of the three phases will contain small quantities of the other phases hence additional downstream separation will be provided employing more specialised phase separation techniques to achieve final phase separation. An inlet separator will be located downstream of the slugcatcher and separates liquid from the gas stream prior to wet gas processing. Proprietary vessel internals will be included to improve the separation of the liquids from the gas. In addition, the plant design provides 3-Phase Separators downstream of the slug-catcher at the inlet to each of the Methanol and Condensate processes for supplementary degassing and further separation of hydrocarbon and aqueous phases.
Gas Liquid Separation
Gas Out (Wet)
Wellfluids In(Multiphase)
Hydrocarbon LiquidsOut
Liquid Hold-Up Capacity
Aquous Phase Out
Liquid Fingers
For
insp
ectio
n pur
pose
s only
.
Conse
nt of
copy
right
owne
r req
uired
for a
ny ot
her u
se.
EPA Export 25-07-2013:18:45:25

Page 15 of 78
IPPC - Item Df-1 Give the design capacity of the distillation column. Give details of known problems associated with methanol regeneration including the effects of an inconsistent feed. Discuss the efficiencies of operation below design capacity.
Methanol Distillation Column Design Capacity The methanol distillation column is designed to process approx 13 m
3/h of aqueous material
comprising approx 18-35% methanol in water. The distillation column is designed to turndown to less than 50% of maximum throughput. The column is designed to provide constant methanol quality over the range of operating flowrates. Efficiency of Operation Below Design Capacity Efficiency of the methanol distillation column is primarily dependant on efficiency of the column internals. When turning down from 100% to 50% of design feed-rate, the separation efficiency of the distillation column internals is predicted to deteriorate by less than 10%. The design incorporates adequate margin to compensate for this deterioration in column efficiency. In the event that insufficient feed is available to keep the methanol distillation column within its design operating envelope there is provision for operation in semi-batch mode using the upstream and downstream buffering capacity in the methanol storage tanks. Methanol Regeneration - Known Problems Problems have been observed if the methanol regeneration system feed is contaminated with condensate. Feed contamination can result in foaming within the distillation column and reduced separation efficiency. To minimise the amount of condensate in the feed to the methanol distillation column, the design provides facilities for condensate draw off from the raw methanol storage tanks, and a coalescer unit is provided upstream of the methanol still. Calcium sulphate scaling has been observed elsewhere within the methanol regeneration system reboiler and in the lower half of the column. A methanol still acid wash system is provided in case there is need to periodically de-scale the system using 5% hydrochloric acid solution dosed with corrosion inhibitor. During descaling, it is expected that the methanol regeneration column would be isolated from the process and water treatment unit. Descaling will be closely controlled. Spent acid will be removed by road tanker and disposed of in the correct manner by a licensed waste contractor. At present, a waste contractor has not been appointed. Once appointed, Shell will forward the water registration details, final destination of the waste and completed table H1 to the EPA.
For
insp
ectio
n pur
pose
s only
.
Conse
nt of
copy
right
owne
r req
uired
for a
ny ot
her u
se.
EPA Export 25-07-2013:18:45:25

Page 16 of 78
IPPC - Item Df-2 Having regard for the requirements of the Waste Incineration Directive (2000/76/EC), give details of the operating conditions and controls planned for the heating medium heater when fired on condensate and how the requirements of the Waste Incineration Directive will be met.
It has been decided that the heating medium heater will be fired using gas only. Therefore, all condensate will be exported, and requirements the Waste Incineration Directive will not be applicable.
For
insp
ectio
n pur
pose
s only
.
Conse
nt of
copy
right
owne
r req
uired
for a
ny ot
her u
se.
EPA Export 25-07-2013:18:45:25

Page 17 of 78
IPPC - Item Di Give details of the on-site storage tanks (methanol, condensate) including
1. schematics 2. size 3. colour 4. seal type and number 5. overfill protection 6. efficiency of seals on floating roofs 7. pressure valves 8. working pressures etc
1 Tank Schematics Tank Schematics are shown below, with relevant section (showing schematic and nozzle schedule) of datasheet also attached in summary table 1.1 Methanol – Raw (3 Tanks)
For
insp
ectio
n pur
pose
s only
.
Conse
nt of
copy
right
owne
r req
uired
for a
ny ot
her u
se.
EPA Export 25-07-2013:18:45:25

Page 18 of 78
1.2 Methanol Product (2 Tanks)
1.3 Off-Spec Condensate (1 Tank) Due to the proposed change in the storage handling and use of condensate on the site, a study has been initiated to determine the most appropriate use of this tank and the relative merits and disadvantages of available emission reduction measures. This will include consideration of carbon adsorption and the use of a floating roof with appropriate seals. The results of this study will be forwarded to the EPA as soon as it is available, anticipated to be by the end of May 2006. 1.4 Product Condensate (2 Tanks)
For
insp
ectio
n pur
pose
s only
.
Conse
nt of
copy
right
owne
r req
uired
for a
ny ot
her u
se.
EPA Export 25-07-2013:18:45:25

Page 19 of 78
2 Tank Size Tank sizes are given in the summary table 3 Tank Colour Tank colours are given in the summary table. The colour has been selected in order to minimise visual impact. 4 Seal type and number Seal types and number of each are all shown in the summary table. Generally the sealing comprises a sealed internal floating roof. 5 Overfill protection Each atmospheric storage tank has a high level alarm to alert the operator of high level in the tank. Each tank also has a high-high level alarm/trip which if activated will isolate incoming feed into tank. The available time between the high and the high-high levels of storage tanks, during normal operation, has been calculated for each of the tank. These are summarised below.
Tank Filling rate m3/h Time to fill tank
from HLL to HHLL
T-3001A/B Condensate Storage Tanks
Average 3.4 Maximum 9.9
9.2 hours 3.2 hours (slugging)
T-3002 Offspec Condensate Storage Tanks
Average 3.4
9.2 hours
T-4001A/B/C Raw Methanol storage Tanks
Average 10.6 Maximum 200.0
9.5 hours 0.5 hours
T-4002A/B Product Methanol Storage Tanks
Maximum 4.8 4.6 hours
Note: liquid surges are expected only infrequently and then only as part of planned operations. Prior to surges, contents of the receiving thank would be lowered to allow adequate surge capacity. Each atmospheric storage tank has an overfill protection system consisting of high-high level alarms / switches that initiates a shut down of the upstream unit feeding the storage tank to reduce and/or stop. In addition, each storage tank with an internal floating roof has an overflow arrangement located above High-High Liquid Level that is hard piped via a water filled liquid seal. This is intended to prevent an uncontrolled loss of containment if the instrumented protection fails to operate and release a controlled flow of liquid into the containment bund. 6 Efficiency of internal floating roof seals The purpose of the internal floating roof is to minimise contamination of the tank vapour. The efficiency of the floating seal is quoted as in excess of 95%. The floating seal design complies with the API Committee on Evaporation Loss Measurement bulletins including API 2519 on losses from Internal Floating Roof Tanks.
For
insp
ectio
n pur
pose
s only
.
Conse
nt of
copy
right
owne
r req
uired
for a
ny ot
her u
se.
EPA Export 25-07-2013:18:45:26

Page 20 of 78
7 Pressure Valves 7.1 Self Regulating Blanket Gas System Safety and integrity of the tanks which contain methanol or condensate is assured by the provision of inert gas blanketing. The inert gas ensures the tank vapour space operates outside flammable limits. The blanket gas system allows i. flow of Inert Gas into tank vapour space above the internal floating roof; and ii. flow of tank vapours out of tank vapour space above the internal floating roof. Each valve is designed such that the internal vapour space pressure of atmospheric tanks can be controlled during tank emptying/transfer by permitting either inward flow of Nitrogen into tank (gas blanket) or venting to atmosphere of tank vapour space. 7.2 Pressure & Vacuum Relief Valves Each tank has a 3-way pressure relief valve that allows flow into and out of the tank in order to protect the integrity of the atmospheric tank structure against over pressure or vacuum. This valve allows air to flow into the tank in the event of tank being under too high a vacuum (possible during tank emptying, rapid ambient cooling, or if blanket gas inflow is insufficient) and allows contained tank atmosphere to flow out in the event of over pressurisation (during tank filling or rapid ambient heating). Each valve is set to relief tank if pressure exceed 56 mbarg or –6 mbarg. In addition, each tank has a relieving manway. 8 Working Pressures All of the atmospheric tanks are designed to operate in the range of 25 to 40 mbarg. i.e. pressure above liquid (vapour space) will be near atmospheric. Note that tank design pressure is 56 mbarg.
For
insp
ectio
n pur
pose
s only
.
Conse
nt of
copy
right
owne
r req
uired
for a
ny ot
her u
se.
EPA Export 25-07-2013:18:45:26

Page 21 of 78
Tank No
off
Dimensions
Diameter x
Height
Roof Colour Seal types &
number
Efficiency of
seals on
floating roofs
Overflow protection Drain Pressure
Valves
Methanol - product
2
8.5m x 10m Fixed roof
with internal
Floating cover
Green Inert Gas Blanket
internal floating cover
Liquid filled overflow
In excess of 95%
Primary and secondary protection is provided
Primary - High Level in Tank shuts down incoming feed via ESDV system.
Secondary - liquid filled leg hydrostatically balanced against height of liquid
Bund and
closed drains
Yes
Vacuum and Over pressure protection
Methanol –
raw 3
13.5m x 10m Fixed roof
with internal
Floating cover
Green Inert Gas
Blanket
internal floating cover
overflow
In excess of
95%
Primary and secondary protection is
provided
Primary - High Level in Tank shuts down incoming feed via ESDV system.
Secondary - liquid filled leg hydrostatically balanced against height of liquid
Bund and
closed drains
Yes
Vacuum
and Over
pressure protection
Condensate -
Product 2
10m x 10.4m Fixed roof
with internal
Floating cover n
Green Inert Gas
Blanket
internal floating cover
overflow
In excess of
95%
Primary and secondary protection is
provided
Primary - High Level in Tank shuts down incoming feed via ESDV system.
Secondary - liquid filled leg hydrostatically balanced against height of liquid
Bund and
closed drains
Yes
Vacuum
and Over
pressure protection
Condensate -
Offspec 1
10m x 10.4m Fixed Roof Green Inert Gas
Blanket
Overflow
Not
applicable
Primary and secondary protection is
provided
Primary - High Level in Tank shuts down incoming feed via ESDV system.
Bund and
closed drains
Yes
Vacuum
and Over
pressure protection
For
insp
ectio
n pur
pose
s only
.
Conse
nt of
copy
right
owne
r req
uired
for a
ny ot
her u
se.
EPA Export 25-07-2013:18:45:26

Page 22 of 78
Tank No
off
Dimensions
Diameter x Height
Roof Colour Seal types &
number
Efficiency of
seals on
floating roofs
Overflow protection Drain Pressure
Valves
Secondary - Overflow via internal dip pipe to
a bunded area, dip pipe to be below
minimum liquid level and holed to prevent siphoning.
Notes 1. Use of Fixed roof tank with no internal roof. The off-spec condensate tank will normally be empty (i.e. no liquid) and will be called into service very
infrequently e.g. only in the event of the condensate being unfit for export. All hydrocarbon condensate flowing into this tank will be stabilised and will be reprocessed. Thus, along with the fact that this tank is kept under an inert gas blanket, it is not anticipated that there will be significant quantities of vapour emitted to the vapour space of this tank and hence minimum hydrocarbon emissions from the vapour space to atmosphere.
Hence this tank has not been provided with an internal floating cover.
For
insp
ectio
n pur
pose
s only
.
Conse
nt of
copy
right
owne
r req
uired
for a
ny ot
her u
se.
EPA Export 25-07-2013:18:45:26

IPPC Response
Page 23 of 78
IPPC - Item Dj Describe systems for (i) tank cleaning (ii) draining (iii) filling Include details of emissions and controls. Details of emissions may need some calculation.
(i)Tank Cleaning and Inspection
In general planned cleaning and draining of tanks will only be necessary prior to internal inspection, as the service of the tanks is not expected to produce any build up of sediment. When necessary, this cleaning will be performed by an approved specialist cleaning company. A full risk assessment will be carried out and a detailed procedure will be produced prior to any work commencing. All approvals will be in place for the use of any cleaning materials, chemicals and all associated waste from the cleaning work. All waste will be collected and disposed of by the specialist contractor through the appropriate channels. Inspection of the tanks will be carried out under a Risk Based Inspection (RBI) programme. The inspection programme and frequency will be based on external and internal examinations. An expert group/panel will decide on the strategy, inspection type and frequency. The panel will be chaired by an inspection engineer, and will typically include a process engineer, corrosion/materials engineer, maintenance engineer and operations personnel. The results from the panel's findings are fed into the inspection database, which are then applied to algorithms, which in turn determine the safe maximum period between external and internal inspections. Each system and tank will have it's own inspection frequencies as fluid composition, tank materials and coatings also have an effect on the inspection regime. However, this is typically between 5 –10 years. This review is periodically revisited to ensure the original frequencies are still valid. The associated examination/inspection results will be reviewed and used to confirm or amend the programme to ensure integrity is maintained. (ii) Tank Draining and Tank Entry Preparation
In order to clean and inspect the tanks, they will require draining, purging, full physical
isolation and venting. This work will be carried out by competent personnel under the
Installation Safe System Of Work (ISSOW). Preparation for confined space entry will be
carried out under the Shell Operating Codes of Practice. These codes cover the necessary
procedures for the equipment preparation, working with nitrogen, confined space entry,
recommissioning and reinstatement of the tanks and equipment.
The bulk of the tank draining will be done as far as possible using the permanent pumps and
pipework. The fluids will be removed to a point of pump net positive suction head (NPSH).
The residual fluid, below pump suction, will be removed using a propriety gulley sucking
pump. These fluids will be pumped into a closed/contained system where possible. Where
this is not possible, secondary storage will be used. This will be in the form of clean
Intermediate Bulk Containers (IBC) or similar. They will be used to hold the remainder of the
fluids. These fluids will be later returned to the system, or, if contaminated, will be removed
from site for authorised disposal by a licensed waste contractor. Any temporary storage
facilities used for this operation will be positioned within a temporary bunded system.
For
insp
ectio
n pur
pose
s only
.
Conse
nt of
copy
right
owne
r req
uired
for a
ny ot
her u
se.
EPA Export 25-07-2013:18:45:26

IPPC Response
Page 24 of 78
Once draining has been completed the system will be purged with nitrogen prior to venting to
atmosphere. Continuous ventilation, whether natural or mechanical will be provided and
monitored throughout the vessel entry period.
(iii) Filling
During Tank Filling, small volumes of blanket gas are displaced from tank to atmosphere via
tank inbreathing/outbreathing valve. This volume displaced is equal to the volume of incoming
fluid. Since the Raw Methanol, Product Methanol and Condensate Tanks are provided with
internal floating cover with an estimated efficiency in excess of 95% the amount of net VOC
emissions would be very low. The space above the floating cover is blanketed with Nitrogen
and any leakage through the seal is diluted by the N2. An estimate of emissions from the
tanks are given in the table below.
Emissions (VOC)
Fill Rate
VOC
Emission to Atmosphere Concentration During
tank filling
Annualised
Fill Frequency
Tank m3/hr m
3/hr kg/m
3 VOC kg/hr kg/yr
Raw
Methanol6,1
Ave.
10.6
Max.
200
0.53 (1)
10.0 (1)
0.065
0.065
0.035
0.65
2950
(assuming
max. 50%
of each
case)
On going
Slugging is
infrequent
Product Methanol
4,1 4.8 0.24 (1) 0.185 0.05 430 On going
Condensate1,2,3
Ave.
3.4
Max.
9.9
0.17 (1) 4.1 0.7 6,015 On going
Off Spec Condensate
5 Ave. 3.4
3.4 4.1 14 2,453 Infrequent
Notes
1. Tanks are provided with internal floating cover with an efficiency in excess of 95%.
Remainder of vent gas is Nitrogen used for blanketing.
2. Condensate Vapour Pressure @ 22oC = 0.69 atm
3. Assumed plant uptime/availability is 98% or 358 days / yr
4. Methanol Vapour Pressure @ 22oC = 0.14 atm
5. Normally Not in use, VOC emissions are negligible
6. Contains mainly methanol and produced water, with small quantities of hydrocarbon
condensate.
For
insp
ectio
n pur
pose
s only
.
Conse
nt of
copy
right
owne
r req
uired
for a
ny ot
her u
se.
EPA Export 25-07-2013:18:45:26

IPPC Response
Page 25 of 78
IPPC - Item Dk Give details of the pipelines on-site i.e. over-ground, underground, leak detection etc. Where underground piping is planned, justify the proposal.
No underground pipework carrying potentially hazardous raw materials or fuels will be present onsite. Underground services including oil water and uncontaminated surface water drain will be present. The oily water drainage system will be closed to ensure effective containment in the event of a spill. Terminal Pipework Terminal pipework is generally run above ground where possible, supported within the main pipe rack systems. All hazardous pressurised pipe-work is run within the over-ground infrastructure. Some service water and firewater applications are routed via underground routes. Some non-pressurised pipe-work will be routed underground for the open and closed drains systems. The design and routing of this pipe-work is such to ensure it is highly unlikely there will be any contaminated water running off the site. See explanation of civil drains system below. Terminal Leak Detection. Leak testing of all hydrocarbon and hazardous media lines will be carried out during the commissioning phase of the terminal build. Any leaks found during this stage will be repaired and then retested for tightness prior to hand-over of the plant / system to the operations department. Any work carried out on equipment that breaches hydrocarbon or hazardous media envelopes will be fully leak tested prior to the equipment being returned to service. Maintenance routines will be carried out to ensure integrity of all systems is maintained. This will be a Risked Based Inspection (RBI) programme of both intrusive and non-intrusive inspections varying from internal vessel/tank inspections to pipe/vessel wall thickness checks and external visual examinations. Online corrosion monitoring is also installed around critical locations. Plant operators will be vigilant during their daily/shift routine plant checks. There will also be a programme to carry out acoustic checks using a hand held monitor. This will be carried out under the health, safety and environmental programme, which will be developed prior to commissioning of the terminal. Any hydrocarbon releases to the external atmosphere will be picked up by the Fire and Gas detection system installed as components of the safety regime to detect flammable gas release in the case of the transfer of gaseous hydrocarbons. A formal Leak Detection and Repair (LDAR) programme will be developed which will incorporate the checks identified above, in addition to periodic monitoring by an intrinsically safe, hand held analyzer to detect any hydrocarbon loss from valves, flanges and pump seals. The LDAR programme will include the determination of the type of measurement, frequency, type of components to be checked, what leaks should be repaired and how fast action should take place (as per BREF note). Internal leakages across passing critical valves will be noticed via the increased rate above background (eg nitrogen purge) levels. Civil Drain System The oily water (closed) drains system for the terminal is a fully welded carbon steel system, with cathodic protection (CP). The open drains system is the drainage from the paved areas and is also a fully welded carbon steel system with CP. The CP system is a sacrificial anode
For
insp
ectio
n pur
pose
s only
.
Conse
nt of
copy
right
owne
r req
uired
for a
ny ot
her u
se.
EPA Export 25-07-2013:18:45:26
IPPC Response
Page 26 of 78
design with Inspection/maintenance man-ways installed at each anode location. As part of the Risked Based Inspection programme regular inspections of the CP sacrificial anodes will take place. The exact content and frequency of these routines will be determined by the expert group. The road drainage system that runs from the entrance at the R314 to the road loading/unloading area and waste material compound is drained via a series of manholes directly back to the waste water sump or via a road drainage system to a sump at the main entrance. This is in turn pumped back to the waste water sump. The contents of the waste water sump are routed through the surface water treatment system and discharged to sea via the outfall line. This system contains the water run off from the section of road trafficked by tankers. This system is designed for rainwater drainage from the road, but due to the presence of tankers, even though the likelihood of spillage is low, due to the sensitive environmental issues around the site this water will be treated as potential hazardous water rather than general run off water. Where there is no normal trafficking of roads by tankers, the drainage is natural run-off, which discharges off site through the local water-courses. As this water leaves the terminal site (inside the terminal fence) an emergency hold tank has been installed to allow for isolation from the local water courses if, in extreme circumstances, this water becomes contaminated in the event of a spill. The water can be pumped back to the water treatment sump for cleaning. The capacity of the interceptor is greater than the storage capacity of a single tanker compartment. Summary The pipe and drainage system design is considered to represent Best Available Technique in that:
• no underground pipework or hazardous chemicals, raw materials or fuels will be present;
• a below-grade sewer system is proposed to allow gravity collection and rainwater run-off. In areas where potentially hazardous materials are stored, used or transferred, a contained (enclosed) sewer system is employed to prevent the release off site of contaminants in the event of a spill; and,
• additional surface water protection is provided by interceptors in low risk areas.
For
insp
ectio
n pur
pose
s only
.
Conse
nt of
copy
right
owne
r req
uired
for a
ny ot
her u
se.
EPA Export 25-07-2013:18:45:26

IPPC Response
Page 27 of 78
IPPC - Item Ea-1 Complete Table E.1 (v) for all potential emissions including cold venting from methanol still, cold venting on fuel gas system and condensate stabilisation as described in section D of the application.
Emission Point Ref. No. (as per flow diagram)
Description Malfunction which could
cause an emission Emission details
(Potential max. emissions)
Material mg/Nm3 kg/h
A4-1 HP Flare Production Pipeline Depressurisation - full pipeline
NOx 49 11
CO 434 97
A4-1 HP Flare Production Pipeline Depressurisation - onshore section
NOx 49 3
CO 434 24
A4-1 HP Flare Compressor Start-Up HC N/A 16122
A4-1 HP Flare Plant Start-up (Base Case) NOx 49 5
CO 434 48
A4-1 HP Flare Plant Start-up (Alternate Option)
NOx 49 8
CO 434 68
A4-1 HP Flare Gas Compressor A - Manual Blowdown (Suction)
NOx 49 1
CO 434 5
A4-1 HP Flare Gas Compressor A - Purging (Suction)
HC N/A included in Compressor
Start-Up
For
insp
ectio
n pur
pose
s only
.
Conse
nt of
copy
right
owne
r req
uired
for a
ny ot
her u
se.
EPA Export 25-07-2013:18:45:26
IPPC Response
Page 28 of 78
Emission Point Ref. No. (as per flow diagram)
Description Malfunction which could
cause an emission Emission details
(Potential max. emissions)
A4-1 HP Flare Gas Compressor A - Manual Blowdown (Discharge)
NOx 49 1
CO 434 5
A4-1 HP Flare Gas Compressor A - Purging (Discharge)
HC N/A included in Compressor
Start-Up
A4-1 HP Flare Gas Compressor B - Manual Blowdown (Suction)
NOx 49 1
CO 434 5
A4-1 HP Flare Gas Compressor B - Purging (Suction)
HC N/A included in Compressor
Start-Up
A4-1 HP Flare Gas Compressor B - Manual Blowdown (Discharge)
NOx 49 1
CO 434 5
A4-1 HP Flare Gas Compressor B - Purging (Discharge)
HC N/A included in Compressor
Start-Up
A4-2 LP Flare Condensate Flash Drum Pressure Control
HC N/A 1066
A4-2 LP Flare Methanol Reflux Drum Pressure Control
HC N/A 33
A4-2 LP Flare Heating Medium Surge Drum HC N/A NNF
A4-2 LP Flare Heating Medium Drains Vessel
HC N/A 256
For in
spec
tion p
urpo
ses o
nly.
Conse
nt of
copy
right
owne
r req
uired
for a
ny ot
her u
se.
EPA Export 25-07-2013:18:45:26

IPPC Response
Page 29 of 78
Emission Point Ref. No. (as per flow diagram)
Description Malfunction which could
cause an emission Emission details
(Potential max. emissions)
A4-2 LP Flare Compressor A Turbine Fuel Gas Vent
HC N/A 386
A4-2 LP Flare Compressor A Skid Vent - Turbine Pilot Gas Purge
HC N/A 170
A4-2 LP Flare Compressor A Skid Vent - Routine
HC N/A 8
A4-2 LP Flare Compressor A Skid Vent - Emergency
HC N/A 58
A4-2 LP Flare Compressor B Turbine Fuel Gas Vent
HC N/A 386
A4-2 LP Flare Compressor B Skid Vent - Turbine Pilot Gas Purge
HC N/A 170
A4-2 LP Flare Compressor B Skid Vent - Routine
HC N/A 1.4
A4-2 LP Flare Compressor B Skid Vent - Emergency
HC N/A 58
A4-2 LP Flare Pig Receiver HC N/A NNF
For
insp
ectio
n pur
pose
s only
.
Conse
nt of
copy
right
owne
r req
uired
for a
ny ot
her u
se.
EPA Export 25-07-2013:18:45:26

IPPC Response
Page 30 of 78
IPPC - Item Ea-3 Clarify the nitrogen dioxides and carbon monoxide emissions levels for the compression engines given that the low NOX burners and “lean burn” engines are proposed
The vendor of the compression engines has advised that the engines are of lean-burn type. Guaranteed emissions performance is 500 mg/Nm3 NOx and 300 mg/Nm3 CO. This is in accordance with the relevant German standard, TA Luft.
For
insp
ectio
n pur
pose
s only
.
Conse
nt of
copy
right
owne
r req
uired
for a
ny ot
her u
se.
EPA Export 25-07-2013:18:45:26

IPPC Response
Page 31 of 78
IPPC - Item Eb-2 The COD concentrations of treated produced water is proposed as 400mg/l. Give details of the chemical species that cause this demand and explain how the treatment process reduced COD by only 100mg/l.
The main contributor to COD is expected to be methanol. Methanol is a PLONOR (poses little or no risk to the environment, ref OSPAR), and OCNF Category E substance with low toxicity (in the marine environment), high biodegradability and low bioaccumulation potential. Due to the predicted composition of the produced water, and the treatment target set for the sea outfall, the design objectives of the water treatment process are removal of insoluble organics, removal of heavy metals, and removal of soluble organics. Removal of organic material is the most significant contribution to COD reduction. Levels of removable COD in the design feed compositions are small relative to the overall COD of the feed. As a result treatment reduces COD by the 100mg/l as stated. The high COD demand of the discharge is not expected to have a significant impact due to the high dilution/dispersion factor at the outfall diffuser which is located in the open sea and at approx 70 metres water depth.
For
insp
ectio
n pur
pose
s only
.
Conse
nt of
copy
right
owne
r req
uired
for a
ny ot
her u
se.
EPA Export 25-07-2013:18:45:26

IPPC Response
Page 32 of 78
IPPC - Item Ee The emergency generator gives rise to high NOX levels - justify the selection of this type of generator having regard to BAT.
The Emergency Generator will be used infrequently: upon start-up and when main power supply fails. In addition it will to be tested weekly for period of approximately 1 hr. The emergency generator will also be used for up to two weeks a year for biennial maintenance. For emergency operation, it is industry norm to use a diesel engined driven generator. A latest generation of Diesel Engine with low emission level has been selected for use at the Terminal. The required duty and design basis is such that diesel fuel is the only suitable fuel source. Emission Compliance Test Results
NOX CO HC Particulates
Standard 0.5 TA Luft 2000 650 150 130
Max result 1930 586 134 60
The emission test results show that the emissions from the emergency generator are better than the TA Luft standard. Site NOx The NOx emissions from the emergency generator can be compared with the entire NOx of the site. The emergency generator will produce less than 1% of the total NOx emitted per year from the site. Since the level of NOx for the emergency generator is a small proportion of the total NOx emissions, any improvement by using an engine with lower NOx emissions will not produce a significant impact on total site NOx emissions. Therefore the emissions level of the emergency generator does not have a significant impact on the BAT assessment for the site.
For
insp
ectio
n pur
pose
s only
.
Conse
nt of
copy
right
owne
r req
uired
for a
ny ot
her u
se.
EPA Export 25-07-2013:18:45:27

IPPC Response
Page 33 of 78
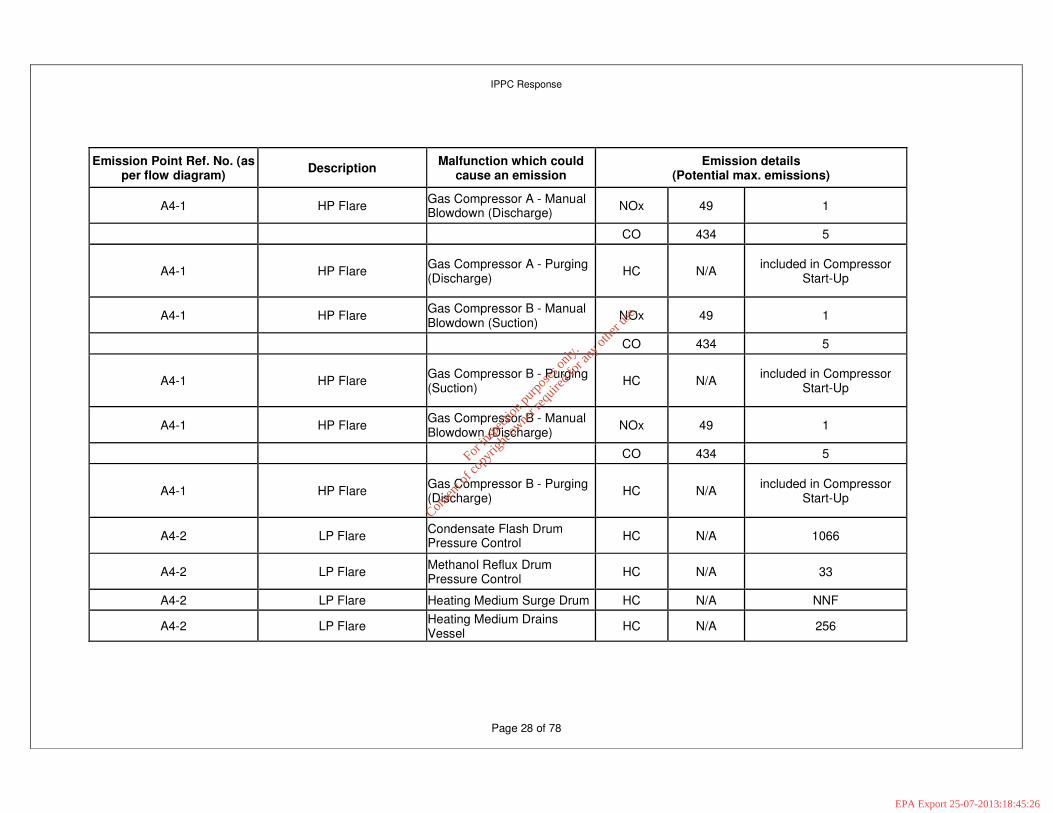
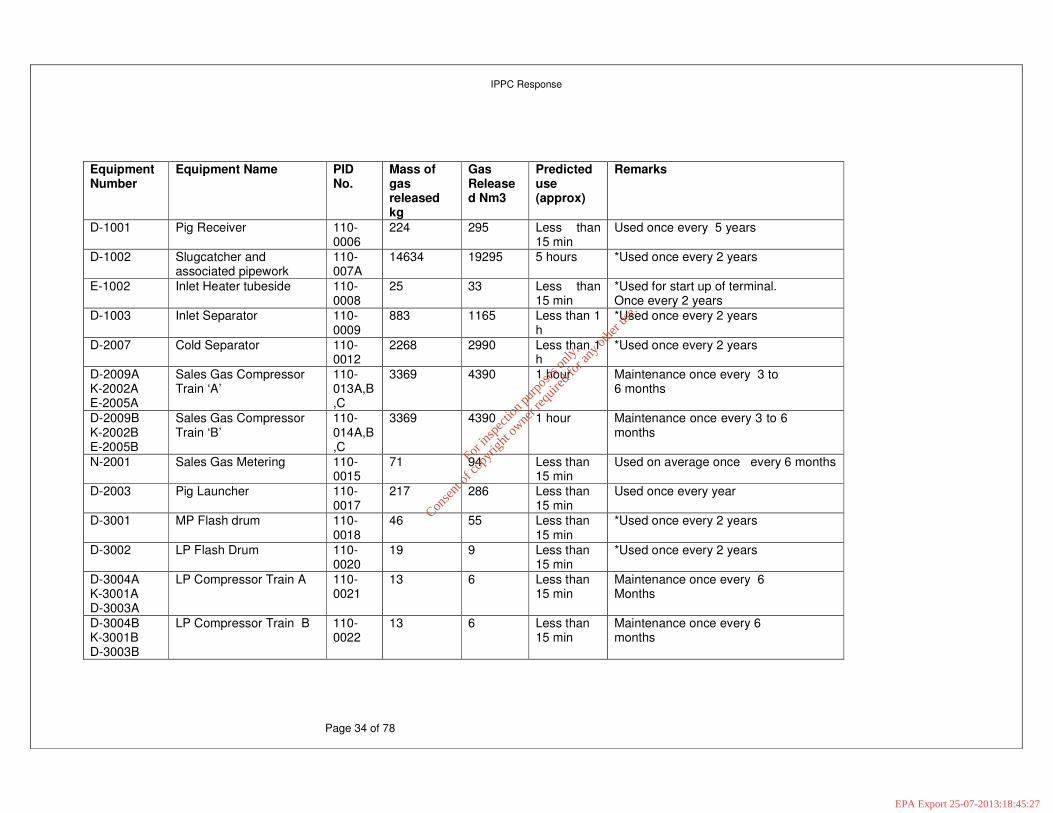
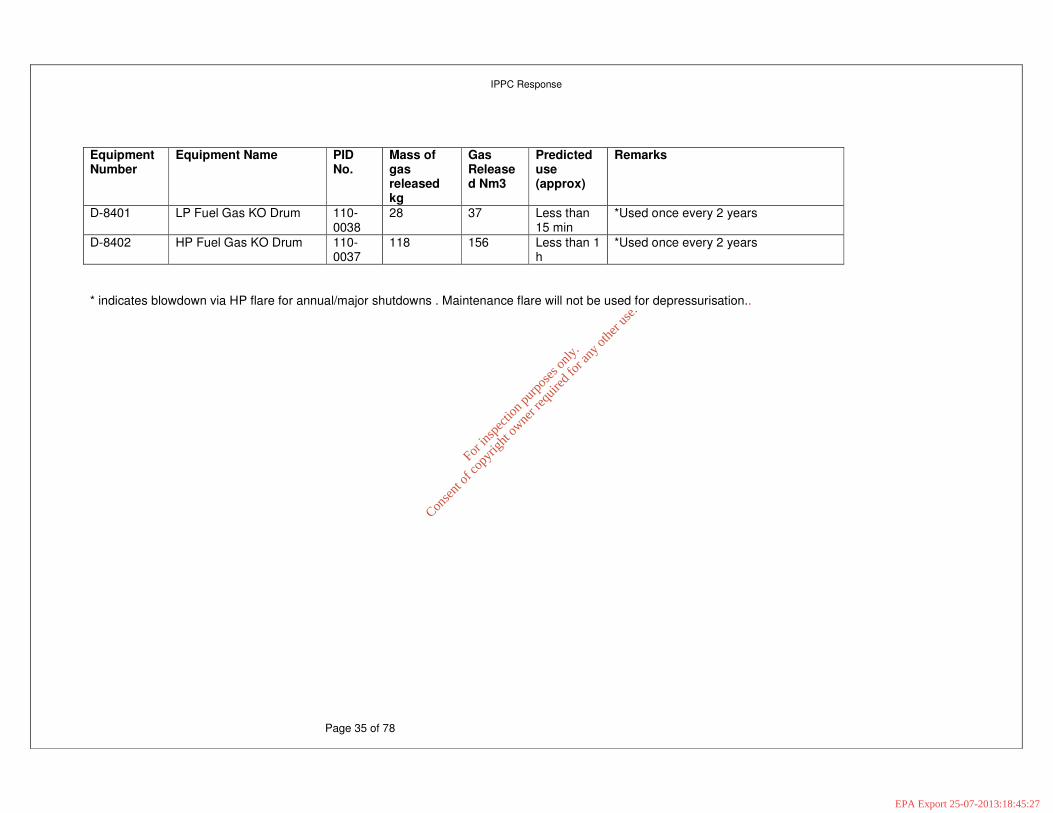
IPPC - Item Ef Clarify whether the maintenance flare will be utilised only during annual shutdown under normal operating conditions and what other emissions are likely to occur at the same time. What is the predicted use of the maintenance flare in any one maintenance run i.e. how may hours.
The maintenance flare will be used only to depressurise equipment during planned and unplanned maintenance. Unplanned events such as failure of a compression train would require the use of the maintenance flare. It is also planned to depressurise the metering streams for calibration of the Fiscal Quality meters. It is anticipated that this frequency will be once every 3 to 6 months during early years, reducing to once every 6 to 12 months thereafter. When the terminal is shutdown for planned annual maintenance there will be no emissions from other sources, except the emergency generator. After the initial depressurisation of a system to the maintenance flare, the system will remain lined up to the maintenance flare to act as a safe ventilation route for the duration of the maintenance activity. Various items of equipment can be depressurised to the Maintenance Flare – refer to table below which gives details the quantity of gas burnt for each item of equipment and the time required for depressurising. Note : it is not envisaged to use the maintenance flare for blowing down the plant. This is because blow-downs and comprehensive testing of the ESD systems will coincide with major shutdowns and be carried out via the plant automated blow down system to the HP flare.
For
insp
ectio
n pur
pose
s only
.
Conse
nt of
copy
right
owne
r req
uired
for a
ny ot
her u
se.
EPA Export 25-07-2013:18:45:27
IPPC Response
Page 34 of 78
Equipment Number
Equipment Name PID No.
Mass of gas released kg
Gas Released Nm3
Predicted use (approx)
Remarks
D-1001 Pig Receiver 110-0006
224 295 Less than 15 min
Used once every 5 years
D-1002 Slugcatcher and associated pipework
110-007A
14634 19295 5 hours *Used once every 2 years
E-1002 Inlet Heater tubeside 110-0008
25 33 Less than 15 min
*Used for start up of terminal. Once every 2 years
D-1003 Inlet Separator 110-0009
883 1165 Less than 1 h
*Used once every 2 years
D-2007 Cold Separator 110-0012
2268 2990 Less than 1 h
*Used once every 2 years
D-2009A K-2002A E-2005A
Sales Gas Compressor Train ‘A’
110-013A,B,C
3369 4390 1 hour Maintenance once every 3 to 6 months
D-2009B K-2002B E-2005B
Sales Gas Compressor Train ‘B’
110-014A,B,C
3369 4390 1 hour Maintenance once every 3 to 6 months
N-2001 Sales Gas Metering 110-0015
71 94 Less than 15 min
Used on average once every 6 months
D-2003 Pig Launcher 110-0017
217 286 Less than 15 min
Used once every year
D-3001 MP Flash drum 110-0018
46 55 Less than 15 min
*Used once every 2 years
D-3002 LP Flash Drum 110-0020
19 9 Less than 15 min
*Used once every 2 years
D-3004A K-3001A D-3003A
LP Compressor Train A 110-0021
13 6 Less than 15 min
Maintenance once every 6 Months
D-3004B K-3001B D-3003B
LP Compressor Train B 110-0022
13 6 Less than 15 min
Maintenance once every 6 months
For
insp
ectio
n pur
pose
s only
.
Conse
nt of
copy
right
owne
r req
uired
for a
ny ot
her u
se.
EPA Export 25-07-2013:18:45:27
IPPC Response
Page 35 of 78
Equipment Number
Equipment Name PID No.
Mass of gas released kg
Gas Released Nm3
Predicted use (approx)
Remarks
D-8401 LP Fuel Gas KO Drum 110-0038
28 37 Less than 15 min
*Used once every 2 years
D-8402 HP Fuel Gas KO Drum 110-0037
118 156 Less than 1 h
*Used once every 2 years
* indicates blowdown via HP flare for annual/major shutdowns . Maintenance flare will not be used for depressurisation..
For
insp
ectio
n pur
pose
s only
.
Conse
nt of
copy
right
owne
r req
uired
for a
ny ot
her u
se.
EPA Export 25-07-2013:18:45:27

IPPC Response
Page 36 of 78
IPPC - Item Eh-1 In relation to fugitive emissions, give details of the unloading and loading (filling) loses and cleaning loses. Give fugitive emissions as a percentage of total annual input of methane gas, condensate and methanol and provide the calculation.
Summary Annual production rates and estimates of emissions are based on peak gas production rate 350 MMscfd and corresponding condensate production and methanol use at the terminal. Gas and Condensate annual production and Methanol use at the terminal are predicted to be as follows (Refer Section 2, below) Gas production = 2,546,000 tonne/year Condensate production = 7,461 tonne/year (at 0.5 bbl/Mscf CGR) Methanol use = 3,120 tonne/year Hydrocarbon Gas Fugitives Fugitives (assume Methane) = 115 te/year Emission as a percentage of gas production = 0.0045% (Refer Section 4.1 below) Condensate Fugitives Condensate Fugitives = 2 te/year Emission as a percentage of production = 0.027 % (at 0.5 bbl/MMscf) (Refer Section 5.1 below) Methanol Fugitives Methanol Fugitives = 2.4 te/year Emission as a percentage of MeOH use = 0.075 % (Refer Section 5.2 below) Cleaning Tank cleaning is discussed in the response to Item Dj. Annual Production Data Basis : Wet Gas Production @ 350 MMSCFD for 358 days/yr.
Gas Mol.Wt = 17 CGR = 0.5bbl/mmscf Condensate density = 749 kg/m3
Annual Gas Production Gas Production = 350 MMSCFD x 358 days/yr x 17 lb/lbmol / (379.49 scf/lbmol x 2.2045 lb/kg) = 2546 x 10^6 kg/yr
For
insp
ectio
n pur
pose
s only
.
Conse
nt of
copy
right
owne
r req
uired
for a
ny ot
her u
se.
EPA Export 25-07-2013:18:45:27
IPPC Response
Page 37 of 78
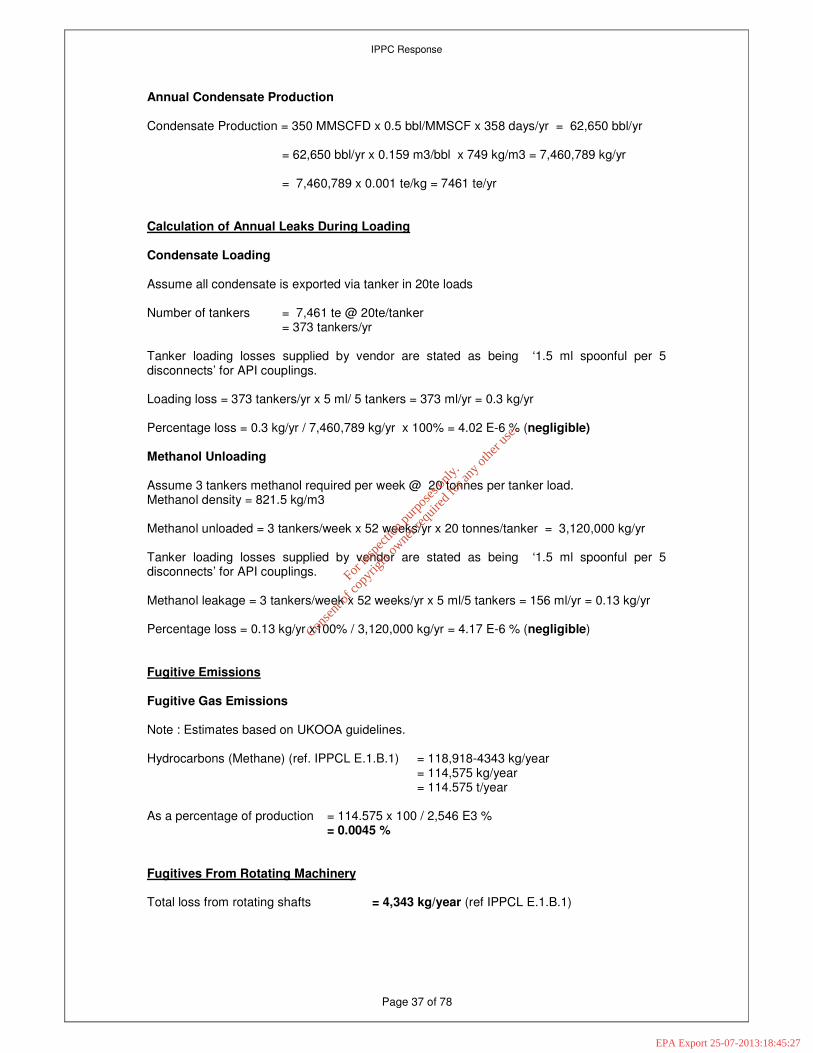
Annual Condensate Production Condensate Production = 350 MMSCFD x 0.5 bbl/MMSCF x 358 days/yr = 62,650 bbl/yr = 62,650 bbl/yr x 0.159 m3/bbl x 749 kg/m3 = 7,460,789 kg/yr = 7,460,789 x 0.001 te/kg = 7461 te/yr Calculation of Annual Leaks During Loading Condensate Loading Assume all condensate is exported via tanker in 20te loads Number of tankers = 7,461 te @ 20te/tanker
= 373 tankers/yr Tanker loading losses supplied by vendor are stated as being ‘1.5 ml spoonful per 5 disconnects’ for API couplings. Loading loss = 373 tankers/yr x 5 ml/ 5 tankers = 373 ml/yr = 0.3 kg/yr Percentage loss = 0.3 kg/yr / 7,460,789 kg/yr x 100% = 4.02 E-6 % (negligible) Methanol Unloading Assume 3 tankers methanol required per week @ 20 tonnes per tanker load. Methanol density = 821.5 kg/m3 Methanol unloaded = 3 tankers/week x 52 weeks/yr x 20 tonnes/tanker = 3,120,000 kg/yr Tanker loading losses supplied by vendor are stated as being ‘1.5 ml spoonful per 5 disconnects’ for API couplings. Methanol leakage = 3 tankers/week x 52 weeks/yr x 5 ml/5 tankers = 156 ml/yr = 0.13 kg/yr Percentage loss = 0.13 kg/yr x100% / 3,120,000 kg/yr = 4.17 E-6 % (negligible) Fugitive Emissions Fugitive Gas Emissions Note : Estimates based on UKOOA guidelines. Hydrocarbons (Methane) (ref. IPPCL E.1.B.1) = 118,918-4343 kg/year
= 114,575 kg/year = 114.575 t/year
As a percentage of production = 114.575 x 100 / 2,546 E3 % = 0.0045 % Fugitives From Rotating Machinery Total loss from rotating shafts = 4,343 kg/year (ref IPPCL E.1.B.1)
For
insp
ectio
n pur
pose
s only
.
Conse
nt of
copy
right
owne
r req
uired
for a
ny ot
her u
se.
EPA Export 25-07-2013:18:45:27

IPPC Response
Page 38 of 78
Condensate loss – Rotating Shafts Condensate loss from rotating shafts = 1,991 kg/year As a percentage of production = 1.991 x 100 / 7,460.8 % = 0.027 % Methanol loss – Rotating Shafts Methanol loss = 2,352 kg/year As a percentage of production use = 2.352 x 100 / 3,120 % = 0.075 %
For
insp
ectio
n pur
pose
s only
.
Conse
nt of
copy
right
owne
r req
uired
for a
ny ot
her u
se.
EPA Export 25-07-2013:18:45:27

IPPC Response
Page 39 of 78
IPPC - Item Eh-2 Justify the statement that fugitive emissions of VOC’s from the waste-water treatment plant are negligible.
There are two potential sources of VOCs in the waste water treatment plant, produced water (water arising form the Corrib reservoir) and surface water (oily water). Any hydrocarbons entering the surface water treatment system would originate from an atmospheric source, and therefore not be expected to contain significant levels of VOCs. Produced water feed to the Produced Water Treatment Plant originates from the aqueous methanol stream that enters the Gas Plant from the sub-sea pipeline. The process design promotes release of volatile hydrocarbons upstream of the produced water treatment plant during various stages of flashing and in the methanol still, which is the last stage before the water reaches the produced water treatment plant. The operating conditions of the methanol still cause any residual hydrocarbons to be recovered in the methanol still reflux drum, from where it is routed to the LP flare. The emissions of residual volatile hydrocarbons from the produced water treatment plant are therefore expected to be negligible.
For
insp
ectio
n pur
pose
s only
.
Conse
nt of
copy
right
owne
r req
uired
for a
ny ot
her u
se.
EPA Export 25-07-2013:18:45:27

IPPC Response
Page 40 of 78
IPPC - Item Ei In relation to treated produced water, complete Table E.2 (ii) for the following parameters: temperature, BOD, nitrate, sulphate, selenium, antimony, uranium, and thallium.
Table E.2 (ii) for treated produced water
Prior to Treatment
As Discharged
Efficiency
Max Hourly
Average
Max Daily
Average
Kg/day Kg/year Max Hourly
Average
Max Daily
Average
Kg/day1
Kg/year1
%
Parameter
mg/l mg/l mg/l mg/l
Feed Temperature
45’C
28’C
N/a
N/a
45’C
25’C
N/a
N/a
N/a
BOD
3
4353
435
3
63
21720
300
3
300
3
43
14980
31
Nitrate
4
N/a
N/a
N/a
N/a
N/a
N/a
N/a
N/a
N/a
Sulphate
5
<500
<500
72
<25000
<100
<100
<15
<5000
>80%
Selenium
0.1
0.1
0.01
5
<0.02
<0.02
<0.01
<1
>80%
Antimony
4
-
-
-
-
-
-
-
-
-
Uranium
1
0.002
0.002
<3mg
<550mg
0.0001
0.0001
<0.15mg
<0.15mg
>95%
Thallium
4
-
-
-
-
-
-
-
-
-
For
insp
ectio
n pur
pose
s only
.
Conse
nt of
copy
right
owne
r req
uired
for a
ny ot
her u
se.
EPA Export 25-07-2013:18:45:27

IPPC Response
Page 41 of 78
Note 1 - daily mass emission rates (kg/yr) calculated on the basis of design capacity of
produced water treatment system of 6 m3 /hr. Annual mass emission rates (kg/yr) calculated
on the basis of maximum anticipated produced water flow rate of 3.3 m3/hr (year 2) with 95%
availability.
Note 2 – The Waste Water Treatment Plant designer would expect, that if present antimony, uranium and thallium would be reduced by 95 to 99% Note 3 – The BOD is estimated from the most onerous produced water feed and approximates to the COD. Note 4 – Nitrate, Antimony and Thallium were not detected in formation water analysis Note 5 – Assume 200mg/l sulphate addition as part of treatment process. Assume sulphate recovery >80%. Note : Seawater is typically 2800mg/l.
For
insp
ectio
n pur
pose
s only
.
Conse
nt of
copy
right
owne
r req
uired
for a
ny ot
her u
se.
EPA Export 25-07-2013:18:45:27

IPPC Response
Page 42 of 78
IPPC - Item Ek Distinguish the location of sampling points SW1a and SW1b by grid references and provide a detailed site plan of the produced water and surface water treatment plants. 1. Grid references can be provided 2. Detailed plans will be prepared of the plants
Response (i) Grid References
The plant grid IOS references for the sampling points are: N333057, E86457 N333043, E86454
(ii) Detailed Plot Plans
Please find drawings attached.
For
insp
ectio
n pur
pose
s only
.
Conse
nt of
copy
right
owne
r req
uired
for a
ny ot
her u
se.
EPA Export 25-07-2013:18:45:27

IPPC Response
Page 43 of 78
IPPC - Item Fa-1 Justify the lack of an internal floating roof or an abatement system on the fixed roof tanks for product methanol and off-specification condensate storage.
Please note that the IPPC Licence Application page 57 of 272, Section E.1.B.2. contains a mistake. The second paragraph below Table 4 should read as follows:
Fugitive emissions from storage tanks and product loading have been estimated based on the predicted amount of condensate and wet methanol to be produced during the Corrib field life. The bulk storage area is comprised of the following:
• 2 No. Internal floating roof nitrogen blanketed stabilised condensate tanks.
• 1 No. Fixed roof nitrogen blanketed off-specification condensate tank.
• 3 No. Internal floating roof nitrogen blanketed raw methanol tanks.
• 2 No Internal floating roof nitrogen blanketed product methanol tanks (these have been assumed to produce zero hydrocarbon emissions).
The off-spec condensate tank is designed to store stabilised condensate containing water. It is not considered that a floating roof would be required, however due to the proposed change in the storage handling and use of condensate on the site, a study has been initiated to determine the most appropriate use of this tank and the relative merits and disadvantages of available emission reduction measures. This will include consideration of carbon adsorption and the use of a floating roof with appropriate seals. The results of this study will be forwarded to the EPA as soon as it is available, anticipated to be by the end of May 2006.
For
insp
ectio
n pur
pose
s only
.
Conse
nt of
copy
right
owne
r req
uired
for a
ny ot
her u
se.
EPA Export 25-07-2013:18:45:27

IPPC Response
Page 44 of 78
IPPC - Item Fa-2 Give details of the effects on performance and efficiencies in operating a produced water treatment plant that is subject to varying flows.
Within the design operating range, performance of the Produced Water Treatment Plant is insensitive to flow variations. Feed rate is kept within the Produced Water Treatment Plant operating envelope by use of buffering capacity upstream of the Methanol Regeneration system, and between the Methanol Still and the Produced Water Treatment Plant.
For
insp
ectio
n pur
pose
s only
.
Conse
nt of
copy
right
owne
r req
uired
for a
ny ot
her u
se.
EPA Export 25-07-2013:18:45:27

IPPC Response
Page 45 of 78
IPPC - Item Fb Describe the mode of operation of the produced water treatment system i.e. batch or continuous.
The produced water treatment system is designed as a continuously operated plant. It is
designed to treat up to 6m3/h of produced water. The produced water treatment system can
also be operated as a batch process if required.
Storage volume in tanks upstream of the methanol regeneration system, and the effluent feed sump provide a buffering capability which is used to maintain flow through the produced water treatment plant within its design envelope.
For
insp
ectio
n pur
pose
s only
.
Conse
nt of
copy
right
owne
r req
uired
for a
ny ot
her u
se.
EPA Export 25-07-2013:18:45:27
IPPC Response
Page 46 of 78
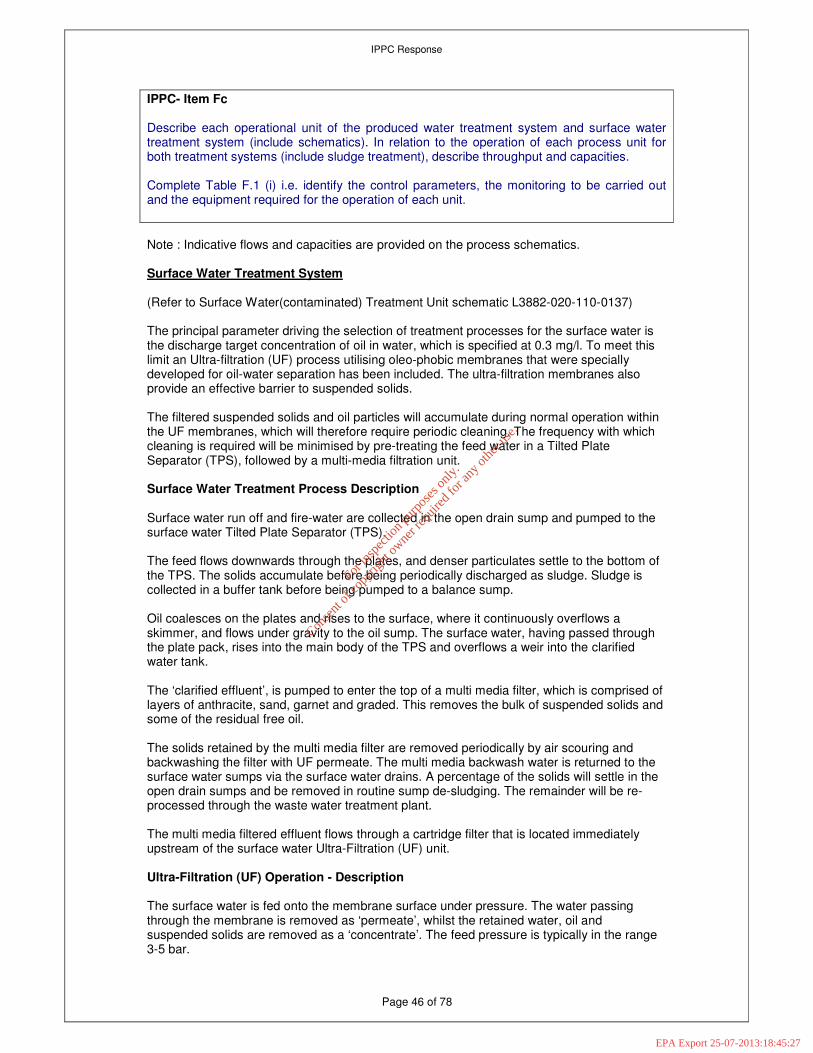
IPPC- Item Fc Describe each operational unit of the produced water treatment system and surface water treatment system (include schematics). In relation to the operation of each process unit for both treatment systems (include sludge treatment), describe throughput and capacities. Complete Table F.1 (i) i.e. identify the control parameters, the monitoring to be carried out and the equipment required for the operation of each unit.
Note : Indicative flows and capacities are provided on the process schematics. Surface Water Treatment System (Refer to Surface Water(contaminated) Treatment Unit schematic L3882-020-110-0137) The principal parameter driving the selection of treatment processes for the surface water is the discharge target concentration of oil in water, which is specified at 0.3 mg/l. To meet this limit an Ultra-filtration (UF) process utilising oleo-phobic membranes that were specially developed for oil-water separation has been included. The ultra-filtration membranes also provide an effective barrier to suspended solids. The filtered suspended solids and oil particles will accumulate during normal operation within the UF membranes, which will therefore require periodic cleaning. The frequency with which cleaning is required will be minimised by pre-treating the feed water in a Tilted Plate Separator (TPS), followed by a multi-media filtration unit. Surface Water Treatment Process Description Surface water run off and fire-water are collected in the open drain sump and pumped to the surface water Tilted Plate Separator (TPS). The feed flows downwards through the plates, and denser particulates settle to the bottom of the TPS. The solids accumulate before being periodically discharged as sludge. Sludge is collected in a buffer tank before being pumped to a balance sump. Oil coalesces on the plates and rises to the surface, where it continuously overflows a skimmer, and flows under gravity to the oil sump. The surface water, having passed through the plate pack, rises into the main body of the TPS and overflows a weir into the clarified water tank. The ‘clarified effluent’, is pumped to enter the top of a multi media filter, which is comprised of layers of anthracite, sand, garnet and graded. This removes the bulk of suspended solids and some of the residual free oil. The solids retained by the multi media filter are removed periodically by air scouring and backwashing the filter with UF permeate. The multi media backwash water is returned to the surface water sumps via the surface water drains. A percentage of the solids will settle in the open drain sumps and be removed in routine sump de-sludging. The remainder will be re-processed through the waste water treatment plant. The multi media filtered effluent flows through a cartridge filter that is located immediately upstream of the surface water Ultra-Filtration (UF) unit. Ultra-Filtration (UF) Operation - Description The surface water is fed onto the membrane surface under pressure. The water passing through the membrane is removed as ‘permeate’, whilst the retained water, oil and suspended solids are removed as a ‘concentrate’. The feed pressure is typically in the range 3-5 bar.
For
insp
ectio
n pur
pose
s only
.
Conse
nt of
copy
right
owne
r req
uired
for a
ny ot
her u
se.
EPA Export 25-07-2013:18:45:27

IPPC Response
Page 47 of 78
The UF comprises two stages of four pressure vessels in series, each stage with its own recirculation pump. The recirculation pumps create a high shear stress at the membrane surface to help limit surface fouling and provide the cross-membrane pressure drop . The first stage recirculation pump draws both UF feed water and ‘Stage 1 re-circulated concentrate’ from the common header and pumps it through the first stage pressure vessels in parallel. Each pressure vessel contains multiple membrane elements. Retained water, oil and solids (concentrate) exits from the tail end of the pressure vessel. The concentrate from the four pressure vessels combines and returns to the common header. Permeate from the membrane elements is adjusted via rate set valves to distribute the permeate flow between the membranes and to determine the overall split between permeate recycle and forward flow. The second stage recirculation pump draws a combination of ‘Stage 1’ re-circulated concentrate and ‘Stage 2’ re-circulated concentrate from the common header, and processes it in a similar fashion to Stage 1. From the UF, a bleed of concentrate containing suspended solids and coalesced oil is returned to the inlet of the surface water Tilted Plate Separator (TPS) The UF permeate from both stages is combined and fed forward to the treated water sumps. The UF membranes are subject to fouling from the oil and suspended solids in the produced water. The UF plant is designed therefore to be taken off line periodically for a ‘Clean In Place’ (CIP), to remove accumulated foulants from the membrane. Produced Water Treatment System (Refer to Produced Water Treatment Unit schematic L3882-020-110-0136) Produced Water Treatment Process Philosophy The produced water contains trace quantities of heavy metals and organic compounds, which must be reduced to very low levels before discharge. The produced water treatment plant uses a sequential 3 step process to remove free liquid hydrocarbons, to remove metal ions, and to remove soluble hydrocarbons. Load on the systems for removal of metal ions and soluble hydrocarbon is considerably reduced by the use of nano-filtration (NF). The NF membranes provide gross removal of heavy metals and organic molecules prior to the downstream processes. After the NF pre-treatment stage absorption processes provide a permeate “polishing” stage to ensure the final water quality meets design intent. The nano-filtration membranes are susceptible to fouling from suspended solids, oil and scaling by precipitation. Acid dosing and anti-scalant addition have been included to limit scaling. Ultra-filtration membranes are provided upstream of NF to remove free oil and reduce suspended solids to below limits of detection. These ‘pre-treatments’ allow the nano-filtration plant to operate economically and without excessive fouling and cleaning, which would be detrimental to the membrane life. As with the surface water plant, a Tilted Plate Separator (TPS) is used up-stream of the ultra-filtration plant to remove the bulk of the suspended solids and free oil. Produced Water Treatment: Process Description The Produced Water Plant is designed for a net capacity of approx 6 m
3/h. Produced water
and filtrate from the filter press is collected in the Effluent Feed Sump and pumped to the produced water TPS.
For
insp
ectio
n pur
pose
s only
.
Conse
nt of
copy
right
owne
r req
uired
for a
ny ot
her u
se.
EPA Export 25-07-2013:18:45:27
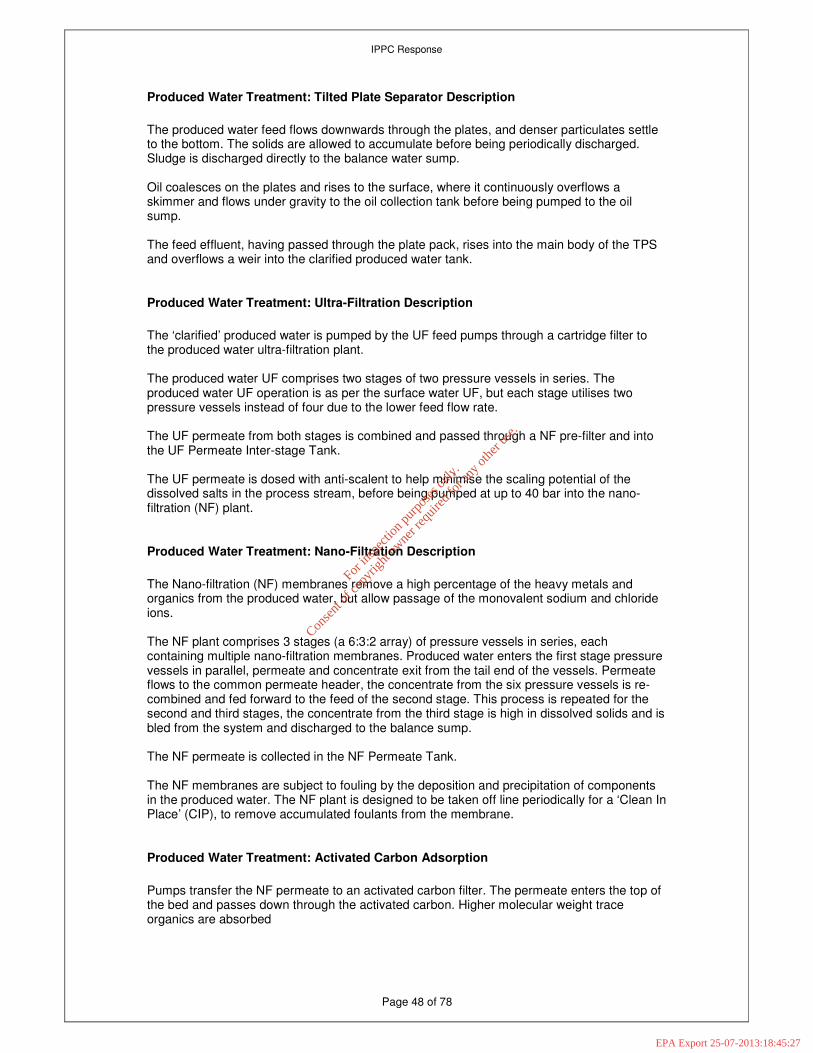
IPPC Response
Page 48 of 78
Produced Water Treatment: Tilted Plate Separator Description
The produced water feed flows downwards through the plates, and denser particulates settle to the bottom. The solids are allowed to accumulate before being periodically discharged. Sludge is discharged directly to the balance water sump. Oil coalesces on the plates and rises to the surface, where it continuously overflows a skimmer and flows under gravity to the oil collection tank before being pumped to the oil sump. The feed effluent, having passed through the plate pack, rises into the main body of the TPS and overflows a weir into the clarified produced water tank.
Produced Water Treatment: Ultra-Filtration Description
The ‘clarified’ produced water is pumped by the UF feed pumps through a cartridge filter to the produced water ultra-filtration plant. The produced water UF comprises two stages of two pressure vessels in series. The produced water UF operation is as per the surface water UF, but each stage utilises two pressure vessels instead of four due to the lower feed flow rate. The UF permeate from both stages is combined and passed through a NF pre-filter and into the UF Permeate Inter-stage Tank. The UF permeate is dosed with anti-scalent to help minimise the scaling potential of the dissolved salts in the process stream, before being pumped at up to 40 bar into the nano-filtration (NF) plant.
Produced Water Treatment: Nano-Filtration Description
The Nano-filtration (NF) membranes remove a high percentage of the heavy metals and organics from the produced water, but allow passage of the monovalent sodium and chloride ions. The NF plant comprises 3 stages (a 6:3:2 array) of pressure vessels in series, each containing multiple nano-filtration membranes. Produced water enters the first stage pressure vessels in parallel, permeate and concentrate exit from the tail end of the vessels. Permeate flows to the common permeate header, the concentrate from the six pressure vessels is re-combined and fed forward to the feed of the second stage. This process is repeated for the second and third stages, the concentrate from the third stage is high in dissolved solids and is bled from the system and discharged to the balance sump. The NF permeate is collected in the NF Permeate Tank. The NF membranes are subject to fouling by the deposition and precipitation of components in the produced water. The NF plant is designed to be taken off line periodically for a ‘Clean In Place’ (CIP), to remove accumulated foulants from the membrane.
Produced Water Treatment: Activated Carbon Adsorption
Pumps transfer the NF permeate to an activated carbon filter. The permeate enters the top of the bed and passes down through the activated carbon. Higher molecular weight trace organics are absorbed
For
insp
ectio
n pur
pose
s only
.
Conse
nt of
copy
right
owne
r req
uired
for a
ny ot
her u
se.
EPA Export 25-07-2013:18:45:27

IPPC Response
Page 49 of 78
The activated carbon bed is backwashed at periodic intervals to ensure that it does not become compacted, however this does not serve as a regenerative process, and the carbon must be replaced (either disposed of or sent for regeneration) when saturated. The carbon is backwashed with service water from the service water storage tank using the carbon filter backwash/ ion exchange regeneration pumps. The activated carbon treated produced water feeds directly into the top of the ion exchange unit and passes through the resin bed. The resin absorbs heavy metals from the produced water and the treated water exits from the bottom of the column.
Produced Water Treatment: Selective Ion Exchange
The ion exchange absorption capacity decreases as the heavy metals are absorbed by the resin, and after a set volume of water has passed through the resin, the ion exchange is taken off line for regeneration. Service water is pumped upwards through the resin bed to lift the bed and remove any fines, followed by regeneration with hydrochloric acid solution and conditioning with sodium hydroxide. The heavy metal laden, regeneration waste water flows to the balance sump. The ion exchange treated water is pH corrected with sodium hydroxide before progressing to the treated produced water sump. Membrane Clean In Place (CIP) The membranes are flushed, cleaned and rinsed using the CIP package. Initially, the cleaning pump is used to pump hot water (40-50°C) from the hot water tank, via the CIP cleaning tank, through the selected membrane plant, and out of the respective permeate and concentrate drain lines to the balance sump. This purges the system of its contents and begins to heat the membranes and pipe-work. Hot water (40-50°C) or a solution of cleaning chemicals in hot water is then made up in the CIP cleaning tank, and the cleaning pump is used to recycle this cleaning solution through the selected membrane plant, and back into the CIP cleaning tank. In the case of the UF plants, the recirculation pumps are run simultaneously. After a set time, the cleaning solution is discharged to waste for off-site disposal, and the plant is rinsed using service water, through the CIP cleaning tank and the cleaning pump. Sludge Treatment Plant (Refer to Waste Water Treatment Sludge Handling Unit Schematic L3882-020-110-0138) Apart from the multi media backwash water, all the waste streams from both the produced water and surface water treatment plants enter the balance water sump. The treatment of the multi media backwash water is described in the Surface Water Treatment Process Description. Waste is pumped from the balance water sump to a three stage flocculation tank by the flocculation tank feed pumps. When not feeding forward, these pumps re-circulate the contents of the balance water sump to help maintain solids in suspension. The first stage of the flocculation tank is dosed with lime slurry, to elevate the pH and precipitate heavy metals. TMT15 is dosed to assist the precipitation of mercury. Ferric chloride is then dosed to aid coagulation of the finer colloids and precipitants, followed by polyelectrolyte to help bind the agglomerates into flocs. The flocculation tank suspension is pumped to a filter. The suspended solids are retained in the filter press, whilst the liquid passes through the cloths and into the filtrate storage tank. The filtrate is pumped back to the effluent feed sump.
For
insp
ectio
n pur
pose
s only
.
Conse
nt of
copy
right
owne
r req
uired
for a
ny ot
her u
se.
EPA Export 25-07-2013:18:45:27

IPPC Response
Page 50 of 78
The suspended solids are compacted between the filter plates as the feed pressure increases, and the feed flow subsequently decreases. Once full, the press plates are opened and the cake is disposed of off-site. Performance Controls As with any liquid processing system residence time in the Produced Water and Surface Water Treatment Facilities is limited. Treatment is progressive through each of the treatment steps, with each unit operation making a contribution to the objective of meeting EQS discharge limits. Some treatment units improve several parameters. Discharge limits are very stringent. It is likely that intermediate samples taken from within the treatment process will not be representative over time, and analysis against EQS standards will be unfeasible due to interference from competing species. In addition, certain performance parameters are not measurable online and require laboratory analysis, sometimes off-site at suitably equipped and qualified 3
rd party facility.
Consequently, the operational strategy emphasises continual measurement of parameters which are considered a reliable indicator of changes in performance relative to the treatment objectives. Conductivity and pH have been selected as the most reliable online indicators of treatment quality. In addition, laboratory measurements of COD will be used as an indicator of efficiency of hydrocarbon removal and will provide confidence between periodic measurements of suspended solids, dissolved solids and oil in water. Off-line test frequencies will be set to give confidence that sample results are representative of time averaged performance and will demonstrate that compliance criteria are satisfied. Additional samples will be triggered by online deviations in pH or conductivity or deviations in COD. Water Treatment Performance Objectives Tilted Plate Separator: Removal of free oil and suspended solids. Flow regulated at inlet to keep water treatment facilities throughput within design operating envelope. Automated pump out of oil and solids Filters: Removal of filterable solids to protect membranes Fouling indicated by rising pressure drop. Operator surveillance to trigger filter change when pressure drop threshold is reached. Ultra/Nano-Filtration: Oil, Solid, Heavy Metals and Hydrocarbon Removal Principal controls of performance include automatic pH control and operator surveillance to trigger CIP when cross membrane pressure drop increases. The unit will be set up during commissioning and will be periodically checked as part of the preventative maintenance regime. Granular Activated Carbon: Polishing step for organic molecules Sample points will be engineered to ensure the onset of bed saturation is detected with sufficient warning to complete bed replacement prior to breakthrough at the outlet. Selective Ion Exchange: Removal of heavy metal ions Cycle time is influenced by flow and ion concentrations in the feed. The interval between regeneration will be set during commissioning and will be adjusted based on periodic
For
insp
ectio
n pur
pose
s only
.
Conse
nt of
copy
right
owne
r req
uired
for a
ny ot
her u
se.
EPA Export 25-07-2013:18:45:27

IPPC Response
Page 51 of 78
laboratory samples as the ion exchange resin ages. Resin will be replaced on a time based strategy with the initial change out frequency determined during commissioning in conjunction with the vendor. Precipitation, Flocculation & Sludge Treatment: Contaminant removal as filter cake Precipitation and Flocculation will be set up during commissioning. Surveillance of chemical dose rates (incl. Lime) will be a fundamental part of operational surveillance. Chemical dose will be optimised through periodic laboratory jar tests. The sludge process will be set up to maximise cake dryness. Periodic surveillance will be used to maintain system performance.
For
insp
ectio
n pur
pose
s only
.
Conse
nt of
copy
right
owne
r req
uired
for a
ny ot
her u
se.
EPA Export 25-07-2013:18:45:27

IPPC Response
Page 52 of 78
IPPC - Item Fd Describe the proposal for methanol monitoring to be undertaken on the effluent feed sump.
Proposal for Methanol Monitoring
Feed streams to and from the Effluent Feed Sump that potentially can contain methanol are sampled and analysed for methanol. These sample points are located as follows
• Methanol Still (outlet) downstream of feed/bottoms exchanger
• Effluent Feed Sump Pump discharge
Samples will be taken each day from the Methanol Still outlet and will support trending of
performance over the medium to long term. This frequency is appropriate for detection and management of slow moving events caused by changes in reservoir fluids.
The principal and most reliable parameters for minimisation of Methanol in produced water
are the Methanol Still pressure/ temperature. The Corrib design pays close attention to the
control of the Methanol still bottoms conditions to minimise methanol losses to the produced water treatment plant feed.
It has been identified that there is no reliable on-line measurement device for direct
measurement of Methanol in Corrib produced water. Instead, the presence of Methanol is
inferred from an on-line Total Organic Carbon (TOC) analyser on the treated outlet from
the produced water treatment plant. “Buffer” capacity is provided in the produced water
treatment process and its associated sumps to allow sufficient time for response to, and containment of, methanol excursions.
Detail procedures for produced water surveillance, management and control will be
developed during detail design and will be consistent with the consented compliance regime.
For
insp
ectio
n pur
pose
s only
.
Conse
nt of
copy
right
owne
r req
uired
for a
ny ot
her u
se.
EPA Export 25-07-2013:18:45:27

IPPC Response
Page 53 of 78
IPPC - Item F.f Outline the discharge regime from the treated water sumps – batch or continuous.
The treated water consists of treated produced water and treated surface water. Although the produced water rate is expected to be reasonably constant, the surface water rate will not be continuous or constant – depending on the rainfall, service water used etc. The produced water treatment system is designed for 6 m
3/h and the surface water treatment system is
designed for 30m3/h. The treated water discharge pumps are rated for 36m
3/h (each), one
duty and one standby. Attached sketch indicates the arrangement of the Treated Water Sump and Pumps The discharge from the Treated Water Sump is expected to be continuous but at varying flowrates depending on the amount of produced water and surface water being treated. The discharge from the pumps is routed via the outfall pipe to sea.The discharge flowrate will be set from the control room and this will control the speed of the duty sump pump. The flow set point will then be trimmed by the sump level controller. If the level in the sump reaches a low level the duty pump will stop and start again when the level in the sump rises. During normal automatic operation only one sump pump (rated at 36m
3/h) will be operating,
however both pumps (total 72 m3/h) can be used during manual operation if required.
For
insp
ectio
n pur
pose
s only
.
Conse
nt of
copy
right
owne
r req
uired
for a
ny ot
her u
se.
EPA Export 25-07-2013:18:45:27

IPPC Response
Page 54 of 78
IPPC - Item Fg Justify the mixing of organic and inorganic wastes in the sludge treatment system in relation to final disposal/recovery routes.
The operation of both surface water and produced water treatment plants generates a sludge which is comprised of both organic and inorganic components. There is therefore no mixing of organic and inorganic wastes in the sludge treatment system. This sludge from the surface water and produced water treatment plants is routed via the balanced water sump to the reaction/flocculation tank and the filter press, where it is dewatered and formed into filter cake, which therefore has organic and inorganic components.
For
insp
ectio
n pur
pose
s only
.
Conse
nt of
copy
right
owne
r req
uired
for a
ny ot
her u
se.
EPA Export 25-07-2013:18:45:28

IPPC Response
Page 55 of 78
IPPC - Item Fh At what point in the surface water treatment system will the quality of treated water be measured and re-circulated? Describe the management of this recirculation.
The quality of treated surface water is inferred from online measurements of pH, conductivity
on the outlet of the surface water treatment ultra-filtration skid (SW1b). In the event that a
significant change in water quality is observed, the treated water outfall can be isolated and the combined treated produced / surface water stream recycled to raw methanol storage.
Detail procedures for surface water surveillance, management and control will be developed during detail design and will be consistent with the consented compliance regime.
For
insp
ectio
n pur
pose
s only
.
Conse
nt of
copy
right
owne
r req
uired
for a
ny ot
her u
se.
EPA Export 25-07-2013:18:45:28

IPPC Response
Page 56 of 78
IPPC - Item Ga Consider an alternative energy system; to provide waste heat recovery on the gas turbine(s) and reduce the fuel use in the Heating Medium Heater. Report on selected option including justification.
An opportunity has been identified to improve overall efficiency in the use of energy in the
Bellanaboy Terminal, arising from the Shell decision to export the hydrocarbon condensate
that is produced in association with the gas from the Corrib reservoir, rather than using it as a
fuel in the Heating Medium Heater at the Terminal. The removal of condensate as a fuel
source for raising heat, and the concomitant potential requirement to use additional fuel gas
to meet the heat demand, has resulted in a complete review of the energy usage in the
Terminal.
The Terminal’s process heat energy demand and the potential sources for heat recovery have
therefore been re-examined to identify the most energy efficient solution in the absence of
condensate fuelling of the Heating Medium Heater. This process has concluded that waste
heat recovery from the exhaust of the two gas turbines, which are used to compress the
Corrib gas for export, could supply approximately 5.5MWth to the Terminal processes. This
would be sufficient to satisfy the heat demand for normal operating conditions.
Any alternative energy solution to that described in the IPPC Licence Application has to take
into account that safe design and operation of the facility is the first priority. The strategic
contribution that Corrib gas is predicted to make to Ireland’s security of supply also requires
that plant reliability is a particularly important consideration when reviewing the design of the
Terminal energy systems.
The assessment process has therefore taken into account an extreme combination of
operating conditions, which would arise when the lowest expected ambient air temperatures
occur. Under these circumstances an additional heat source would be required to supplement
that provided from the WHR units. A range of fuel gas fired alternatives is being considered
for this duty.
It is currently estimated that the installation of the WHR facilities would save the equivalent of
burning approximately 0.65MMscf (million standard cubic feet) per day of fuel gas in the
heating medium heater, and would reduce the CO2 emissions from the site by approximately
10 000 tonnes per year.
The engineering and operational implications of installing and operating the Terminal with
waste heat recovery on the gas turbine exhausts is therefore being taken forward for more
detailed study, with a view to operating the plant with waste heat recovery from start-up.
For
insp
ectio
n pur
pose
s only
.
Conse
nt of
copy
right
owne
r req
uired
for a
ny ot
her u
se.
EPA Export 25-07-2013:18:45:28

IPPC Response
Page 57 of 78
IPPC - Item Ha Describe the proposed routes for the recovery/disposal of mercury contaminated waste.
Removal beds will be provided for the removal of mercury from gas and condensate. The removal beds provide for removal of mercury by an absorbent, where the mercury reacts with the metal sulphide to form a stable amalgam which is held within the matrix of the absorbent. There will no free liquid mercury on the material. It is proposed that Johnson Matthey will supply the Puraspec material for mercury removal from gas and condensate. Material will be supplied in drums. The service provided by the supplier includes the safe removal of mercury containing spent material during a shutdown period. This activity is carried out in a controlled manner and in accordance with established procedures used worldwide by the vendor. The service includes drumming the material immediately after discharge and sampling and analysis of drummed material so that the correct disposal route can be chosen. It is currently proposed that the material is exported for reprocessing. Material will be transported from site by road truck once the Trans Frontiers Shipment licence is in place. Johnson Matthey currently export spent material to Switzerland where the mercury is stripped from the material. The mercury is used in the manufacture of thermometers. The residue is sent to Germany for final reprocessing.
For
insp
ectio
n pur
pose
s only
.
Conse
nt of
copy
right
owne
r req
uired
for a
ny ot
her u
se.
EPA Export 25-07-2013:18:45:28

IPPC Response
Page 58 of 78
IPPC - Item Ia-1 Give the impact of mercury emissions, if any, from the maintenance flare.
In normal operations, the trace quantities of mercury expected to be present in the Corrib reservoir fluids will be stripped out by mercury removal beds. Depressurisation of the plant upstream of the beds would involve the release of gas that has not passed through these beds. This gas would be routed to the maintenance flare. It is planned that releases of gas from upstream of the mercury removal beds will only occur during testing of the plant emergency shutdown system (ESD), and during change out of the mercury filter beds. He only equipment upstream of the mercury beds are the slugcatcher and the inlet heater. The ESD tests are currently planned for the commissioning of the plant and subsequent infrequent testing. It is estimated the mercury filter beds will require change out once in 3 years at the design throughput of the plant. Independent assessment of these releases has been carried out on behalf of Shell by AEA Technology. The atmospheric dispersion and potential deposition of the mercury fraction in the maintenance flare combustion gases have been modelled. The maximum annual mercury deposition and mercury concentration resulting from the operation of the maintenance flare under these circumstances has been conservatively estimated using a dispersion model, ADMS3.3, taking the highest values during the maximum feasible period of operation of the flare (three hours) over a 5-year period of meteorology. The maximum concentrations arising from the flare operation are 0.185 ng m
-3 for the three
hours of possible flare operation. This equates to an annual average air concentration of 0.00006 ng m
-3. Measurements made for the Environmental Protection Agency at Mace
Head, 100km to the south, show that air masses that have passed over the Atlantic to the west coast of Ireland have a mercury concentration of around 1.59 ng m
-3 Hence the
contribution from the flare will be below 13% of the mercury concentration in air while the flare is operating and insignificant as an annual average (0.004%). The World Health Organisation guideline for mercury exposure from air is an annual average concentration of 1 µg m
-3 (1 000
ng m-3
). It is extremely unlikely that the annual average mercury concentration in air will approach the WHO guideline value, and it is therefore unlikely that the concentration of mercury resulting from the operation of the maintenance flare under the modelled scenario will give rise to health effects. The maximum annual modelled deposition of mercury resulting from the operation of the flare was 0.0012 g ha
-1 a
-1 at the centre of an area of 1.6 ha. Measurements made by the
Environmental Protection Agency at Valentia Observatory have not detected mercury in deposition. The detection limit of the monitoring was around 1 g ha
-1 a
-1. The deposition rates
modelled here are therefore lower than measurements made in Ireland. Measurements at coastal sites elsewhere in Europe have shown deposition rates between 0.007 and 0.47 g ha
-
1 a
-1. The extreme upper estimate of deposition modelled here for Bellanaboy Bridge is only
17 % of the lower value. The modelled deposition has been compared with four critical loads intended to be indicators of the potential for adverse effects on human health and the environment resulting from mercury deposition to terrestrial and aquatic ecosystems. The most stringent of these critical loads relates to the protection of human health by limiting the mercury concentration in freshwater fish for human consumption. This value is 0.0022 g ha
-1 a
-1 (grammes per hectare
per year) over the entire catchment area of the smallest local stream in which trout are present. The deposition rate, when averaged over the nearest portion of the most impacted stream catchment, is 0.00017 g ha
-1 a
-1. This is 7.8% of the lowest critical load. As the
deposition modelling has assumed that the mercury is emitted at the highest credible emission rate and the form of the mercury is entirely which has the highest deposition rate, it
For
insp
ectio
n pur
pose
s only
.
Conse
nt of
copy
right
owne
r req
uired
for a
ny ot
her u
se.
EPA Export 25-07-2013:18:45:28

IPPC Response
Page 59 of 78
is concluded that the mercury emissions from the use of the maintenance flare for this modelled scenario is very unlikely to lead to significantly elevated mercury concentrations in freshwater fish.
For
insp
ectio
n pur
pose
s only
.
Conse
nt of
copy
right
owne
r req
uired
for a
ny ot
her u
se.
EPA Export 25-07-2013:18:45:28

IPPC Response
Page 60 of 78
IPPC - Item Ia-2 Give details of the assessment of the impacts of the fugitive and minor VOC emissions in particular cold venting emissions through the HP flare.
Sources and predicted quantities of fugitive emissions from the terminal have been provided in the licence application Section E.1.B.1. It is assumed that the fugitive emissions comprise of process gas which is mainly methane. The emissions of fugitive releases are not predicted to occur at concentrations that will impact on human health, ref Bellanaboy Bridge Terminal Environmental Impact Statement Section 11.7. The plant design incorporates some cold venting of the process to the HP flare. This includes the venting of process gas during start-up, and during change-over of compression trains. The quantities associated with this are given in Table E.1 (v) provided in response to Item Ea-1. The HP flare stack is 40 metres high, and the quantities vented are small. Also they consist almost entirely of methane which is lighter than air. The emissions of cold venting releases through the HP flare are not predicted to occur at concentrations that will impact on human health.
For
insp
ectio
n pur
pose
s only
.
Conse
nt of
copy
right
owne
r req
uired
for a
ny ot
her u
se.
EPA Export 25-07-2013:18:45:28

IPPC Response
Page 61 of 78
IPPC - Item Ia-3 The marine dispersion model assessment as supplied is specific to the original outfall area. A new model specific to the proposed outfall area should be supplied.
The model developed by Kirk McClure Morton (KMM) was initially set up to cover modelling of four points within Broadhaven Bay (see Offshore EIS, Section 9) in support of the application to terminate the discharge pipeline 7km from the landfall at 40m water depth inside the bay. The model’s boundaries were set such that these four locations were well within the limits. Following the Department of Communications, Marine and Natural Resources recommendation that the discharge point be moved outside the bay, further modelling took place. Discharge from the new location was carried out, and an addendum to the original modelling report was produced (attached as Appendix 10 to the Terminal EIS). On receipt of the letter from the EPA dated 24/06/05, KMM were asked to address the issue of boundary location in the context of the question raised by the EPA. KMM responded as follows:
‘Considerable effort was expended on ensuring that the model boundary conditions were accurately defined thus any inaccuracy/instability associated with any remaining slight mismatch in boundary conditions will not in our opinion have a measurable impact on the model prediction for the 60m discharge location which is located some 3-4km from the nearest model boundary i.e. at least 60 grid cells from the boundary.’
From the response from KMM, it can be seen that they have every confidence that the data used in the modelling of the discharge from the new location is appropriate, and that no further modelling is required from a technical perspective to cover the actual outfall location.
For
insp
ectio
n pur
pose
s only
.
Conse
nt of
copy
right
owne
r req
uired
for a
ny ot
her u
se.
EPA Export 25-07-2013:18:45:28

IPPC Response
Page 62 of 78
IPPC - Item Ib-1 Give details of the residents and businesses within two kilometres of the installation (provide Map).
Please find map attached. Within a 2km radius of the installation, the Charles Rivers Laboratories and 20 occupied and disused houses are located. Table 1 below lists the residents shown on the attached map. Table 1: Key to Residential Properties
Map Ref Details
1 J. Healy and family
2 D. Culloty and family
3 J. Healy and family
4 S. Healy and family
5 P. Healy and family
6 M. and M. Healy and family 7 P. Healy
8 T. Healy (rented to M. Curtis and family)
9 M. and A. Healy
10 B. Reilly (recently deceased)
11 Disused house owned by J. Reilly
12 J. Reilly and family
13 S. Murphy and family
14 J. McAndrew and family
15 Deserted property
16 Disused house owned by B. Sheeran
17 B. Conway and family
18 J. Flannery and family
19 B. Sheeran and family
20 Disused house owned by J. Ruddy
For
insp
ectio
n pur
pose
s only
.
Conse
nt of
copy
right
owne
r req
uired
for a
ny ot
her u
se.
EPA Export 25-07-2013:18:45:28
IPPC Response
Page 63 of 78
IPPC - Item Ib-2 Give details of the assessment of the impact of all the emissions from the heating medium heater.
The operation of the heating medium heater is likely to be highly curtailed, or removed entirely
as a result of the decision to install waste heat recovery units on the export compressor gas
turbines, as these will replace the heating medium duty of the heating medium heater in the
great majority of operating conditions.
The possibility remains of using the heating medium heater, but fuelled only on fuel gas, to
provide supplementary heat under extreme low temperature conditions.
The EIS, Section 11.13 describes the impacts of air emissions from all combustion sources in
the original terminal design. The only significant impact on local air quality was assessed as
being NOx. This modelling considered all emission sources together. The EIS stated that the
modelling assumptions were highly conservative. With the major reduction in fuel gas
consumption anticipated in the heating medium heater, and the withdrawal of condensate
fuelling, the modelling assumptions, and outcomes can be considered to be extreme worst
case.
The findings of the modelling, in summary were that typical operations do not result in ground
level concentrations of NO2 that would exceed or approach any of the air quality limits.
For
insp
ectio
n pur
pose
s only
.
Conse
nt of
copy
right
owne
r req
uired
for a
ny ot
her u
se.
EPA Export 25-07-2013:18:45:28

IPPC Response
Page 64 of 78
IPPC - Item Ib-3 The background levels supplied were determined by two monitoring events. Supply quality control data in relation to monitoring event and assess background levels determined in relation to background levels for other similar environment. Assessment of the background levels within the bay and at the outfall should also be included.
Quality Control The two monitoring events took place in 2000 and 2001. In 2000 all metals were analysed within the TES Bretby laboratory, while in 2001, analysis of 4 metals (barium, cadmium, mercury and lead) were also analysed at a UK Environment Agency laboratory, while the other metals were again analysed at TES Bretby’s own laboratory. Both laboratories have UKAS accreditation for the detection of metals in saline samples. UK Environment Agency QC Procedures The quotation from the Environment Agency on their QC procedures is provided below:
‘Samples are diluted before analysis for barium, because of the high concentrations found in saline samples. The amount of dilution depends on the concentration. Quality control samples are run with every batch, in random positions and plotted on Shewart control charts. Any QC's that fail are flagged by the LIMS system, and the samples associated with the failure are re-analysed. We are UKAS accredited for all of the analysis we have done for you. We participate in a number of quality assurance schemes including WRc's Aquacheck. Calibrations include a blank solution. Additional blanks are measured periodically, especially for mercury. Mercury is done using atomic fluorescence. Standards, quality control solutions and blanks go through the same digestion procedure as samples for both arsenic and mercury.’
At the time of the sample analysis TES Bretby were accredited for analysis of saline water including seawater and minewater. They are involved in the Aquacheck inter-laboratory calibration exercise for the analysis of metals in water (Aquacheck includes industrial effluent and waste water). Method blanks were run with each batch of samples. To be accepted, all method blanks would have given a reading below the limit of detection, or below the reporting limit.
‘The TES Bretby Quality Control procedure for analysis of metals by ICPMS on waters is as follows: The ICPMS is tuned at the start of every day to ensure that the spectrometer is correctly aligned across the mass spectrum and that the signal intensity at each check mass is within the tolerances specified in the method. The instrument is then calibrated at 7 levels of concentration and the linearity of response verified. The calibration is then verified at one concentration level using a calibration solution which is independent of the primary solutions. We run a procedural blank and a spike reference matrix and ensure that these are within specification. The samples are then run with calibration checks bracketed every 20 samples. The samples are quantified against one of three internal standards which correct for matrix effects.
For
insp
ectio
n pur
pose
s only
.
Conse
nt of
copy
right
owne
r req
uired
for a
ny ot
her u
se.
EPA Export 25-07-2013:18:45:28

IPPC Response
Page 65 of 78
The values for calibration verification standards and reference materials are controlled using industry established statistical charting methods. Each data point is assessed for bias, consecutive warning and action limit failures and appropriate action is taken in accordance with the procedures set out in the method.’
Background Levels The table below compares the background levels of five key metals and seawater samples taken for Broadhaven Bay with OSPAR 2000 Region III QSR background concentrations. As shown, the background levels for these metals in Broadhaven Bay are lower than the published data for Region III. This is assumed to be due to the lack of industrial inputs to the marine environment in the Broadhaven Bay area.
Background Concentrations (OSPAR 2000 Region III QSR)
Measured Background Metal Concentrations (Broadhaven Bay)
Metal Ocean Offshore Estuarine 2000 2001
cadmium 0.05 0.01 –0.03 0.03 – 0.1 <0.0001 <0.00004
copper 0.5 ~ 0.31 0.011 0.018
lead 0.03 ~ 0.12 <0.001 0.000864
mercury 0.1-0.4 0.2 – 0.5(ng/l) ~ <0.0001 0.000041
zinc 5 0.5 40 0.005 0.032
Note: Concentration in µg/litre unless otherwise stated.
For
insp
ectio
n pur
pose
s only
.
Conse
nt of
copy
right
owne
r req
uired
for a
ny ot
her u
se.
EPA Export 25-07-2013:18:45:28

IPPC Response
Page 66 of 78
IPPC - Item Ic-1 Give details of the habitat and fauna at the proposed outfall diffuser for treated effluent. Give details of the beneficial uses and users of receiving waters in Broadhaven Bay and environs including locations where appropriate shell fisheries or potential shell fishery sites. Describe the impact of the emission having regarding to the Quality of Shellfish Waters Regulations 1994.
Habitat & Fauna Encountered at Proposed Outfall Diffuser of Treated Effluent
The diffuser will be located in excess of 60m water depth, at 9º58’56.6 (W), 54º 19’ 30.1 (N). The site is approximately 2km north of Erris Head, and is on the line of the export gas pipeline from the Corrib gas field to the terminal at Bellanaboy. During a marine geophysical survey (comprising echo sounder, sidescan sonar, swathe bathymetry and sub-bottom profiler data acquisition) of the export pipeline in 2000, swathe bathymetry images were produced for the whole route, Figure 1(Inset A) presents the image which includes kilometre point 71 (71km from the gas field), and at which point the outfall diffuser is proposed. The diffuser location is in an area of relatively smooth and featureless dense shelly, gravelly sand overlying till. Further offshore (along the proposed route) there are rock outcrops, and the export pipeline route itself runs through a narrow gap in the rocks. In 2000 a survey of the benthic ecology of the Corrib Field and various points along the pipeline route was also completed. The survey of the pipeline route consisted of taking grab samples and seabed photographs. The closest station where photography was completed was 2km from the proposed diffuser location (station 26, see Figure 1(Inset D). Photographs and grab samples were also taken at distances of approximately 3.6km and 3.75km from the diffuser location (see Figure 1), in water depths of 80m and 43m respectively (stations 10 and 25B). Seabed photographs were also taken at these locations (Figure 1 Inset B and 1 Inset E respectively). The photographs taken from stations 26, 10 and 25B show areas which appear to be relatively barren and consist of a dense sand layer on the seabed. The seabed at the diffuser location is assumed to be very similar to that found at these nearby locations. In slightly deeper water (station 16), the seabed appears to consist of coarser, more gravely material (Figure 1 Inset C). Taxonomic analysis of the benthic grab sample taken 3.6km away (station 10) resulted in 44 species being identified with a density of 1185 individuals per m
2. While at station 25B 40
different species with an overall abundance of 1080 individuals per m2 were recorded. The
benthic fauna at these two sites is dominated by species such as Edwardsia (sea anemone) species, Magelona mirabilis (Bristleworm), Echinocyamus pusillus (sea urchin), and several Amphiura (brittlestar) species (including juveniles) (full taxonomic data are provided in the Offshore EIS, 2001). Station 10 is an Amphiura filiformis assemblage (as described by Thorson, 1957) and can be regarded as being at the muddier end of the continuum between this type of community and the Chamelea gallina community. This type of community is well represented in Irish coastal waters. Results from the biological sampling also identify station 25B as being of a Chamelea-type assemblage. Given the similarity of the physical conditions at station 10, station 25B and the diffuser location, it can be assumed that the habitat and faunal make-up of the areas are similar.
For
insp
ectio
n pur
pose
s only
.
Conse
nt of
copy
right
owne
r req
uired
for a
ny ot
her u
se.
EPA Export 25-07-2013:18:45:28

IPPC Response
Page 67 of 78
In 2005 water, sediment and biota from the vicinity of the diffuser location were sampled as part of the first stage of baseline monitoring specified on the proposed plan to monitor the potential impacts of the Gas Terminal Outfall at the point of discharge and within Broadhaven Bay (attached). Data from analysis of these samples are not available yet. A brief description of the survey activities which took place is presented as Appendix 1 to this document.
Beneficial Uses and Users of Broadhaven Bay
Broadhaven Bay is used for fisheries and recreational angling and boating. The beneficial users of the marine and coastal environment have been considered throughout project planning and human impacts are discussed in both the Offshore EIS and Terminal EIS. At the design (FEED) stage of the project, the options available to Shell for location of the diffuser were wide ranging. In order to find a location from which the discharge would have least potential effect on the habitats and fauna of Broadhaven Bay, a comprehensive dispersion modelling exercise was undertaken. Four locations along the export gas pipeline route were selected (as the plan was to piggy-back the discharge pipeline onto the export gas pipeline for ease of construction), these locations were on the 10, 20, 30 and 40m depth contours. Modelling of worst case discharge scenarios was undertaken for each of the locations and it was concluded that for worst case scenarios (highest volumes of undiluted anticipated discharge), the point from which discharges would have least effect on Broadhaven Bay was the 40m contour, though the difference between the 30 and 40m locations was marginal. The maximum predicted increase (using worst case model scenarios) in any metal concentration in Broadhaven Bay from locating the diffuser at the 40m contour was a rise of 2.2% for chromium. In the award of the approval for the Plan of Development for the Corrib Field the Minister for (then) Communications, Marine and Natural Resources directed Shell to relocate the discharge point to outside Broadhaven Bay (and outside the boundary of the Broadhaven Bay SAC). At this stage, modelling was carried out for a 60m contour approximately 3km north of Erris Head. Worst possible case discharges from this location were also modelled. The model predicts that in a worst case discharge scenario, of dry weather (the discharge is designed to take surface water run-off from the Terminal), neap tides (least water movement), and no wind (reducing surface mixing), that the effluent plume will not increase background concentrations by more than 1.2%. Predicted increases of greater than 0.5% of the existing background concentrations are restricted to within approximately 500m of the point of discharge. It also shows that the plume is likely to be orientated up and down tide in an approximate east-west direction and there was no evidence for the plume to flow towards Broadhaven Bay. Further to that modelling exercise, the proposed diffuser location was set to KP 71 on the export gas pipeline (this is a few hundred metres further offshore than the 60m contour). The final location of the outfall diffuser is likely to be adjusted slightly due to local conditions and topography. The EPA will be notified of the actual point of discharge once the diffuser has been installed. The modelling carried out for the 60m point is considered valid for a slightly deeper and further offshore discharge point. The location of the diffuser, and the predicted increases to background metal concentrations in the sea off Erris Head are predicted to have no impact on the uses and users of Broadhaven Bay.
Impacts to Shell Fisheries or Potential Shellfish Sites
Within the wider Broadhaven Bay itself there are no licensed shellfish sites, however two licences do exist in the inner part of Broadhaven Bay, in the area close to Belmullet, and a further 2 exist in the Sruwaddacon. The nearest of these to the diffuser is over 12km away (see Figure 2 below).
For
insp
ectio
n pur
pose
s only
.
Conse
nt of
copy
right
owne
r req
uired
for a
ny ot
her u
se.
EPA Export 25-07-2013:18:45:28

IPPC Response
Page 68 of 78
Figure 2: Map Showing Licensed Shellfish Sites in Broadhaven Bay
The modelling results show that the discharges from the outfall location will have no effect on the licensed shellfish culturing operations in Sruwaddacon, and in fact any location in Broadhaven Bay for reasons stated above. The depth of water at the diffuser and the natural current regime are sufficient to dilute any contaminants remaining in the discharge (which is already treated at the Terminal such that metallic elements are at or below EQS concentrations before discharge) to negligible levels within a short distance of the diffuser location. A full report of the modelling carried out for the 60m contour is presented as Appendix 10.1 of the Terminal EIS (2003). The proposed outfall location is also sufficiently far offshore to prevent an increase at the shoreline by Erris Head from exceeding 0.1% of the existing background levels. “The modelling results indicate that for effluent treated to at least the EQS standard before discharge, the provision of an outfall extending to the 60m contour outside Broadhaven Bay will not result in a significant adverse impact on water quality within the Bay. In all cases investigated any impact in excess of 0.5% of the existing background lies outside Broadhaven Bay with the worst case showing an increase of 1.2% in Chromium levels above the existing background. In many cases no increase in excess of 0.5% of the existing background concentration is predicted to occur even within the offshore waters” (Kirk McClure Morton, 2002) The worst case predicted increases over background are shown in Figure 3, for scale, the green streak is 3km north of Erris Head (closest onshore point).
For
insp
ectio
n pur
pose
s only
.
Conse
nt of
copy
right
owne
r req
uired
for a
ny ot
her u
se.
EPA Export 25-07-2013:18:45:28

IPPC Response
Page 69 of 78
Figure 3: Worst case Scenario Predicted Increases in Chromium Concentrations over Background Levels
For
insp
ectio
n pur
pose
s only
.
Conse
nt of
copy
right
owne
r req
uired
for a
ny ot
her u
se.
EPA Export 25-07-2013:18:45:28

IPPC Response
Page 70 of 78
Quality of Shellfish Waters Regulations, 1994 as amended, 2001 It is noted that Broadhaven Bay does not appear in either Schedule 1 or Schedule 2 of the Regulations. Regardless, given the potentially applicable requirements of the Regulations (Table 1), even the predicted worst case increases in any contaminants will not be sufficient to contravene any of the conditions set.
Table 1: Extracts from Schedule 3 of the Schedule 3 Quality of Shellfish Waters Regulations, 1994 as amended, 2001
7. Petroleum Hydrocarbons
Hydrocarbons must not be present in the shellfish waters in such quantities as to-
(a) produce a visible film on the surface of the water and/or a deposit on the shellfish, or
(b) have harmful effects on the shellfish.
(Standard to be conformed with by 75% or more of visual examinations over a period of 12 months where examinations are carried out at least once per quarter).
9. Metals: Silver Arsenic Cadmium Chromium Copper Mercury Nickel Lead Zinc
mg/1
The concentration of each substance in shellfish waters or in shellfish flesh must not reach or exceed a level which gives rise to harmful effects on the shellfish and their larvae and the concentration of each substance in shellfish flesh must be so limited that it does not detract from the quality of shellfish products. The synergistic effects must be taken into consideration when evaluating the levels of these metals.
(Standard to be conformed with by 100% of samples over a period of 12 months).
Attachments: Figure 1 Habitat Information Appendix A Proposal to monitor the potential impacts of the Bellanaboy Gas Terminal Outfall at the point of discharge and within Broadhaven Bay, Co. Mayo Appendix B Baseline fieldwork report for the monitoring of the marine ecology in relation to the operation of the gas terminal outfall in Broadhaven, Co. Mayo – Pre-construction Survey (June –August 2005)
For
insp
ectio
n pur
pose
s only
.
Conse
nt of
copy
right
owne
r req
uired
for a
ny ot
her u
se.
EPA Export 25-07-2013:18:45:28

IPPC Response
Page 71 of 78
IPPC - Item Ic - 2 Presentation of results as a percent of background while useful should also be supported by concentration in SI units. Also results data should include location and averaging period. Where possible impact contours outlining any dispersion should also be included.
The modelled impacts are presented in two ways, as contour plots showing the spatial impact of the discharge and in tabular form showing the maximum impact occurring within the model domain. Thus, in the former case the predicted impact at all locations is shown while in the latter the model results were interrogated to identify the maximum concentration predicted in any model cell which was always somewhere close to the point of discharge. The hydrodynamic modelling system used for the Corrib project employed a flexible mesh system thus the spatial resolution of the model is not fixed but varies over the model domain with a larger grid spacing being employed in the deepwater offshore and increasingly finer grid spacing being applied in the nearshore area. However for the dispersion simulations the hydrodynamic predictions were interpolated on to a rectangular grid with a horizontal resolution of 50m. The averaging period used in the simulations is effectively the model timestep which was 20 seconds, i.e. pollutant concentrations were calculated every 20 seconds. The table below shows recorded background levels in Broadhaven Bay (in µg/l), together with the maximum predicted increase in percentage terms for each of the metals. The final column of the table shows the predicted (maximum) concentrations of the metals once the discharge is commenced. Samples were taken close to the mouth of the Sruwaddacon.
Constituent Background (ug/l)
Maximum Increase
Max level in ug/l
Chromium Cr 1-3 1.20% 3.04
Manganese Mn 14-56 0.30% 56.17
Nickel Ni 5 0.30% 5.02
Copper Cu 11-18 <0.1% 18.02
Zinc Zn 5-32 0.30% 32.1
Arsenic As 6-8 0.10% 8.01
Selenium Se 42-56 <0.1% 56.06
Silver Ag <1 (0.5) 0.30% 0.502
Cadmium Cd 0.1 0.70% 0.1007
Mercury Hg 0.041 <0.1% 0.041
Lead Pb 0.864 0.10% 0.865
Barium Ba 7-10 0.70% 10.07
The results of the modelling presented above indicate that the effluent plume resulting from the intermittent dry weather discharge is not predicted to increase background concentrations by more than 1.2% during neap tides. Predicted increases of greater than 0.5% of the existing background concentrations are restricted within approximately 500m of the point of discharge.
For
insp
ectio
n pur
pose
s only
.
Conse
nt of
copy
right
owne
r req
uired
for a
ny ot
her u
se.
EPA Export 25-07-2013:18:45:28

IPPC Response
Page 72 of 78
IPPC - Item Id-1 In consideration of metal distribution justify the statement “based on current knowledge on trace metal cycling in aquatic environments it is extremely unlikely that measurable bioaccumulation of metals in local fauna or commercially exploited seafood will occur”. Describe the fate of metals constituents in particular any accumulation of metals in sediments and biota.
The fate of metal constituents in the waste water discharge, including their potential for bioaccumulation and deposition in the marine environment, is discussed in detail in Section 7.8 of the Offshore EIS.
For
insp
ectio
n pur
pose
s only
.
Conse
nt of
copy
right
owne
r req
uired
for a
ny ot
her u
se.
EPA Export 25-07-2013:18:45:28

IPPC Response
Page 73 of 78
IPPC - Item Ie-Ih Clarify the background concentration of NOx having regard for the background concentration of NO2 and background levels for other similar environments. Give the maximum ground level concentrations for NOx (annual average) from process contributions at the footprint boundary, site boundary and sensitive receptors and provide isoline plots. Clarify whether Figures 3, 4, 7, 8 & 9 of the atmospheric model report includes background concentrations having regard to Table 5. Clarify whether Table 7 includes background concentrations having regard to Table 5 and 6 and model results. Clarify how the NOx values in Table 6 were derived.
Clarify the background concentration of NOx having regard for the background concentration of NO2 and background levels for other similar environments. The background concentration of NOx (as NO2) used in the study is 11 mgm-3, this being the mean of all the diffusion tube sampling results across all the sampling locations in the sampling survey undertaken in Autumn 2003. As there is little air quality data available for rural areas in Ireland, some data have been collated from the UK’s Automatic Urban and Rural Network of monitoring stations, operated by NETCEN on behalf of DEFRA and the devolved administrations (see www.stanger.co.uk/siteinfo). There are three rural locations within the network that can be considered as ‘similar environments’ suitable for comparison with the data obtained from the terminal site. These are Strath Vaich in Ross-shire, Narberth in Pembrokeshire and Ladybower in Derbyshire. Details of these monitoring stations can be found via the above web link. Whilst not located in Ireland, these sites are considered more representative than urban or semi-urban sites located in Ireland. The relevant data are summarised in the table below:
Annual average concentrations (µµµµgm-3
) Nitrogen dioxide (NO2) Oxides of nitrogen (NOx) as NO2 Year*
Strath Vaich
Narberth Ladybower Strath Vaich
Narberth Ladybower
Year 1 1.9 7.3 12.0 2.3 9.8 14.1
Year 2 2.0 6.9 12.9 2.5 9.1 14.5
Year 3 0.9 8.8 12.9 1.1 10.5 15.0
Year 4 1.4 5.3 9.3 1.7 7.0 10.8
*Strath Vaich data 1993-1996 (station stopped monitoring NOx in early 1997). Narberth and Ladybower data 2001-2004 It can be seen that background concentrations of NOx at Ladybower and Narberth are comparable in magnitude to those found at Bellanaboy. Concentrations at Strath Vaich are lower. This may be because the site is more remote than the others or it may be partially due to temporal changes as the Strath Vaich data are from 1993-1996 due to the site ceasing NOx monitoring in early 1997. The proportion of NOx present in the form of NO2 is relatively consistent for the three sites at between 75-89%. This is generally higher than the results from the Bellanaboy survey, where the proportion was approximately 30-45%. One explanation for this may be related to proximity to existing emission sources such as traffic – Bellanaboy is perhaps closer to the sources that are principally contributing to the levels detected and hence there is less time for
For
insp
ectio
n pur
pose
s only
.
Conse
nt of
copy
right
owne
r req
uired
for a
ny ot
her u
se.
EPA Export 25-07-2013:18:45:28

IPPC Response
Page 74 of 78
NOx chemistry (e.g. oxidation by ozone) to take effect, whereas the other monitoring locations may be primarily influenced by larger urban areas further afield, by which time much of the NOx has been oxidised to NO2. The prevailing wind at Bellanaboy is from the west (the Atlantic Ocean) therefore little of the NOx detected is likely to have been in the atmosphere for long. Give the maximum ground level concentrations for NOx (annual average) from process contributions at the footprint boundary, site boundary and sensitive receptors and provide isoline plots. Figure 9 in the report presents this information (to consider process contributions only, without background, deduct 11 mgm-3 from the contoured values). It shows that the maximum predicted annual average concentration at the footprint boundary (security fence) is 24 mgm-3 (though the contours are too tightly bunched at this point to discern, this value is clarified in Table 6). At the site (planning) boundary it is 15 mgm-3. Table 7 states that the maximum annual average NOx concentration at Sruwaddacon Bay (the nearest sensitive ecological receptor) is 11 mgm-3, inclusive of background. This shows that the process contribution at this distance is negligible, the 11 mgm-3 being entirely due to the background addition (allowing for rounding). The table below summarises the NOx concentrations as described.
Annual average NOx
concentrations (µµµµgm-3
)
At footprint boundary
At planning boundary
At nearest ecological receptor
Process contribution 13 4 Negligible
Background 11 11 11
Total environmental concentration
24 15 11
The isolines for process contributions would follow exactly the same pattern as seen in Figure 9. Deducting 11 mgm-3 from the values yields the process contribution. Clarify whether Figures 3, 4, 7, 8 & 9 of the atmospheric model report includes background concentrations having regard to Table 5. As is stated in the notes (‘key’) under each figure, the NO2 and NOx plots include the relevant background level derived from the air quality survey. Clarify whether Table 7 includes background concentrations having regard to Table 5 and 6 and model results. Clarify how the NOx values in Table 6 were derived. The data in Table 7 include background concentrations, as is stated in the table’s title. The NOx values in Table 6 are derived by adding the maximum NOx process contribution (which is output directly by the model and, unlike the NO2 values, is not been factored to allow for NOx chemistry) to the background level of 11 mgm-3.
For
insp
ectio
n pur
pose
s only
.
Conse
nt of
copy
right
owne
r req
uired
for a
ny ot
her u
se.
EPA Export 25-07-2013:18:45:28

IPPC Response
Page 75 of 78
IPPC - Item Ja Describe bunding arrangements for the diesel tank, distillation column and reflux tank Give details of the loading and unloading area facilities for loading methanol storage tanks
The Diesel Tank T-8803 has its own bund. The bund is approximately n 8m width x 8 m
length x 1.7 m bund height. The capacity of the bund is 100.9 m3, compared to the normal
operating volume in the tank of 71.6 m3. The bund has it’s own sump chamber for collection
of spillages which will be removed by a gully sucker
The distillation column, C-4001 Methanol Still, and the Methanol Reflux Drum D-4002 are not
in a bunded area. They are in the Process area, which is paved; there is an up stand around
the edge of the paved areas. As this is not a storage vessel bunding is not required, however,
any liquid spills during maintenance activities will drain via the Open Drains and Open Drains
Sump to the surface water treatment system.
The tankers for loading the methanol to the Methanol Storage Tanks T-4002A/B will park on
the road in a designated area close to the Methanol Storage Tanks. A leak tight hose
connection and an earthing connection will be connected to the tanker and the tanker’s own
pump will pump the methanol into the storage tank. The road in the tanker loading area is
kerbed with ‘bar drains’, any spillage will be contained.
Tanker unloading is a supervised operation and any spills will be immediately attended by
operational staff to isolate at source and minimise evaporation.
It is currently proposed that a spill apron and gulley system will be provided to channel any
spill of methanol to a dedicated containment sump. In the event of a spill, the sump will be
emptied via vacuum tanker or equivalent and the methanol removed offsite. The containment
sump will be sized to be of a greater capacity than a methanol tanker compartment.
For
insp
ectio
n pur
pose
s only
.
Conse
nt of
copy
right
owne
r req
uired
for a
ny ot
her u
se.
EPA Export 25-07-2013:18:45:28

IPPC Response
Page 76 of 78
IPPC - Item Ka Details of provisions to decommission and render safe or remove all materials, waste, ground, plant or equipment contained on or in the site that may result in environmental pollution must be supplied in the form of a fully costed documented Residuals Management Plan.
Response The Terminal EIS lists the decommissioning activities expected to be performed when the terminal is decommissioned (Section 2.12, p2-29). These are:
1. decontamination of the process items of equipment; 2. analysis of potentially contaminated and toxic materials. An independent consultant
will be engaged to identify any contamination and monitor the environment during decontamination and demolition. Agreement with all relevant authorities for disposal routes and methods will be sought;
3. demolition of the process items of equipment; 4. removal of underground pipework and pipelines to the boundary fence; 5. the import pipeline and open drain systems will be stabilised and left in situ, or in
accordance with local authority and national requirements; and 6. the facilities will be removed to grade level.
As stated in the IPPC application, the scope of work for decommissioning the Terminal will be assessed approximately five years prior to the predicted date of decommissioning. SEPIL will prepare a Best Practical Environmental Option Study which will comparatively assess the technical, cost, health, safety and environmental aspects of each option. An environmental impact assessment will be undertaken to identify any specific impact on the local environment. A Residuals Management Plan (RMP) will be prepared within six month of the commencement of operations. The RMP will be reviewed annually as part of the site Annual Environmental Report (AER). The RMP will identify and document the action that will be carried out (and associated costs), to ensure protection of the environment in the event of site closure or extended suspension of activity (6 months or greater). It will also establish the criteria for successful decommissioning. Residuals that will be considered include:
1. chemicals, wastes and fuels; 2. hardware and materials such as tanks, pipelines, abatement equipment etc; 3. buildings and infrastructure, and; 4. environmental factors that may result in the unlikely event of a spill resulting in offsite
contamination. At this stage, costs have been estimated at €20,000,000, on the basis of Shells decommissioning cost database (Sullom Voe). The main actions and a breakdown of costs are shown in Table 1 below.
For
insp
ectio
n pur
pose
s only
.
Conse
nt of
copy
right
owne
r req
uired
for a
ny ot
her u
se.
EPA Export 25-07-2013:18:45:28

IPPC Response
Page 77 of 78
Table 1 Decommissioning Cost Estimate ‘000
Retiral
System Purging €727
Recovery of Product €101
Clean Facilities €1313
Decontamination
Contaminated Materials and Equipment €566
Remove Material €5495
Demolition of Facilities
Removal to Grade €4040
Scrap Value -€1131
Temps €747
Site Accommodation €565
Landscaping (Plant and Labour) €3333
Project Management €4244
TOTAL: €20000
For
insp
ectio
n pur
pose
s only
.
Conse
nt of
copy
right
owne
r req
uired
for a
ny ot
her u
se.
EPA Export 25-07-2013:18:45:28

IPPC Response
Page 78 of 78
IPPC - Item K.b Applicants are required to detail how the Residuals Management Plan will be financially underwritten
The Residuals Management Plan will be financially underwritten as follows:
1. SEPIL will comply with the requirements of the Financial Accounting Standards Board, and in particular FASB 143 - Accounting for Asset Retirement Obligations. This financial standard addresses how companies must account and report for obligations associated with the retirement of tangible long-lived assets and the associated asset retirement (decommissioning) costs. This standard will require SEPIL to build up a provision on its balance sheet to cover its equity share of decommissioning obligations. Statoil and Marathon, the other Corrib co-venturers, will be making provision for their respective equity shares in their accounts.
2. Liabilities under the Residuals Management Plan will be underwritten by two forms of financial security:
(a) Under the Corrib Facility Decommissioning Agreement signed in November 2001 between the then Minister for Marine and Natural Resources and SEPIL, Statoil and Marathon, the Corrib co-venturers must each, not later than a specified date (essentially, when the value of the remaining reserves of natural gas in the field equal 150% of decommissioning costs), provide security to the Minister for its share of decommissioning costs. The Decommissioning Agreement contains detailed provisions as to what constitutes acceptable security. This would be a letter of credit, guarantee or bond, payment into a trust fund or other form of security acceptable to the Minister. This security will cover the costs of decommissioning all the Corrib infrastructure, including the Bellanaboy gas terminal.
(b) Under the conditions of the planning permission for the Bellanaboy gas terminal SEPIL is required to provide security to Mayo County Council to secure the satisfactory reinstatement of the terminal site upon cessation of activities. In this regard SEPIL intends to put in place a parent company guarantee for a sum equal to €20 million, the current estimated total cost of reinstating the gas terminal site, and would be for such period as to cover the time when decommissioning of the gas terminal site will occur.
3. The above form of underwriting will take into consideration the EPA draft ‘Guidance Documents and Assessment Tools on Environmental Liabilities Risk Assessment and Residual Management Plans incorporating Financial Provision Assessment’ (May 2005). A detailed Residual Management Plan will be prepared within six months of commencement of activities at the site and will be reviewed annually as part of the site Annual Environmental Report. The mechanism for financial provision within the Residuals Management Plan will also be reviewed in light of known liabilities (e.g. as part of a closure restoration aftercare management plan (CRAMP)) and unknown liabilities (e.g. in the unlikely event of spillage and identified through environmental liability risk assessment (ELRA))
For
insp
ectio
n pur
pose
s only
.
Conse
nt of
copy
right
owne
r req
uired
for a
ny ot
her u
se.
EPA Export 25-07-2013:18:45:28