Embed Size (px)
Citation preview
International Academic Success
Institutional Planning & Analysis
Kristen Hamilton, Matthew Kennedy & Dorys CrespinMueller
August 2010
Prepared for: Senate International Affairs Committee
AIR 2011 Forum, Toronto, Ontario, Canada

Thompson Rivers University | IPA August 2010 2
Executive Summary
This study was requested by the Senate International Affairs Committee. The research questions
included:
1. What factors affect the cumulative GPA (CGPA) of International students at TRU?
2. What factors affect the retention of International students at TRU?
3. Are Student Success Courses among the significant factors for GPA and retention?
The study included 6,051 International students who were enrolled at TRU from 1999/00 to 2009/10
(117 of whom took Student Success Courses). Participation in the Student Success Courses was not
found to have a significant effect on either cumulative GPA or retention. The most significant factor
affecting cumulative GPA was first term GPA; the most significant factor affecting student retention was
cumulative GPA.
Table 1: Top Five Predictors for Educational Success for International Students
Variable Effect
Factors Affecting Cumulative GPA
First Term GPA positive
Tourism positive
Gender (female) positive
Country of Origin (Europe) positive
Africa negative
Factors Affecting Retention
Cumulative GPA positive
Diploma negative
Country of Origin (Europe) negative
Certificate negative
Age negative
AIR 2011 Forum, Toronto, Ontario, Canada
Thompson Rivers University | IPA August 2010 3
Table of Contents
Introduction .................................................................................................................................................. 4
International Student Profile .................................................................................................................... 4
How are STSS Takers Different than non‐STSS Takers? ............................................................................ 8
Methodology ............................................................................................................................................... 10
Results ......................................................................................................................................................... 12
Factors Affecting Cumulative GPA .......................................................................................................... 12
Factors Affecting Retention .................................................................................................................... 13
Conclusions ................................................................................................................................................. 15
Appendix A: Research Plan ......................................................................................................................... 16
Appendix B: Variables Included in the Analysis .......................................................................................... 18
Tables Table 1: Top Five Predictors for Educational Success for International Students ........................................ 2 Table 2: Student Records Included in the Study ........................................................................................... 4 Table 3: Students by World Region ............................................................................................................... 5 Table 4: International Students by Division and Type .................................................................................. 5 Table 5: STSS Students by Division and Program Type ................................................................................. 6 Table 6: Number of STSS Courses Taken per Student .................................................................................. 7 Table 7: Cumulative GPA of Population, Control, and STSS Students .......................................................... 8 Table 8: Attrition Rates of Population, Control, and STSS Students ............................................................. 9 Table 9: Factors Affecting Cumulative GPA ................................................................................................ 12 Table 10: Factors Affecting Retention for International Students .............................................................. 14
Figures Figure 1: STSS Course Registrations by Term ................................................................................................ 6 Figure 2: STSS Course Grade Distributions ................................................................................................... 7 Figure 3: Grade Distributions of STSS Students and the Overall Population ................................................ 9 Figure 4: The Relationship between CGPA and Likelihood of Retention .................................................... 13
AIR 2011 Forum, Toronto, Ontario, Canada

Thompson Rivers University | IPA August 2010 4
Introduction
Purpose of the Study
The Senate International Affairs Committee (SIAC) requested that Institutional Planning & Analysis (IPA)
design and conduct a study that examines factors for the academic success of International students. Of
particular interest were Student Success courses (STSS). See Appendix A for the original study proposal.
Research Questions:
1. What factors affect the cumulative GPA (CGPA) of International students at TRU?
2. What factors affect the retention1 of International students at TRU?
3. Are Student Success Courses among the significant factors for GPA and retention?
International Student Profile
The records of 6,051 International students (who were enrolled at TRU between fall 1999 and winter
2010) were included in the analysis. Of this group, 117 had taken at least one STSS course throughout
the study period (Table 2). A greater proportion of STSS students were male (61% as compared to 56%
of non‐STSS students). An additional 14 students enrolled in STSS courses and then withdrew before
completing the course; these students were not included in the experimental group.
Table 2: Student Records Included in the Study
Students included in the study came from nearly one hundred different countries. Top countries of
origin included: China (2,492), Japan (498), India (422), Korea (530), Saudi Arabia (344), and Taiwan
(330). Accordingly, the most populous world region for International students in this study was East
Asia, followed by South East Asia, West Asia, and Europe (Table 3).
1 Retention is defined as a student either earning a credential or continuing studies at TRU. Non‐exchange students who leave TRU without earning a credential are counted against the retention rate.
AIR 2011 Forum, Toronto, Ontario, Canada

Thompson Rivers University | IPA August 2010 5
Table 3: Students by World Region
*N < 5 are masked to preserve student confidentiality
The majority (56%) of students included in the study were enrolled in baccalaureate programs, and
another 25% were enrolled in diploma programs (Table 4). 40 percent of students were enrolled in a
School of Business and Economics bachelors program.
Table 4: International Students by Division and Type
*N < 5 are masked to preserve student confidentiality
Did not take STSS STSS
Grand Total
East Asia
Europe
Africa
West Asia
Central America
South East Asia
South Central Asia
South America
North America
Other
Grand Total
10
44
87
141
459
122
419
183
334
4,252
6,051
1
1
2
2
6
8
20
21
56
117
10
43
86
139
457
116
411
163
313
4,196
5,934
BACC DIPL CERT DEVL ASSO GRAD NONEGrand Total
School of Business & Economics
Student Development
Faculty of Science
School of Advanced Technology & Mathematics
Faculty of Arts
School of Tourism
Visiting
School of Nursing
Unspecified
School of Social Work
School of Education
School of Trades & Technology
Grand Total
13
13
25
25
7
19
26
12
12
3
7
4
117
155
1
1
29
1
5
872
5
914
2
84
8
454
6
165
795
1,514
1
1
39
289
33
620
2,421
3,404
1
2
2
12
13
13
152
307
495
654
1,154
3,246
6,051
*
*
*
*
*
*
*
*
*
*
*
*
*
*
*
AIR 2011 Forum, Toronto, Ontario, Canada

Thompson Rivers University | IPA August 2010 6
The majority of STSS students (68%) were enrolled in baccalaureate programs as well, and most took
either Science or Business programs (Table 5).
Table 5: STSS Students by Division and Program Type
*N < 5 are masked to preserve student confidentiality
STSS course registrations per term ranged from 1 to over 40 (Figure 1). Recent years have experienced a
significant increase in STSS registrations. It should be noted that a change in course offerings occurred
in 2006: 3‐credit courses were split into three 1‐credit courses. This may account for some of the
increases in registration.
Figure 1: STSS Course Registrations by Term
The grades achieved in STSS courses range from F to A+, with the largest group (42%) of students
achieving grades in the “A” range (Figure 2). A combined 14% of students either did not complete or
failed the courses (resulting in a grade of 0), and another 13% withdrew from the courses and did not
achieve a grade. These students were not included in the experimental group.
0
20
40
*
*
*
*
*
*
*
*
AIR 2011 Forum, Toronto, Ontario, Canada

Thompson Rivers University | IPA August 2010 7
Figure 2: STSS Course Grade Distributions
Although the majority (54%) of STSS students took only one course, 28% took two courses and 16% took
three courses (Table 6).
Table 6: Number of STSS Courses Taken per Student
*N < 5 are masked to preserve student confidentiality
* ** *
AIR 2011 Forum, Toronto, Ontario, Canada
Thompson Rivers University | IPA August 2010 8
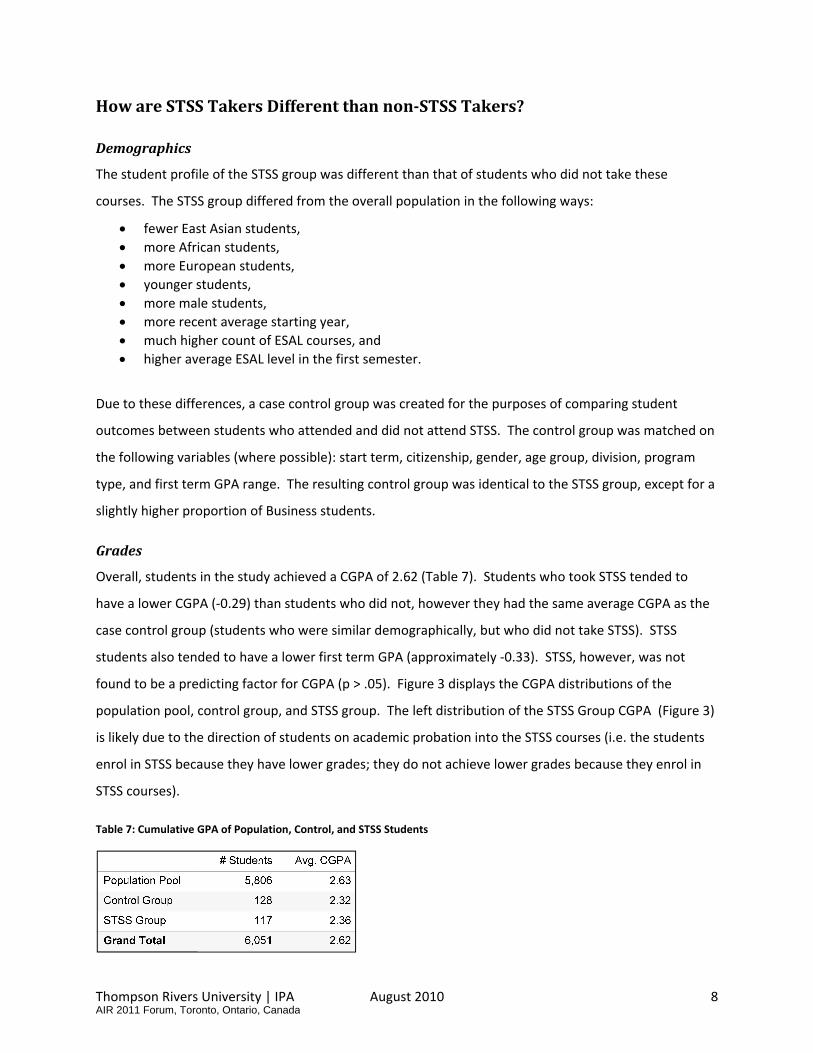
How are STSS Takers Different than nonSTSS Takers?
Demographics
The student profile of the STSS group was different than that of students who did not take these
courses. The STSS group differed from the overall population in the following ways:
fewer East Asian students,
more African students,
more European students,
younger students,
more male students,
more recent average starting year,
much higher count of ESAL courses, and
higher average ESAL level in the first semester.
Due to these differences, a case control group was created for the purposes of comparing student
outcomes between students who attended and did not attend STSS. The control group was matched on
the following variables (where possible): start term, citizenship, gender, age group, division, program
type, and first term GPA range. The resulting control group was identical to the STSS group, except for a
slightly higher proportion of Business students.
Grades
Overall, students in the study achieved a CGPA of 2.62 (Table 7). Students who took STSS tended to
have a lower CGPA (‐0.29) than students who did not, however they had the same average CGPA as the
case control group (students who were similar demographically, but who did not take STSS). STSS
students also tended to have a lower first term GPA (approximately ‐0.33). STSS, however, was not
found to be a predicting factor for CGPA (p > .05). Figure 3 displays the CGPA distributions of the
population pool, control group, and STSS group. The left distribution of the STSS Group CGPA (Figure 3)
is likely due to the direction of students on academic probation into the STSS courses (i.e. the students
enrol in STSS because they have lower grades; they do not achieve lower grades because they enrol in
STSS courses).
Table 7: Cumulative GPA of Population, Control, and STSS Students
AIR 2011 Forum, Toronto, Ontario, Canada

Thompson Rivers University | IPA August 2010 9
Figure 3: Grade Distributions of STSS Students and the Overall Population
Retention Rates
Historically, International students have experienced a slightly lower retention rate than domestic
students2. Overall, 44% of students in this study left TRU without earning a credential, and 56% either
earned a credential or were still enrolled at TRU in winter 2010. Students who took STSS were found to
have a slightly lower retention rate than the control group, and a slightly higher rate than the entire
population. However, STSS was not found to be a significant factor in predicting retention.
Table 8: Retention Rates of Population, Control, and STSS Students
2 See: IPA (2009). Baccalaureate Retention Fall09.
Population Pool Control Group STSS Group
0.50 1.50 2.50 3.50 0.50 1.50 2.50 3.50 0.50 1.50 2.50 3.50
AIR 2011 Forum, Toronto, Ontario, Canada
Thompson Rivers University | IPA August 2010 10
Methodology
This study used quantitative methods to determine what factors affect the academic success of
International students. Cumulative GPA and retention were used as outcome variables. A dataset of
possible predicting factors was constructed by IPA (Appendix B). The records of 6,051 International
students who were enrolled between the fall of 1999 and the winter of 2010 were included. Students
are coded as being International by the registrar’s office. Students were considered to be part of the
experimental (STSS) group if they had earned a grade in at least one STSS course during this period.
Students who withdrew from the course were excluded from the study. Exchange students were also
excluded from this study, as they are not expected to graduate from TRU. Student T‐tests and chi‐
square tests were used to compare differences in educational outcomes and other descriptive variables
between the population pool, the control group, and the STSS group. ANOVAs were also computed to
determine major outcomes differences between divisions and world regions of origin.
The dataset was analysed using inferential statistical methods. A stepwise multiple linear regression
model was fitted to predict cumulative GPA. A fixed linear regression model was also fitted. The models
were similar, and the stepwise model was selected as the final predicting equation. Categorical
variables such as world region of citizenship and division were coded into indicator variables. A binary
logistic regression was also calculated in order to create a model that predicted student retention. A
student was considered to be retained if they had earned a credential or if they were still enrolled at
TRU in the winter of 2010. Students were considered to not have been retained (attrition) if they left
TRU without earned a credential. Exchange students were not included in the retention analysis. In
order to further explore the relationship between CGPA and retention, probabilities and residuals were
saved from the final logistic regression model. A simple fixed linear regression was then calculated for
CGPA and probability of retention (see Figure 4).
A case control sample was created for the purposes of comparing academic outcomes between students
who take, and who do not take, STSS courses. Because of the inherent bias in the STSS sample (students
either self‐select or are guided into the course) they were not expected to be a representative sample of
the entire data set. This was tested with t‐tests and chi‐square tests. Because of some major
differences between the two groups (see How are STSS Takers Different than non‐STSS Takers), a case
control sample was created based on the following variables:
AIR 2011 Forum, Toronto, Ontario, Canada
Thompson Rivers University | IPA August 2010 11
first term GPA,
gender,
age group,
citizenship,
division,
degree type, and
first term at TRU.
Using stratified random selection, a control group was created that was nearly identical to the STSS
group (with the exception of attendance in STSS courses, and a slight overrepresentation of business in
the control group). This group was used to compare educational outcomes with the STSS group (see
How are STSS Takers Different than non‐STSS Takers).
Data was analysed using PASW 18 and Tableau.
AIR 2011 Forum, Toronto, Ontario, Canada

Thompson Rivers University | IPA August 2010 12
Results
Factors Affecting Cumulative GPA
Factors Affecting Cumulative GPA for All International Students
The strongest factor predicting CGPA was first term GPA. On its own, first term GPA was a significant
factor for predicting CGPA: R2 = .62, F(1, 6049) = 9935.82, p < .001. When first term GPA is combined
with other significant factors, the multiple regression model resulting from the study can explain 65% of
the variance in the CGPA of International students. For every one unit increase in first term GPA (i.e.
from 2.00 to 3.00) the average student’s CGPA will increase by .60. Other significant factors (in order of
effect size) include: Tourism, Gender, Europe, Africa, number of terms on probation, Development,
Business, Start Year, and Age3.
Table 9: Factors Affecting Cumulative GPA
Summary of Multiple Regression Analysis for Variables Predicting Cumulative GPA (N=6051)
Variable B SE B β
Gender ***.132 .015 .072 Age ***.010 .002 .054 Start Year ***.016 .003 .055 First Term GPA Rangea ***.599 .007 .739 Europe **.105 .031 .027 Africa *‐.092 .042 ‐.017 Business **.045 .017 .024 Tourism ***.208 .047 .036 Development **‐.055 .022 ‐.024 # Terms on Probation ***‐.061 .003 ‐.145 R2 .651
1096.87 F
Note: R2 = .65 (p < .001). Gender coded as 0 for male and 1 for female. Europe, Africa, Business, Tourism, and Development coded as 1 for yes and 0 for no. a First Term GPA Range is the integer of the student’s actual first term GPA. *p < .05. **p < .01. ***p < .001.
Factors affecting first term GPA
Although first term GPA was the strongest factor for predicting CGPA, a model predicting first term GPA
was not generated from the study data. Available factors resulted in a very weak model for predicting
3 The coefficients in Table 9 (B) show the size of the effect on CGPA for a 1‐unit increase in the variable. Positive coefficients indicate that an increase in the variable results in an increase in CGPA, while negative coefficients indicate an inverse relationship.
AIR 2011 Forum, Toronto, Ontario, Canada
Thompson Rivers University | IPA August 2010 13
first term GPA (explaining less than 10% of the variance in first term GPA). Taking STSS in the first term
also did not contribute to this model. Variables that are thought to contribute to first term GPA include:
quality of high school education, delay between previous academic training and attendance at TRU, and
socio‐economic factors.
Factors Affecting Retention
Although it is acknowledged that a certain amount of attrition is expected at the post secondary level, it
was the aim of this study to try to determine what factors predicted retention, thereby enabling
intervention to reduce these occurrences.
Factors Affecting Retention for All International Students
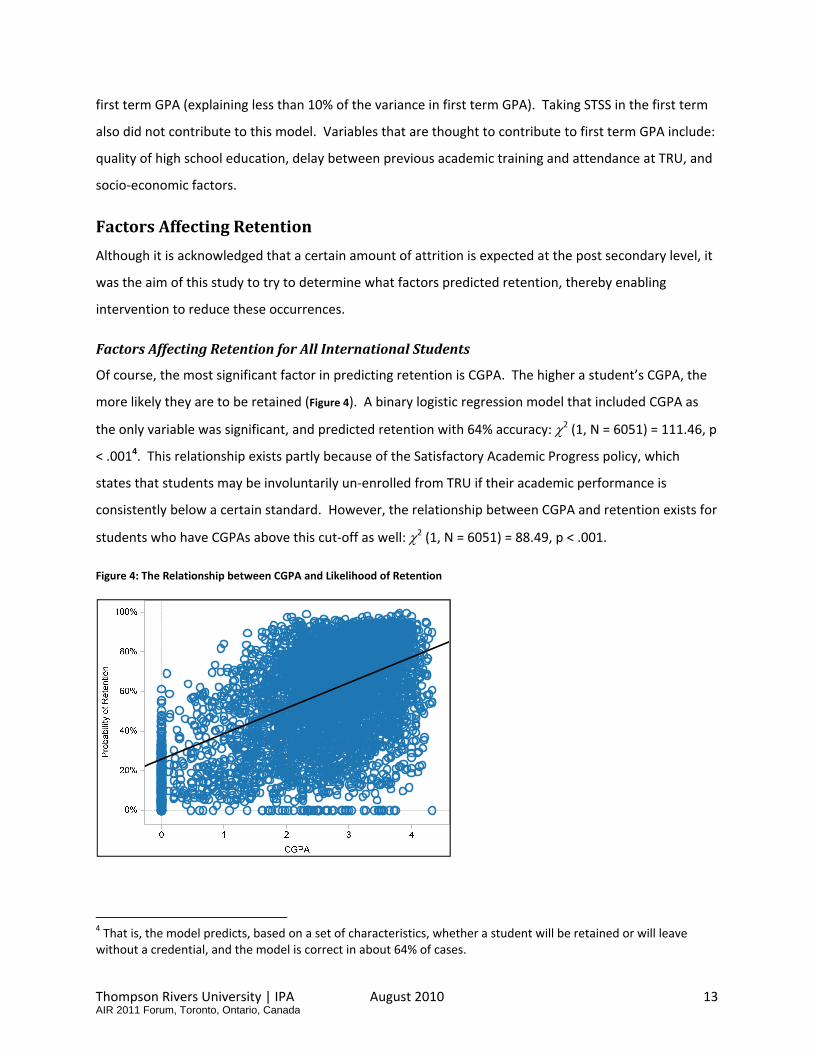
Of course, the most significant factor in predicting retention is CGPA. The higher a student’s CGPA, the
more likely they are to be retained (Figure 4). A binary logistic regression model that included CGPA as
the only variable was significant, and predicted retention with 64% accuracy: 2 (1, N = 6051) = 111.46, p
< .0014. This relationship exists partly because of the Satisfactory Academic Progress policy, which
states that students may be involuntarily un‐enrolled from TRU if their academic performance is
consistently below a certain standard. However, the relationship between CGPA and retention exists for
students who have CGPAs above this cut‐off as well: 2 (1, N = 6051) = 88.49, p < .001.
Figure 4: The Relationship between CGPA and Likelihood of Retention
4 That is, the model predicts, based on a set of characteristics, whether a student will be retained or will leave without a credential, and the model is correct in about 64% of cases.
AIR 2011 Forum, Toronto, Ontario, Canada
Thompson Rivers University | IPA August 2010 14
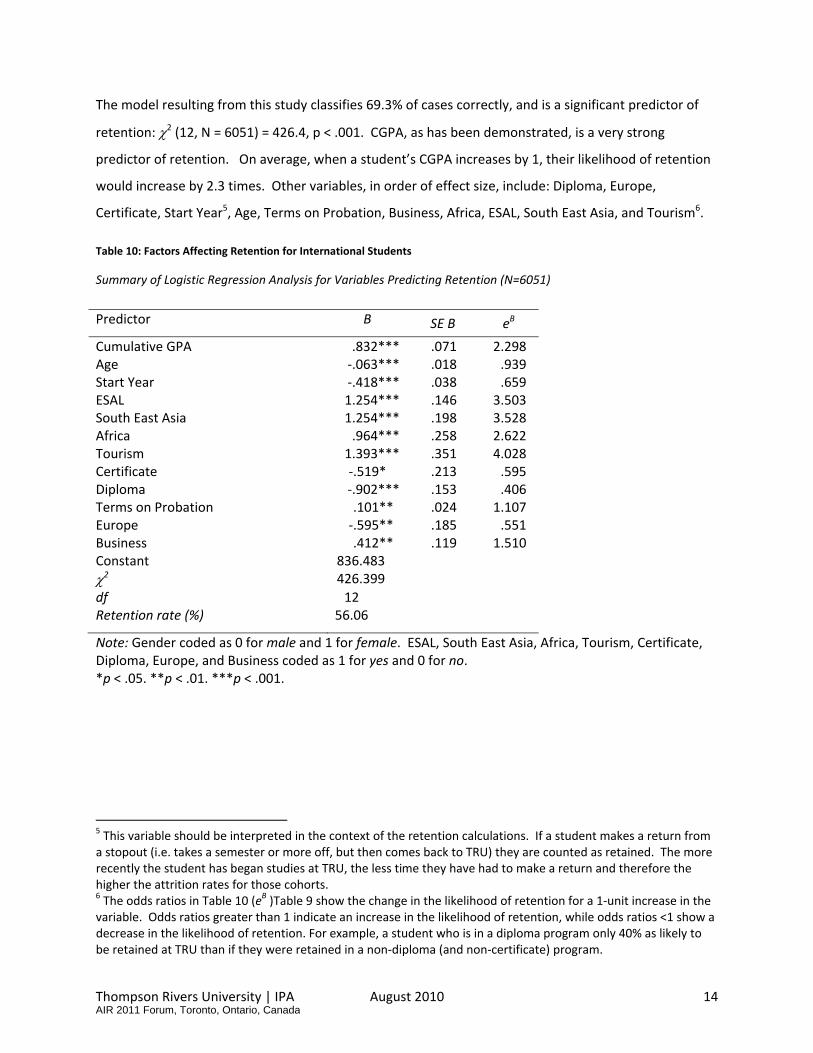
The model resulting from this study classifies 69.3% of cases correctly, and is a significant predictor of
retention: 2 (12, N = 6051) = 426.4, p < .001. CGPA, as has been demonstrated, is a very strong
predictor of retention. On average, when a student’s CGPA increases by 1, their likelihood of retention
would increase by 2.3 times. Other variables, in order of effect size, include: Diploma, Europe,
Certificate, Start Year5, Age, Terms on Probation, Business, Africa, ESAL, South East Asia, and Tourism6.
Table 10: Factors Affecting Retention for International Students
Summary of Logistic Regression Analysis for Variables Predicting Retention (N=6051)
Predictor B SE B eB
Cumulative GPA .832*** .071 2.298 Age ‐.063*** .018 .939 Start Year ‐.418*** .038 .659 ESAL 1.254*** .146 3.503 South East Asia 1.254*** .198 3.528 Africa .964*** .258 2.622 Tourism 1.393*** .351 4.028 Certificate ‐.519* .213 .595 Diploma ‐.902*** .153 .406 Terms on Probation .101** .024 1.107 Europe ‐.595** .185 .551 Business .412** .119 1.510 Constant 836.483
2 426.399
df 12 Retention rate (%) 56.06
Note: Gender coded as 0 for male and 1 for female. ESAL, South East Asia, Africa, Tourism, Certificate, Diploma, Europe, and Business coded as 1 for yes and 0 for no. *p < .05. **p < .01. ***p < .001.
5 This variable should be interpreted in the context of the retention calculations. If a student makes a return from a stopout (i.e. takes a semester or more off, but then comes back to TRU) they are counted as retained. The more recently the student has began studies at TRU, the less time they have had to make a return and therefore the higher the attrition rates for those cohorts. 6 The odds ratios in Table 10 (eB )Table 9 show the change in the likelihood of retention for a 1‐unit increase in the variable. Odds ratios greater than 1 indicate an increase in the likelihood of retention, while odds ratios <1 show a decrease in the likelihood of retention. For example, a student who is in a diploma program only 40% as likely to be retained at TRU than if they were retained in a non‐diploma (and non‐certificate) program.
AIR 2011 Forum, Toronto, Ontario, Canada

Thompson Rivers University | IPA August 2010 15
Conclusions
This study has confirmed that previous academic performance is the strongest predictor of future
academic performance. It has also found that taking STSS courses had a neutral effect on both
cumulative GPA and retention, while previous strong academic performance and being enrolled in either
Tourism or Business are positive for both outcomes. In terms of programming, students in
baccalaureate programs tend to have more positive outcomes. Students from Europe, despite achieving
higher CGPAs, are more likely to leave TRU without having completed a credential. This is also true for
older students; cumulative GPA, as well as likelihood of attrition, increases with age. Students from
Africa, however, are much more likely to be retained despite achieving lower CGPAs. Students who take
at least one ESAL course are also more likely to be retained7. As first term GPA is the greatest predictor
of CGPA, it is recommended that interventions for academic success be made within the first academic
term at TRU.
7 This is true even if ESAL credentials are not considered for retention.
AIR 2011 Forum, Toronto, Ontario, Canada

Thompson Rivers University | IPA August 2010 16
Appendix A: Research Plan
International Students Academic Success Study‐What Factors Affect the Academic Success of International Students?
Requested by: Cameron Beddome on behalf of the Senate International Affairs Committee
June 11, 2010
Research Problem:
The Senate International Affairs Committee (SIAC) has expressed an interest in examining the efficacy of certain Student Success courses (code: STSS) in helping International students succeed academically.
Research Questions:
1. What factors significantly affect the academic success of International students at TRU? 2. Are the Student Success courses among the significant factors for this academic success?
Methodology:
This study will use quantitative methods to determine what factors affect the academic success of International students. A dataset of possible factors has been constructed by IPA (Appendix A). All International student records from the summer of 2005 to the winter of 2010 will be included.
The dataset will be analysed using inferential statistical methods, including (but not limited to): factor analysis, linear regression analysis, and means testing. Records may be divided into subgroups, as appropriate.
The results of this analysis will be written up as a formal report, and will be made accessible to members of SIAC and the TRU community as appropriate. As the study is focused on gaining practical insights on the subject on International academic success, a summary report of the study’s conclusions will be made available which will use a minimum of statistical language.
Plan Timelines:
June 2010: IPA will formulate the study methodology and create the data set. The SIAC working committee will informally approve the research plan.
August 2010: IPA will conduct the statistical analysis and produce a report
September 2010: IPA will report the results to SIAC
Clarification of Terms:
Academic success will be measured with cumulative GPA. Pending an examination of the data, a fixed time period will be established for the calculation of GPA. This term will be determined based on the inclusion of maximum records in the model (for example, if most students take Student Success courses in the first fall term, a first year cumulative GPA may be calculated, whereas if most students take Student Success courses in the first winter term, a two‐year GPA may be calculated). Limiting the calculation of cumulative GPA to a fixed term will help control for students attending TRU for varying lengths of time.
AIR 2011 Forum, Toronto, Ontario, Canada
Thompson Rivers University | IPA August 2010 17
The cumulative GPA level at which a student will be considered to have achieved “success” will not be strictly defined; however, passing grades at the “C” level will be loosely considered to be an achievement of academic success. The use of a scaled dependent variable (cumulative GPA) allows for the prediction of incremental increase in success, rather than the prediction of a “pass/fail” scenario.
Reporting of Study Results:
The results of the study will be reported to SIAC as its primary audience, and the results will be given to SIAC for use in future decision making. As this study has not been subject to ethics approval, the results are intended for the TRU community only; the study methods or results may not be published in a formal academic journal.
AIR 2011 Forum, Toronto, Ontario, Canada

Thompson Rivers University | IPA August 2010 18
Appendix B: Variables Included in the Analysis
Variable Description Type
Age Approximate age calculated as 2010‐birth year scale
Age Group Calculated according to TRU Factbook groupings scale
Case Control group or STSS group (or null) binary
Cumulative GPA (CGPA) The cumulative GPA as calculated in the Student Information System
scale
Degree Type The level of the program in which the student was first enrolled (i.e. baccalaureate)
binary (dummy)
Division Division in which the student was first enrolled at TRU binary (dummy)
ESAL Student did or did not take at least one ESAL course in the study period
ESAL Count Number of ESAL courses taken (not total credits) scale
ESAL Level Average level of ESAL courses taken in the first term (5‐9) scale
Exchange The student was enrolled in an exchange program. These students were excluded.
Binary
First term at TRU First term the student took courses at TRU (includes summer terms)
scale
First term GPA range The integer of the term GPA of the first term at TRU (i.e. 2.33= 2).
scale
Gender Male, female, or unspecified. Males coded 0, females coded 1 binary
Retention Attrition
The student either earned a credential or was enrolled at TRU in winter 2010 (1) or left TRU without earning a credential (0). For complete methodology, see: IPA (2009) Baccalaureate Retention and Attrition 2009 Briefing Notes.
binary
Start Year Academic year in which the student began at TRU. Denoted according to the first year (i.e. 1999‐2000 is coded as “1999”)
scale
STSS Student did or did not earn at least one grade in an STSS course in the study period
binary
STSS Average Grade Average GPA of STSS course grades as per TRU policy ED 3‐5 scale
STSS Count Number of individual courses taken by a student (not total credits; see footnote
scale
STSS First Term The first term in which the student took an STSS course scale
STSS Time Lapse The number of terms between when a student started at TRU and when they took STSS
scale
STSS Voluntary STSS Involuntary
If the student achieved a term GPA below the probationary level (1.5) in the term before they took the STSS course, it was assumed that they were asked to enrol. These students were coded as “involuntary” STSS takers
binary
Terms on Probation The number of terms in which a student achieves a term GPA of < 1.50.
scale
Total Terms Total number of terms the student was/has been at TRU (does not include summer terms)
scale
World Region Based on citizenship country codes. Divided into world regions based on the united nations World Macro Regions and Components www.un.org
binary (dummy)
AIR 2011 Forum, Toronto, Ontario, Canada

August 2010 Prepared for: Senate International Affairs Committee Prepared by: Kristen Hamilton, Matthew Kennedy, Dorys Crespin‐Mueller
• achieving a higher first term GPA
• being in a Tourism program
• being female
• country of origin (Europe)
• country of origin (Africa‐ negative effect)
The Bottom Line: STSS was not found to be a significant predictor of either CGPA or retention. Students that achieve good grades in the first semester are much more likely to have positive academic outcomes. Interventions will probably be most effective if they are made in the first year at TRU.
Main Factors that Predict Increased Cumulative GPA
Research Questions:
• What factors affect the cumulative GPA of International students at TRU?
• What factors affect the retention of International students at TRU?
• Are STSS Courses among the significant factors for GPA and retention?
Study Data:
International Academic Success Study Summary
Main Factors that Predict Decreased Retention • being enrolled in a diploma program
• country of origin (Europe)
• being enrolled in a Certificate program
• being older
• (students with higher CGPAs have higher retention rate)
These results were obtained through statistical analysis, including linear regression (predicting cumulative GPA), binary logistic regression (predicting attrition), and means testing (control sample comparisons).
Study Methods:
Retention Rates:
TRU International students, 1999/00 – 2009/10
Cumulative GPA distributions:
The GPA – Retention Process:
AIR 2011 Forum, Toronto, Ontario, Canada