Embed Size (px)
Citation preview
368,036 The number of people in Iowa in 2015 who have some kind of disability. They represent 11.9% of the civilian, noninstitutionalized population.
32.7% Percentage of people 65 and older in 2015 with a disability, the highest of any age group.
31,589 Number of children under 18 in 2015 who have disabilities. This amounts to 4.3% of the population under 18 years of age.
180,139 The number of people aged 18-64 with a disability in 2015 or 9.6% of the population aged 18-64.
12.1% The percent of males in Iowa in 2015 with a disability. This compares to 11.8% of females.
42.6% The percent of households receiving food stamps which have one or more persons with a disability in 2015.
59,992 The number of households receiving food stamps which have one or more persons with a disability in 2015.
S T A T E D A T A
C E N T E R O F
I O W A - A
P R O G R A M O F
T H E S T A T E
L I B R A R Y O F
I O W A
A N D
T H E O F F I C E
O F P E R S O N S
W I T H
D I S A B I L I T I E S
IOWANS WITH D ISABILITIES : 2017
JULY 2017
On July 26, 1990, President George H.W. Bush signed into law the Americans with Disabilities Act, guaranteeing equal opportunity for people with disabilities in public accommodations, commercial facilities, employment, transportation, state and local government services and telecommunications.
9,666 Number of Iowa grandparents with a disability living with grandchildren under 18 in 2015.
37.7% Percentage of above grandparents with a disability who are responsible for grandchildren.
P A G E 2
Specific Disabilities
123,105 The number of Iowans in 2015 reporting an inability to hear conversations or a serious hearing loss.
6.1% Percentage of population age 5 and over with an ambulatory disability in 2015.
63,497 The number of Iowans age 5 and over in 2015 who reported that a disability made it difficult to perform self-care activities such as dressing, bathing, or getting around inside the home.
109,360 The number of noninstitutionalized Iowans age 18 and over in 2015 who reported an independent living disability that made it difficult to go outside the home alone to shop or visit a doctor's office.
57,891 The number of Iowans of any age in 2015 who reported a disability of blindness or serious difficulty seeing even when wearing contacts or glasses.
132,818 Number of people with limitations in cognitive functioning or who have a mental or emotional illness that interferes with daily activities, including those with Alzheimer’s disease and intellectual disabilities. This included people with one or more problems that interfere with daily activities, such as frequently being depressed or anxious, trouble getting along with others, trouble concentrating and trouble coping with stress.
Veterans 56,109 Number of Iowa veterans in 2015 with a disability representing 29.1% of Iowa veterans.
36.7% The percent of the veteran with population 18 to 64 years of age below the poverty level who have a disability.
52.3% The percent of the veteran population 65 years and over below the poverty level in 2015 who have a disability.
7.0 The percent of the population in 2015 with a disability in Iowa that was Hispanic or Latino
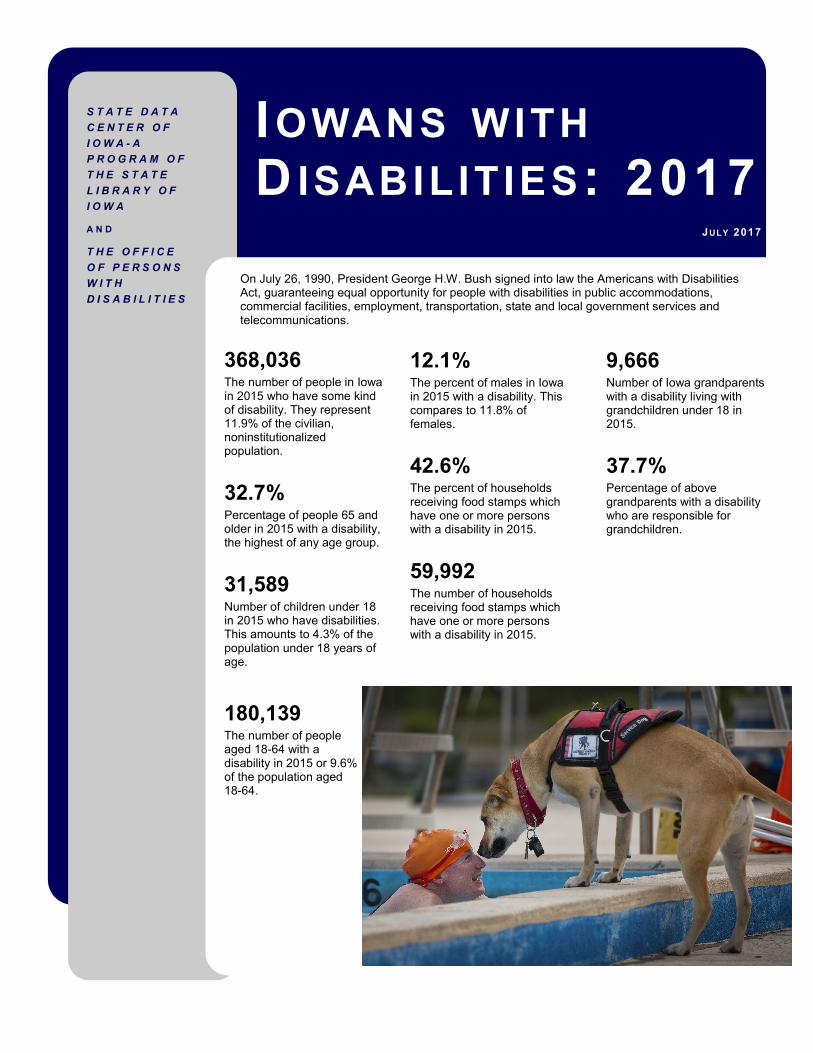
97.4% Percent of transit buses nation-wide that were lift or ramp-equipped as of
2011.
Source:
http://www.rita.dot.gov/bts/sites/rita.dot.go
v.bts/files/publications/national_transportat
ion_statistics/html/table_01_08.html
Miller Building
1112 E. Grand Ave
Des Moines, Iowa 50327
Phone: 800-248-4483
Fax: 515-242-6543
E-mail: [email protected]
www.iowadatacenter.org
S T A T E D A T A
C E N T E R O F
I O W A A
P R O G R A M T H E
S T A T E L I B R A R Y
O F I O W A
O F F I C E S O F P E R S O N S W I T H
D I S A B I L I T I E S
Lucas State Office Building
Second Floor
321 E. 12th St
Des Moines, IA 50319
515-242-6334
www.humanrights.iowa.gov
Data Source (unless otherwise noted) :
U.S. Census Bureau,
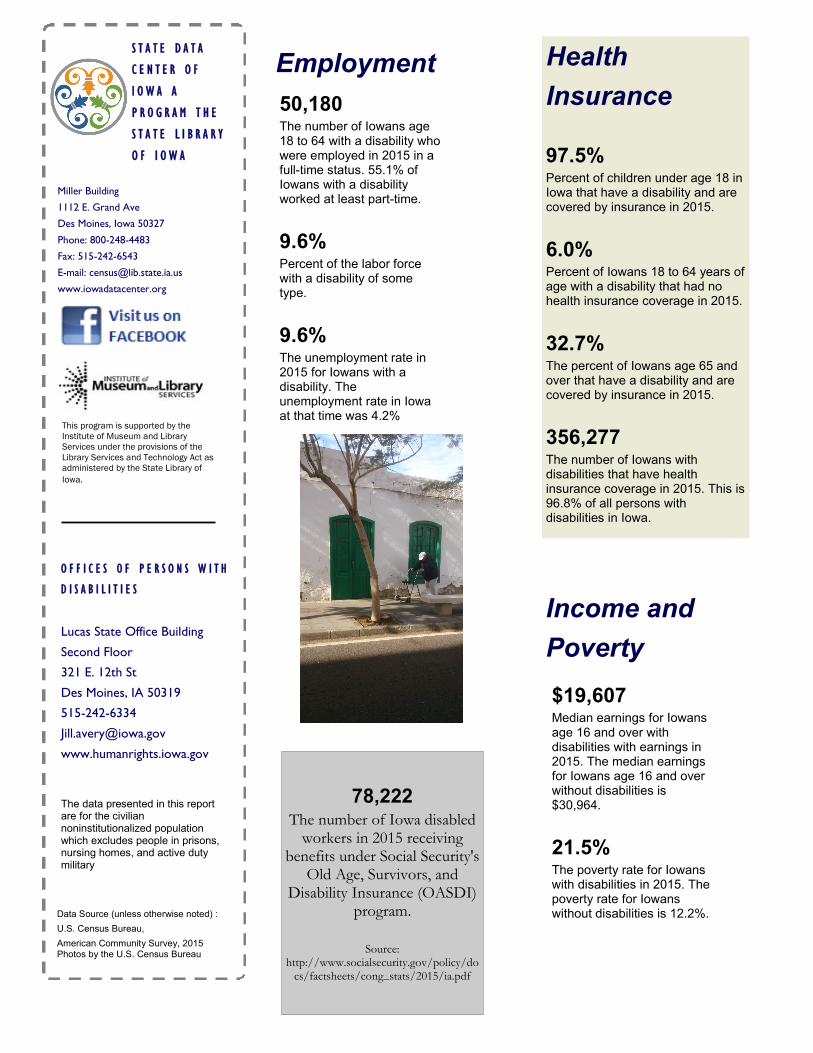
American Community Survey, 2015 Photos by the U.S. Census Bureau
This program is supported by the
Institute of Museum and Library
Services under the provisions of the
Library Services and Technology Act as
administered by the State Library of
Iowa.
The data presented in this report are for the civilian noninstitutionalized population which excludes people in prisons, nursing homes, and active duty military
$19,607 Median earnings for Iowans age 16 and over with disabilities with earnings in 2015. The median earnings for Iowans age 16 and over without disabilities is $30,964.
21.5% The poverty rate for Iowans with disabilities in 2015. The poverty rate for Iowans without disabilities is 12.2%.
Income and
Poverty
Employment
50,180 The number of Iowans age 18 to 64 with a disability who were employed in 2015 in a full-time status. 55.1% of Iowans with a disability worked at least part-time.
9.6% Percent of the labor force with a disability of some type.
9.6% The unemployment rate in 2015 for Iowans with a disability. The unemployment rate in Iowa at that time was 4.2%
Health
Insurance
97.5% Percent of children under age 18 in Iowa that have a disability and are covered by insurance in 2015.
6.0% Percent of Iowans 18 to 64 years of age with a disability that had no health insurance coverage in 2015.
32.7% The percent of Iowans age 65 and over that have a disability and are covered by insurance in 2015.
356,277 The number of Iowans with disabilities that have health insurance coverage in 2015. This is 96.8% of all persons with disabilities in Iowa.
78,222 The number of Iowa disabled
workers in 2015 receiving benefits under Social Security's
Old Age, Survivors, and Disability Insurance (OASDI)
program.
Source: http://www.socialsecurity.gov/policy/do
cs/factsheets/cong_stats/2015/ia.pdf