Embed Size (px)
Citation preview
Extraneous Perceptual Information Interferes With Children’s Acquisitionof Mathematical Knowledge
Jennifer A. Kaminski and Vladimir M. SloutskyThe Ohio State University
Educational material often includes engaging perceptual information. However, this perceptual infor-mation is often extraneous and may compete with the deeper to-be-learned structure, consequentlyhindering either the learning of relevant structure or its transfer to new situations. This hypothesis wastested in 4 experiments in which 6- to 8-year-old children learned to read simple bar graphs. In someconditions, the bars were monochromatic (i.e., No Extraneous Information), whereas in other conditions,the bars consisted of columns of discrete countable objects (i.e., Extraneous Information). Resultsdemonstrated that the presence of extraneous information substantially attenuated learning; participantstended to count the objects and failed to acquire the appropriate strategy. The interference effectsdecreased with age. These findings present evidence of how extraneous information affects learning ofnew mathematical knowledge. Broader implications of these findings for understanding the developmentof the ability to filter task-irrelevant information and for educational practice are also discussed.
Keywords: inhibition, learning, mathematics, number
Elementary educators are faced with a twofold challenge: Theyneed to communicate content to students, and they need to keepstudents engaged in the process of learning. This dual responsibil-ity may be particularly challenging when teaching mathematics,because mathematical concepts and procedures are often difficultfor students to acquire (e.g., Brown & Burton, 1978; English &Halford, 1995).
One response to this challenge is to incorporate colorful familiarimages into the learning material, with the goal of increasingchildren’s engagement and linking the new mathematical contentto some prior knowledge. For example, when the goal is forchildren to learn to read bar graphs, the bars might consist ofcolumns of candies, animals, or other objects. Such colorful im-ages are commonly encountered in elementary educational prac-tice and can also be found in material intended for adults (e.g.,“Chipotle store openings,” 2010; “Favorite pizza toppings,” n.d.).Furthermore, there is a common belief that such materials arehelpful for learning. For example, we informally surveyed 16kindergarten and elementary school teachers about material usedto teach children to read bar graphs. In particular, we showed
teachers Graphs A and B in Figure 1 and asked them whether theywould use similar graphs in their teaching and which of the twographs would be more effective. All 16 teachers indicated that theywould use graphs with columns of colorful objects in their teach-ing, with 14 of the teachers responding that such graphs would bemore effective for teaching than graphs with monochromatic barswith no objects. Two teachers responded that they would not usethe monochromatic graphs at all.
However, there is a note of caution: Although such addedpictorial information may be visually appealing, such informationmay hinder, rather than facilitate, learning and/or transfer. This isbecause this information is often extraneous to the learning task,and it may also prompt well-learned strategies with unclear con-sequences on the to-be-learned ones. For example, items presentedin Figures 1A and 1C may prompt counting, which is not anappropriate strategy for reading graphs. The inclusion of suchextraneous information may be particularly problematic for chil-dren whose ability to control attention, filter irrelevant informa-tion, and inhibit prepotent responses is quite limited (see Hanania& Smith, 2010, for a review). Therefore, it is possible that suchextraneous information may capture attention and prevent chil-dren from focusing on less salient to-be-learned structure orinvite prepotent, well-learned strategies instead of newly pre-sented strategies.
The goal of the present research was to examine how suchextraneous perceptual information affects learning and how theseeffects change with development. We considered the case oflearning to read bar graphs that had extraneous pictures similar tothose in Figures 1A and 1C. Bar graphs present an interesting casefor two reasons. First, bar graphs are a case of learning a relation(graphs depict a relation between two variables), and learning ofrelations is an important and challenging task during preschool andelementary school years (e.g., Goswami, 2001; Rattermann &Gentner, 1998). Second, bar graphs are an important real-life case
This article was published Online First December 17, 2012.Jennifer A. Kaminski and Vladimir M. Sloutsky, Department of Psy-
chology and Center for Cognitive Science, The Ohio State University.This research was supported by Institute of Educational Sciences, U.S.
Department of Education Grant R305B070407 and National Science Foun-dation Grant BCS-0720135. The opinions expressed herein are those of theauthors and do not necessarily reflect the views of the Department ofEducation or the National Science Foundation. We thank Catherine Bestand Anna Fisher for their helpful comments on this research.
Correspondence concerning this article should be addressed to Jennifer A.Kaminski, Department of Psychology, The Ohio State University, 225 Psy-chology Building, 1835 Neil Avenue, Columbus, Ohio 43210. E-mail:[email protected]
Thi
sdo
cum
ent
isco
pyri
ghte
dby
the
Am
eric
anPs
ycho
logi
cal
Ass
ocia
tion
oron
eof
itsal
lied
publ
ishe
rs.
Thi
sar
ticle
isin
tend
edso
lely
for
the
pers
onal
use
ofth
ein
divi
dual
user
and
isno
tto
bedi
ssem
inat
edbr
oadl
y.
Journal of Educational Psychology © 2012 American Psychological Association2013, Vol. 105, No. 2, 351–363 0022-0663/13/$12.00 DOI: 10.1037/a0031040
351

as they are part of elementary school curriculum (National Councilof Teachers of Mathematics, 2000). Prior studies have investigatedaspects of instruction that affect students’ complex interpretationsof graphs, such as noticing trends and interactions in the data(Kramarski, 2004; Shah & Hoeffner, 2002; Wainer, 1980, 1992).However, less is known about how variations in format affectyoung elementary students’ basic graph reading ability, namelytheir ability to link a correct y-axis value with a specific x-axisvalue. In particular, how will children integrate and weigh task-relevant relational information and task-irrelevant (or extraneous)perceptual information?
Previous research suggests that children often have difficultyattending to relations and instead focus on superficial features(Gentner, 1988; Rattermann & Gentner, 1998). With development,they become increasingly capable of acquiring complex relationalknowledge, such as basic arithmetic. Improvements in relationalreasoning are largely driven by increases in domain knowledge(Goswami, 1992, 2001; Goswami & Brown, 1990) and in workingmemory capacity (Andrews & Halford, 2002; Halford, 1993;Richland, Morrison, & Holyoak, 2006). However, developmentper se does not guarantee successful relational reasoning. Whenrelations are more complex than those involved in simple analo-
gies or metaphors (which is often the case with mathematicalconcepts), even adults can fail to recognize and transfer learnedrelations to novel contexts (Gick & Holyoak, 1980, 1983; Gos-wami, 1991; Kaminski, Sloutsky, & Heckler, 2008; Novick, 1988;Reed, Dempster, & Ettinger, 1985; Reed, Ernst, & Banerji, 1974).
Although complex relational knowledge is generally difficult totransfer, the format of the learning material can affect the likeli-hood of successful transfer. Undergraduate students who learned anovel mathematical concept from a generic, perceptually sparselearning format demonstrated better transfer than students wholearned from a perceptually rich format (Sloutsky, Kaminski, &Heckler, 2005). There is also evidence that perceptually richlearning formats can hinder transfer of the nonmathematical rela-tions (Goldstone & Sakamoto, 2003) as well as problem solving(McNeil, Uttal, Jarvin, & Sternberg, 2009). As we argued above,this is because examples used in this format communicate consid-erable extraneous information to the learner (see Kaminski &Sloutsky, 2011, for discussion), and this irrelevant informationmay be difficult for the learner to inhibit and filter.
The inclusion of extraneous information in learning of mathe-matics may be particularly detrimental for young children. First,mathematical knowledge is often relational in nature, and relations
Figure 1. Sample stimuli: Graphs A and C were used in the extraneous information condition, and Graphs Band D were used in the no extraneous information condition. Graphs A and B were the example graphs shownin the Training phase, and Graphs C and D were test graphs shown in the Condition-Specific Test for eachcondition.
Thi
sdo
cum
ent
isco
pyri
ghte
dby
the
Am
eric
anPs
ycho
logi
cal
Ass
ocia
tion
oron
eof
itsal
lied
publ
ishe
rs.
Thi
sar
ticle
isin
tend
edso
lely
for
the
pers
onal
use
ofth
ein
divi
dual
user
and
isno
tto
bedi
ssem
inat
edbr
oadl
y.
352 KAMINSKI AND SLOUTSKY
are less salient than objects (e.g., Gentner, 1988). Adding extra-neous superficial information increases the disparity in saliencebetween the relevant relations and the superficial features. Second,filtering of irrelevant, potentially distracting information is partic-ularly difficult for preschool and even elementary school children(Kemler, 1982; Shepp & Swartz, 1976; Smith & Kemler, 1978; seealso Hanania & Smith, 2010). For example, Shepp and Swartz(1976) instructed 6- and 9-year-olds to sort items according toshape, with color being an irrelevant dimension. It was found that6-year-olds (but not 9-year-olds) were slower when color variedindependently of shape than when color covaried with shape or didnot vary at all. Therefore, the task-irrelevant dimension affectedperformance of younger, but not older participants. Similarly,Napolitano and Sloutsky (2004) demonstrated that 4-year-oldshave difficulty performing same–different discrimination with se-rially presented visual stimuli, when sounds accompanying thesevisual stimuli varied independently (see also Robinson & Sloutsky,2004).
In addition, young children often experience difficulty inhibitinga previously learned response when a new response is needed (seeHanania & Smith, 2010; Plude, Enns, & Brodeur, 1994, for re-views). Although this ability improves with development (David-son, Amso, Anderson, & Diamond, 2006), even adults are notimmune to negative effects of such conflicts (Diamond &Kirkham, 2005; MacLleod, 1991). A variant of the difficulty toinhibit a well-learned response also transpires in the learning ofmathematics. Children often apply well-learned, highly practicedprocedures instead of to-be-learned ones. For example, childrenwere found to apply familiar, yet inappropriate, arithmetic strate-gies to solve mathematical equivalence problems (McNeil, 2007;McNeil & Alibali, 2005) and whole number addition procedures toadd fractions (Resnick & Ford, 1981).
In sum, in the context of extraneous information, successfullearning (including learning of many mathematical concepts andprocedures) may require attentional filtering and inhibitory controlthat may not be sufficiently developed in children. As a result,extraneous pictures that are intended to make learning materialvisually more appealing may actually hinder learning by eitherdistracting from relational information or by prompting a well-learned, yet potentially inappropriate, strategy. Furthermore, giventhat the ability to filter irrelevant information and inhibit prepotentresponses develops between preschool and late elementaryschool (Shepp & Swartz, 1976; see also Hanania & Smith,2010; Plude et al., 1994, for reviews), we expect that theseeffects should reduce with age. Both hypotheses were tested inthe four reported experiments.
Experiment 1
Method
Participants. Participants were 122 students recruited frompublic and private schools in suburbs of Columbus, Ohio, on thebasis of returned parental consent forms. The majority of partici-pants were Caucasian from middle-class families. Students were inkindergarten (20 girls, 20 boys; M � 6.26 years, SD � 0.32), firstgrade (18 girls, 24 boys; M � 7.16 years, SD � 0.40), and secondgrade (20 girls, 20 boys; M � 8.24 years, SD � 0.38).
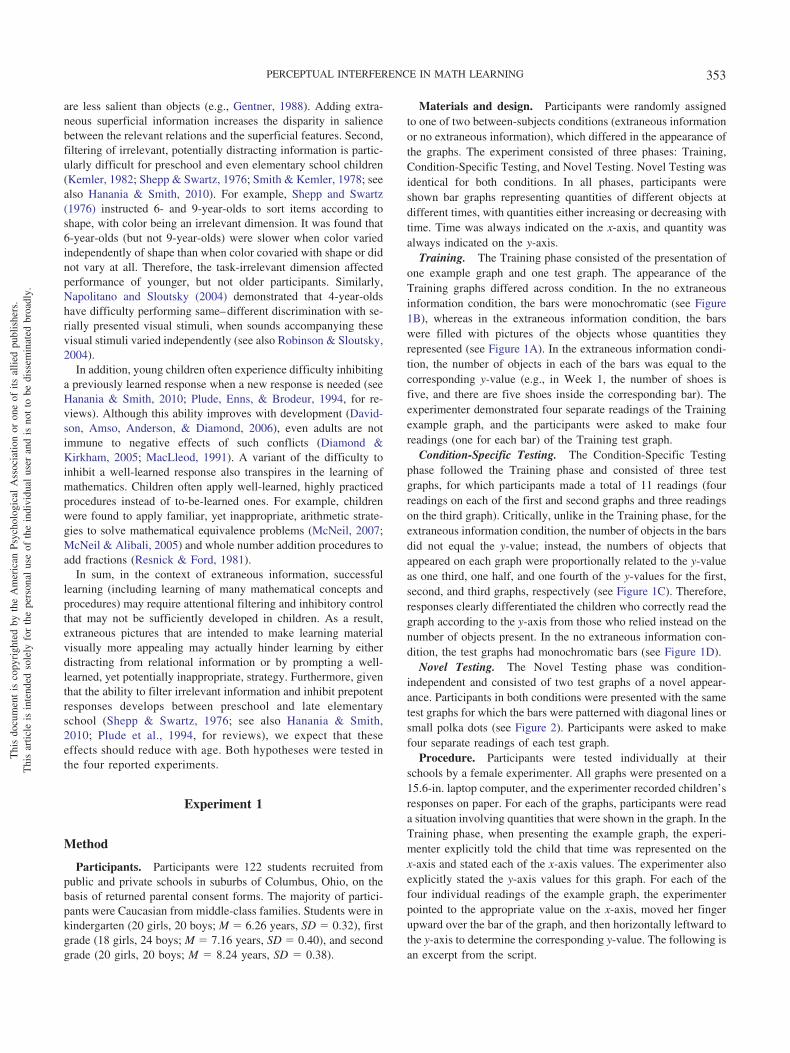
Materials and design. Participants were randomly assignedto one of two between-subjects conditions (extraneous informationor no extraneous information), which differed in the appearance ofthe graphs. The experiment consisted of three phases: Training,Condition-Specific Testing, and Novel Testing. Novel Testing wasidentical for both conditions. In all phases, participants wereshown bar graphs representing quantities of different objects atdifferent times, with quantities either increasing or decreasing withtime. Time was always indicated on the x-axis, and quantity wasalways indicated on the y-axis.
Training. The Training phase consisted of the presentation ofone example graph and one test graph. The appearance of theTraining graphs differed across condition. In the no extraneousinformation condition, the bars were monochromatic (see Figure1B), whereas in the extraneous information condition, the barswere filled with pictures of the objects whose quantities theyrepresented (see Figure 1A). In the extraneous information condi-tion, the number of objects in each of the bars was equal to thecorresponding y-value (e.g., in Week 1, the number of shoes isfive, and there are five shoes inside the corresponding bar). Theexperimenter demonstrated four separate readings of the Trainingexample graph, and the participants were asked to make fourreadings (one for each bar) of the Training test graph.
Condition-Specific Testing. The Condition-Specific Testingphase followed the Training phase and consisted of three testgraphs, for which participants made a total of 11 readings (fourreadings on each of the first and second graphs and three readingson the third graph). Critically, unlike in the Training phase, for theextraneous information condition, the number of objects in the barsdid not equal the y-value; instead, the numbers of objects thatappeared on each graph were proportionally related to the y-valueas one third, one half, and one fourth of the y-values for the first,second, and third graphs, respectively (see Figure 1C). Therefore,responses clearly differentiated the children who correctly read thegraph according to the y-axis from those who relied instead on thenumber of objects present. In the no extraneous information con-dition, the test graphs had monochromatic bars (see Figure 1D).
Novel Testing. The Novel Testing phase was condition-independent and consisted of two test graphs of a novel appear-ance. Participants in both conditions were presented with the sametest graphs for which the bars were patterned with diagonal lines orsmall polka dots (see Figure 2). Participants were asked to makefour separate readings of each test graph.
Procedure. Participants were tested individually at theirschools by a female experimenter. All graphs were presented on a15.6-in. laptop computer, and the experimenter recorded children’sresponses on paper. For each of the graphs, participants were reada situation involving quantities that were shown in the graph. In theTraining phase, when presenting the example graph, the experi-menter explicitly told the child that time was represented on thex-axis and stated each of the x-axis values. The experimenter alsoexplicitly stated the y-axis values for this graph. For each of thefour individual readings of the example graph, the experimenterpointed to the appropriate value on the x-axis, moved her fingerupward over the bar of the graph, and then horizontally leftward tothe y-axis to determine the corresponding y-value. The following isan excerpt from the script.
Thi
sdo
cum
ent
isco
pyri
ghte
dby
the
Am
eric
anPs
ycho
logi
cal
Ass
ocia
tion
oron
eof
itsal
lied
publ
ishe
rs.
Thi
sar
ticle
isin
tend
edso
lely
for
the
pers
onal
use
ofth
ein
divi
dual
user
and
isno
tto
bedi
ssem
inat
edbr
oadl
y.
353PERCEPTUAL INTERFERENCE IN MATH LEARNING

These bottom numbers (the experimenter gestured across the bottom)stand for the week number. . . 1 for the 1st week, 2 for the 2nd week,3rd week and 4th week (the experimenter pointed to each individuallyas she spoke). These numbers here (the experimenter gestured to they-axis) stand for the number of shoes in the lost and found. So, for the1st week (the experimenter pointed to the 1 on the x-axis) there were(the experimenter gestured upward over the bar then left to the y-axis)five shoes in the lost and found.
For each test graph in the Training phase, Condition-SpecificTesting phase, and the Novel Testing phase, the experimenter readthe scenario and explicitly told the participant what quantities thegraph was showing (e.g., the number of flowers over severalweeks). Then participants were asked to state the quantity for eachindicated time point. No corrective feedback was given duringtraining or testing.
Results
Responses within one unit of the correct y-value were consid-ered to be correct, in order to credit participants who were using acorrect graph reading strategy but made small errors in reading thevalue on the y-axis. Note that in this and other experimentsreported here, the overall patterns remain the same and reportedeffects remain significant with or without this adjustment.
Training phase. In both the extraneous information and no-extraneous information conditions, participants in all age groupsdid well reading the Training phase test graph (M � 100.0%, SD �0.0% for second graders; M � 95.0%, SD � 22.4% for firstgraders; and M � 75.0%, SD � 37.2% for kindergarteners in theno extraneous information condition; and M � 95.0%, SD �17.4% for second graders; M � 98.9%, SD � 5.33% for firstgraders; and M � 86.3%, SD � 25.0% for kindergarteners in theextraneous information condition). An analysis of variance withcondition and grade level as factors revealed a significant effect ofgrade level, F(2, 116) � 7.96, p � .002, with first and secondgraders being more accurate than kindergarteners (post hocTukey’s, ps � .003). There was no significant effect of conditionor interaction (ps � .24).
Note that for the Training phase test graph, the number ofobjects inside each bar in the extraneous information conditionwas equal to the y-value. Therefore, participants in the extraneousinformation condition could respond accurately either by counting
the objects in the appropriate bars or by reading the y-axis corre-sponding to the appropriate bars.
Condition-Specific Test phase. There were striking differ-ences in accuracy between conditions on the Condition-SpecificTest. For these graphs, the number of countable objects in the barsfor the extraneous information condition was not equal to they-value, resulting in incorrect responses from participants whocounted these objects. Data across conditions and grade levelswere not normally distributed. Therefore, we categorized partici-pants on the basis of their predominant type of responses into oneof three graph-reading strategies: correct, counting, or other. Ifgreater than 50% of a participant’s responses were correct, then heor she was categorized as a correct strategy user. The meanaccuracy in this group for all ages and conditions was high,exceeding 89% (the same is true for the Novel Tests). Otherwise,if at least 50% of responses were based on the cardinality of theextraneous objects present in the bars, then the participant wascategorized as a counting strategy user. Participants who did notfall into correct or counting categories were categorized as usingother strategies. Responses from children in the other group ap-peared arbitrary. The mean accuracy for all ages and conditions inthe latter two groups did not exceed 25% (the same is true for theNovel Tests).
Figure 3 presents the percentage of participants who used eachof the strategy types and also the mean accuracy for all participantson the Condition-Specific Test. All first- and second-grade partic-ipants and 75% of kindergarten participants in the no extraneousinformation condition appropriately read the graphs. However, thiswas not true for the extraneous information condition in which90% of kindergarteners and 72% of first graders responded bycounting the objects. Differences in the number of correct strategyusers were analyzed using an asymmetric log-linear analysis(Kennedy, 1992), with strategy type (correct or incorrect) as thedependent variable and condition and grade level as factors. Bothcondition and grade level were significant, �2(1, N � 122) � 55.3,p � .01; and, �2(2, N � 122) � 26.4, p � .01, respectively (.05was added to cells with zero frequency). Older children were moreaccurate than younger children, �2(1, N � 82) � 3.09, p � .05,one-tailed test between kindergarteners and first graders; and,�2(1, N � 82) � 5.56, p � .01, one-tailed test between first gradersand second graders.
Figure 2. Novel Test Stimuli: Condition-independent Testing phase test graphs used in both the extraneousinformation and no extraneous information conditions.
Thi
sdo
cum
ent
isco
pyri
ghte
dby
the
Am
eric
anPs
ycho
logi
cal
Ass
ocia
tion
oron
eof
itsal
lied
publ
ishe
rs.
Thi
sar
ticle
isin
tend
edso
lely
for
the
pers
onal
use
ofth
ein
divi
dual
user
and
isno
tto
bedi
ssem
inat
edbr
oadl
y.
354 KAMINSKI AND SLOUTSKY

Novel Test phase. Not only did many participants in theextraneous information condition count the discrete objects whenpresent, but many of these participants also failed to appropriatelyread the Novel Test graphs (i.e., patterned bars). Figure 4 presentsthe percentage of participants who used each of the strategy typesand also the mean accuracy for all participants on the Novel Test.To our surprise, many participants attempted to count the smallstripes or polka dots on the bars, or they counted the horizontallines present on the graph without considering the correspondingvalue on the y-axis. The remainder of participants who did not readthe graphs accurately made arbitrary responses. However, in the noextraneous information condition, all first and second graders and75% of kindergarteners accurately read these graphs. An asym-metric log-linear analysis with strategy type (correct or incorrect)as the dependent variable and condition and grade level as factorsrevealed differences across condition to be significant, �2(1, N �122) � 11.1, p � .01. Grade level was also a significant factor,�2(2, N � 122) � 25.6, p � .01. First graders were more accurate
than kindergarteners, �2(1, N � 82) � 9.76, p � .01, and secondgraders were marginally more accurate than first graders, �2(1,N � 82) � 2.67, p � .051.
These results suggest that task-irrelevant, extraneous informa-tion interferes with learning, and these interference effects de-crease with development. The presence of the discrete objectsencouraged many kindergarten and first graders to count the ob-jects instead of appropriately reading the graphs using the y-axis.Not only did these participants fail to use an appropriate strategyin the presence of these objects, many of them attempted to usecounting strategies on the Novel Test graphs with the patternedbars. Others responded with arbitrary answers when there was nocountable information present, suggesting that they failed to learn.Although it appears that the presence of these objects alone dis-tracted participants from learning and using an appropriate graph-reading strategy, one could argue that the presence of the objectsthemselves is not harmful per se; rather, it is the conflict betweenthe number of objects and the corresponding y-value that hindered
A B
0
20
40
60
80
100
Extr No Extr
Extr No Extr
Extr No Extr
Perc
ent o
f par
�ci
pant
sOtherCoun�ngCorrect
StrategyType
0
20
40
60
80
100
K 1st 2nd
Mea
n pe
rcen
t cor
rect
Extran
No Extran
Condi�on
K 1st 2nd
Figure 3. Performance on Condition-Specific Test in Experiment 1 split by condition and grade level. PanelA shows the percentage of participants performing each graph-reading strategy type. Panel B shows meanpercent correct for all participants. Bars represent standard error of the mean. K � Kindergarten; 1st � firstgrade; 2nd � second grade; Extr � Extraneous; No Extr � No Extraneous; Extran � Extraneous; No Extran �No Extraneous.
A B
0
20
40
60
80
100
Extr No Extr
Extr No Extr
Extr No Extr
Perc
ent o
f Par
�ci
pant
s
OtherCoun�ngCorrect
StrategyType
0
20
40
60
80
100
K 1st 2nd
Mea
n Pe
rcen
t Cor
rect
Extran
No Extran
Condi�on
K 1st 2nd
Figure 4. Performance on the Novel Test in Experiment 1 split by condition and grade level. Panel A showsthe percentage of participants performing each graph-reading strategy type. Panel B shows mean percent correctfor all participants. Bars represent standard error of the mean. K � Kindergarten; 1st � first grade; 2nd � secondgrade; Extr � Extraneous; No Extr � No Extraneous; Extran � Extraneous; No Extran � No Extraneous.
Thi
sdo
cum
ent
isco
pyri
ghte
dby
the
Am
eric
anPs
ycho
logi
cal
Ass
ocia
tion
oron
eof
itsal
lied
publ
ishe
rs.
Thi
sar
ticle
isin
tend
edso
lely
for
the
pers
onal
use
ofth
ein
divi
dual
user
and
isno
tto
bedi
ssem
inat
edbr
oadl
y.
355PERCEPTUAL INTERFERENCE IN MATH LEARNING
performance. Perhaps when these two pieces of information are inagreement, the objects may not hinder learning and may evenfacilitate learning by underscoring the fact that the bars representquantities.
The purpose of Experiment 2 was to consider this possibility. Inthis experiment, the number of countable objects in a graph neverconflicted with the corresponding y-value during the Trainingphase and the Condition-Specific Testing phase. Also, we onlyconsidered kindergarteners and first graders because the effect ofthe extraneous information was most pronounced for these two agegroups.
Experiment 2
Method
Participants. Eighty-six students participated in the study.Students were in kindergarten (19 girls, 23 boys; M � 6.14 years,SD � 0.32) and first grade (26 girls, 18 boys; M � 7.10 years,SD � 0.37).
Materials and design. The material, design, and procedurewere similar to those of Experiment 1, with one critical difference:Unlike Experiment 1, for the Condition-Specific Test in the extra-neous information condition, the number of objects in each bar ofthe graphs equaled the corresponding y-value. Therefore, in theextraneous information condition, the cardinality of the extraneousobjects never conflicted with the y-value. The actual numbers ofthe objects shown were the same as those in Experiment 1, but they-values were set equal to these cardinalities. The same y-axisscale was used for both the extraneous information condition andthe no extraneous information condition.
Results
Because the number of extraneous objects was equal to they-value for the test graphs in the Training phase as well as theCondition-Specific Test phase, responses to these questions werenot separated as in Experiment 1, but were analyzed together as theCondition-Specific Test responses.
Condition-Specific Test. In both the extraneous informationand no extraneous information conditions, participants in bothage groups did well reading the Condition-Specific graphs (M �98.8%, SD � 2.63% for first graders, and M � 94.5%, SD �20.0% for kindergarteners in the no extraneous information con-dition; and M � 97.6%, SD � 5.26% for first graders, and M �92.7%, SD � 8.35% for kindergarteners in the extraneous infor-mation condition). An analysis of variance with condition andgrade level as factors revealed no significant effect of conditionand no significant interaction (ps � .052). There was a marginaleffect of grade level, F(1, 82) � 3.52, p � .064, with first gradersappearing slightly more accurate than kindergarteners. Therefore,similar to results with the Training Test graphs in Experiment 1,when the extraneous information does not conflict with the rele-vant y-values, participants accurately interpreted the graphs.
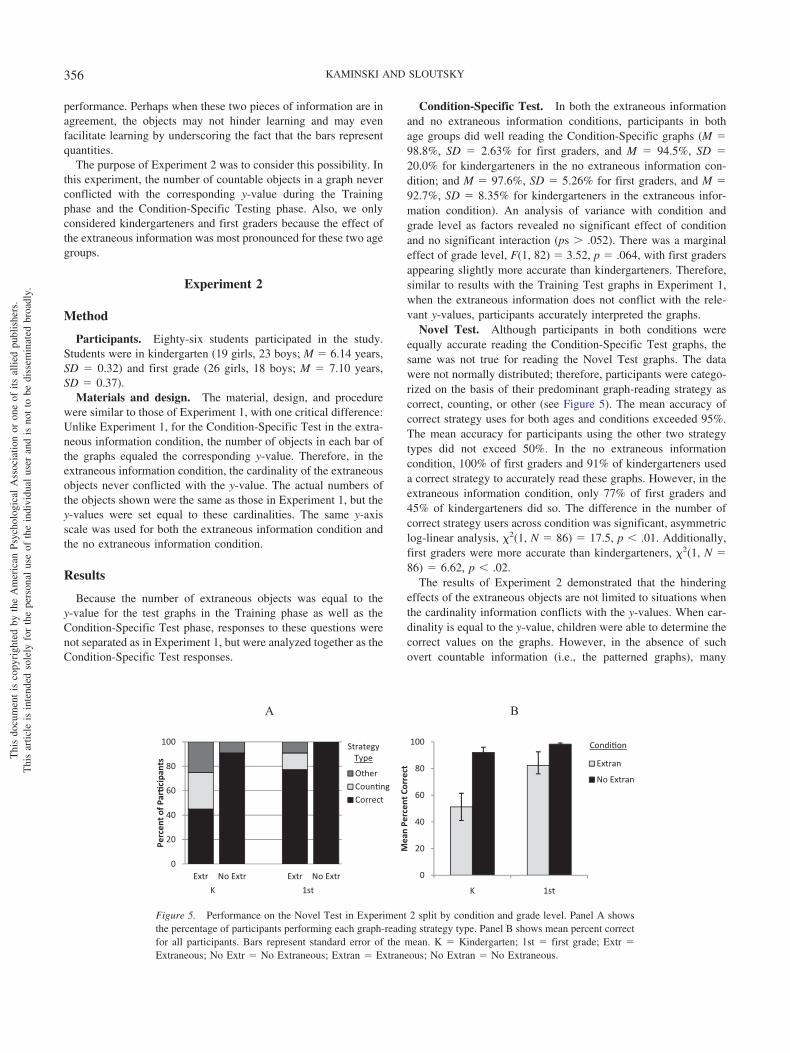
Novel Test. Although participants in both conditions wereequally accurate reading the Condition-Specific Test graphs, thesame was not true for reading the Novel Test graphs. The datawere not normally distributed; therefore, participants were catego-rized on the basis of their predominant graph-reading strategy ascorrect, counting, or other (see Figure 5). The mean accuracy ofcorrect strategy uses for both ages and conditions exceeded 95%.The mean accuracy for participants using the other two strategytypes did not exceed 50%. In the no extraneous informationcondition, 100% of first graders and 91% of kindergarteners useda correct strategy to accurately read these graphs. However, in theextraneous information condition, only 77% of first graders and45% of kindergarteners did so. The difference in the number ofcorrect strategy users across condition was significant, asymmetriclog-linear analysis, �2(1, N � 86) � 17.5, p � .01. Additionally,first graders were more accurate than kindergarteners, �2(1, N �86) � 6.62, p � .02.
The results of Experiment 2 demonstrated that the hinderingeffects of the extraneous objects are not limited to situations whenthe cardinality information conflicts with the y-values. When car-dinality is equal to the y-value, children were able to determine thecorrect values on the graphs. However, in the absence of suchovert countable information (i.e., the patterned graphs), many
A B
0
20
40
60
80
100
Extr No Extr Extr No Extr
Perc
ent o
f Par
�ci
pant
s
OtherCoun�ngCorrect
StrategyType
0
20
40
60
80
100
K 1st
Mea
n Pe
rcen
t Cor
rect
Extran
No Extran
Condi�on
K 1st
Figure 5. Performance on the Novel Test in Experiment 2 split by condition and grade level. Panel A showsthe percentage of participants performing each graph-reading strategy type. Panel B shows mean percent correctfor all participants. Bars represent standard error of the mean. K � Kindergarten; 1st � first grade; Extr �Extraneous; No Extr � No Extraneous; Extran � Extraneous; No Extran � No Extraneous.
Thi
sdo
cum
ent
isco
pyri
ghte
dby
the
Am
eric
anPs
ycho
logi
cal
Ass
ocia
tion
oron
eof
itsal
lied
publ
ishe
rs.
Thi
sar
ticle
isin
tend
edso
lely
for
the
pers
onal
use
ofth
ein
divi
dual
user
and
isno
tto
bedi
ssem
inat
edbr
oadl
y.
356 KAMINSKI AND SLOUTSKY

children appear unable to correctly interpret the graphs. It seemsthat many children merely counted the objects they saw and failedto learn a correct graph-reading procedure.
The results of both Experiments 1 and 2 suggest that participantsin the extraneous conditions did not learn to correctly read bargraphs. However, it may be that these participants actually didlearn a correct graph-reading strategy, but noticed the equivalenceof the y-values and the number of objects present on the examplegraph during the training phase and subsequently relied on acounting strategy in the presence of countable objects. They mayalso have overgeneralized this strategy to the novel test graphs,leading many to attempt to count aspects of the patterns (i.e., thestrips or the dots). If this possibility is true, then the extraneousinformation may not have hindered learning; it may only havehindered performance by encouraging participants to count whencountable objects or features were present. Furthermore, if partic-ipants in the extraneous information condition actually did learnhow to read graphs correctly, then asking them to read graphs withmonochromatic bars would be the optimal condition for them to doso. Graphs with monochromatic bars lack salient countable objectsand features and therefore would eliminate or minimize the temp-tation to count.
The goal of Experiment 3 was to parse out the effect of theextraneous information on participants’ performance and on par-ticipants’ learning by testing all participants on graphs with mono-chromatic bars, patterned bars (i.e., stripes and dots as in theprevious experiments), and bars with extraneous information (i.e.,countable objects for which the number of objects conflicts withthe y-value). If the extraneous information hinders only perfor-mance and not learning, then scores on the monochromatic graphsand countable object graphs should be comparable for participantsin the extraneous information condition and participants in the noextraneous information condition. The absence of overtly count-able extraneous objects on the monochromatic bars should encour-age participants in either condition to use a proper graph-readingstrategy if one had been learned. Alternatively, if the extraneousinformation hinders learning of the correct graph-reading strategy,scores on the monochromatic graphs should be lower for partici-pants in the extraneous information condition than for those in theno extraneous information condition. Also, the presence of theseobjects on the graphs with extraneous information may encourageparticipants in the no extraneous information condition to use acounting strategy even though they have learned the appropriategraph-reading strategy. If this is the case, then it suggests that theextraneous information hinders performance even when a correctstrategy was learned. Experiment 3 considered only kindergarten-ers as the effect of the extraneous information was most pro-nounced for this group of children.
Experiment 3
Method
Participants. Forty-four kindergarten students (21 girls, 23boys; M � 6.29 years, SD � 0.39) participated in the study.
Materials and design. As in the previous experiments, therewere two between-subject conditions, extraneous information andno extraneous information, which specified the appearance of thegraphs that participants saw. In the extraneous information condi-
tion, the bars of the graphs had countable objects. In the no-extraneous information condition, the bars were monochromatic.
The experiment consisted of three phases: Training, Condition-Specific Testing, and General Testing. Training and Condition-Specific Testing were identical to Experiment 2. The GeneralTesting was identical for the extraneous information condition andthe no extraneous information condition and consisted of six testgraphs with four readings each. Two of the six graphs presentedpatterned bars (i.e., the novel test graphs used in the previousexperiments), two other graphs presented monochromatic bars,and the remaining two graphs presented bars filled with pictures ofcountable objects where the number of objects was not equal to thecorresponding y-value. These six graphs were presented to partic-ipants in a random order.
Results
Responses within one unit of the correct y-value were consid-ered to be correct, in order to credit participants who were using acorrect graph-reading strategy but made small errors in reading thevalue on the y-axis.
Condition-Specific Test. In both the extraneous informationand no extraneous information conditions, participants in both agegroups did well reading the Condition-Specific graphs (M �92.7%, SD � 12.7% in the no extraneous information condition;and M � 91.5%, SD � 14.7% in the extraneous informationcondition). There were no significant differences in accuracy be-tween conditions (independent-samples t test), t(42) � .293, p �.771. As in the previous experiment, the extraneous informationdid not conflict with the y-values; therefore, participants in theextraneous information condition could arrive at the correct re-sponses either through a correct graph-reading strategy or thoughcounting the objects present.
General Test. The data for performance on the monochro-matic graphs, patterned graphs, and countable object graphs wasnot normally distributed. Therefore, participants were categorizedon the basis of their predominant graph-reading strategy as correct,counting, or other as done in the previous experiments. In bothconditions and for all test graphs, the mean accuracy for partici-pants categorized as correct strategy users exceeded 87%; themean accuracy for participants in the other categories was below50%.
Mean scores and frequency of strategies are presented in Figure6. A repeated measures binary logistic regression was conducted toexamine effects of training condition and test graph type on correctstrategy use. There was a significant effect of condition, Wald�2(1, N � 44) � 12.5, p � .001. For all three types of graphs, ahigher percentage of participants in the no extraneous informationcondition than in the extraneous information condition used acorrect graph-reading strategy, Pearson’s �2(1, N � 44) � 5.93,ps � .02. Test graph type also had a significant effect on strategyuse, Wald �2(2, N � 44) � 15.8, p � .001. Participants were morelikely to use a correct strategy on the monochromatic than on thecountable graphs, Wald �2(1, N � 44) � 15.3, p � .001, and theywere more likely to use a correct strategy on the patterned than onthe countable graphs, Wald �2(1, N � 44) � 11.6, p � .002.
When asked to read monochromatic graphs, many participantsin the extraneous information condition failed to do so. Even in theabsence of salient countable objects, 14% of participants re-
Thi
sdo
cum
ent
isco
pyri
ghte
dby
the
Am
eric
anPs
ycho
logi
cal
Ass
ocia
tion
oron
eof
itsal
lied
publ
ishe
rs.
Thi
sar
ticle
isin
tend
edso
lely
for
the
pers
onal
use
ofth
ein
divi
dual
user
and
isno
tto
bedi
ssem
inat
edbr
oadl
y.
357PERCEPTUAL INTERFERENCE IN MATH LEARNING

sponded by counting the horizontal lines through the graphs.Another 23% made arbitrary responses to these graphs. Theseresults support the argument that the extraneous information hin-dered learning; it appears that 37% of participants in the extrane-ous information condition failed to learn a correct graph-readingstrategy, whereas only 5% of participants in the no extraneousinformation condition did not learn. This difference was significant(Fisher’s exact test, p � .02).
Although a majority of participants in the no extraneous infor-mation condition accurately read the monochromatic and patternedgraphs, they were not all immune to the distraction of the count-able objects; 22% responded to countable object graphs by count-ing the objects. The number of participants in the no extraneousinformation condition who counted was significantly fewer thanthe number in the extraneous information condition (77%counted), Pearson’s �2(1, N � 44) � 11.0, p � .002. These resultssuggest that although the presence of countable objects does en-courage children to perform an incorrect strategy, they are lesslikely to do so if they initially learned a graph with monochromaticbars than if they initially learned a graph with extraneous objectson the bars.
The results of Experiment 3 suggest that the extraneous infor-mation hinders both learning and performance. On the monochro-matic graphs, the percentage of participants in the extraneousinformation condition who accurately read the graphs was 32points less than the percentage of participants in the no extraneousinformation condition (64% vs. 96%), suggesting that the extra-neous information hindered learning. When comparing perfor-mance on monochromatic graphs with performance on countableobject graphs for participants in the no extraneous informationcondition, there was a 19-point drop in percentage of participantsresponding correctly (96% vs. 77%), suggesting that the presenceof the extraneous objects hindered performance, even for partici-pants who acquired an accurate graph-reading strategy.
Although these results provide further evidence that the pres-ence of the extraneous information distracted children from learn-ing the relevant relational knowledge, there is an alternative ex-planation for the poor accuracy of participants in the extraneousinformation condition. It may be that these participants attended to
the relation between the x- and y-values on the example graph andnoticed the equivalence of the y-values and the number of objectspresent. Because the number of objects always agreed with theexperimenter’s reported values, participants may have learned torely on a counting strategy to read graphs and not on the appro-priate relation between the x- and y-values. Therefore, it may bethat the presence of the extraneous objects may not have hinderedlearning if participants did not observe that the number of objectscorresponded with the correct readings on the example they wereshown.
The purpose of Experiment 4 was to test this possibility. Thedesign of this experiment was identical to that of Experiment 3with one critical exception. The numbers of objects shown on thecolumns of the example graph did not equal the correspondingy-values. If performance was hindered not by the presence of theobjects themselves but by the fact that the number of objectsconcurred with the correct readings on the example graphs, thenperformance in the extraneous information condition should becomparable to that of the no extraneous information condition.
Experiment 4
Method
Participants. Forty kindergarten students (20 girls, 20 boys;M � 6.23 years, SD � 0.33) participated in the study.
Materials and design. As in the previous experiments, therewere two between-subject conditions, extraneous information andno extraneous information, which specified the appearance of thegraphs that participants saw. The experiment consisted of threephases: Training, Condition-Specific Testing, and General Testing.Training and Condition-Specific Testing were similar to those ofExperiments 2 and 3. However, the number of objects that ap-peared on the bars of the graphs in the Training and Condition-Specific Testing phases for the extraneous information conditionwas never equal to that of the corresponding y-values. The num-bers of objects on the example graph were half of the correspond-ing y-values. The numbers of objects on the Condition-SpecificTest graphs were one half, one third, one half, and one fourth of the
A B
0
20
40
60
80
100
Extr No Extr
Extr No Extr
Extr No Extr
Perc
ent o
f Par
�ci
pant
sOtherCoun�ngCorrect
StrategyType
0
20
40
60
80
100
Monochroma�c Pa�erned Countable
Mea
n Pe
rcen
t Cor
rect
Extr
No Extr
Condi�on
Monochroma�c Pa�erned Countable
Figure 6. Performance on the General Test in Experiment 3 split by condition and graph type. Panel A showsthe percentage of participants performing each graph-reading strategy type. Panel B shows mean percent correctfor all participants. Bars represent standard error of the mean. Extr � Extraneous; No Extr � No Extraneous.
Thi
sdo
cum
ent
isco
pyri
ghte
dby
the
Am
eric
anPs
ycho
logi
cal
Ass
ocia
tion
oron
eof
itsal
lied
publ
ishe
rs.
Thi
sar
ticle
isin
tend
edso
lely
for
the
pers
onal
use
ofth
ein
divi
dual
user
and
isno
tto
bedi
ssem
inat
edbr
oadl
y.
358 KAMINSKI AND SLOUTSKY

y-values for the first, second, third, and fourth graphs, respectively.The General Testing was the same for participants in both theextraneous information condition and the no extraneous informa-tion condition and identical to that of Experiment 3.
Results
Responses within one unit of the correct y-value were consid-ered to be correct, in order to credit participants who were using acorrect graph-reading strategy but made small errors in reading thevalue on the y-axis.
The data for performance on the condition-specific, monochro-matic, patterned, and countable object graphs were not normallydistributed. As in the previous experiments, participants werecategorized on the basis of their predominant graph-reading strat-egy as correct, counting, or other for each test graph. In bothconditions and for all test graphs, the mean accuracy for partici-pants categorized as correct strategy users was high, exceeding93%; the mean accuracy for participants in the other categorieswas below 50%. Figure 7 presents the frequencies of strategy typesand the mean percent correct collapsed across all strategy types.
Unlike the previous experiment, there was a marked differencebetween the extraneous information and no extraneous information
conditions in accuracy on the Condition-Specific graphs. Signifi-cantly more participants in the no extraneous information condi-tion used a correct strategy than those in the extraneous informa-tion condition (Fisher’s exact test, p � .03).
For the monochromatic graphs, patterned graphs, and countableobject graphs, a repeated measures binary logistic regression wasconducted to examine the effects of training condition and testgraph type on correct strategy use. The results reveal a significanteffect of training condition, �2(1, N � 44) � 3.87, p � .05, withno significant effect of test graph type, Wald �2(2, N � 44) �3.31, p � .191. The former effect indicated that across the testgraph types, a higher number of participants in the no extraneousinformation condition than in the extraneous information conditionused a correct strategy.
As in Experiment 3, the presence of the countable objectsencouraged a small number of participants (10%) in the no-extraneous information condition to respond by counting the ob-jects as opposed to correctly reading the graphs. However, 30% ofparticipants in the extraneous information condition responded tothese graphs by counting. The difference in frequency of correctstrategy use between the two conditions approached significance(Fisher’s exact test, p � .06).
0
20
40
60
80
100
Extr No Extr
Extr No Extr
Extr No Extr
Extr No Extr
Perc
ent o
f Par
�ci
pant
s
Other
Coun�ng
Correct
Strategy Type
0
20
40
60
80
100
Cond-Specific Monochroma�c Pa�erned Countable
Mea
n Pe
rcen
t Cor
rect
Extr
No Extr
Condi�on
Cond-Specific Monochroma�c Pa�erned Countable
Figure 7. Performance on the Condition-Specific (Cond-Specific) Test and General Test in Experiment 4 splitby training condition and test graph type. The top panel shows the percentage of participants performing eachgraph-reading strategy type. The bottom panel shows mean percent correct for all participants. Bars representstandard error of the mean. Extr � Extraneous; No Extr � No Extraneous.
Thi
sdo
cum
ent
isco
pyri
ghte
dby
the
Am
eric
anPs
ycho
logi
cal
Ass
ocia
tion
oron
eof
itsal
lied
publ
ishe
rs.
Thi
sar
ticle
isin
tend
edso
lely
for
the
pers
onal
use
ofth
ein
divi
dual
user
and
isno
tto
bedi
ssem
inat
edbr
oadl
y.
359PERCEPTUAL INTERFERENCE IN MATH LEARNING

Also similar to the previous experiment, many participants inthe extraneous information condition failed to correctly read themonochromatic graphs; 15% responded by counting the horizontallines through the graphs, and another 10% made arbitrary re-sponses to these graphs. These results suggest that 25% of partic-ipants in the extraneous information condition failed to learn tocorrectly read bar graphs. In the no extraneous information con-dition, only 5% of participants did not read the graphs correctly.The difference in number of correct graph readers between the twoconditions also approached significance (Fisher’s exact test, p �.09).
Compared with the results of Experiment 3, more participants inthe extraneous information condition of Experiment 4 learned toread the graphs correctly. To compare failure rates across the twoexperiments, the risk difference of failing to learn in the extraneousinformation condition versus failing to learn in the no extraneousinformation condition was used as a measure of effect size (seeFerguson, 2009). The risk difference in Experiment 3 was 32%(37% failure rate in the extraneous information condition vs. 5% inthe no extraneous information condition), whereas the risk differ-ence of Experiment 4 is 20% (25% failure rate in the extraneousinformation condition vs. 5% in the no extraneous informationcondition). The reduction in failure rate suggest that presentinggraphs in which the number of objects did not equal the corre-sponding y-values enabled more children to learn than when thenumber of objects equaled the y-values.
General Discussion
The goal of the present research was to examine how extraneousperceptual information affects acquisition of simple mathematicalknowledge by children. The results of Experiments 1 and 2 dem-onstrate that when discrete objects were depicted on the bars of agraph, the majority of children failed to read the graphs accuratelyand instead based their responses on the number of objects present.Not only did many participants respond by counting the objectswhen present, many of these children continued to use a countingstrategy when shown the subsequent patterned graphs, basing theirresponses on extraneous features of the graph such as the numberof stripes or dots. However, children who initially saw monochro-matic bars accurately read these graphs.
The results also reveal a developmental trend with first andsecond graders (i.e., 7- and 8-year-olds) more accurately readingthe graphs than kindergarteners (i.e., 6-year-olds), suggesting thatolder children are more capable of learning and using an appro-priate procedure in the face of extraneous information. The betterperformance of the older participants is likely to stem from twofactors. First, development leads to improvements in inhibitorycontrol (Hanania & Smith, 2010; Plude et al., 1994; Shepp &Swartz, 1976), which is likely to increase children’s ability to filterextraneous information and focus on relevant information. Second,the older children (i.e., first and second graders) may have hadexperience with bar graphs in school.
The results of Experiment 2 demonstrate that the difficultyintroduced by the extraneous pictures is not limited to test situa-tions when the extraneous and relevant information are in conflict.These findings suggest that it is not necessarily the conflict be-tween information during testing that hindered children, but theconflict that arose during learning between possible procedures:
the to-be-learned graph-reading procedure and the well-learnedcounting procedure activated by the presence of the discreteobjects.
Experiments 3 and 4 eliminate two alternative explanations forthe poor performance of participants in the extraneous informationconditions. Experiment 3 considered the possibility that the extra-neous objects did not hinder learning, but hindered performance byencouraging a counting strategy when salient countable objects orfeatures were present. Participants were tested on graphs withsimple monochromatic bars as well as graphs with countableobjects. The results were that performance in both the extraneousinformation and the no extraneous information conditions wasbetter on graphs with monochromatic bars than on the graphs withcountable objects; this suggests that the presence of the objects canhinder performance even for those in the no extraneous informa-tion condition who demonstrated correct graph reading. In addi-tion, performance on the graphs with monochromatic bars wassignificantly lower in the extraneous information condition than inthe no extraneous information condition, suggesting that the pres-ence of the objects does hinder learning.
The goal of Experiment 4 was to examine the possibility thatlearning was not hindered by the presence of the objects per se butrather by the fact that the numbers of objects shown on theexample graph always equaled the corresponding y-values. It maybe that participants in the extraneous information condition didinitially attend to the relation between the x- and y-values, butrelied instead on a counting strategy because they observed thatsuch a strategy led to correct readings of the example graph. Theresults demonstrate that when participants were shown an examplegraph for which they could not rely on counting the numbers ofobjects to arrive at a correct reading, subsequent performance wasstill lower in comparison to participants who were shown anexample graph with monochromatic bars. These results providefurther support for the argument that the extraneous informationhindered learning.
Although graph-reading performance in Experiment 4 waslower for participants in the extraneous information condition thanthose in the no extraneous information condition, a comparison ofrisk differences (i.e., a measure of failure rate attributable to theextraneous information) between Experiments 3 and 4 suggeststhat the negative effect of the extraneous information is attenuatedwhen this information is in conflict with the alternative strategy(i.e., counting). It may be that participants who noticed the conflictbetween the number of objects and the corresponding y-valueredirected their attention to the relevant relation between thex-values and the y-values. These findings are perhaps counterin-tuitive because they suggest that in some situations, extraneousinformation that aligns with to-be-learned relational informationmay have a greater negative effect on learning than extraneousinformation that conflicts with to-be-learned relational informa-tion. Although creating a conflict between the relevant and extra-neous information produced successful learning for many partici-pants, this type of learning material does not appear to be widelyused by teachers. In our informal survey of teachers who wementioned earlier, only four of the 16 teachers indicated that theywould use such graphs in their teaching.
Taken together, the results of all four experiments suggest thatsuccessful learning of mathematical procedures requires sufficientattention be allocated to the relevant underlying relations. Extra-
Thi
sdo
cum
ent
isco
pyri
ghte
dby
the
Am
eric
anPs
ycho
logi
cal
Ass
ocia
tion
oron
eof
itsal
lied
publ
ishe
rs.
Thi
sar
ticle
isin
tend
edso
lely
for
the
pers
onal
use
ofth
ein
divi
dual
user
and
isno
tto
bedi
ssem
inat
edbr
oadl
y.
360 KAMINSKI AND SLOUTSKY
neous information included in the learning material can capture thelearner’s attention and divert it from these relations during learn-ing. Not only can extraneous information hinder learning, it canalso hinder subsequent performance. However, children wholearned in the absence of extraneous information were more resis-tant to the hindering effects of extraneous information duringtesting than those who learned in the presence of extraneousinformation. In the present experiments, extraneous informationcame in the form of discrete, countable objects, which mightintuitively seem to support learning because the number of theseobjects corresponded with the to-be-learned responses (in Exper-iments 1–3). However, it appears that that the extraneous infor-mation activated a well-learned counting procedure that childrenused instead of learning a new procedure.
By elementary school, children are very familiar with theprocess of counting to determine cardinality. Understanding ofthe relationship between counting and cardinality emerges grad-ually over the preschool years (Baroody & Price, 1983; Briars& Siegler, 1984; Fuson, 1988; Gelman & Gallistel, 1978; Mix,2002; Wynn, 1990, 1992). In school, instruction on arithmeticconcepts often involves enumeration and counting of sets ofdiscrete objects (see Van De Walle, 2007, for examples). There-fore, the process of counting to determine cardinality is verywell practiced. This process can promote important mathemat-ical understanding. At the same time, there may be instances,such as those of the present study, when counting and cardi-nality conflict with correct mathematical knowledge and pro-cedures. This possibility has also been noted by other research-ers who have suggested that well-learned counting knowledgemay interfere with children’s proportional reasoning (Boyer,Levine, & Huttenlocher, 2008). More generally, in the course ofacquiring mathematical knowledge, children sometimes applywell-learned, highly practiced, but inappropriate proceduresinstead of to-be-learned ones (e.g., when solving equivalenceproblems and when performing fraction arithmetic; see McNeil,2007; McNeil & Alibali, 2005; Resnick & Ford, 1981). How-ever, unlike the situations with equivalence problems and frac-tion arithmetic, the temptation to apply a familiar but inappro-priate strategy to bar graph reading can be easily avoided byremoving the source of this temptation.
It could be argued that in the case of teaching children to readbar graphs, the inclusion of columns of objects is intended toscaffold learning with students initially instructed to read pic-tograms for which the number of objects present intentionallyrepresents the relevant quantities. The present study suggeststwo points. First, if such objects are included in instructionalmaterial, explicit measures need to be taken to direct children’sattention to the relevant relation between the x and y variables.Such measures may come in the form of creating a conflictbetween possible responses, as in Experiment 4, or possibly inthe form of phasing the extraneous information out the learningmaterial. Progressive fading of perceptual details has beenshown to facilitate transfer of knowledge (Goldstone & Son,2005). Second, the high level of accuracy in the no extraneousinformation conditions suggests that such a scaffold is notnecessary for successful learning.
The present study revealed that extraneous perceptual infor-mation hinders learning of reading graphs, especially inkindergarten (i.e., 6- to 7-year-old) children. However, several
related issues remain unknown. First, in the present study weexamined children’s most basic understanding of bar graphs,namely, how to associate a particular independent variable withthe appropriate dependent variable. The effects of extraneousinformation on other aspects of bar graph reading, such asnoticing trends in the data or interpreting contextual signifi-cance, would need further experimental consideration. In addi-tion, the extent to which the extraneous information may affectparticipants’ generalizability of the learned graph-reading pro-cedure is not known. For example, can participants generalizethe learned procedure to appreciably different bar graphs, suchas graphs with horizontal bars? Second, the extraneous infor-mation examined in this study was both countable and percep-tually rich. To know the extent to which the demonstrated effectis attributed to each of these factors independently would needfurther research. Clearly, the effect is attributed in part to thepresence of discrete objects; otherwise, there would be nothingto count. We also expect that the perceptual richness of theobjects also contributes to the effect by making the objects verysalient, as opposed to less salient countable circles for example.
The present results have important implications for the de-sign of educational material. These findings underscore theimportance of considering children’s limited attentional capac-ities when designing and introducing learning material. Thosewho design material need to consider the possibility that inclu-sion of extraneous perceptual information may divert attentionfrom the to-be-learned information. The consequence of chil-dren not acquiring the new knowledge may not be immediatelyrecognizable by teachers in situations when the extraneousinformation is not in conflict with to-be-learned procedures(e.g., in the present study, when cardinality equaled they-value). Instead, failure in learning can appear later whenchildren are presented with material from which they cannotrely on another procedure. Therefore, it is important that thedesigners of instructional material, including textbooks andlesson plans, not simply rely on intuition as to what featuresmay seem desirable or visually pleasing. They should recognizea priori the potential pitfalls of including such extraneousinformation in learning material intended for children whoseability to inhibit extraneous information is still developing.
References
Andrews, G., & Halford, G. S. (2002). A cognitive complexity metricapplied to cognitive development. Cognitive Psychology, 45, 153–219.doi:10.1016/S0010-0285(02)00002-6
Baroody, A. J., & Price, J. (1983). The development of the number-wordsequence in the counting of three-year-olds. Journal for Research inMathematics Education, 14, 361–368. doi:10.2307/748681
Boyer, T., Levine, S. C., & Huttenlocher, J. (2008). Development ofproportional reasoning: Where young children go wrong. DevelopmentalPsychology, 44, 1478–1490. doi:10.1037/a0013110
Briars, D., & Siegler, R. S. (1984). A featural analysis of preschoolers’counting knowledge. Developmental Psychology, 20, 607–618. doi:10.1037/0012-1649.20.4.607
Brown, J. S., & Burton, R. B. (1978). Diagnostic models for proceduralbugs in basic mathematical skills. Cognitive Science, 2, 155–192. doi:10.1207/s15516709cog0202_4
Chipotle store openings. (2010). In Delta Sky Magazine, p. 28. Retrievedfrom http://msp.imirus.com/Mpowered/book/vds10/i12/p0
Thi
sdo
cum
ent
isco
pyri
ghte
dby
the
Am
eric
anPs
ycho
logi
cal
Ass
ocia
tion
oron
eof
itsal
lied
publ
ishe
rs.
Thi
sar
ticle
isin
tend
edso
lely
for
the
pers
onal
use
ofth
ein
divi
dual
user
and
isno
tto
bedi
ssem
inat
edbr
oadl
y.
361PERCEPTUAL INTERFERENCE IN MATH LEARNING
Davidson, M. C., Amso, D., Anderson, L. C., & Diamond, A. (2006).Development of cognitive control and executive functions from 4 to 13years: Evidence from manipulations of memory, inhibition, and taskswitching. Neuropsychologia, 44, 2037–2078. doi:10.1016/j.neuropsychologia.2006.02.006
Diamond, A., & Kirkham, N. (2005). Not quite as grown-up as we like tothink: Parallels between cognition in childhood and adulthood. Psycho-logical Science, 16, 291–297. doi:10.1111/j.0956-7976.2005.01530.x
English, L. D., & Halford, G. S. (1995). Mathematics education: Modelsand processes. Hillsdale, NJ: Erlbaum.
Favorite pizza toppings. (n.d.). In National Council of Teachers of Math-ematics Illuminations: Resources for Teaching Math. Retrieved fromhttp://illuminations.nctm.org/LessonDetail.aspx?ID�L222
Ferguson, C. J. (2009). An effect size primer: A guide for clinicians andresearchers. Professional Psychology: Research and Practice, 40, 532–538. doi:10.1037/a0015808
Fuson, K. C. (1988). Children’s counting and concepts of number. NewYork, NY: Springer-Verlag. doi:10.1007/978-1-4612-3754-9
Gelman, R., & Gallistel, C. R. (1978). The child’s understanding ofnumber. Cambridge, MA: Harvard University Press.
Gentner, D. (1988). Metaphor as structure mapping: The relational shift.Child Development, 59, 47–59. doi:10.2307/1130388
Gick, M. L., & Holyoak, K. J. (1980). Analogical problem solving.Cognitive Psychology, 12, 306 –355. doi:10.1016/0010-0285(80)90013-4
Gick, M. L., & Holyoak, K. J. (1983). Schema induction and analogicaltransfer. Cognitive Psychology, 15, 1–38. doi:10.1016/0010-0285(83)90002-6
Goldstone, R. L., & Sakamoto, Y. (2003). The transfer of abstract princi-ples governing complex adaptive systems. Cognitive Psychology, 46,414–466. doi:10.1016/S0010-0285(02)00519-4
Goldstone, R. L., & Son, J. Y. (2005). The transfer of scientific principlesusing concrete and idealize simulations. The Journal of the LearningSciences, 14, 69–110. doi:10.1207/s15327809jls1401_4
Goswami, U. (1991). Analogical reasoning: What develops? A review ofresearch and theory. Child Development, 62, 1–22. doi:10.2307/1130701
Goswami, U. (1992). Analogical reasoning in children. Hillsdale, NJ:Erlbaum.
Goswami, U. (2001). Analogical reasoning in children. In D. Gentner, K. J.Holyoak, & B. N. Kokinov (Eds.), The analogical mind: Perspectivesfrom cognitive science (pp. 437–470). Cambridge, MA: MIT Press.
Goswami, U., & Brown, A. L. (1990). Melting chocolate and meltingsnowmen: Analogical reasoning and causal relations. Cognition, 35,69–95. doi:10.1016/0010-0277(90)90037-K
Halford, G. S. (1993). Children’s understanding: The development ofmental models. Hillsdale, NJ: Erlbaum.
Hanania, R., & Smith, L. B. (2010). Selective attention and attentionswitching. Developmental Science, 13, 622–635. doi:10.1111/j.1467-7687.2009.00921.x
Kaminski, J. A., & Sloutsky, V. M. (2011). Representation and transfer ofabstract mathematical concepts in adolescence and young adulthood. InV. Reyna (Ed.), The adolescent brain: Learning, reasoning, and deci-sion making (pp. 67–93). Washington, DC: American PsychologicalAssociation. doi:10.1037/13493-003
Kaminski, J. A., Sloutsky, V. M., & Heckler, A. F. (2008). The advantageof abstract examples in learning math, Science, 320, 454–455. doi:10.1126/science.1154659
Kemler, D. G. (1982). Cognitive development in the schools years: Foun-dations and directions. In J. Worrell (Ed.), Psychological development inthe elementary school years (pp. 233–268). New York, NY: AcademicPress.
Kennedy, J. J. (1992). Analyzing qualitative data: Log-linear analysis forbehavioral research. New York, NY: Praeger.
Kramarski, B. (2004). Making sense of graphs: Does metacognitive in-struction make a difference on students’ mathematical conceptions andalternative conceptions? Learning and Instruction, 14, 593–619. doi:10.1016/j.learninstruc.2004.09.003
MacLeod, C. M. (1991). Half a century of research on the Stroop effect: Anintegrative review. Psychological Bulletin, 109, 163–203. doi:10.1037/0033-2909.109.2.163
McNeil, N. M. (2007). U-shaped development in math: 7-year-olds out-perform 9-year-olds on equivalence problems. Developmental Psychol-ogy, 43, 687–695. doi:10.1037/0012-1649.43.3.687
McNeil, N. M., & Alibali, M. W. (2005). Why won’t you change yourmind? Knowledge of operational patterns hinders learning and perfor-mance on equations. Child Development, 76, 883–899. doi:10.1111/j.1467-8624.2005.00884.x
McNeil, N. M., Uttal, D. H., Jarvin, L., & Sternberg, R. J. (2009). Shouldyou show me the money? Concrete objects both hurt and help perfor-mance on mathematics problems. Learning and Instruction, 19, 171–184. doi:10.1016/j.learninstruc.2008.03.005
Mix, K. S. (2002). The construction of number concepts. Cognitive De-velopment, 17, 1345–1363.
Napolitano, A. C., & Sloutsky, V. M. (2004). Is a picture worth a thousandwords? The flexible nature of modality dominance in young children.Child Development, 75, 1850 –1870. doi:10.1111/j.1467-8624.2004.00821.x
National Council of Teachers of Mathematics. (2000). Principles andstandards for school mathematics. Reston, VA: Author.
Novick, L. R. (1988). Analogical transfer, problem similarity, and exper-tise. Journal of Experimental Psychology: Learning, Memory, and Cog-nition, 14, 510–520. doi:10.1037/0278-7393.14.3.510
Plude, D. J., Enns, J. T., & Brodeur, D. (1994). The development ofselective attention: A life-span overview. Acta Psychologica, 86, 227–272. doi:10.1016/0001-6918(94)90004-3
Rattermann, M. J., & Gentner, D. (1998). More evidence for a relationalshift in the development of analogy: Children’s performance on acausal-mapping task. Cognitive Development, 13, 453– 478. doi:10.1016/S0885-2014(98)90003-X
Reed, S. K., Dempster, A., & Ettinger, M. (1985). Usefulness of analogoussolutions for solving algebra word problems. Journal of ExperimentalPsychology: Learning, Memory, and Cognition, 11, 106–125. doi:10.1037/0278-7393.11.1.106
Reed, S. K., Ernst, G. W., & Banerji, R. (1974). The role of analogy intransfer between similar problem states. Cognitive Psychology, 6, 436–450. doi:10.1016/0010-0285(74)90020-6
Resnick, L. B., & Ford, W. W. (1981). The psychology of mathematics forinstruction. Hillsdale, NJ: Erlbaum.
Richland, L. E., Morrison, R. G., & Holyoak, K. J. (2006). Children’sdevelopment of analogical reasoning: Insights from scene analogy prob-lems. Journal of Experimental Child Psychology, 94, 249–273. doi:10.1016/j.jecp.2006.02.002
Robinson, C. W., & Sloutsky, V. M. (2004). Auditory dominance and itschange in the course of development. Child Development, 75, 1387–1401. doi:10.1111/j.1467-8624.2004.00747.x
Shah, P., & Hoeffner, J. (2002). Review of graph comprehension research:Implications for instruction. Educational Psychology Review, 14, 47–69.doi:10.1023/A:1013180410169
Shepp, B. E., & Swartz, K. B. (1976). Selective attention and the process-ing of integral and nonintegral dimensions: A developmental study.Journal of Experimental Child Psychology, 22, 73–85. doi:10.1016/0022-0965(76)90091-6
Sloutsky, V. M., Kaminski, J. A., & Heckler, A. F. (2005). The advantageof simple symbols for learning and transfer. Psychonomic Bulletin &Review, 12, 508–513. doi:10.3758/BF03193796
Thi
sdo
cum
ent
isco
pyri
ghte
dby
the
Am
eric
anPs
ycho
logi
cal
Ass
ocia
tion
oron
eof
itsal
lied
publ
ishe
rs.
Thi
sar
ticle
isin
tend
edso
lely
for
the
pers
onal
use
ofth
ein
divi
dual
user
and
isno
tto
bedi
ssem
inat
edbr
oadl
y.
362 KAMINSKI AND SLOUTSKY

Smith, L. B., & Kemler, D. G. (1978). Levels of experienced dimension-ality in children and adults. Cognitive Psychology, 10, 502–532. doi:10.1016/0010-0285(78)90009-9
Van De Walle, J. A. (2007). Elementary and middle school mathematics:Teaching developmentally. Boston, MA: Pearson Education.
Wainer, H. (1980). A test of graphicacy in children. Applied PsychologicalMeasurement, 4, 331–340. doi:10.1177/014662168000400305
Wainer, H. (1992). Understanding graphs and tables. Educational Re-searcher, 21, 14–23.
Wynn, K. (1990). Children’s understanding of counting. Cognition, 36,155–193.
Wynn, K. (1992). Children’s acquisition of number words and the countingsystem. Cognitive Psychology, 24, 220–251.
Received July 3, 2012Revision received October 25, 2012
Accepted November 1, 2012 �
Thi
sdo
cum
ent
isco
pyri
ghte
dby
the
Am
eric
anPs
ycho
logi
cal
Ass
ocia
tion
oron
eof
itsal
lied
publ
ishe
rs.
Thi
sar
ticle
isin
tend
edso
lely
for
the
pers
onal
use
ofth
ein
divi
dual
user
and
isno
tto
bedi
ssem
inat
edbr
oadl
y.
363PERCEPTUAL INTERFERENCE IN MATH LEARNING