Embed Size (px)
Citation preview

_________________________________________ IOP2601 ORGANISATIONAL RESEARCH METHODS Workbook _Memo _________________________________________

- 2 -
DESCRIPTIVE STATISTICS BASIC MATHEMATICAL CALCULATIONS S3
SUMMATION NOTATION/SOMMASIE-NOTASIE We are now working with the first set of ungrouped data that we provided on the first page. Ons werk nou met die eerste stel data of ongegroepeerde data wat ons op die eerste bladsy verskaf het. Complete the table by doing all the summation notations (SU 3, Tutorial 24). Voltooi die tabel deur al die sommasie-notasie (SE 3, Tutorial 24) te doen. For all the computations you need to do later on, you will only substitute the values in this summation table in the different formulas. So make sure that you work very accurately and that all your calculations are correct. Vir al die berekeninge wat jy later moet doen, is dit net nodig om die waardes in die formules te vervang. Maak dus seker dat jy akkuraat werk en dat al jou berekeninge korrek is. X = Score on assignment question/Punte vir werkopdragvraag Y = Score on examination question/Punte vir eksamenvraag
Student X Y X² Y² XY
A B C D E F G H I J
1 2 2 2 3 4 5 7 7 8
5 4 5 6 8 7 8 7 8 8
1 4 4 4 9
16 25 49 49 64
25 16 25 36 64 49 64 49 64 64
5 8
10 12 24 28 40 49 56 64
N = 10 ΣX = 41 ΣY = 66 ΣX² = 225 ΣY² = 456 ΣXY = 296
(ΣX)² = (41)² = 1 681 (ΣY)² = (66)² = 4 356 ΣXΣY = (41)(66) = 2 706
- 3 -
DISPLAYING DATA SU 4
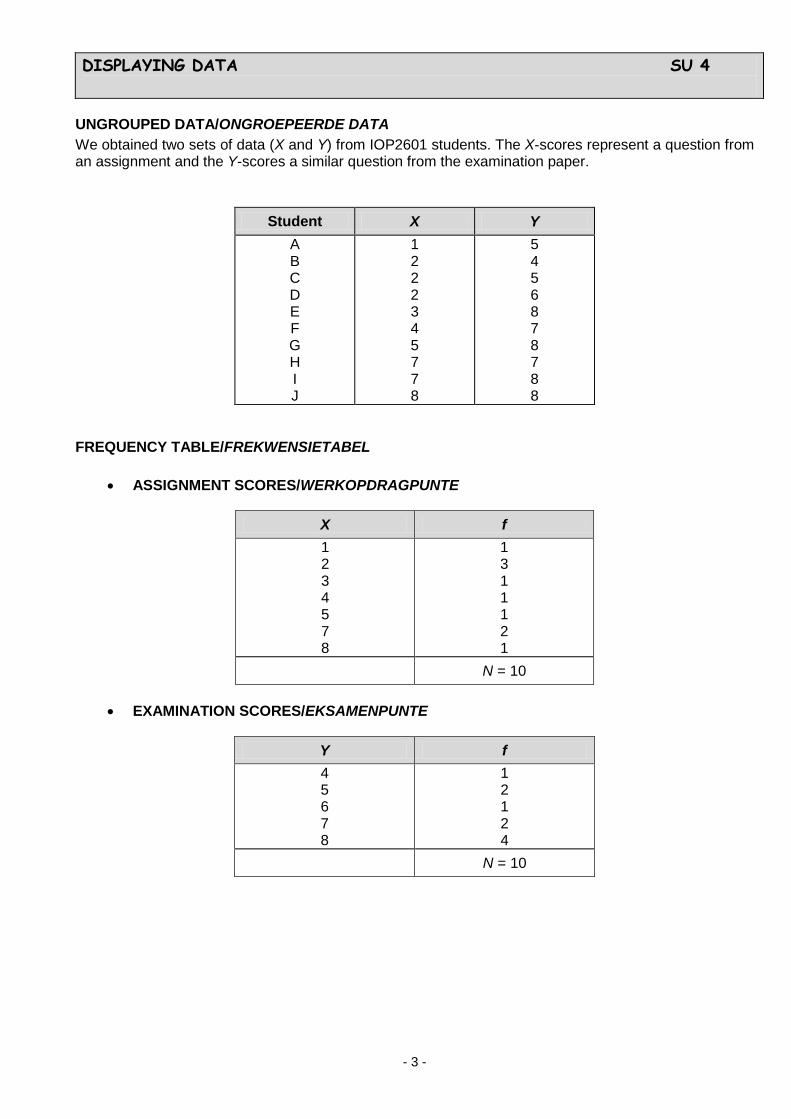
UNGROUPED DATA/ONGROEPEERDE DATA We obtained two sets of data (X and Y) from IOP2601 students. The X-scores represent a question from an assignment and the Y-scores a similar question from the examination paper.
Student X Y A B C D E F G H I J
1 2 2 2 3 4 5 7 7 8
5 4 5 6 8 7 8 7 8 8
FREQUENCY TABLE/FREKWENSIETABEL • ASSIGNMENT SCORES/WERKOPDRAGPUNTE
X f 1 2 3 4 5 7 8
1 3 1 1 1 2 1
N = 10
• EXAMINATION SCORES/EKSAMENPUNTE
Y f 4 5 6 7 8
1 2 1 2 4
N = 10

- 4 -
FREQUENCY BAR CHART/FREKWENSIESTAAFDIAGRAM • ASSIGNMENT SCORES/WERKOPDRAGPUNTE
ASSIGNMENT SCORES/WERKOPDRAGPUNTE
• EXAMINATION SCORES/EKSAMENPUNTE
EXAMINATION SCORES/EKSAMENPUNTE GROUPED DATA/GEGROEPEERDE DATA The following set of data is an example of grouped data. It is the frequency distribution table for the Verbal-fluency Test Scores of 50 teenagers. The class interval is 5. Die volgende stel data is ‘n voorbeeld van gegroepeerde data. Dit is die frekwensie-verspreidingstabel vir die “Verbal Fluency Test” van 50 tieners. Die klas-interval is 5.
4
3
2
1
1 2 3 4 5 6 7 8X
f
4
3
2
1
1 2 3 4 5 6 7 8X
f
4
3
2
1
1 2 3 4 5 6 7 8X
f
4
3
2
1
1 2 3 4 5 6 7 8X
f

- 5 -
• FREQUENCY DISTRIBUTION TABLE FOR THE VERBAL FLUENCY TEST SCORES OF 50 TEENAGERS / FREKWENSIEVERSPREIDINGSTABEL VIR DIE “VERBAL FLUENCY” TOETSPUNTE VAN 50 TIENERS
Class interval Frequency Cumulative f % frequency Cumulative % f
95 -99 2 50 4 100
90-94 1 48 2 96
85-89 4 47 8 94
80-84 7 43 14 86
75-79 8 36 16 72
70-74 5 28 10 56
65-69 6 23 12 46
60-64 6 17 12 34
55-59 5 11 10 22
50-54 4 6 8 12
45-49 2 2 4 4
• HISTOGRAM FOR THE VERBAL FLUENCY TEST SCORES OF 50 TEENAGERS/ HISTOGRAM VIR DIE “VERBAL FLUENCY” TOETSPUNTE VAN 50 TIENERS

- 6 -
• PERCENTILE RANK/PERSENTIELRANG
What will the percentile rank be of a score of 87? Wat sal die persentielrang wees vir ‘n telling van 87? percentile rank = % below + score - RLL (interval %) class int.width = 86 + 87 - 84,5 (8) 5 = 86 + 25 (8) 5 = 86 + 0,5 (8) = 86 + 4 = 90
• PERCENTILE/PERSENTIEL
What score is found at the 40th percentile? Watter telling sal jy op die 40ste persentiel vind? score of p = RLL + PR - % below (interval width) interval % = 64,5 + 40 - 34 (5) 12 = 64,5 + 6 (5) 12 = 64,5 + 2,5 = 67

- 7 -
MEASURES OF CENTRAL TENDENCY SU 5 MAATSTAWWE VAN SENTRALE NEIGING SE 5
Student X Y X² Y² XY
A B C D E F G H I J
1 2 2 2 3 4 5 7 7 8
5 4 5 6 8 7 8 7 8 8
1 4 4 4 9
16 25 49 49 64
25 16 25 36 64 49 64 49 64 64
5 8
10 12 24 28 40 49 56 64
N = 10 ΣX = 41 ΣY = 66 ΣX² = 225 ΣY² = 456 ΣXY = 296
(ΣX)² = (41)² = 1 681 (ΣY)² = (66)² = 4 356 ΣXΣY = (41)(66) = 2 706
• ASSIGNMENT SCORES/WERKOPDRAGPUNTE ► Mode/Modus Mo = Most frequently occurring score
1 2 2 2 3 4 5 7 7 8
∴ Mo = 2 ► Median/Mediaan Medium location = N + 1 2
= 11
2
= 5,5
1 2 2 2 3 4 5 7 7 8 ⇑
5,5 position/posisie
∴ Median = 3,5

- 8 -
► Mean / Gemiddelde
• EXAMINATION SCORES/EKSAMENPUNTE ► Mode/Modus Mo = Most frequently occurring score
4 5 5 6 7 7 8 8 8 8
∴ Mo = 8 ► Median/Mediaan Median location = =
= 5,5
4 5 5 6 7 7 8 8 8 8 ⇑
5,5 position/posisie
∴ Median = 7 ► Mean/Gemiddelde
X = ΣX N
= 41 10
= 4,1
N + 1 2 11 2
Y = ΣY N
= 66 10
= 6,6

- 9 -
MEASURES OF VARIABILITY SU 6 MAATSTAWWE VAN VERANDERLIKHEID SE 6
• ASSIGNMENT SCORES/WERKOPDRAGPUNTE
► Range/Omvang
Range = Highest score minus lowest score
8 - 1 = 7
► Variance/Variansie ► Standard deviation/Standaardafwyking
SX = = 6,32 = 2,51
• EXAMINATION SCORES/EKSAMENPUNTE
► Range/Omvang Range = Highest score minus lowest score
8 - 4 = 4
2 S X = ΣX2 - _____ ______________
N - 1
(ΣX)2 N
=
225 - _____ ______________
10 - 1
(41)2 10
=
225 - _____ ______________
9
1681 10
= 225 - 168,1
9
= 56,9
9
= 6,32
√ √
2 S X

- 10 -
► Variance / Variansie ► Standard deviation/Standaardafwyking
= = 2,27 = 1,51
Y S
= ΣY2 - _____ ______________
N - 1
(ΣY)2 N
=
456 - _____ ______________
10 - 1
(66)2 10
=
456 - _____ ______________
9
435,6 10
= 456 - 435,6
9
= 20,4
9
= 2,27
√ √
2 S Y
2 S Y

- 11 -
CORRELATION SU 7 KORRELASIE SE 7
• SCATTER DIAGRAM OF ASSIGNMENT AND EXAMINATION SCORES/
STROOIINGSDIAGRAM VAN WERKOPDRAG- EN EKSAMENPUNTE
• CORRELATION COEFFICIENT/KORRELASIEKOËFFISIËNT = 254 340,699 = 0,74551 = 0,75
0 1 2 3 4 5 6 7 8 9 10
10
9
8
7
6
5
4
3
2
1
Assignment scores/Werkopdragpunte
a = 4,75
X = 4,1Y = 6,6
(6;7,45)
Exa
min
atio
n sc
ores
/Eks
amen
punt
e
0 1 2 3 4 5 6 7 8 9 10
10
9
8
7
6
5
4
3
2
1
Assignment scores/Werkopdragpunte
a = 4,75a = 4,75
X = 4,1Y = 6,6X = 4,1Y = 6,6
(6;7,45)(6;7,45)
Exa
min
atio
n sc
ores
/Eks
amen
punt
e
10 (296) - (41) (66)
√ [10(225) - (41)2][10(456) - (66)2] r =
2960 - 2706
√ [2250 - 1681] [4560 - 4356] r =
NΣXY - ΣXΣY
√ [NΣX2 - (ΣX)2][NΣY2 - (ΣY)2] r =
254
√ [569] [204] r =
254
√ 116076 r =

- 12 -
► Interpretation/Interpretasie
Moderate to strong, positive correlation/Matige tot sterk, positiewe korrelasie
► Deduction/Afleiding
Students who scored high in the assignment also scored high in the examination. / Studente wat hoë punte in die werkopdrag gekry het, het ook hoë punte in die eksamen gekry.
► Common variance/Gemeenskaplike variansie
r = 0,75 r² = 0,56 = 56%
- 13 -
REGRESSION SU 8 REGRESSIE SE 8
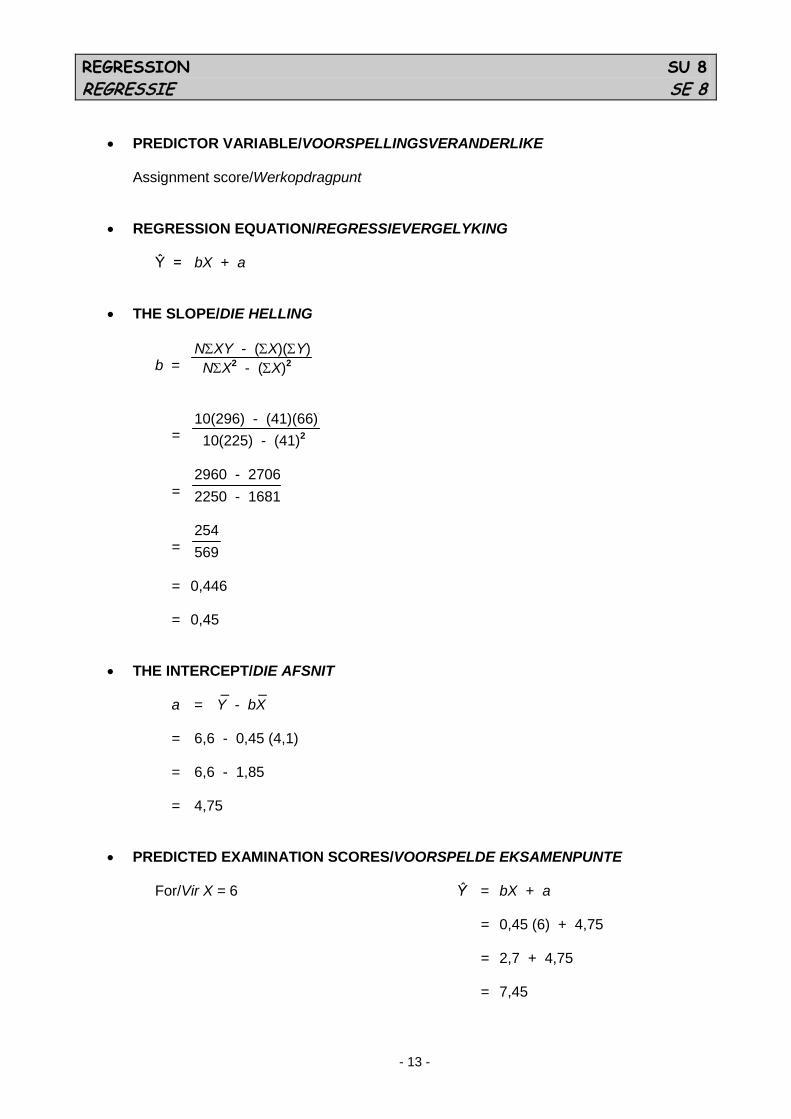
• PREDICTOR VARIABLE/VOORSPELLINGSVERANDERLIKE
Assignment score/Werkopdragpunt
• REGRESSION EQUATION/REGRESSIEVERGELYKING
Ŷ = bX + a
• THE SLOPE/DIE HELLING NΣXY - (ΣX)(ΣY) b = NΣX2 - (ΣX)2 10(296) - (41)(66) = 10(225) - (41)2 2960 - 2706 = 2250 - 1681 254 = 569 = 0,446 = 0,45
• THE INTERCEPT/DIE AFSNIT _ _ a = Y - bX = 6,6 - 0,45 (4,1) = 6,6 - 1,85 = 4,75
• PREDICTED EXAMINATION SCORES/VOORSPELDE EKSAMENPUNTE For/Vir X = 6 Ŷ = bX + a = 0,45 (6) + 4,75 = 2,7 + 4,75 = 7,45

- 14 -
• THE REGRESSION LINE/DIE REGRESSIELYN
Draw the regression line on the scatter diagram.
Always indicate the following on the graph:
• The computed regression equation (not the formula) • The (X; Y) coordinates, ie the predicted Ŷ-scores and their respective X-scores • The a value, ie the intercept
It is optional to indicate the coordinate of the two means, unless it is the only reference point on the regression line.
Teken die regressielyn op die strooiingsdiagram.
Dui altyd die volgende op die grafieke aan:
• Die berekende regressievergelyking (nie die formule nie) • Die (X; Y)-koördinate, dit wil sê die voorspelde Ŷ-waardes en hul onderskeie X-tellings • Die a-waarde, dit wil sê die afsnit
Dit is nie verpligtend om die koördinaat van die twee gemiddeldes aan te dui nie, tensy dit die enigste verwysingspunt op die regressielyn is.

- 15 -
INFERENTIAL STATISTICS BASIC CONCEPTS OF PROBABILITY S9
With probability, we are attempting to determine what are the chances of a specific event happening. Look at the following example: Imagine you have four small balls, similar to each other in all ways, except that one is red and the other three are blue. If you should place the balls in a box, close the lid, and shake the box so as to mix it thoroughly and then reach into the box and blindly withdraw one ball, what are the chances that you would w i t h d ra w a red ba l l? Or s ta ted d i f f e r en t l y , wha t i s t he p robab i l i t y that you would draw a red ball? Now if you use common sense, you would know that if you are blindly drawing 1 ball out of 4, and if these 4 balls include 3 blue and 1 red, then you have 3 chances out of 4 of drawing a blue ball, but only 1 chance out of 4 of drawing a red one. We can take these ‘chances’ and convert it to a meaningful and useful numerical form. We can then say that an event has x chances out of y occurring. Or stated differently, the probability of that event can be defined numerically as the ratio of x to y. Thus the probability, P, of drawing a blue ball (with 3 chances out of 4) is: P(blue) = 3/4 = 0.75 and the probability of drawing a red ball (with 1 chance out of 4) is P(red) = 1/4 = 0.25 So a definition of probability can be the relative possibility that an event will occur, as expressed by the ratio of the number of actual occurrences to the total number of possible occurrences. • If we state the definition differently: P(x) = number of possibilities favourable to the occurrence of x / total number of pertinent possibilities So the probability of randomly drawing a blue ball from a box is: P(blue) = the total number of blue balls in the box / the total number of balls in the box • We can express this ratio on a scale of 0 to 1: 0 if the event is not likely to occur at all; 1 if the event is likely to occur every time; or any proportion in between of the likelihood of the event occurring e.g. 0.75 or 0.34. • So a probability value is a statement of proportion.

- 16 -
Example of basic probability To take another example, imagine a statistics class containing 30 students, of whom 7 are first years, 12 are second years, 10 are third years and one is a honours student. If you were to select one student at random from this class, what is the probability that the student you select will be a first year? As there is a total of 30 students in the class, of whom exactly 7 are first years; that probability is: P(first year) = 7/30 = 0.2333 By the same reasoning, the probability of selecting a second year is P(second year) = 12/30 = 0.40 and so on for the categories third year and honours: P(third year) = 10/30 = 0.3333 P(honours) = 1/30 = 0.0333 Probability of more than one event occurring If we go one step further, we can look at not only the chances of a single event occurring, as in the previous examples, but also the chances of more than one event occurring. Here we can distinguish between two scenarios: • What are the chances that both events occur – this is ‘and’. • Or, what are the chances that one or the other occur – this is ‘or’. • In the language of probability, we call the ‘and’ scenario conjunction and the ‘or’ scenario disjunction. Conjuctive Probability • Look at the following example: Suppose you were to toss a penny twice. There is a 50% chance of getting a head on the first toss; and then, if you do get a head on the first toss, there is also a 50% chance of getting a head on the second toss. The probability that you will get a head on the first toss and on the second toss is therefore 50% of 50%. So, one-half of one-half is one-quarter; or 50% of 50% is 25%; or in decimal form, 0.5 x 0.5 = 0.25. • So when you are investigating a conjunction scenario (‘and’), you will use multiplication. Independent events • In the simple case of repeatedly tossing a coin, the probability of getting a head on any particular toss is completely independent of the outcome of any other toss, past, resent, or future. If you get a head on the first toss, the probability of getting a head on the second toss is P (H) = 0.5; and if you get a tail on the first toss, the probability of getting a head on the second toss is also P(H)= 0.5. • No matter how many times you have tossed the coin, no matter how many heads have already come up, or how many tails, the probability of getting a head on the next toss is still exactly P(H)= 0.5. Dependent events • There are many other kinds of situations, however, where the probability of an event is not independent but dependent— that is, where the probability of one event depends on the outcome of some other event. • Imagine a room that contains 4 females and 6 males. Question 1: If you were to select 3 persons from this room at random, what is the probability that all 3 would be females? • Here is how it works. The critical point to take note of is that the probability of the outcome for each

- 17 -
successive draw, after the first, depends on the outcome(s) of the preceding draw(s). • Clearly, the probability of selecting a female on the first draw is the ratio 4/10, since there are 10 persons in the room, of whom 4 are females. But then, once you have made your first selection, there remain only 9 persons in the room from whom to make your second selection; and if your first selection is a female, then only 3 of the remaining persons are females. Thus, if your first selection happens to be a female, the probability of selecting a female on the second draw is not 4/10, but rather 3/9. After the second selection there are only 8 persons left in the room; and if both of the persons already drawn are females, then only 2 of these 8 remaining are females. Thus, the probability that the third draw will also be a female is not 4/10 nor 3/9, but rather 2/8. The probability of selecting females in all three draws in this situation is therefore: P(all 3 females) = (4/10) x (3/9) x (2/8) = 0.033 Disjunctive probabilities Let us now take a look at disjunctive probabilities: • If you toss a coin, there is a 50% chance that it will come up heads, a 50% chance that it will come up tails, and thus a 100% chance that it will come up either heads or tails. With each correct entry submitted to a competition with 100 entries, you have a 1 in 100 chance of winning. With two correct entries submitted (assuming that you can enter as many times as you like) your chance of winning with either the first or the second correct entry is therefore 2 in 100. With three tickets, the chances of winning with either the first or the second or the third is 3 in 100; and so forth. When two or more chance events are disjunctively linked by the word "or," the corresponding mathematical linkage is just simple addition. • Thus, the probability of having A or B occur is equal to the sum of the two component probabilities for A and B: P(A or B) = P(A) + P(B) The probability of having A or B or C occur is the sum of the three separate component probabilities for A and B and C: P(A or B or C) = P(A) + P(B) + P(C) and so on. • To put it concretely, imagine a statistics class of 30 students composed of 4 first years, 12 second years, 10 third years, and 4 honours students. The instructor announces that one of these students will be randomly selected to win the class lottery prize, which is an automatic A in the course. The probability that the lucky winner will be either a first year or a second year is: • 4 first years / 30 students + 12 second years / 30 students = 16 / 30 = 0.53 • and the probability that it will be either a first year or a second year or a third year is: • 4 first years / 30 students + 12 second years / 30 students + 10 third years / 30 students = 26/ 30 = 0.87 • This can however only be done when the events are mutually exclusive. In other words, the occurrence of one event rules out the occurrence of the other event.

- 18 -
THE NORMAL DISTRIBUTION SU 10 DIE NORMAALVERDELING SE 1 0
z = X - μ
σ DATA Scores on a creativity test of 1500 IOP2601 students with µ = 100 and σ = 15. Tellings op 'n kreatiwiteitstoets van 1500 IOP2601 studente met µ = 100 en σ = 15. DISTRIBUTION OF THE CREATIVITY SCORES/VERDELING VAN KREATIWITEITSTELLINGS Answer the following questions: Beantwoord die volgende vrae: 1 What (a) proportion, (b) percentage and (c) number of students have a score less than 90? Watter (a) proporsie, (b) persentasie en (c) aantal studente het 'n telling van minder as 90? 2 What (a) proportion, (b) percentage and (c) number of students have a score greater than 120? Watter (a) proporsie, (b) persentasie en (c) aantal studente het 'n telling van meer as 120? 3 What (a) proportion, (b) percentage and (c) number of students have a score greater than 90 and
less than 120? Watter (a) proporsie, (b) persentasie en (c) aantal studente het 'n telling van meer as 90 en minder as 120?
-3 -2 -1 0 1 2 3-3 -2 -1 0 1 2 3
55 70 85 100 115 130 145-3 -2 -1 0 1 2 3
Raw:2:
55 70 85 100 115 130 145-3 -2 -1 0 1 2 3
Raw:2:
Raw: Z:

- 19 -
Raw: Z:
Raw: Z:
1 Score/Telling < 90 (a) Proportion/Proporsie
z = X - μ
σ
= 90 - 100
15
= -10
15 = -0,67 Proportion/Proporsie = 0,2514 (b) Percentage/Persentasie 0,2514 x 100 = 25,14% (c) Number of persons/Aantal persone 25,14% x 1500 = 377,1 ∴ 377 Persons/Persone 2 Score/Telling > 120 (a) Proportion/Proporsie
z = X - μ
σ
= 120 - 100
15
= 20
15 = 1,33 Proportion/Proporsie = 0,0918 (b) Percentage/Persentasie 0,0918 x 100 = 9,18% (c) Number of persons/Aantal persone 9,18% x 1500 = 137,7 ∴ 138 Persons/Persone 3 Score/Telling > 90 and/en < 120
Table/Tabel A1.1
Table/Tabel A1.1

- 20 -
(a) Proportion/Proporsie Use answers from questions 1 and 2. Gebruik die antwoorde op vraag 1 en 2. Proportion/Proporsie = 1 - (0,2514 + 0,0918) = 1 - 0,3432 = 0,6568 You will get the same answer if you add the two mean to z proportions (0,2486 + 0,4282) in the figure. Jy sal dieselfde antwoord verkry indien jy die twee “mean to z” proporsies (0,2486 + 0,4282) in die figuur optel. (b) Percentage/Persentasie 0,6568 x 100 = 65,68% (c) Number of persons/Aantal persone 65,68% x 1500 = 985,2 ∴ 985 persons/persone AREAS UNDER THE NORMAL DISTRIBUTION CURVE AREAS ONDER DIE NORMAALVERDELINGSKROMME SAMPLING DISTRIBUTIONS AND HYPOTHESIS TESTING SU 12 STEEKPROEFVERDELINGS EN HIPOTESETOETSING SE 1 2
Refer to the figure on page 113 of the study guide.
-3 -2 -1 0 1 2 3
0,0013 0,0215 0,1359 0,3413 0,3413 0,1359 0,0215 0,00130,13% 2,15% 13,59% 34,13% 34,13% 13,59% 2,15% 0,13%
0,9544 or 95,44%
0,9974 or 99,74%
1,00 or 100%
0,6826 or 68,26%
-3 -2 -1 0 1 2 3
0,0013 0,0215 0,1359 0,3413 0,3413 0,1359 0,0215 0,00130,13% 2,15% 13,59% 34,13% 34,13% 13,59% 2,15% 0,13%
0,9544 or 95,44%0,9544 or 95,44%
0,9974 or 99,74%0,9974 or 99,74%
1,00 or 100%1,00 or 100%
0,6826 or 68,26%0,6826 or 68,26%
Raw: Z:

- 21 -
Refer to the nine steps in statistical hypothesis testing, page 115 of the study guide. Refer to the schematic representation of study units 14, 15, 16, 17 and 18 on page 122 of the study guide. t-TEST: RELATED SAMPLES SU 13 t- TOETS: VERWANTE STEEKPROEWE SE 1 3
Prof A wants to determine whether a difference exists in achievement scores of old (>50) and young (<30) students on an assignment question. He randomly selects 20 students, matched according to gender and intelligence. He chooses significance levels of 0,05 and 0,01, and decides to do a two-tailed test. Prof A wil graag vasstel of daar vir 'n werkopdragvraag 'n verskil is tussen die prestasietellings van ou (>50) en van jong (<30) studente. Hy selekteer 20 studente ewekansig, afgepaar op grond van geslag en intelligensie. Hy besluit op beduidendheidsvlakke van 0,05 en 0,01 asook op 'n tweekantige toets. Data
Old/Oud Young/Jonk D D2
4 3 7 6 5 4 5 4 3 2
5 8 6 6 6 4 7 7 6 4
-1 -5 1 0 -1 0 -2 -3 -3 -2
1 25 1 0 1 0 4 9 9 4
ΣX = 43 ΣY = 59 -16 54
_ X 4,3
s 1,49
5,9 1,29
-1,6 1,78
54
Note: The data in column D (difference scores) is a set of X-scores. Therefore, use the formulas for
mean, variance and standard deviation you already know - just substitute D for X. Let wel: Die data in kolom D (verskiltellings) is 'n stel X-tellings. Gebruik daarom die formules vir die
gemiddelde, variansie en die standaardafwyking wat jy reeds ken - vervang slegs D deur X. H0 : µO = µY H1 : µO ≠ µY _ t = D - 0 S
D
N
√
- 22 -
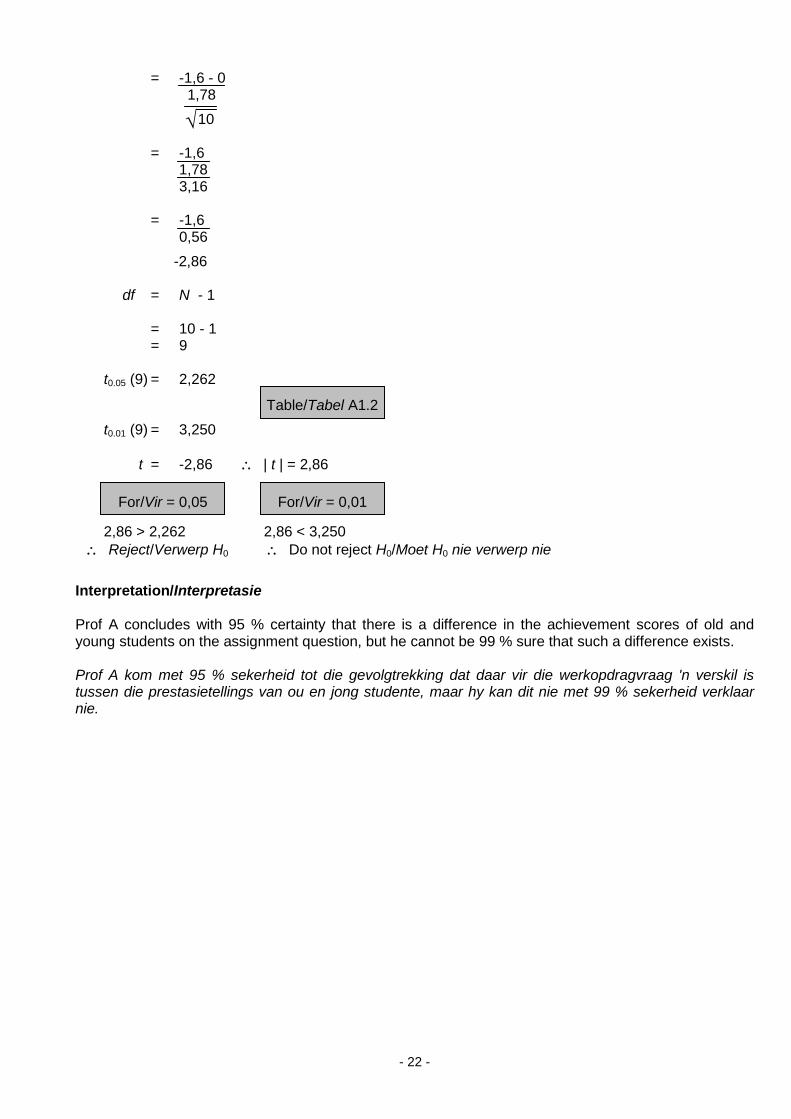
= -1,6 - 0 1,78
10 = -1,6 1,78 3,16 = -1,6 0,56
-2,86 df = N - 1 = 10 - 1 = 9 t0.05 (9) = 2,262 t0.01 (9) = 3,250 t = -2,86 ∴ | t | = 2,86 2,86 > 2,262 2,86 < 3,250 ∴ Reject/Verwerp H0 ∴ Do not reject H0/Moet H0 nie verwerp nie Interpretation/Interpretasie Prof A concludes with 95 % certainty that there is a difference in the achievement scores of old and young students on the assignment question, but he cannot be 99 % sure that such a difference exists. Prof A kom met 95 % sekerheid tot die gevolgtrekking dat daar vir die werkopdragvraag 'n verskil is tussen die prestasietellings van ou en jong studente, maar hy kan dit nie met 99 % sekerheid verklaar nie.
√
Table/Tabel A1.2
For/Vir = 0,01 For/Vir = 0,05
- 23 -
t- TEST: INDEPENDENT SAMPLES SU 13 t- TOETS: ONAFHANKLIKE STEEKPROEWE SE 1 3
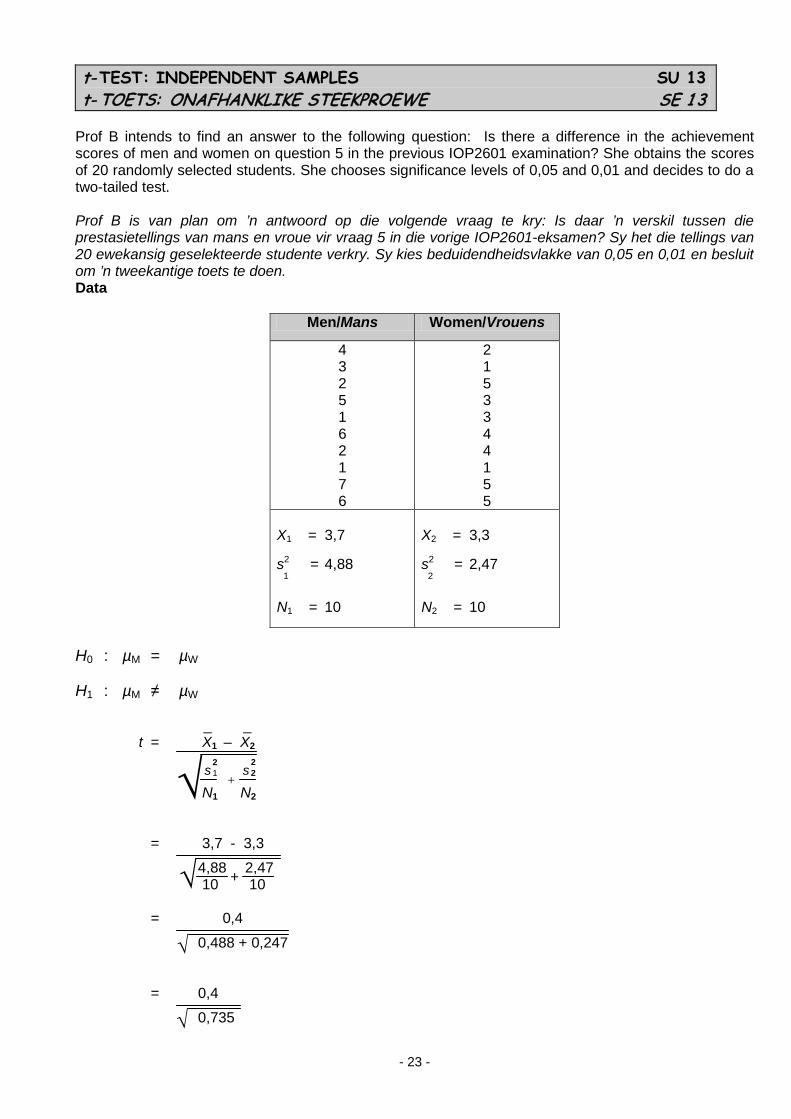
Prof B intends to find an answer to the following question: Is there a difference in the achievement scores of men and women on question 5 in the previous IOP2601 examination? She obtains the scores of 20 randomly selected students. She chooses significance levels of 0,05 and 0,01 and decides to do a two-tailed test. Prof B is van plan om ’n antwoord op die volgende vraag te kry: Is daar ’n verskil tussen die prestasietellings van mans en vroue vir vraag 5 in die vorige IOP2601-eksamen? Sy het die tellings van 20 ewekansig geselekteerde studente verkry. Sy kies beduidendheidsvlakke van 0,05 en 0,01 en besluit om ’n tweekantige toets te doen. Data
Men/Mans Women/Vrouens
4 3 2 5 1 6 2 1 7 6
2 1 5 3 3 4 4 1 5 5
X1 = 3,7 s2 = 4,88 1
N1 = 10
X2 = 3,3 s2 = 2,47
2
N2 = 10
H0 : µM = µW H1 : µM ≠ µW _ _ t = X1 – X2 N1 N2 = 3,7 - 3,3
4,88 2,47 10 10 = 0,4
0,488 + 0,247 = 0,4
0,735
√
√
√
+
√ s s 2 1
2 2
+

- 24 -
= 0,4
0,857 = 0,47 df = N1 + N2 - 2 = 10 + 10 - 2 = 18 t0.05 (18) = 2,101 t0.01 (18) = 2,878 0,47 < 2,101 0,47 < 2,878 ∴ Do not reject H0 ∴ Do not reject H0 ∴ Moet H0 nie verwerp nie ∴ Moet H0 nie verwerp nie Interpretation/Interpretasie Prof B concludes with 99 % certainty that there is no difference in the achievement scores of men and women on question 5 of the examination paper. Prof B kom met 99 % sekerheid tot die gevolgtrekking dat daar nie ’n verskil is tussen die prestasietellings van mans en vroue vir vraag 5 van die eksamenvraestel nie.
Table/Tabel A1.2
For/Vir = 0,01 For/Vir = 0,05

- 25 -
F-TEST: ONE-WAY ANOVA SU 13 F- TOETS: EENRIGTING- VARIANSIE SE 1 3
Is there a difference in achievement among students instructed according to the three methods of instruction, – self-study, video and lecture? Is daar 'n verskil in die prestasie van studente wat volgens die drie onderrigmetodes, naamlik selfstudie, video en lesing, onderrig word? In order to answer this question, Prof C randomly selects 18 IOP2601 students. He then randomly assigns six students to each of three groups. Each group is taught the topic, Uses of psychological tests, by using one of the three methods of instruction. Afterwards, all 18 students write the same test. Prof C sets the significance level at 0,01. Om hierdie vraag te kan beantwoord, het prof C 18 IOP2601 studente ewekansig geselekteer. Daarna het hy ses studente ewekansig aan elk van die drie groepe toegedeel. Elke groep is deur middel van een van die onderrigmetodes in die tema, Die gebruik van psigologiese toetse, onderrig. Daarna het al 18 studente dieselfde toets geskryf. Prof C stel die beduidendheidspeil op 0,01.
Self-study (XS)/ Selfstudie (XS)
Video (XV)/ Video (XV)
Lecture (XL)/ Lesing (XL)
Total/ Totaal
_ X s
5,83 2,14
2,33 1,21
2,67 1,51
3,61 2,25
Data
XS XV XL X2S X2
V X2L
6 7 2 7 8 5
1 1 3 2 4 3
5 2 1 2 4 2
36 49 4 49 64 25
1 1 9 4 16 9
25 4 1 4 16 4
35 14 16 227 40 54 ΣX = 35 + 14 + 16 = 65
ΣX 2 = 227 + 40 + 54 = 321 Null hypothesis/Nulhipotese H0 : µS = µV = µL One possible alternative hypothesis/Een moontlike alternatiewe hipotese H1 : µS ≠ µV ≠ µL Other possible alternative hypotheses/Ander moontlike alternatiewe hipoteses H1 : µS > µV > µL H1 : µS < µV < µL
etc/ens SStotal = ΣX2 - df = N - 1 = 18 - 1 = 321 - = 17 N = 321 - N = 321 - 234,72 = 86,28
4225
(ΣX)2
N
(65)2

- 26 -
_ _ SSgroup = nΣ(Xj - X..)2 df = k - 1 = 6 [(5,83 - 3,61)2 (2,33 - 3,61)2 (2,67 - 3,61)2 ] = 3 - 1 = 6 [(2,22)2 (-1,28)2 (-0,94)2 ] = 2 = 6 [(4,93) (1,64) (0,88)] = 6 [7,45] = 44,7 SSerror = SStotal - SSgroup df = k (n - 1) = 86,28 - 44,7 = 3 (6 - 1) = 41,58 = 15 MSgroup = SSgroup / dfgroup = 44,7 / 2 = 22,35 MSerror = SSerror / dferror = 41,58 / 15 = 2,77 MSgroup
MSerror 22,35
2,77 = 8,07
Source/Bron df SS MS F Groups/Groepe Error/Fout
2 15
44,7 41,58
22,35 2,77
8,07
Total/Totaal 17 86,28
F0,01 (2,15) = 6,36 Table/Tabel A1.4 and/en A1.5 Fcalc = 8,07
8,07 > 6,36
∴ Reject/Verwerp H0
=
F =
+ +
+ +
+ +
- 27 -
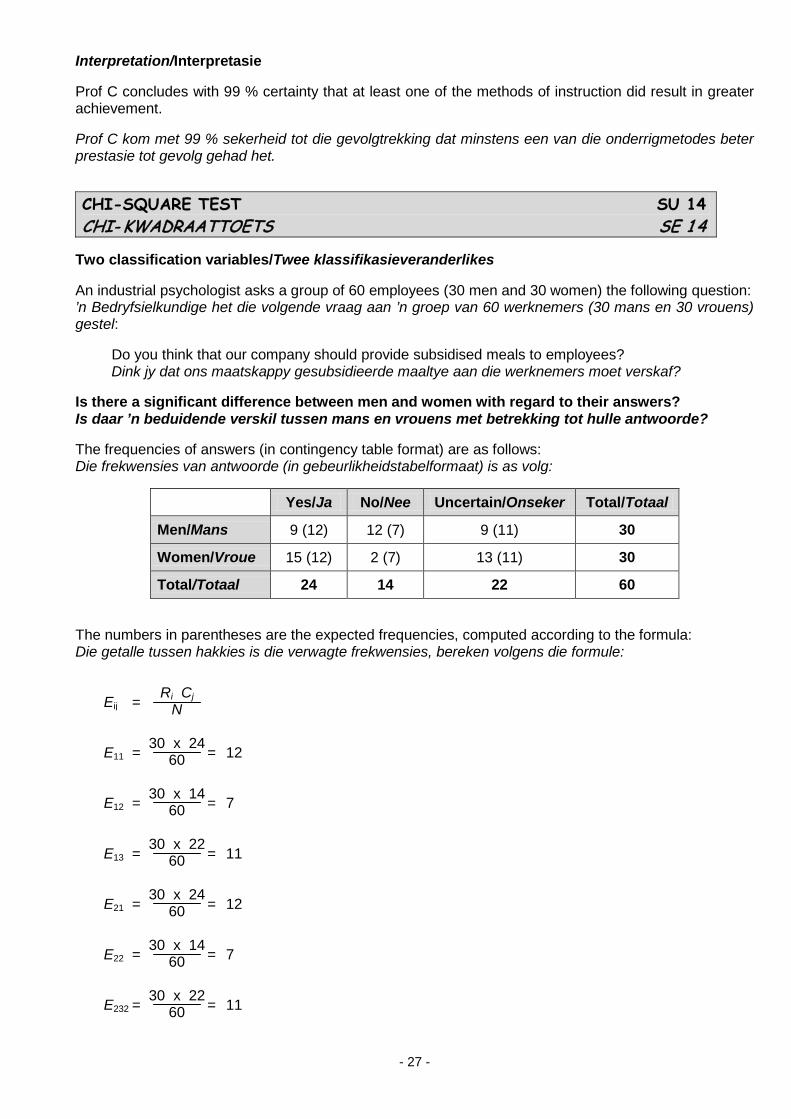
Interpretation/Interpretasie Prof C concludes with 99 % certainty that at least one of the methods of instruction did result in greater achievement. Prof C kom met 99 % sekerheid tot die gevolgtrekking dat minstens een van die onderrigmetodes beter prestasie tot gevolg gehad het.
CHI-SQUARE TEST SU 14 CHI- KWADRAATTOETS SE 1 4
Two classification variables/Twee klassifikasieveranderlikes An industrial psychologist asks a group of 60 employees (30 men and 30 women) the following question: ’n Bedryfsielkundige het die volgende vraag aan ’n groep van 60 werknemers (30 mans en 30 vrouens) gestel: Do you think that our company should provide subsidised meals to employees? Dink jy dat ons maatskappy gesubsidieerde maaltye aan die werknemers moet verskaf? Is there a significant difference between men and women with regard to their answers? Is daar ’n beduidende verskil tussen mans en vrouens met betrekking tot hulle antwoorde? The frequencies of answers (in contingency table format) are as follows: Die frekwensies van antwoorde (in gebeurlikheidstabelformaat) is as volg:
Yes/Ja No/Nee Uncertain/Onseker Total/Totaal
Men/Mans 9 (12) 12 (7) 9 (11) 30
Women/Vroue 15 (12) 2 (7) 13 (11) 30
Total/Totaal 24 14 22 60 The numbers in parentheses are the expected frequencies, computed according to the formula: Die getalle tussen hakkies is die verwagte frekwensies, bereken volgens die formule: Eij = E11 = = 12 E12 = = 7 E13 = = 11 E21 = = 12 E22 = = 7 E232 = = 11
30 x 24 60
30 x 14 60
30 x 22 60
30 x 24 60
30 x 14 60
30 x 22 60
Ri Cj N

- 28 -
E (9 - 12)² (12 - 7)² (9 - 11)² (15 - 12)² (2 - 7)² (13 - 11)² 12 7 11 12 7 11 (-3)² (5)2 (-2)² (3)² (-5)2 (2)²
12 7 11 12 7 11 = —— + —— + —— + —— + —— + —— 12 7 11 12 7 11 = 0,75 + 3,57 + 0,36 + 0,75 + 3,57 + 0,36 = 9,36 df = (R – 1)(C – 1) = (2 - 1) (3 - 1) = 2 χ2
0.05 (2) = 5,99 χ20.01 (2) = 9,21
9,36 > 5,99 9,36 > 9,21 ∴ Reject/Verwerp H0 ∴ Reject/Verwerp H0 Interpretation/Interpretasie There is a significant difference between male and female employees regarding the question whether the company should provide subsidised meals. This can be said with 99% certainty. Daar is 'n beduidende verskil tussen manlike en vroulike werknemers met betrekking tot die vraag of die maatskappy gesubsidieerde maaltye moet verskaf. Dit kan met 99% sekerheid gesê word.
(O - E)²
χ2 = ———— + ———— + ———— + ———— + ——— + ————
9 25 4 9 25 4
= ———— + ———— + ———— + ———— + ——— + ————
= —— + —— + ——— + —— + ——— + ——