Embed Size (px)
Citation preview

IOP-19 Summary of Operations 14 February 2010, 1200 UTC – 15 February 2010 1800 UTC Authors: Rauber, Brown, Knupp 1. Summary of storm evolution The IOP-19 storm was associated with a short wave propagating around the polar vortex over Hudson Bay. The strong wave aloft was associated with a sharp arctic front with a strong high pressure center to the west. The front passed by the radars during the flight and was easily detected by a sharp drop in temperature. The upper level wave produced a weak surface cyclone as it rounded the southern side of the polar vortex. The precipitation pattern formed a distinct comma cloud with the wraparound moving across southern Illinois and Indiana between 1800 UTC on 14 February and 1200 UTC on 15 February. This storm was the first in which we tried flying the aircraft between two vortacs with the ground based equipment oriented along the line between the vortacs and the MAX scanning RHIs along the line. The strategy worked perfectly and we were able to develop a complete 2D cross-section using all of the facilities. 2. Locations of instrumentation platforms MIPS Location: 38º 12' 34.89" N 86 º 51' 51.91" W MIPS Time of Operation: 2010 UTC 2/14/10 to 1800 UTC 2/15/10 MAX Location: 38 º 9' 55.36" N 87º 1' 52.08" W MAX Time of Operation: 0200 UTC 2/15/10 to 1600 2/15/10 MISS Location: 38 º 00' 43.79" N 87 º 32' 15.67" W Profiler Time of Operation: 2100 UTC 2/14/10 to 1700 UTC 2/15/10 UM Location: Not used. System was being repaired. RF-12 Flight operations: 0300 UTC- 1145 UTC 15 Feb 10
1

1200 UTC 14 Feb 10 Surface P/T/wind 1200 UTC 14 Feb 10 500 mb Ht/Vort/Wind 1159 UTC 14 Feb 10 radar
1800 UTC 14 Feb 10 Surface P/T/wind 1800 UTC 14 Feb 10 500 mb Ht/Vort/Wind 1806 UTC 14 Feb 10 radar
0000 UTC 15 Feb 10 Surface P/T/wind 0000 UTC 15 Feb 10 500 mb Ht/Vort/Wind 0006 UTC 15 Feb 10 radar
0600 UTC 15 Feb 10 Surface P/T/wind 0600 UTC 15 Feb 10 500 mb Ht/Vort/Wind 0606 UTC 15 Feb 10 radar Figure 1: Evolution of the IOP-19 storm at the surface, 500 mb, and radar echoes from 1200 UTC 14 Feb 10 through 0600 UTC 15 Feb 10.
2

1200 UTC 15 Feb 10 Surface P/T/wind 1200 UTC 15 Feb 10 500 mb Ht/Vort/Wind 1159 UTC 15 Feb 10 radar
1800 UTC 15 Feb 10 Surface P/T/wind 1800 UTC 15 Feb 10 500 mb Ht/Vort/Wind 1754 UTC 15 Feb 10 radar
0000 UTC 16 Feb 10 Surface P/T/wind 0000 UTC 16 Feb 10 500 mb Ht/Vort/Wind 0000 UTC 16 Feb 10 radar Figure 2: Evolution of the IOP-19 storm at the surface, 500 mb, and radar echoes from 1200 UTC 15 Feb 10 through 0000 UTC 16 Feb 10.
3

3. Precipitation over research area
Fig. 3: 24 Hour precipitation ending at 1200 UTC 2/15/10, and 1200 UTC 02/16/10 over the United States
4

Fig. 4: 24 Hour precipitation ending at 1200 UTC 02/15/10, and 1200 UTC 02/16/10 over Indiana.
5
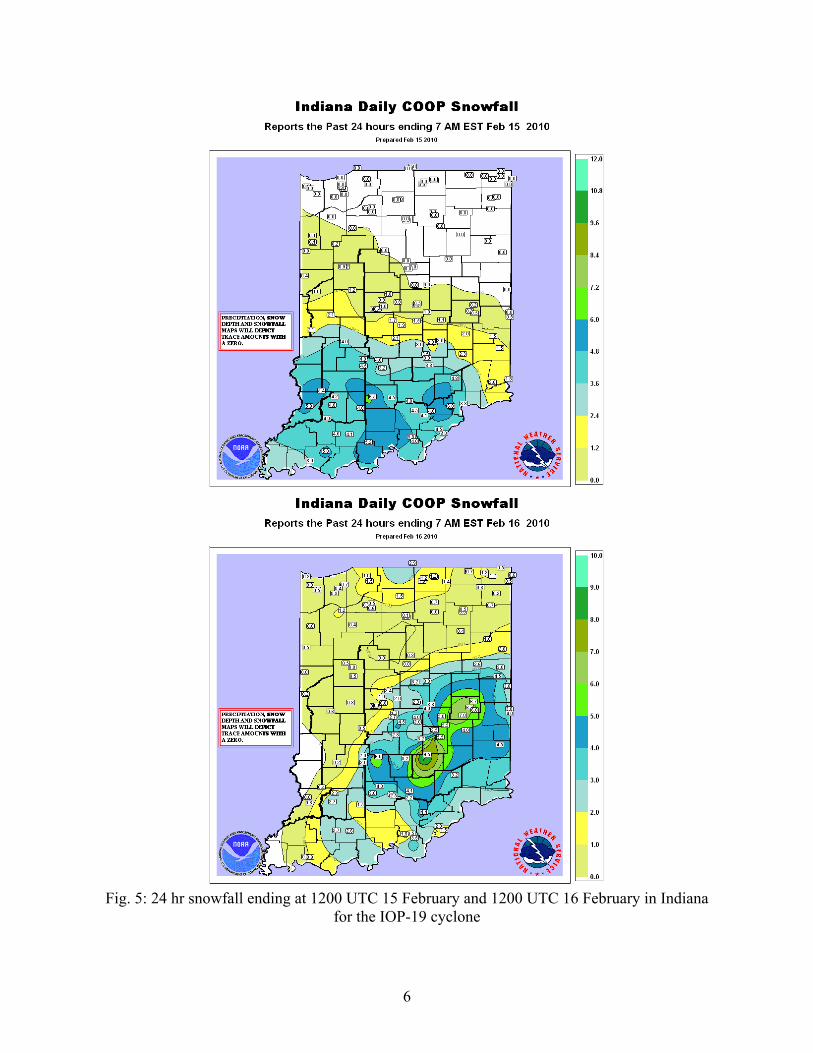
Fig. 5: 24 hr snowfall ending at 1200 UTC 15 February and 1200 UTC 16 February in Indiana
for the IOP-19 cyclone
6
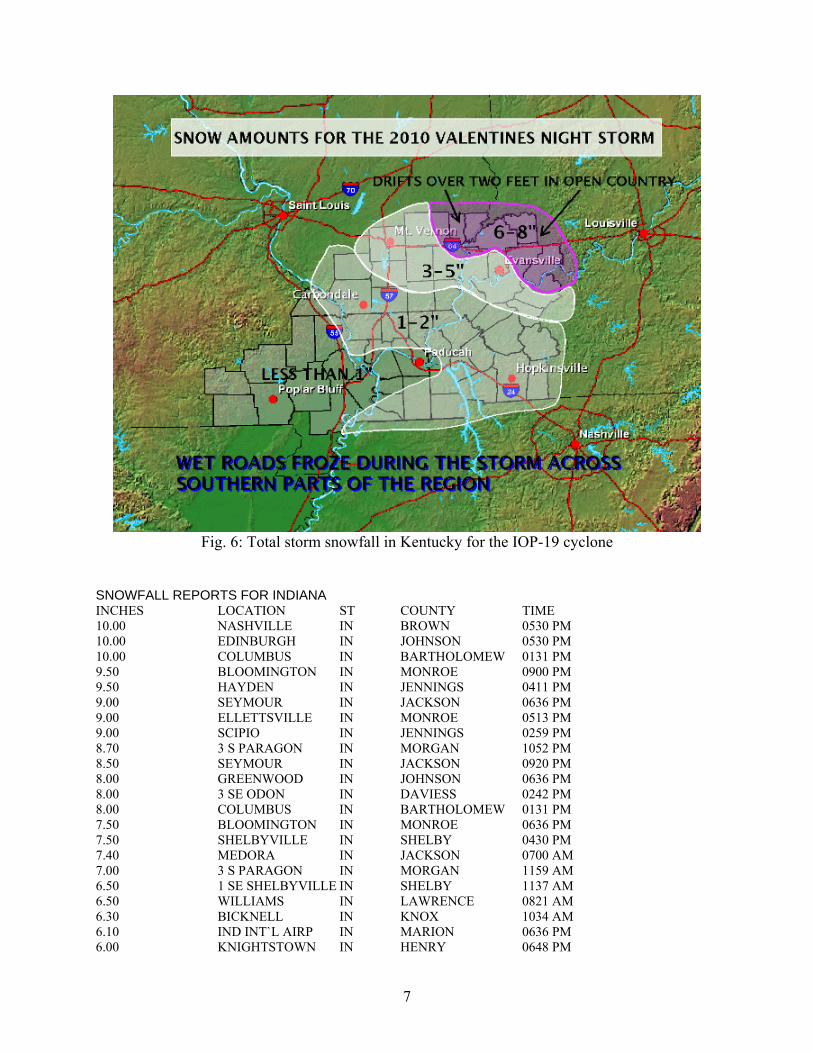
Fig. 6: Total storm snowfall in Kentucky for the IOP-19 cyclone
SNOWFALL REPORTS FOR INDIANA INCHES LOCATION ST COUNTY TIME 10.00 NASHVILLE IN BROWN 0530 PM 10.00 EDINBURGH IN JOHNSON 0530 PM 10.00 COLUMBUS IN BARTHOLOMEW 0131 PM 9.50 BLOOMINGTON IN MONROE 0900 PM 9.50 HAYDEN IN JENNINGS 0411 PM 9.00 SEYMOUR IN JACKSON 0636 PM 9.00 ELLETTSVILLE IN MONROE 0513 PM 9.00 SCIPIO IN JENNINGS 0259 PM 8.70 3 S PARAGON IN MORGAN 1052 PM 8.50 SEYMOUR IN JACKSON 0920 PM 8.00 GREENWOOD IN JOHNSON 0636 PM 8.00 3 SE ODON IN DAVIESS 0242 PM 8.00 COLUMBUS IN BARTHOLOMEW 0131 PM 7.50 BLOOMINGTON IN MONROE 0636 PM 7.50 SHELBYVILLE IN SHELBY 0430 PM 7.40 MEDORA IN JACKSON 0700 AM 7.00 3 S PARAGON IN MORGAN 1159 AM 6.50 1 SE SHELBYVILLE IN SHELBY 1137 AM 6.50 WILLIAMS IN LAWRENCE 0821 AM 6.30 BICKNELL IN KNOX 1034 AM 6.10 IND INT`L AIRP IN MARION 0636 PM 6.00 KNIGHTSTOWN IN HENRY 0648 PM
7
6.00 NEW WHITELAND IN JOHNSON 0354 PM 6.00 COLUMBUS IN BARTHOLOMEW 0229 PM 6.00 VINCENNES IN KNOX 0756 AM 5.80 NEW CASTLE IN HENRY 0600 PM 5.50 CLAY CITY IN CLAY 0636 PM 5.50 GREENSBURG IN DECATUR 0312 PM 5.50 BRAZIL IN CLAY 1044 AM 5.30 6 S TERRE HAUTE IN VIGO 0636 PM 5.30 2 SW PRAIRIETON IN VIGO 0212 PM 5.30 7 N SPENCER IN OWEN 1135 AM 5.00 STRAUGHN IN HENRY 0412 PM 5.00 JASONVILLE IN GREENE 1046 AM 4.90 SHELBYVILLE IN SHELBY 0327 PM 4.70 7 S SPENCER IN OWEN 0904 AM 4.60 BROWNSBURG IN HENDRICKS 0930 PM 4.50 FARMERSBURG IN SULLIVAN 0636 PM 4.50 WASHINGTON IN DAVIESS 0821 AM 4.20 MCCORDSVILLE IN HANCOCK 0312 PM 4.20 2 E BROOKLYN IN MORGAN 1100 AM 4.00 BRAZIL IN CLAY 0636 PM 4.00 1 N CLERMONT IN MARION 1050 AM 4.00 BEDFORD IN LAWRENCE 0622 AM 3.80 2 S CASTLETON IN MARION 0700 PM 3.50 2 NW AMO IN HENDRICKS 0904 AM 3.50 FRANKLIN IN JOHNSON 0815 AM 3.30 TERRE HAUTE IN VIGO 0839 AM 3.10 MCCORDSVILLE IN HANCOCK 0430 PM 3.00 INDIANAPOLIS IN MARION 0636 PM 3.00 DALEVILLE IN DELAWARE 0418 PM 3.00 NEW CASTLE IN HENRY 1230 PM 3.00 FRANKLIN IN JOHNSON 0700 AM 3.00 CARLISLE IN SULLIVAN 0647 AM 2.80 MCCORDSVILLE IN HANCOCK 0155 PM 2.70 2 S CASTLETON IN MARION 0116 PM 2.50 3 NW CARMEL IN HAMILTON 0636 PM 2.50 FISHERS IN HAMILTON 0240 PM 2.50 MCCORDSVILLE IN HAMILTON 1200 PM 2.50 SHELBYVILLE IN SHELBY 0550 AM 2.50 BLOOMINGTON IN MONROE 0500 AM 2.20 MCCORDSVILLE IN HAMILTON 1030 AM 2.10 2 SE CASTLETON IN MARION 1046 AM 2.00 INDIANAPOLIS IN MARION 0831 AM
8

4. Flight Summary The C-130 coordinated with the ground based radars. The flight track was aligned between two vortacs, PXV and ABB, in southern Indiana. The MAX was placed midway between the vortacs, and performed RHI scans along the line in the direction of the aircraft, switching sides as the aircraft cross the radar site. The MAX peformed a volume scan for dual Doppler with Evansville while the aircraft turned over the vortacs. The aircraft performed a stacked pattern at altitudes from 25000 to 9000 ft. Two complete stacks were performed. C-130 Flight RF-12 Flight track Overlays on the radar composites were not available for this flight because the Satcom system onboard the aircraft did not transmit position data to the ground. The track below shows the flight strategy. The track occurred between 0300 and 1145 UTC, 15 Feb 10.
0338 UTC 0439 UTC 0539 UTC 0639 UTC
0738 UTC 0839 UTC 0927 UTC 1027 UTC Figure 7: Flight track (top) and radar images during the period of the C-130 flight from 0338 UTC 15 Feb 10 through 1027 UTC 15 Feb 10.
9

0300 UTC to 0322 UTC 0322 UTC to 0344 UTC
0344 UTC to 0410 UTC 0410 UTC to 0434 UTC
0434 UTC to 0457 UTC 0457 UTC to 0511 UTC Fig. 8: Wyoming Cloud Radar Quicklook of radar reflectivity between 0300 UTC 15 Feb 10 and 0511 UTC 15 Feb 10.
10

0511 UTC to 0533 UTC 0533 UTC to 0557 UTC
0557 UTC to 0623 UTC 0623 UTC to 0648 UTC
0648 UTC to 0714 UTC 0714 UTC to 0721 UTC Fig. 9: Wyoming Cloud Radar Quicklook of radar reflectivity between xx UTC 0511 15 Feb 10 and 0722 UTC 15 Feb 10.
11

0721 UTC to 0722 UTC 0722 UTC to 0748 UTC
0748 UTC to 0821 UTC 0821 UTC to 0844 UTC
0844 UTC to 0859 UTC 0859 UTC to 0922 UTC Fig. 10: Wyoming Cloud Radar Quicklook of radar reflectivity between 0721 UTC 15 Feb 10 and 0922 UTC 15 Feb 10.
12

0922 UTC to 0945 UTC 0945 UTC to 1007 UTC
1007 UTC to 1027 UTC 1027 UTC to 1050 UTC
1050 UTC to 1117 UTC 1117 UTC to 1145 UTC Fig. 11: Wyoming Cloud Radar Quicklook of radar reflectivity between 0922 UTC 15 Feb 10 and 1145 UTC 15 Feb 10. 5. MIPS operations: The MIPS was located at the Holiday Inn Express in Ferdinand, IN. The MIPS 915 MhZ profiler had a problem with an amplifier that led to severely attenuated signal strength throughout the IOP. As a result the data from this IOP are unusable. No plots are shown. The MIPS XPR radar operated well and had no problems with attenuation since the snow was not wet. The data all appear to be in great shape. All other systems operated well, except that the hot plate had some dropout periods.
13
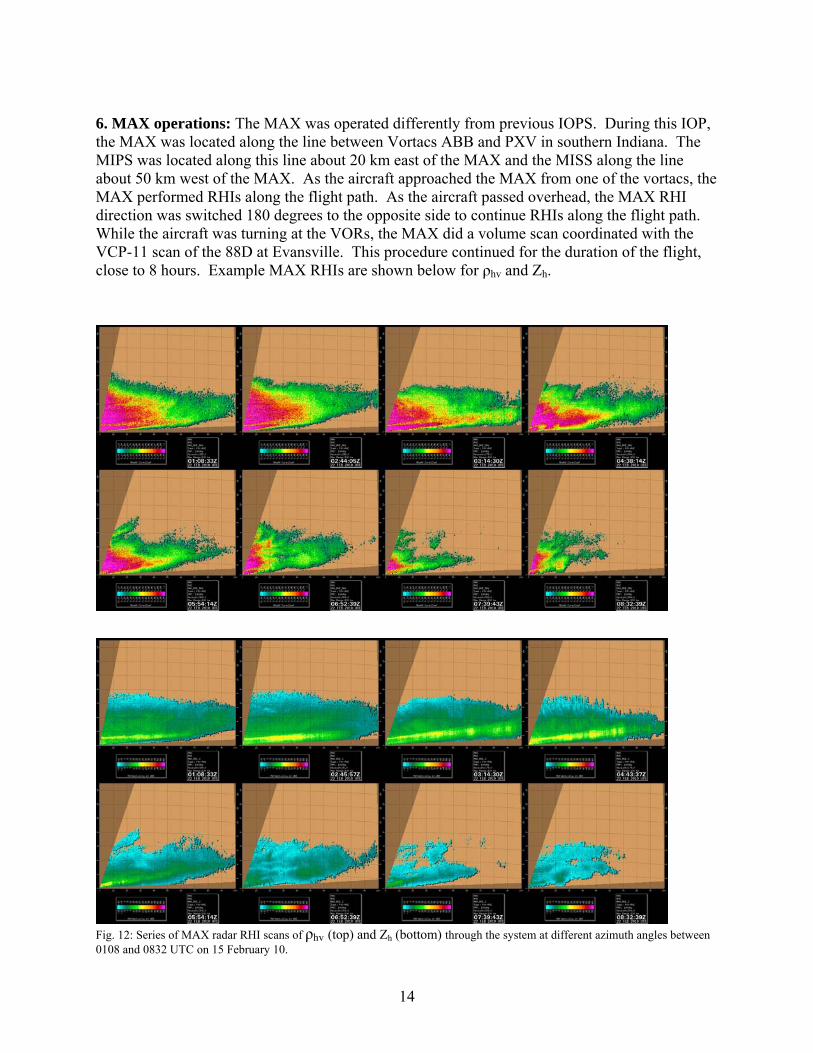
6. MAX operations: The MAX was operated differently from previous IOPS. During this IOP, the MAX was located along the line between Vortacs ABB and PXV in southern Indiana. The MIPS was located along this line about 20 km east of the MAX and the MISS along the line about 50 km west of the MAX. As the aircraft approached the MAX from one of the vortacs, the MAX performed RHIs along the flight path. As the aircraft passed overhead, the MAX RHI direction was switched 180 degrees to the opposite side to continue RHIs along the flight path. While the aircraft was turning at the VORs, the MAX did a volume scan coordinated with the VCP-11 scan of the 88D at Evansville. This procedure continued for the duration of the flight, close to 8 hours. Example MAX RHIs are shown below for ρhv and Zh.
Fig. 12: Series of MAX radar RHI scans of ρhv (top) and Zh (bottom) through the system at different azimuth angles between 0108 and 0832 UTC on 15 February 10.
14

7. MISS 915 MHz Profiler The MISS operated from a hotel just south of the Evansville Airport in Evansville, IN. Operations went smoothly with no problems for the 915 MHz profiler.
Figure 14: MISS 915 MHz Profiler Winds
for the period of operation 1700 UTC 14 Feb 10 through 1700 UTC 15 Feb 10
15

Figure 10: MISS 915 MHz Profiler SNR and Winds
for the period of operation 0000 UTC 15 Feb 10 through 1500 UTC 15 Feb 10
16
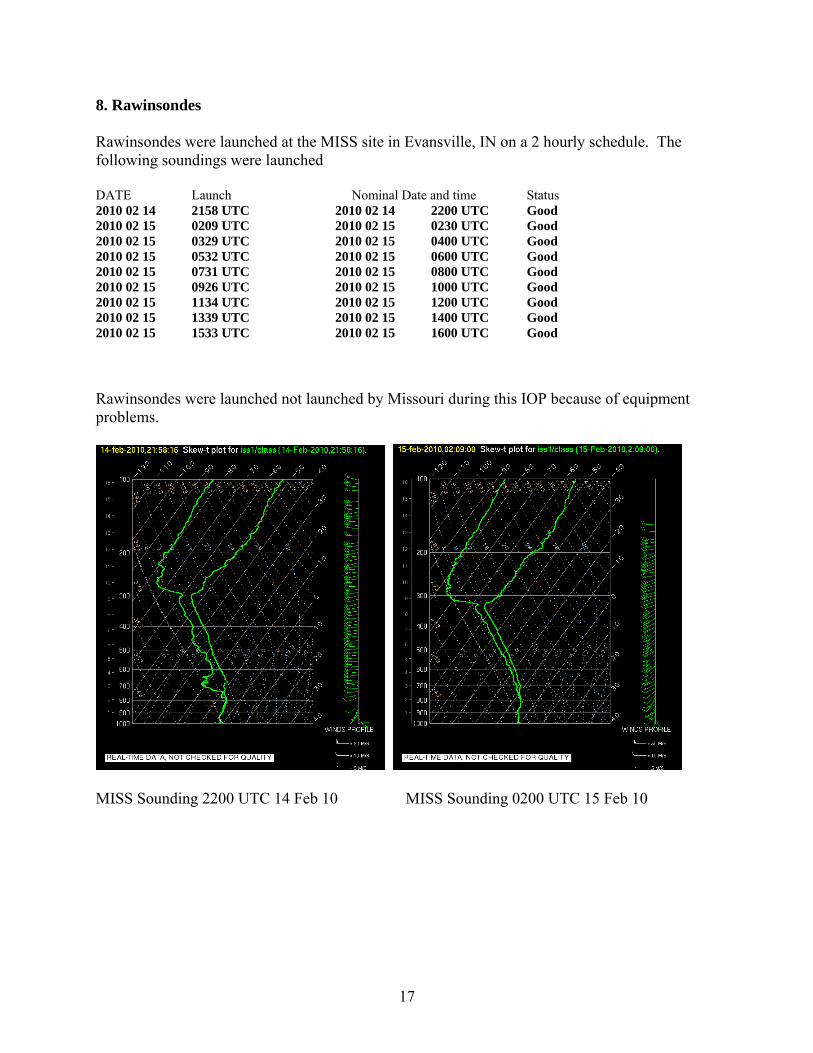
8. Rawinsondes Rawinsondes were launched at the MISS site in Evansville, IN on a 2 hourly schedule. The following soundings were launched DATE Launch Nominal Date and time Status 2010 02 14 2158 UTC 2010 02 14 2200 UTC Good 2010 02 15 0209 UTC 2010 02 15 0230 UTC Good 2010 02 15 0329 UTC 2010 02 15 0400 UTC Good 2010 02 15 0532 UTC 2010 02 15 0600 UTC Good 2010 02 15 0731 UTC 2010 02 15 0800 UTC Good 2010 02 15 0926 UTC 2010 02 15 1000 UTC Good 2010 02 15 1134 UTC 2010 02 15 1200 UTC Good 2010 02 15 1339 UTC 2010 02 15 1400 UTC Good 2010 02 15 1533 UTC 2010 02 15 1600 UTC Good Rawinsondes were launched not launched by Missouri during this IOP because of equipment problems.
MISS Sounding 2200 UTC 14 Feb 10 MISS Sounding 0200 UTC 15 Feb 10
17

MISS Sounding 0400 UTC 15 Feb 10 MISS Sounding 0600 UTC 15 Feb 10
MISS Sounding 0800 UTC 15 Feb 10 MISS Sounding 1000 UTC 15 Feb 10
18

MISS Sounding 1200 UTC 15 Feb 10 MISS Sounding 1400 UTC 15 Feb 10
MISS Sounding 1600 UTC 15 Feb 10
19


![12[1]. IOP](https://img.dokumen.tips/doc/110x75/5475bb2eb4af9fa30a8b5d8f/121-iop.jpg)