Embed Size (px)
Citation preview

Chem.Anal. (Warsaw), 41, 873 (1996)
Ion Exchange Behaviour of Cadmium on AmphotericIon Exchange Resin Retardion lIAS and its Application
for the Determination of Cadmiumin Biological Materials by Neutron Activation Analysis
by Zbigniew Samczynski and Rajmund Dybczynski*
Department ofAnalytical Chemistry, Institute ofNuclear Chemistry and Technology,ul. Dorodna 16, 03-195 Warszawa, Poland
Key words: ion exchange, amphoteric ion exchange resin, neutron activation analysis,
biological materials, certified reference materials, separation methods,
trace analysis
The· newly modified version of the method for the determination of cadmium inbiological materials by radiochemical NAA based on selective post irradiation separation of Cd using ion exchange resin Retardion HAS is presented.The conditions necessary for the selective retaining of Cd on the column exploiting bothanionic and cationic ion exchange function of the resin have been discussed. Dependingon the composition of the external solution, cadmium existing in the form of eitheranionic chloride complexes or cationic ammine species is taken up by quaternaryammonium or carboxylate functional groups respectively, while accompanying elements are eluted.The NAA method was further verified by determining Cd content in several certifiedbiological reference materials. Detection limit for Cd was 0.5 J.tg kg-to Analytical resultsshow good agreement wi th the certified values.
Zaprezentowano zmodyfikowanq wersjt; metody oznaczania kadmu w materialach biologicznych za pomocq radiochemicznego wariantu neutronowej analizy;tktywacyjnej,opartq na selekt}"wnym wydzieleniu Cd z pr6bek po napromienianiu w reaktorzejqdrowym, stosuj1\.c amfoteryczny wymieniacz jonowy Retardion HAS.Zostaly om6wione warunki konieczne dla selektywnego zatrzymania kadmu na kolumnie wykorzystujqC zar6~no aniono jak i kationowymienn1\. funkcjt; jonitu. W zaleznosciod skladu roztworu zewnt;trznego kadm istnicjqcy w formie anionowych kompleks6w
* Corresponding author.

874 Z. Samczynski and R. Dybczynski
chlorkowych bC\di kationowych kompleks6w aminowych moze bye zatrzymany odpowiednio przez czwartorzttdowe grupy amoniowe lub grupy karboksylowe przy jednoczesnym wymyciu pierwiastk6w towarzysZC\cych.Opracowany schemat rozdzielczy pozwala na selektywne i ilosciowe oddzielenie kadmuod praktycznie wszystkich towarzyszC\cych radionuklid6w..Weryfikacjtt dokfadnosci opracowanej metody NAA przeprowadzono oznaczaj<\c kadmw kilku materiaJach odniesienia pochodzenia biologicznego atestowanych na zawartoseCd. Granica wykrywalnosci dla Cd wynosilaO.5 ~g kg-I. Wyniki oznaczen analitycznych pozostawaly w dobrej zgodnosci z wartosciami atestowanymi.
Accurate determination of cadmium in biological materials is ofgreat importancedue to its toxic properties, still growing concentration level of this metal in biosphere,and its tendency to accumulation in human body (mainly in kidney) with biologicalhalf-life of more than ten years [1].
The most frequently employed analytical method for cadmium determination isatomic absorption spectrometry with flame and graphite furnace [1].
It is necessary, however, to possess at least one and at best several alternativetechniques of high reliability which could be used not necessarily in routine analyses,but rather for verification of a given analytical procedure or in the process ofcertification of reference materials.
Neutron activation analysis because of its favourable detection limits as well asminimization of the problem of blank, seems to be logical method of choice for thedetermination of trace amounts of Cd.
Ion exchange is a widely used method for radiochemical isolation of cadmium,mainly with the aid of monofunctional strongly basic and strongly acidic ion exchangers [2,3].
Amphoteric ion exchange resins have been very rarely applied in inorganic traceanalysis. Investigations on application of amphoteric ion exchangerRetardion lIASfor inorganic separations have been carried out in this Laboratory. Possibility ofseparation of several elements was demonstrated [4,5] as well as methods fordetermination of trace amounts of zinc [6] and cadmium [7] by radiochemicalNAAusing Retardion lIAS were elaborated.
In this work the improved version of the above mentioned method of Cddetermination intended especially for biomaterials of very low cadmium content hasbeen devised.
EXPERIMENTAL
Ion exchange resins, radioactive tracers
Amphoteric ion exchange resin Retardion 11A8 (Bio Rad Laboratories), particle size: 23-46 ~mand carboxylic acid resin Amberlite IRC-50 (SeI:va), particle size: 40-56 ~m were used. The methodsused for grinding, fractionating and purification of the resins were as described earlier [8].
The following radioactive tracers were used: l1SCd_llSmln (53.5 h-4.5 h), 6SZn (245 d), 24Na (15 h),60Co (5.26 y), S9Pe (44.6 d), 203Hg (46.9 d), 64Cu (12.8 h), l10mAg (253 d), 99Mo-99mTc (66.0 h-6.0 h),46Sc (83.8 d), 122Sb (66.0 h), 186Re (90.6 h), , 72Ga(14.3 h), 7SSe 021 d), 197pt (18.3 h), I09Pd (13.5 h),

Ion exchange behaviour ofcadmium... 875
S4Mn (313 d). s4Mn was supplied by the Centre for Production and Distribution of Isotopes (Swierk,Poland). All other tracers were prepared by neutron irradiation of spectrally pure salts or oxides in thePolish reactor EWA (Swierk, Poland).
Procedures
Weight distribution coefficients, J.. (amount per g of dry ion exchanger/amount per ml of solution)were determined by the batch equilibration method [8] at room temperature and calculated from:
Ao-As vJ..---x - (1)
As "'i
whereAo,As denote initial and final activity of the radionuclide in solution, v - volume of solution, ml,mj -weight of the dry ionexchanger,·g.
Column experiments were' carried out using glass columns of Ld. 3-5 mm containing the resin bedofthe height 5-15 cm supported on a quartz wool plug. The effluent was collected in fractioJ1s of severaldrops in flat bottomed test tubes employing a fraction collector Redifrac (Pharmacia, LKB). In caseswhen weight distribution coefficients were determined froni elution curves, they were calculated fromthe formula [2]:
Umax - (Uo+ V)J..-------
mi(2)
where Umax denotes retention volume, ml, Uo- dead volume of the column,ml, V - free volume of theresin bed, ml, mj - mass of the dry ion exchanger in the column, g.
Concentration of chloride ions and pH measurements in fractions were determined potentiometrically with the combined chloride ion selective electrode 96-17B and pH combined electrode 81-15(Orion) connected to a pH-meter model 720A (Orion)..The electrodes were standardized before eachseries of m.easurementspreparing calibration curves using. pH ,buffer solutions and Cl- standardsolutions,respectively.
Gamma-ray spectrometric measurements were performed by means of 213 cm3 HPGe coaxialdetector (Ortec) with associated electronics (resolution 2.1 keY for 1332 keY 60Co line, efficiency ca.40%) coupled to the multichannel analyzer TUKAN (Institute of Nuclear Problems f Swier~, Poland) intbeform of a card plugged into an IB~PCAT computer.
Neutron activation analysis
Known amounts (ca. 100 mg) of biological materials (CRMs) were weighed into aluminum foil ofvery high purity. Standards (5 J.tg Cd) were prepared by dropping appropriatealiquots of standardsolution onto Al foil and eyaporation. Samples, standards and blank (empty AI bag) were wrappedtogether into Al foil and irradiated in EWA reactor at' a thermal neutron flux of lxl013 n cm-2s-1 or8xl013 n cm-2s-1,respectively. Irradiation time varied between 16 and 48 hours. Mter 3-S day coolingeach sample was unpacked, transferred to a Teflon beaker, the inner surface of the bag was rinsed withconcd. HN03, the washing being added to the beaker. The samples were mineralized with HN03 + HCI04mixture (1+1). 20 J.tg of Cd(II) carrier and 10 mg of NH4Br were added to all samples beforemineralization. In order to remove Si02, 2 ml of concd. HF was added and the solution was evaporatedto dryness. This operation was repeated twice. The residue was afterwards dissolved in 2 mol I-I HCland transferred quantitatively onto the top of Retardion HAS column (15 cm x 0.126 cm2, particle size23-46 J.tm). The column was washed twice with 10 ml of 2 moll~1 tICI followed by 10 ml of 1 mol 1-1NH3 + 0.1 mol I-I NH4CI, then with 30 ml of 0.05 molJ-1 NH3 + 2.0 mol I-I NH4Cl. Finally cadmiumwas eluted by means of 10 ml of 8 mol 1-1 NH3 + 1.0 mol I-I NH4CI collecting the eluate in a 50 mlpolyethylene bottle.
Standards were dissolved in2 mol I-I HCI, and one of them was run through the above procedurewith the exception of removing of Si02, while the other was brought to the same volume as the finaleluate and measured directly.

876 z. Samczynski and R. Dybezynski
Gamma-ray spectrometric measurement was accomplished after the equilibrium between uSCd andl1smIn had been established (i.e. after at least 24 hours). Depen-ding on the material, counting time variedbetween 0.5 and 20 hours. Moisture content in the analyzed materials was determined in separate samplesaccording to the recommendations of the manufacturers. Cadmium content was calculated from theequation:
{
A~fr(s) x ~d [0.693(ts -1st>] BL} 6 (3)CCd (mglkg) - . ( t) exp T - - x 10
AC~r s x ms ms
where m~w ms denote mass of cadmium standard and of dry sample (J.tg), respectively, BL - residualblank (J.tg) (mean amount of Cd washed out from the Al foil bag), T - half-life of u5Cd (53.5 h), ts - tst
-clock time difference between the beginning of measurement of the sample and standard, respectively,Ac~r - cadmium photopeak count rate corrected for decay during the measurement as well as dead timeand pile-up losses, i.e.:
•Jslst) A* 0.693corr(s/st) lVCd x puIs x -r
ACd ... A (s/st) [ 1·- (- 0.693M)JpuIs exp T
(4)
(5)
where Nc~t) denotes net number of counts in the cadmium photopeak, M - time of measurement, A;u1s- standard pulser photopeak count rate (as recorded in the absence ofa sample),A~S~i~- pulser photopeakcount rate recorded when measuring the sample or standard, respectively.
RESULTS AND DISCUSSION
Retardion llA8 containing both strongly basic benzyltrimethylammoniulllgroups and an equivalent amount of weakly acidic carboxylate groups is an amphoteric ion exchanger. It is so called "snake in cage" resin, where linearpolyacrylicchains with carboxylate groups (snake) are intricately intertwined with crosslinkedstyrene-divinylbenzene skeleton (cage) [9]. Although linear chains are not covalentlylinked to the polystyrene matriX, they are enmeshed so firmly in the skeleton, thatthey cannot be washed o~t.
Depending on the composition of the external solution, elements existing asanions or anionic complexes can be taken up by anion exchange groups, as well asthose existing as cations or cationic complexes can be retained by cation exchangegroups. Ion exchange behaviour of more than twenty elements (including cadmium)in a wide range of concentrations of hydrochloric acid and ammonia solutions wasestablished by means of batch equilibration method. The most interesting examplesare presented in Fig. 1. The results are in general in accordance with those obtainedpreviously [4,5] for some elements.
In HCI solutions cadmium exists in the form of chloride complexes [10,11]. Themole fraction of individual species can be calculated from the equation [11]:
~i[Li<Pi=--N---
1 + ~~i[Lii", 1

Ion exchange behaviour ofcadmium... 877
where [L] is concentration of the ligand, ~i - cumulative stability constant of the ithcomplex, N - maximum ligand number.
..c
-E.!t0
5:•00
~ 1000
:s@1t 10;;1:at..•
0.01 0.1 10 20
20000
..c 10000
'i•:! 1000
10~ 100
i! 10
"1:at..•
N.
0.01 0.1 10 20
concentration of "Hs. mol·t"'
Figure 1. Distribution coefficients ofcadmium and other elements in the systems: Retardioill1A8-xmol 1-1 HCI and Retardion llA8-x moll~1 NH3 +0.1 moll~1 NH4CI, respectively
Mole fractions of particular cadmium chloride complexes as a function of theligand concentrations are presented in Fig. 2.
1.00
•C 0.800;:
0.60uaL....• 0.40'0E 0.20
0.000.001 0.01 0.1 10
concentration of -. -tel, moll
1.00
• 0.80 Cd(Jti,~C0
0.60;:uaL.
0.40...•'0 0.20E
0.000.001 0.01 0.1 10
• -tconcentration of N~.mol I
Figure 2. Mole fraction distribution of cadmium chloride complexes in HCI solutions and cadmiumammine complexes in NH3 solutions, respectively .

878 z. Samczytiski and R. Dybczytiski
In hydrochloric acid solutions, carboxylic groups of Retardion llA8 arepractically undissociated, so the ion exchange of Cd chloride complexes can beregarded in a manner analogous to strongly basic anion exchangers [2] i.e.:
[CdCI3][CI-]
[CdCI3][CI-j(6)
(7)
(8)
uCdC12- [CdCI~-][CI-]2ACI- 4 = -----
[CdCI~-][CI-]2
[Cda2]K CdCI2 = [CdCI2]
where barred symbols refer to the ion exchanger phase, .lQS~cl3 , ~~CI~- are theselectivity coefficients for the respective ion exchange reactions and KCdCI2 is thedistribution coefficient of the neutral complex CdClz. The overall distribution coefficient of cadmium can be written as follows:
(9)
Combining equations (6)-(8) with the appropriate ones for the formation of Cdchloride complexes in the solution, after rearrangements Acd takes the form:
T..l:dCI- - TA""dCI2- - 2Acd = <PCdCI2{KCdCI2 + ACI- 3 K 3[CI-] + ACI- 4 K3 K 4 [CI-] } (10)
where K 3, K4 are the stepwise stability constants of CdCl3 and CdCG-, respectively,<PCdC1z is the mole fraction of the neutral complex CdClz in the solution.
As follows, the overall distribution coefficient should be proportional to the molefraction of CdClz and should reach the highest values in the CI- concentration rangewhere the neutral complex predominates in the solution.In general, anion exchange reaction of the metal MV+ forming complexes withunivalent ligand X- can be written as:
Mxy-i + (i - v) x- ~ MXy-i + (i - v)X
and the corresponding .selectivity coefficient ki is given by:
(11)
Ai [X-i -v
<Pi [X-i- V(12)
where Ai is the distribution coefficient of the ith complex. The overall distributioncoefficient of the metal AM is:

Ion exchange behaviour ofcadmium... 879
(13)
(14)
After transfonnation of Eq. (12) into logarithmic form, rearrangement to express Aias a function of other parameters, differentiation with respect to 10g[X-] and considering the known relation [12]:
d log epi .----=l- nd 10g[X-]
where 'If is average ligand number as well as taking into account Eq. (13) one canfinally obtain:
dlogAM
d log[X-]
N N
~ (i - Ii + v- i) =v - Ii =v - ~ iepii-O i-O
(15)
This relationship was derived with some simplifications i.e. using concentrationsinstead of activities and assuming that the invasion of the supporting electrolyte intothe. resin is negligible. More rigorous approaches taking into account these factorsyield much more complicated expressions [13,14], but the general picture .remainsessentially the same. The right-hand side of Eq. (15) represents the average chargeof the metal-ligand complexes in solution which can be found from the slope of theplot logAM vs. log[X-] . As can be seen in Fig. 1, in dilute Hel solutions th~positiyelycharged complex ion CdCl+ prevails (slope close to +1). At higher concentrations(CHCI> 3 moll-i) the slope gradually changes from -1 tQ -2 indicating the existenceof negatively charged species CdCl3 and CdCij-. The highest affinity of Cd towardsRetardion llAB at around 2 mol 1-1 Hel i.e. is shifted towards higher Hel concentrations with respect to the calculated maximum of the mole fraction of CdClz (c.f.Fig. 2). This discrepancy is most probably caused by simplifications made whenderiving Eq. (15). The dependence of Acd vs. CHCI for RetardionllA8 is very similarto that obtained for the strongly basic anion exchange resin Dowex lX10 [15].
In ammoniacal solutions cadmium exists in the fonn of moderately strongammine complexes [10,11]. Mole fraction distribution of them as a function of NH3concentration obtained by using Eq. (5) are shown in Fig. 2. Carboxylic acid groupsof Retardion llA8 become at least partly ionized and cadmium ammine species canbe taken up by the resin in these conditions.
As is known from the literature, however, in the case of ion exchangers containingfunctional groups of complexing properties such as carboxylate, iminodiacetate etc..the interaction with solvated metal cations is not only electrostatic [16,17]. It issuggested, that the metal forms to some extent coordinate bonds with the functionalgroups. This process is accompanied by releasing of one or more solvating moleculesfrom the coordination sphere of the metal which are replaced by the functional groupsof the resin [18].
A schematic reaction between a given Cd-NH3 complex and Retardion llA8 canbe written as follows:

880 Z. Samczytiski and R. Dybczynski
2RCOONH4 + Cd(NH3)~+ ~ (RCOOhCd(NH3)n -x + 2NH4 + X NH3
KSU~H3);+ = [(RCOOhCd(NH3)n - xl [NH4l2
[NH3f (13)N 4 [Cd(NH3)~+l [RCOONH4l2
10~~F3);+ = log Acd + 210g[NH4l + xlog[NH3l - 210g[RCOONH4l
Differentiation with re~pect to log[NH4 land log[NH3l yields:
d log Acd
d log[NH4l =-2 (14)
d log Acd = =X (15)d log[NH3l
The above relationships were verified experimentally by detennining weightdistribution coefficient of cadmium with the aid of elution technique ~s a function ofconcentration of ammonium cation at constant [NH3l (Fig. 3), and concentration ofammonia at constant [NH4l (Fig. 4). The value of 10gAcd decreases as concentrationof ammonium salt increases due to nonnal'mass - action law. The slope of thedependence 10gAcd vs. log[NH4l (c,.f. Fig. 3) in each case is very close to -2, whichis in agreement with the above considerations and seems to be evident from theconservation of charge principle.
1000.,...-------------------....
101l----.....----,.---,.----.--,..-r-T'"T""T'-----r-..,.--.-~.........__._._f
0.1
10
100
1
concentration of NH:. mol 1-1
Figure 3. Weight distribution coefficients of cadmium as a function of the concentration of ammoniumcation at constant concentration of ammonia. Column: 8.5 cm x 0.0707 cm2; Retardion HAS(23 ~ ep ~ 46 ~m)
If there is exclusively a purely electrostatic interaction between ammine complexes of a metal and functional groups of an ion exchanger, the value of thedistribution coefficient may either increase or may be independent on ammonia

Ion exchange behaviour ofcadmium... 881
concentration. The first situation was observed for strongly acidic resins containingsulfonic groups which are unable to form any coordinate bonds. A number of metalsforming ammine complexes exhibits increased affinity towards these ion exchangersin more concentrated NH3 solutions where higher coordinated metal ammoniaspecies predominate [18,19].
1000.r------------------------....,
100.1
concentration of NH3 , mol 1-1
, ......-,-r--..--r_"T'"'I""T"I""Ir---_....................,.......,r-rr---_,-r-..........,...........,.....0.01
-<i•u= 100•ouco;::::t.0&: 10III:a
1000 r-----------------------------....,i•u:;:-~ 100uCo
:;::::t.0&:1ii 10:a-.coa..•
o.t 1
concentration of NH3' rnol 1-1
b)
10
Figure 4. Weight distri bution coefficients of cadmium as a function of the concentration of ammonia atconstant concentration of ammonium cation established for: a) Retardion HAS; column:8.5 cm x 0.0707 cm2; (23 s ep s 46 !-tm). b) Amberlite IRe-50; column: 8.5 cm x 0.0707 cm2;
(40 s ep.s 56 !-tm)
The latter situation occurs for the ion exchange of metals forming very stable andinert ammine complexes on cation exchangers with functional groups exhibiting

882 Z. Samczy6ski and R. Dybczynski
complexing properties e.g. carboxylic, iminodiacetic, phenolic etc. In this case thosegroups cannot compete effectively with ammonia molecules for a metal [18] and A.Mremains practically constant in the whole range of NH3 concentrations. Such behaviour is also observed in this work for palladium and platinum (Fig. 1).
Cation exchange of ammine complexes when both coordinate and ionic bondsare formed may result in distipct decrease of tbe weight distribution coefficient of ametal with the increase of NH3 concentration. As can be seen from Fig. 4a, this kindof interaction takes place between cadmium and Retardion llA8. The slope of theplot: 10gA.Cd vs. log[NH3] of nearly -2 corresponds to displacement of two ammonialigands initially bound to the central ion Cd2+ by two carboxylate groups. Cadmiumseems to be retained more strongly if it is coordinated by two functional groups. Thiscould explain substantially greater values of the weight distribution coefficient of Cdin dilute NH3 solutions where complex~s of lower number of ammonia moleculespredominate (Fig. 2). In concentrated NH3 solutions significant part of cadmium iscoordinated by only one carboxylate group and this is reflected by the change of theslope of the dependence logA.cd-log[NH3] (Fig. 4a). Relatively weak ad&orption ofcadmium in these conditions can be explained by the growing competition ofammonia molecules with carboxylate groups for Cd2+ and generally lower affinityof cadmium ammine complexes to the resin in comparison to cadmium aquo-complexes. Thus, cation exchange behaviour of cadmium in ammoniacal solutions is
-quite reverse compared to strongly acidic sulfonic cation exchangers [18,19].For comparison, an analogous dependence logACd-log[NH3] obtained for mono
functional cation exchanger Amberlite IRC-50 containing also carboxylate groups ispresented in Fig. 4b. The observed tendency as well as the general conclusions areessentially the same. One can easily note, that Cd exhibits higher affinity towardsmonofunctional Alnberlite IRC-50 compared with amphoteric Retardion 11A8. Thereason of this difference may be the steric hindrance caused by the vicinity ofquaternary ammonium groups in the latter ion exchanger as well as much higherexchange capacity of Amberlite IRC-50.
As follows from the above considerations, both in HCl and NH3 solutions thereexist quite pronounced ranges of concentrations where cadmium shows high affinitytowards Retardion IlA8. This enables selective retaining of cadmium on the column,whereas accompanying elements can be eluted while changing ion exchange functionof Retardion IlA8 from anion to cation exchange function and vice versa.
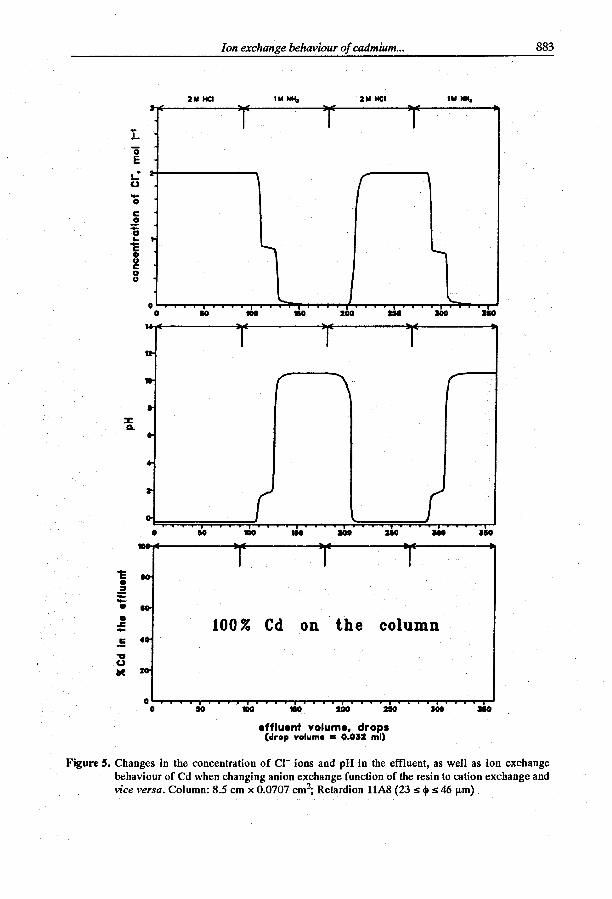
Elution behaviour of Cd together with the changes of concentration of chlorideions as well as pH in the effluent are presented in Fig. 5. As can be seen, after theeluent has been changed from 2 mol 1-1 HCl to 1 mol 1-1 NH3, when concentrationof Cl- gradually decreases to practically zero, and pH raises from acidic to weaklybasic, cadmium initially existing in the form of chloride cO,mplexes is transformedinto ammine complexes, which are also strongly held by the ion exchanger. Thereverse course of the CCl- and pH dependencies is observed when the bed is rinsedwith 2 mol 1-1 HCI again i.e. the ion exchange function of Retardion IlA8 is -beingchanged from cationic to anionic this time.
Ion exchange behaviour ofcadmium... 883
2M HCI 1M M\l 2M ItCI ,., 11M.
ZIGzoo10050o
-~ -~ -~ -- T 1 T
,(
,
..
'"'"'".......,
0 '- J '-, ,
"0E,.(3-oc:.!'0~
C•oc:oo
100210100
tIO
110
tOO
100
100 % Cd on the column
10
10
::z::Q.
0
c•.!-••.c:-.5"V(,)
M
00
.ffluent volume, drops(drop volume =0.012 ml)
Figure 5. Changes in the concentration of CI- ions and pH in the effluent, as well as ion exchangebehaviour of Cd when changing anion exchange function of the resin to cation exchange andvice versa. Column: 8.5 cm x 0.0707 cm2; Retardion HAS (23 s ep s 46 f.tm)
884 Z. Samczynski andR. Dybczynski
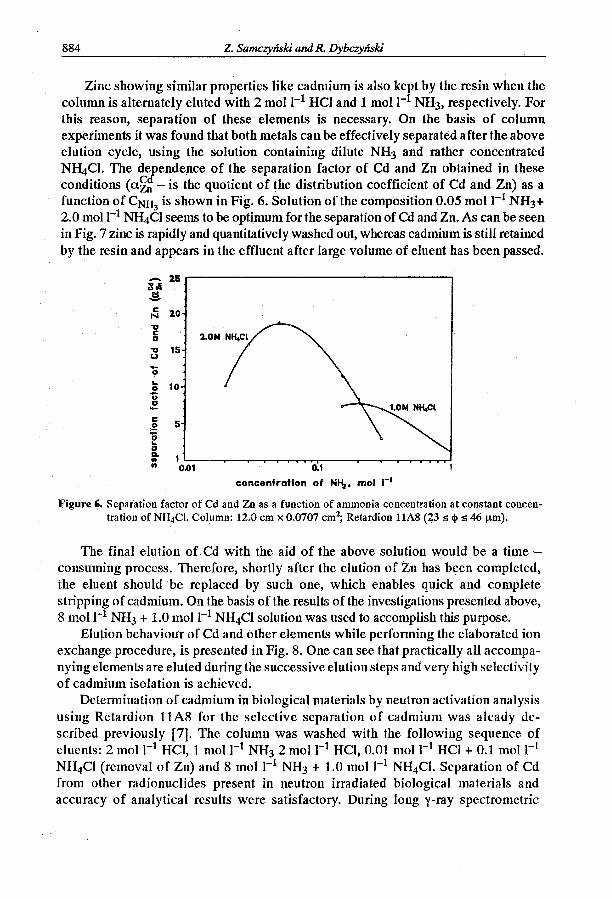
Zinc showing similar properties like cadmium is also kept by the resin when thecolumn is alternately eluted with 2 mol 1-1 HCl and 1 mol 1-1 NH3, respectively. Forthis reason, separation of these elements is necessary. On the basis of columnexperiments it was found that both metals can be effectively separated after the aboveelution cycle, using the solution containing dilute NH3 and rather concentratedNH4CI. The de;>endence of the separation factor of Cd and Zn obtained in theseconditions (a~n - is the quotient of the distribution coefficient of Cd and Zn) as afunction of CNH
3is shown in Fig. 6. Solution of the composition 0.05 mol 1-1 NH3+
2.0 mol 1-1 NH4Cl seems to be optimum for the separation of Cd and Zn. As can be seenin Fig. 7 zinc is rapidly and quantitatively washed out, whereas cadmium is still retainedby the resin and appears in the effluent after large volume of eluent has been passed.
- 15C11iS.c 2.0N
"UCClI
"ClI 15(.)-0~ 10.fuClI-I:
5.20~
ClIQ.
1"" 0.01 0.1
concentration of NIiJ. mol 1-·
Figure ~. Separation factor of Cd and Zn as a function of ammonia concentration at constant concentration of NH4CI. Column: 12.0 em x 0.0707 cm2; Retardion HAS (23 s ep s 46 ~m).
The final elution of Cd with the aid of the above solution would be a time consuming process. Therefore, shortly after the elution of Zn has been completed,the eluent should be replaced by such one, which enables quick and completestripping of cadmium. On the basis of the results of the investigations presented above,8 mol 1-1 NH3 + 1.0 mol 1-1 NH4Cl solution was used to accomplish this purpose.
Elution behaviour of Cd and other elements while performing the elaborated ionexchange procedure, is presented in Fig. 8. One can see that practically all accompanying elements are eluted during the successive elution steps and very high selectivityof cadmium isolation is achieved.
Determination of cadmium in biological materials by neutron activation analysisusing Retardion llA8 for the selective separation of cadmium was aleady described previously [7]. The column was washed with the following sequence ofeluents: 2 mol 1-1 HCl, 1 mol 1-1 NH3 2 mol 1-1 HCl, 0.01 mol 1-1 HCl + 0.1 mol 1-1NH4Cl (removal of Zn) and 8 mol 1-1 NH3 + 1.0 mol 1-1 NH4CI. Separation of Cdfrom other radionuclides present in neutron irradiated biological materials andaccuracy of analytical results were satisfactory. During long y-ray spectrometric

Ion exchange behaviour ofcadm4J.m... '885
..-'c=:>...."...-2i..."
0.05" NH. + 2.0" NH.Ct
Zn
MOO
Cd
O'---r--r-..,...-,---r--,r--r-"-~..,...-r--r-........,r--r-""'olIi-..,.....,..--r--,r--r-'r""....-..,...--TI""''''''
o
Effluent volume, drops(drop volume =0.032 ml)
Figure 7. Separation of Cd and Zn after the stepwise elution cycle. Column: 12.0 coo x 0.0707 cm2;
Retardion 11A8 (23·~+~ 46 J1m)
2M Hel 2M Hel 'M NH3 +0.1" NH..CI
0.05" NH3 +2.0" NH..CI
8M ~+1.0 III NH..CI
550
Cd
500~o
Zn
No (tr•••)
Sb (trac••)
350
Mo, lb.
300250
Sb,8r
200"0
Ir.
In. Na. U,
100so
Na. K.
In. Co. Ga,
La. re. Cr.
8r. Ca. Sr.
Rb, Ce, So,
Th, Sb, Mo
0L.,-T"'T..,...,r-r-T'T.....,..,...r-rT"'T..,...,r-r-rT'T"'T..,...,~rT'T"'T..,...,r-r-rT''T'''T~~T''T...,.., .....,..,..T''T...,..,....r-rT''to
In-'c:s:>....ot.--:0t.O
effluent volume, c;Jrops(drop volume =0.032 ml)
Figure 8. Elution behaviour of cadmium and other elements while performing the elaborated ionexchange procedure. Column: 12:0 em x 0.0707 cm2; Retardion liA8 (23 ~.+~ 46 J1m)
886 z. Samczyriski and R. Dybczynski
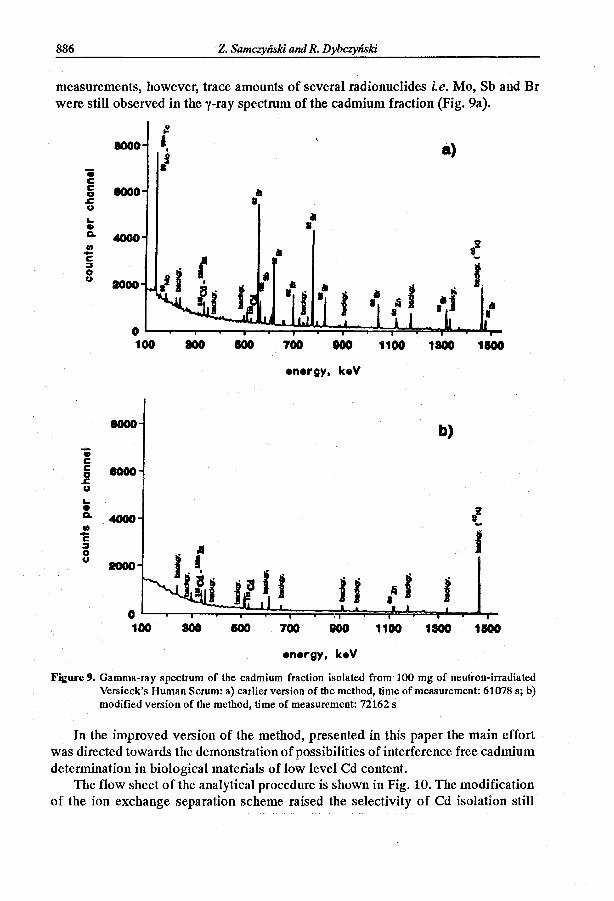
measurements, however, trace amounts of several radionuclides i.e. Mo, Sb and Brwere still observed in the y-ray spectrum of the cadmium fraction (Fig. 9a).
{!.
1000 I a)I
.!..cc 1000 III0
.&; •U
L- Ib• •~ 4000lrJ
III 1~-c •:J
I0 II<)2000
0100 100 100 700 100 1100 1100 1100
energy. keV
1000 b)..cc: 10000
.&;U
L-• ,~A. .-000..I-C::J
0u
2000
0100 100 aoo 700 100 1100 1100 1100
energy. keV
Figure 9. Gamma-ray spectrum of the cadmium fraction isolated from 100 mg of neutron-irradiatedVersieck's Human Serum: a) earlier version of the method, time of measurement: 61078 s; b)modified version of the method, time of measurement: 72162 s
In the improved version of the method, presented in this paper the main effortwas directed towards the demonstration ofpossibilities of interference free cadmiumdetermination in biological materials of low level Cd content.
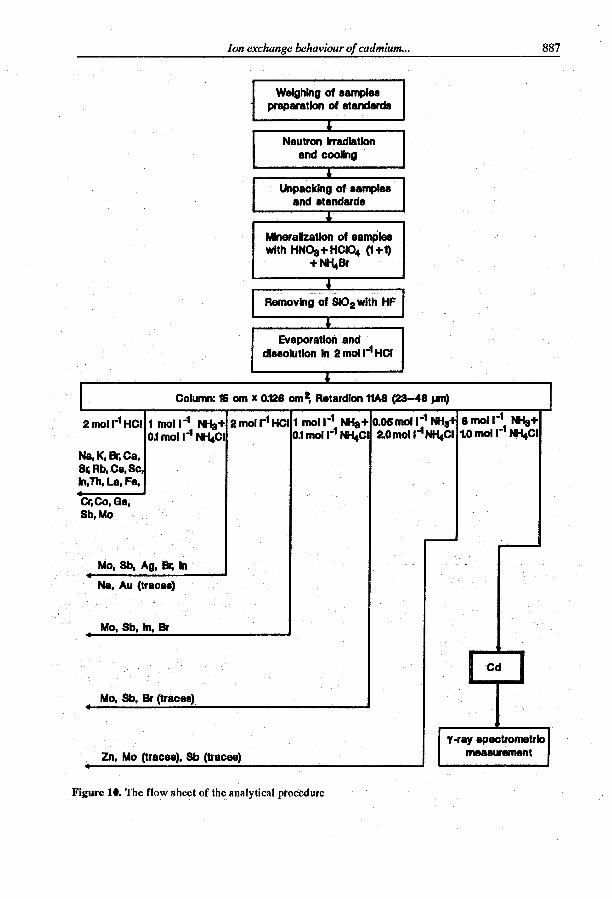
The flow sheet of the analytical procedure is shown in Fig. 10. The modificationof the ion exchange separation scheme raised the selectivity of Cd isolation still
Ion exchange behaviour ofcadmium...
Weighing of 8amplespreparation of 8tandards
I
Neutron irradiationand cooHng
Unpacking of 8amplesand standards
I
MlneraHzatlon of 8amPIeswith HNOa+ HCI04 (1 +1)
+NH.tBr
...
Removing of 8102with HF
"Evaporation and
dl880lutlon In 2 mol 1-1HCI
I
887
I Column: 16 em x 0.128 em~ Retardlon M8 (23-48 JIm) .1
2 mol 1-1HCI 1 mol 1-1 NHa+ 2 mol 1-1HCI1 mol 1-1 NHa+ 0.06 mol 1-1NHa+ 8 mol 1-1 NHa+
OJ mol 1-1N....CI ~.1 mol 1-1~CI 2.0moll-1~CI to mol.-1
NH.CI
Na, K, Br, Ca,Sr. Rb, C8,ScIn,Th, La, Fe,
Cr;Co,Ga,Sb,Mo
Mo, Sb, Ag, Br. In
Na, Au (traces)
_ Mo, Sb, In, Br
I Cd I_ Mo, Sb, Br (traces).
_ Zn, Mo(traces), Sb (traces)
Figure 10. The flow sheet of the analytical ptocedure
Y-ray 8pectrometrlcmea8urement

888 Z. Samczynski and R. Dybczynski
keeping intact the 100% yield of the analyte (average 99.8% ± 0.4% recovery in thecadmium fraction as determined in.tracer experiments). Molybdenum and antimonywhich previously posed some problems are efficiently washed out from the RetardionllA8 column while performing successive elution steps. The interference related tobromine was suppressed by modifying the mineralization procedure. Addition ofammonium bromide to the HN03 + HCI04 mixture enables transformation ofbromine compounds of higher oxidation state into Br2 which can be easily removedby volatilization. Decontamination factors established for several selected elementswere as follows: Na, Br and Sc > 106, Co and Sb ~ 105, Mo ~ 104, Zn ~ 103•
Gamma-ray spectrum of the cadmium fraction obtained in a very long measurementtime was practically free from other activities than those normally. observed in thenatural background (Fig. 9). The elaborated method was used for the determinationof Cd in three biological certified reference materials i.e. IAEA H-4 Animal Muscle[20], Human Serum [21] and CTA-OTL-l Oriental Tobacco Leaves [22]. Low levelof Cd content in the first two involved employing of as long counting times as ca.70000 s. The detection limit calculated according to Rogers [23] amounted to 0.5 ~g kg-1
(sample weight 100 mg, neutron flux 8xl013 n cm-1s-1, activation time 48 h, coolingtime 7 days, measurement time 72000 s). The residual blank resulting from thecanning material was practically zero. The analytical results of cadmium determination in the abovementioned materials together with those obtained in the previouswork[7] are listed in Table 1.
Table 1. Results of cadmium determination in the certified reference materials
Certified value Results of Arithmetic Relative
Material for Cd and its individual mean* and its standardconfidence limits determinations confidence limits deviation
mg kg-1 mgkg-1 mg kg-1 %
186.4
IAEAH-8 189 ± 6191.6191.2 187.8 ± 4.6# 2.0
Horse kidney (183-195) 187.2182.7
1.45
IAEAMA-M-2 1.32 1.481.54 1.52 ± O.O~ 3.8
Mussel Tissue (1.16-1.54)1.541.60
1.19C1A-OTL-l
1.12 ± 0.121.14
Oriental tobacco 1.17 1.17 ± 0.08## 5.4leaves (1.00-1.24)
1.081.25
0.0343IAEAH-9 0.0315 ± 0.0045 0.0354 0.0329 ± 0.0038# 7.2
Human diet (0.0270-0.0360) 0.03140.0304

Ion exchange behaviour ofcadmium... 889
0.00521
IAEAH-4 0.0049 ± 0.00100.004920.00566 0.00511 ± 0.00049## 7.7Animal muscle (0.0039-0.0059)0.005170.00460
0.00249Versieck's Human 0.0020 0.00204 0.00225 ± 0.00028## 12.3
Serum (0.0017-0.0025) 0.002480.00198
*Results are presented as: x ± to.ass/Vii,where x denotes arithmetic mean, s - standard deviation, to.05 - parameter of Student's distribution forsignificance level of a = 0.05, and n - 1 degrees of freedom, n - number of determinations.# Analytical results obtained using the former version of the method [7].## Analytical results obtained using the improved version of the method.
One can easily note very good accuracy and precision ofthe method demonstratedover the concentration range from single f.tg kg-1 up to hundreds of mg kg-1• It isworth stressing, that the observed increase of relative standard deviation from 2% inHorse Kidney to 12.3% in Human Serum is surprisingly small considering, thatcorresponding decrease in the concentration of the analyte amounts to nearly fiveorders of magnitude.
Finally, it should be emphasized, that this work in fact fulfills with one exceptioni. e. visual control of the column separation process, the criteria formulated previouslyin our Laboratory [24,25] qualifying a given analytical methpd as a "definitivemethod".
REFERENCES
1.Metals and Their Compounds in the Environment (E. Merian, Ed.), VCH, Weinheim 1991.2. Minczewski J., Chwastowska J. and Dybczynski R., Separation and Preconcentration Methods in
Inorganic TraceAnalysis, E. Horwood, Chichester 1982. .3. Marhol M., Ion Exchangers in Analytical Chemistry, Academia, Prague 1982.4. Dybczytiski R. and Sterlinska E.,J. Chromatogr., 102, 263 (1974).5. Aldabbagh S. and Dybczynski R.,J. Radioanal. Nucl. Chem.,Articles, 92, 37 (1985).6. Dybczytiski R. and Aldabbagh S.,Analyst, 112,449 (1987).7. Dybczytiski R. and Samczynski Z,J. Radioanal. Nucl. Chem., Articles, 150,143 (1991).8. Dybczytiski R., Institute ofNuclear Research, Warsaw, Report No. 115 (VIII)C (1969).9. Hatch M. J., Dillon J. A and Smith H. B., Ind. Eng. Chem., 49, 812 (1957).
10. Martell R. M. and Smith A E., Critical Stability Constants, Plenum Press, New York 1976.11. Inczedy J.,AnalyticaIApplications ofComplex Equilibria, E. Horwood, Chichester 1976.12. Yatsimirski K. B. and Vasil'ev ~P., Instability Constants of the Complex Species, Izdat. Akad. Nauk
SSSR, Moscow 1959 (in Russian).13. Marcus Y and Kertes A. S., Ion Exchange and Solvent Extraction ofMetal Complexes, Wiley-Inter
science, New York 1969.14. Kraus K. A. and Nelson F.,AnionExchangeStudies ofMetal Complexes, in: The Structure ofElectrolytic
Solutions (W. J. Hamer, Ed.), p. 340, J. Wiley & Sons, Inc., New York 1959.15. Kraus K. A. and Nelson F.,Proc.lst.Intern. Con! on Peaceful Uses ofAtomic Energy, Geneva, 7131,
113 (1956).16. Stokes R.ll. and Walton H. E,J.Am. Chem. Soc., 76, 3327 (1954).17. Tremillon B., Ion Exchangers in Separation Processes, PWN, Warszawa 1970 (in Polish).

890 z. Samczynski and R. Dybczynski
18. BilewiczA. and NarbuttJ.,SolventExtraction andIon Exchange, 13, 1083 (1995).19. Inczedy J., Acta Chim. Acad. Sci. Hung., 62, 131 (1969).20. Byrne A. R, Camara-Rica C., Comelis R, de Goeij J. J. M., Iyengar G. ~, Kirkbright G., Knapp G.,
Parr R. M. and Stoeppler M., Fresenius Z. Anal. Chem., 326, 723 (1987).21. VersieckJ.,Anal. Chim.Acta, 204, 63 (1988)~
22. DybczyJiski R, Polkowska-Motrenko H., SamczyJiski Z. and Szopa z., Fresenius J. Anal. Chem., 345,99 (1993).
23. Rogers ~ C.,Anal. Chem., 42, 807 (1970),24. DybczyJiski R., Wasek M. and Maleszewska H., J. Radioanal. Nucl. Chem.} Articles, 130, 365 (1989).25. DybczyJiski R. and Danko B., J. Radioanal. Nucl. Chem.} Articles, 181,43 (1994).
ReceivedMarch 1996AcceptedMay 1996


![[XLS] · Web view1988 2002 1991 2002 1986 1986 1986 1986 1986 1986 1986 1990 1995 1996 1995 1996 1995 1996 1995 1996 1995 1996 1995 1996 1995 1996 1995 1996 1995 1996 1995 1996 1995](https://img.dokumen.tips/doc/110x75/5aca1c8d7f8b9aa3298d60aa/xls-view1988-2002-1991-2002-1986-1986-1986-1986-1986-1986-1986-1990-1995-1996.jpg)