Embed Size (px)
Citation preview

ALIMENTATION COUCHE-TARD INC.ALIMENTATION COUCHE-TARD INC.
Investors Presentation
April 2016
This presentation and the accompanying oral presentation contain forward-looking statements within the meaning of applicable securitieslegislation. Forward-looking statements are typically identified by words such as “projected”, “estimate”, “may”, “anticipate”, “believe”,“expect”, “plan”, “intend” or similar words suggesting future outcomes or statements regarding an outlook. All statements other thanstatements of historical fact contained in these slides are forward-looking statements.
Forward-looking statements involve numerous assumptions, risks and uncertainties. A variety of factors, many of which are beyondAlimentation Couche-Tard Inc.’s (“Couche-Tard”) control, may cause actual results to differ materially from the expectations expressed inits forward-looking statements. These factors include, but are not limited to, the effects of the integration of acquired businesses and theability to achieve projected synergies, fluctuations in margins on motor fuel sales, competition in the convenience store and retail motorfuel industries, foreign exchange rate fluctuations, and such other risks as described in detail from time to time in documents filed byCouche-Tard with securities regulatory authorities in Canada, including those risks described in Couche-Tard’s management’s discussionand analysis (MD&A) for the year ended April 26, 2015. Couche-Tard’s MD&A and other publicly filed documents are available on SEDARat www.sedar.com.
Unless otherwise required by law, Couche-Tard does not undertake to update any forward-looking statement, whether written or oral, thatmay be made from time to time by it or on its behalf. No financial information presented in this presentation as of a date more recent thanApril 26, 2015 has been audited.
While the information contained in this presentation is believed to be accurate, Couche-Tard expressly disclaims any and all liability forany losses, claims or damages of whatsoever kind based upon the information contained in, or omissions from, this presentation or anyoral communication transmitted in connection therewith. In addition, none of the statements contained in this presentation are intended tobe, nor shall be deemed to be, representations or warranties of Couche-Tard and its affiliates. Where the information is from third-partysources, the information is from sources believed to be reliable, but Couche-Tard has not independently verified any of such informationcontained herein.
This presentation is not, and under no circumstances is to be construed as, a prospectus, an offering memorandum, an advertisement or apublic offering of securities. Under no circumstances should the information contained herein be considered an offer to sell or a solicitationof an offer to buy any securities.
FORWARD-LOOKING INFORMATION AND CAUTIONARY LANGUAGE
2
3
Brian Hannasch
President and Chief Executive Officer
Claude Tessier
Chief Financial Officer
Mathieu Descheneaux
Vice President Finance
COMPANY REPRESENTATIVES
1. Company Highlights
2. Financial Highlights
3. Strategy and Value Creation
1. Organic Growth
2. Acquisitions
3. Cost Control
4. Capital Structure & Financial Flexibility
4. Appendix
4
AGENDA

ALIMENTATION COUCHE-TARD INC.
COMPANY
HIGHLIGHTS
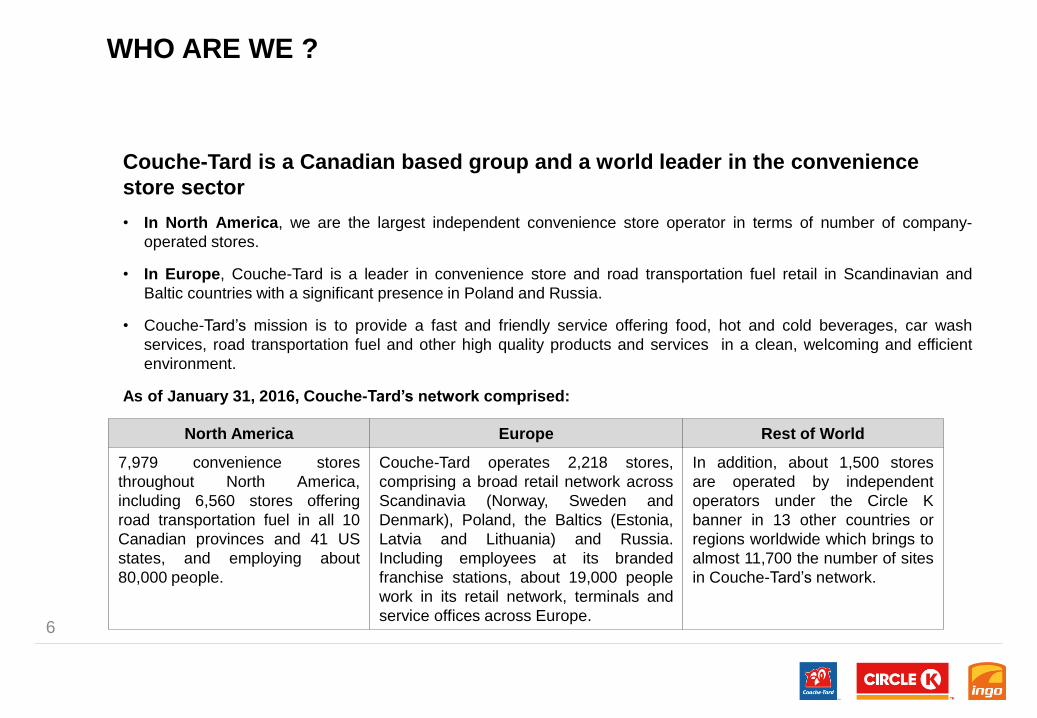
Couche-Tard is a Canadian based group and a world leader in the convenience
store sector
• In North America, we are the largest independent convenience store operator in terms of number of company-
operated stores.
• In Europe, Couche-Tard is a leader in convenience store and road transportation fuel retail in Scandinavian and
Baltic countries with a significant presence in Poland and Russia.
• Couche-Tard’s mission is to provide a fast and friendly service offering food, hot and cold beverages, car wash
services, road transportation fuel and other high quality products and services in a clean, welcoming and efficient
environment.
As of January 31, 2016, Couche-Tard’s network comprised:
WHO ARE WE ?
6
North America Europe Rest of World
7,979 convenience stores
throughout North America,
including 6,560 stores offering
road transportation fuel in all 10
Canadian provinces and 41 US
states, and employing about
80,000 people.
Couche-Tard operates 2,218 stores,
comprising a broad retail network across
Scandinavia (Norway, Sweden and
Denmark), Poland, the Baltics (Estonia,
Latvia and Lithuania) and Russia.
Including employees at its branded
franchise stations, about 19,000 people
work in its retail network, terminals and
service offices across Europe.
In addition, about 1,500 stores
are operated by independent
operators under the Circle K
banner in 13 other countries or
regions worldwide which brings to
almost 11,700 the number of sites
in Couche-Tard’s network.

7
• 1980 Start of operations with the opening of a first convenience store located in Laval, Québec.
• 80’s-90’s Consolidation of the Canadian market.
• 2001 First breakthrough of Couche-Tard in the United States : acquisition of the assets of Johnson Oil Company, Inc.,
owner of 225 Bigfoot stores, all located in the U.S. Midwest.
• 2003 Acquisition of The Circle K Corporation from ConocoPhillips Company that operates 1,663 Circle K corporate stores
located in 16 States and has a franchising or licensing relationship with 627 additional stores in the U.S. and
worldwide.
• 2004 Couche-Tard becomes an active player in the US market consolidation.
• 2012 Acquisition of Statoil Fuel & Retail, a leading Scandinavian road transport fuel retailer. Statoil Fuel & Retail operates
a broad retail network across Scandinavia (Norway, Sweden, Denmark), Poland, the Baltics (Estonia, Latvia,
Lithuania), and Russia with approximately 2,300 stores, the majority of which offer fuel and convenience products
while the others are automated (fuel only) stations.
• 2015 Acquisition of The Pantry, Inc., a leading convenience store operator in the southeastern United States and one of
the largest independently operated convenience store chains in the United States. The Pantry operates
approximately 1,500 stores in 13 states under select banners, including Kangaroo Express®, its primary operating
banner.
• 2015 Couche-Tard launches its global Circle K brand, the world’s preferred destination for convenience and fuel.
• 2016 Acquisition of Topaz, the leading convenience and fuel retailer in Ireland, made up of 444 stores. All the Topaz
stores will be rebranded with the new global brand Circle K.
• 2016 Couche-Tard signs an agreement with Imperial Oil to acquire 279 Esso-branded Canadian fuel and convenience
sites. These sites are located in the provinces of Ontario and Québec.
COMPANY HISTORY
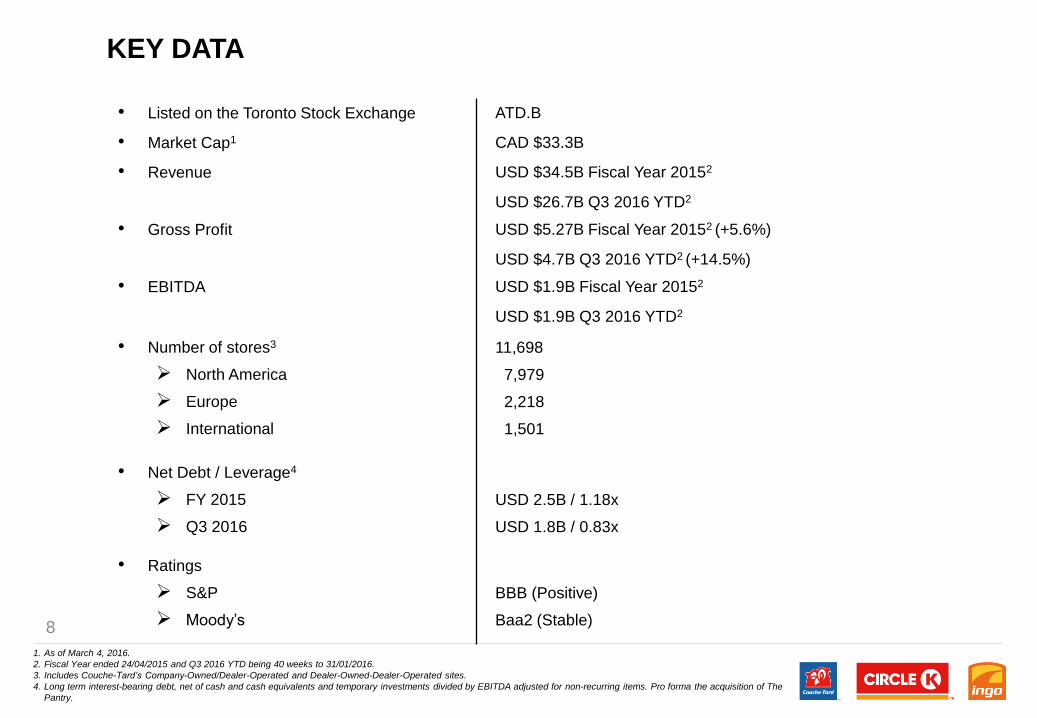
1. As of March 4, 2016.
2. Fiscal Year ended 24/04/2015 and Q3 2016 YTD being 40 weeks to 31/01/2016.
3. Includes Couche-Tard’s Company-Owned/Dealer-Operated and Dealer-Owned-Dealer-Operated sites.
4. Long term interest-bearing debt, net of cash and cash equivalents and temporary investments divided by EBITDA adjusted for non-recurring items. Pro forma the acquisition of The
Pantry.
• Listed on the Toronto Stock Exchange ATD.B
• Market Cap1 CAD $33.3B
• Revenue USD $34.5B Fiscal Year 20152
USD $26.7B Q3 2016 YTD2
• Gross Profit USD $5.27B Fiscal Year 20152 (+5.6%)
USD $4.7B Q3 2016 YTD2 (+14.5%)
• EBITDA USD $1.9B Fiscal Year 20152
USD $1.9B Q3 2016 YTD2
• Number of stores3
North America
Europe
International
11,698
7,979
2,218
1,501
• Net Debt / Leverage4
FY 2015
Q3 2016
USD 2.5B / 1.18x
USD 1.8B / 0.83x
• Ratings
S&P
Moody’s
BBB (Positive)
Baa2 (Stable)
KEY DATA
8

9
INVESTMENT HIGHLIGHTS
Couche-Tard
is a
disciplined
c-store
operator and
integrator
Disciplined
Management Culture
• Management team with strong track
record and founders have 23% equity
ownership
• Management and Board need to hold
a multiple of their salary in Shares
• Decentralized operating model
S&P: BBB (Positive)
Moody’s: Baa2 (Stable)
Powerful
Financial Results• Strong and consistent financial
performance throughout all economic
cycles
• Prolific history of positive same-store
comps and 25% ROE
• Significant FCF generation (2010-2015)
CAGR of 29%
Broad Geographic Footprint
with Leading Market Positions
• Leading C-store operator in North America,
Scandinavia and Baltics
• Multiple banners (Couche-Tard, Circle K,
Mac’s, Ingo, and Kangaroo Express) that will
be rebranded to the strong and well-
established Circle K banner (except Couche-
Tard in Québec, Canada) to drive traffic and
sales
• World class Canadian retailer with most
geographically diversified footprint
Attractive
Synergy Potential• Proven ability to extract significant
synergies from acquisitions
• Transferring best practices across entire
platform
Superior
Product Offerings
• Increasing focus on private
label, fresh food products and
famous for concepts
• Industry leading
merchandise gross margin
Attractive
Sector Dynamics
• Steady industry performance
throughout downturns with strong
projected growth
• C-store sector well positioned to gain
share from traditional food retail
• Industry-leading returns in recession
Track Record of Highly Disciplined
Growth and Debt Reduction
• Proven ability to integrate acquisitions (More than 5,550 stores
from more than 50 acquisitions since Circle K in 2003, including
SFR and The Pantry)
• Well positioned to lead further consolidation in fragmented
industry
• Committed to remain investment grade post acquisition
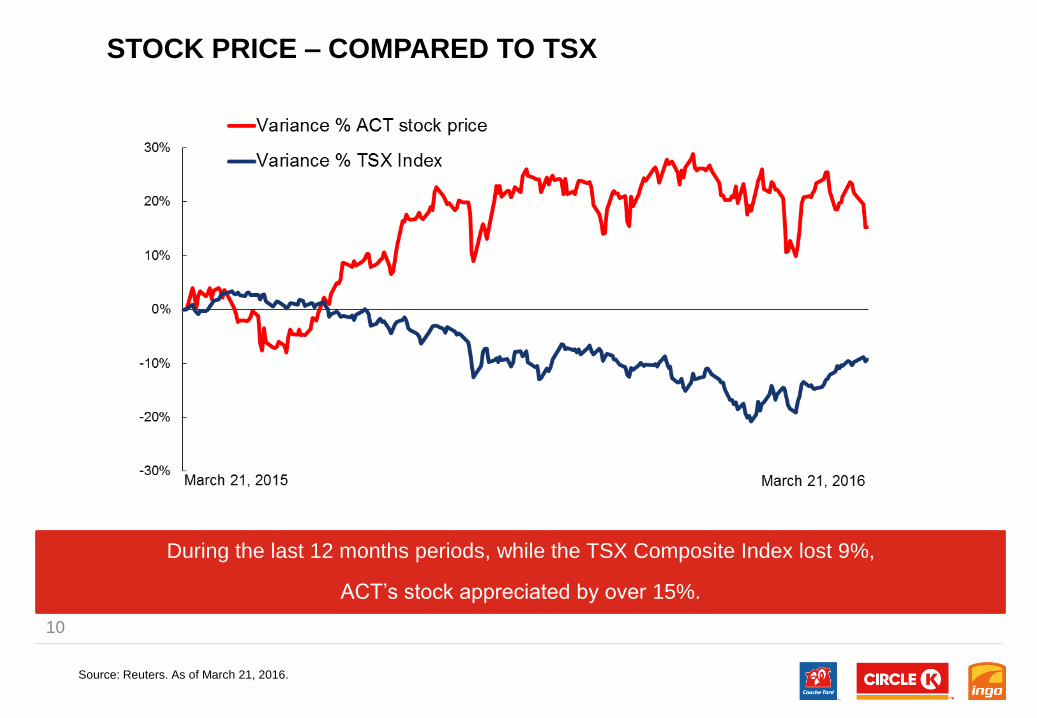
STOCK PRICE – COMPARED TO TSX
10
During the last 12 months periods, while the TSX Composite Index lost 9%,
ACT’s stock appreciated by over 15%.
Source: Reuters. As of March 21, 2016.
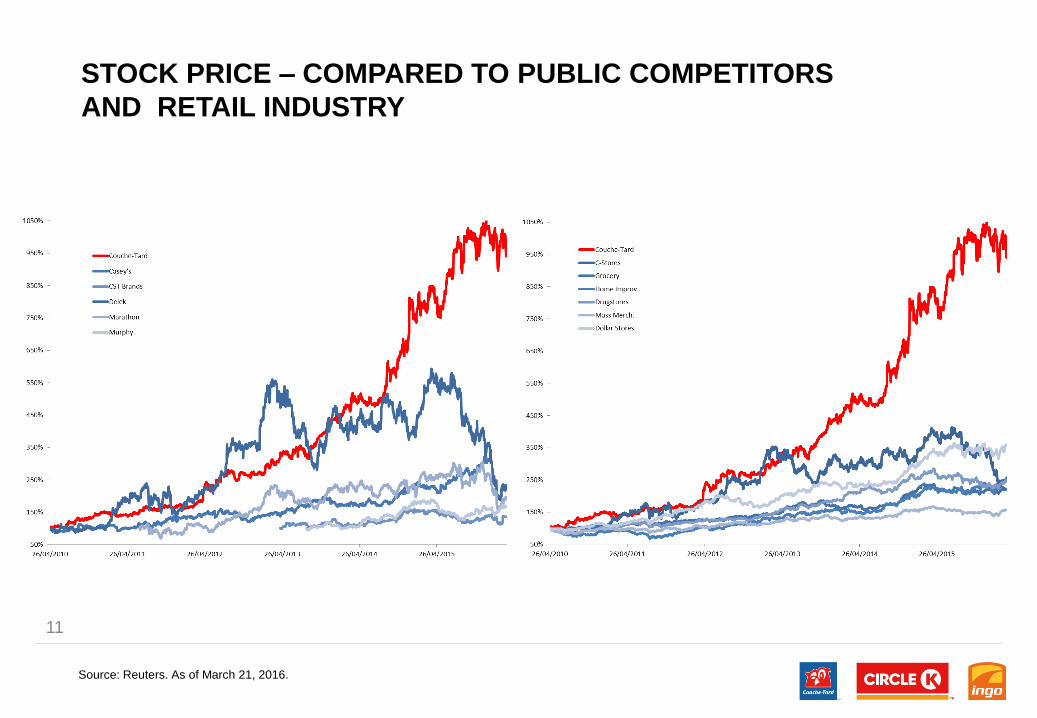
STOCK PRICE – COMPARED TO PUBLIC COMPETITORS
AND RETAIL INDUSTRY
11
Source: Reuters. As of March 21, 2016.

Merchandise and services
63%
Motor fuel37%
Gross Profit: $3,872M
US65%
Canada12%
Europe23%
Merchandise and services
27%
Motor fuel58%
Other15%
$1,357M
US61%
Canada6%
Europe33%
$24,002M
Merchandise and services
57%
Motor fuel39%
Other4%
$34,690M
Merchandise and services
79%
Motor fuel21%
$735M
US7%
Europe93%
$727M
US72%
Canada17%
Europe11%
Revenue: $9,961M
US
OtherMerchandise and services Motor Fuel
EuropeCanada
Gross Profit By
Geography
LTM Q3 2016(1)
Gross Profit By
Products
LTM Q3 2016(1)
Total
Total
Couche-Tard is a leading global convenience store operator with pro-forma EBITDA of $2.2 billion
• Well diversified
• Merchandise and services represent 57% of gross profits
• Focus on growing high margin categories
COUCHE-TARD – WORLD LEADER
(1) Pro Forma The Pantry acquisition.
$5,964M
12
13
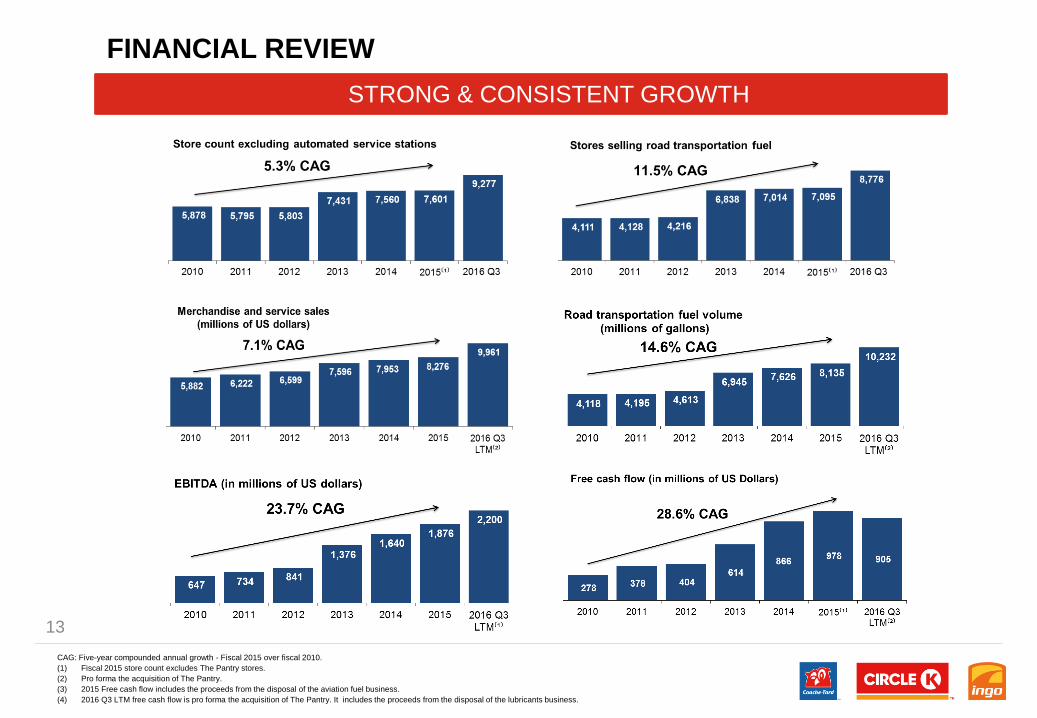
FINANCIAL REVIEW
STRONG & CONSISTENT GROWTH
CAG: Five-year compounded annual growth - Fiscal 2015 over fiscal 2010.
(1) Fiscal 2015 store count excludes The Pantry stores.
(2) Pro forma the acquisition of The Pantry.
(3) 2015 Free cash flow includes the proceeds from the disposal of the aviation fuel business.
(4) 2016 Q3 LTM free cash flow is pro forma the acquisition of The Pantry. It includes the proceeds from the disposal of the lubricants business.
14
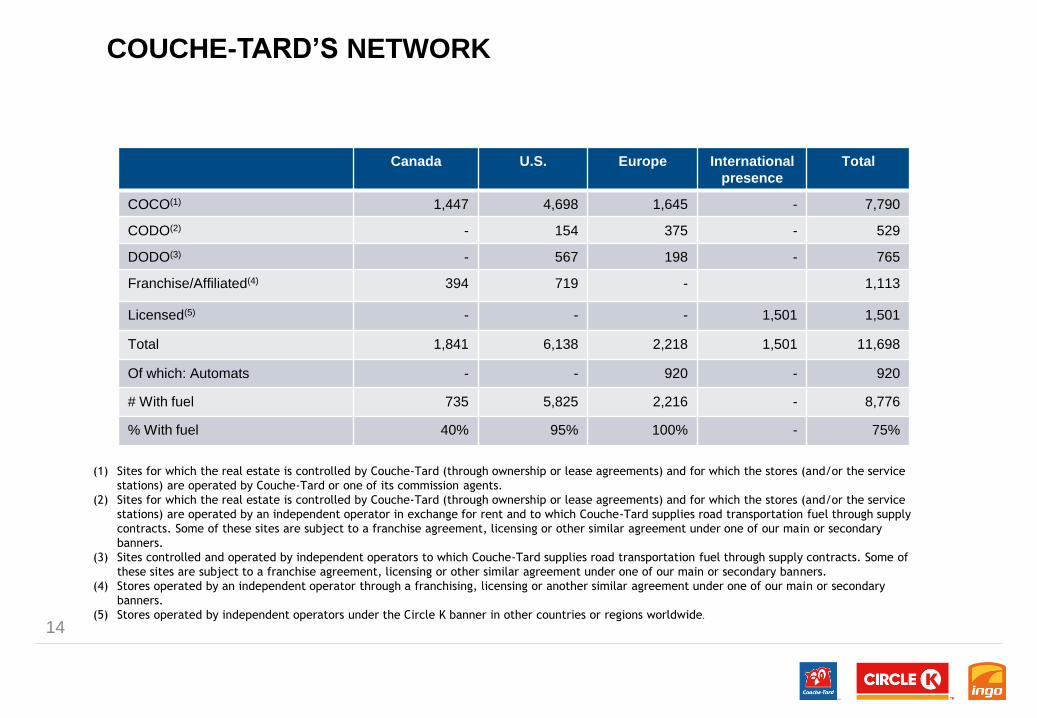
COUCHE-TARD’S NETWORK
Canada U.S. Europe International
presence
Total
COCO(1) 1,447 4,698 1,645 - 7,790
CODO(2) - 154 375 - 529
DODO(3) - 567 198 - 765
Franchise/Affiliated(4) 394 719 - 1,113
Licensed(5) - - - 1,501 1,501
Total 1,841 6,138 2,218 1,501 11,698
Of which: Automats - - 920 - 920
# With fuel 735 5,825 2,216 - 8,776
% With fuel 40% 95% 100% - 75%
(1) Sites for which the real estate is controlled by Couche-Tard (through ownership or lease agreements) and for which the stores (and/or the service
stations) are operated by Couche-Tard or one of its commission agents.
(2) Sites for which the real estate is controlled by Couche-Tard (through ownership or lease agreements) and for which the stores (and/or the service
stations) are operated by an independent operator in exchange for rent and to which Couche-Tard supplies road transportation fuel through supply
contracts. Some of these sites are subject to a franchise agreement, licensing or other similar agreement under one of our main or secondary
banners.
(3) Sites controlled and operated by independent operators to which Couche-Tard supplies road transportation fuel through supply contracts. Some of
these sites are subject to a franchise agreement, licensing or other similar agreement under one of our main or secondary banners.
(4) Stores operated by an independent operator through a franchising, licensing or another similar agreement under one of our main or secondary
banners.
(5) Stores operated by independent operators under the Circle K banner in other countries or regions worldwide.
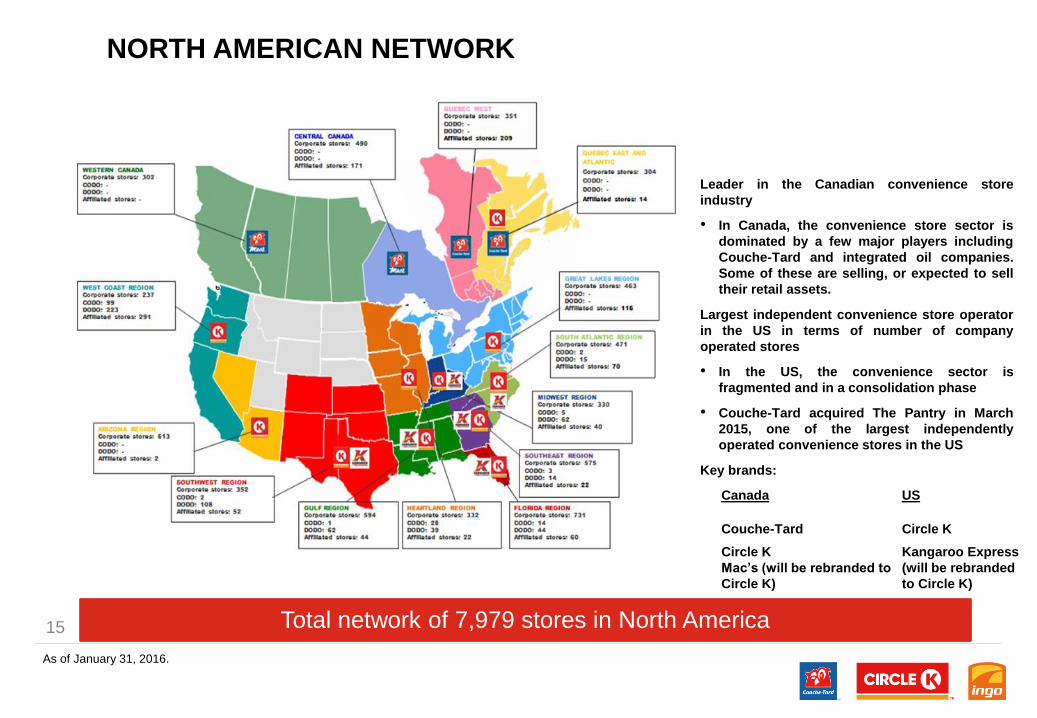
Leader in the Canadian convenience store
industry
• In Canada, the convenience store sector is
dominated by a few major players including
Couche-Tard and integrated oil companies.
Some of these are selling, or expected to sell
their retail assets.
Largest independent convenience store operator
in the US in terms of number of company
operated stores
• In the US, the convenience sector is
fragmented and in a consolidation phase
• Couche-Tard acquired The Pantry in March
2015, one of the largest independently
operated convenience stores in the US
Key brands:
As of January 31, 2016.
Total network of 7,979 stores in North America
NORTH AMERICAN NETWORK
Canada US
Couche-Tard Circle K
Circle K
Mac’s (will be rebranded to
Circle K)
Kangaroo Express
(will be rebranded
to Circle K)
15
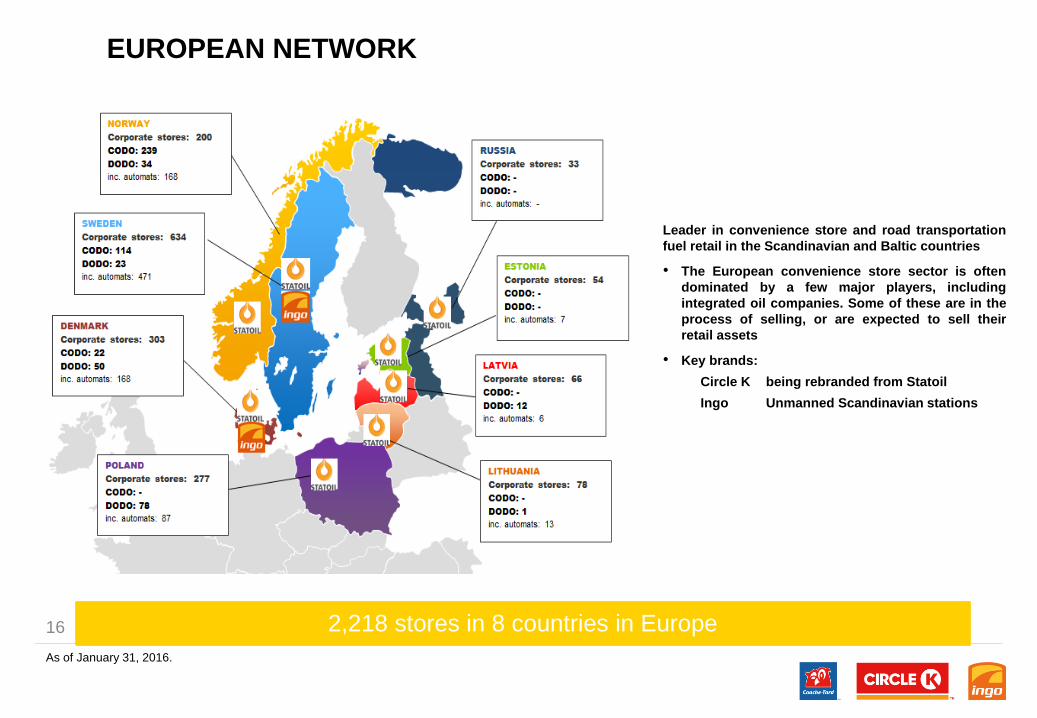
Leader in convenience store and road transportation
fuel retail in the Scandinavian and Baltic countries
• The European convenience store sector is often
dominated by a few major players, including
integrated oil companies. Some of these are in the
process of selling, or are expected to sell their
retail assets
• Key brands:
Circle K being rebranded from Statoil
Ingo Unmanned Scandinavian stations
As of January 31, 2016.
2,218 stores in 8 countries in Europe
EUROPEAN NETWORK
16

Around 1,500 licensed Circle K stores in Asia, Costa Rica, Egypt, Honduras, Mexico,
and U.A.E
As of January 31, 2016.
INTERNATIONAL PRESENCE
17
• Convenience stores
operated by
independent operators
• Under the Circle K
brand
18
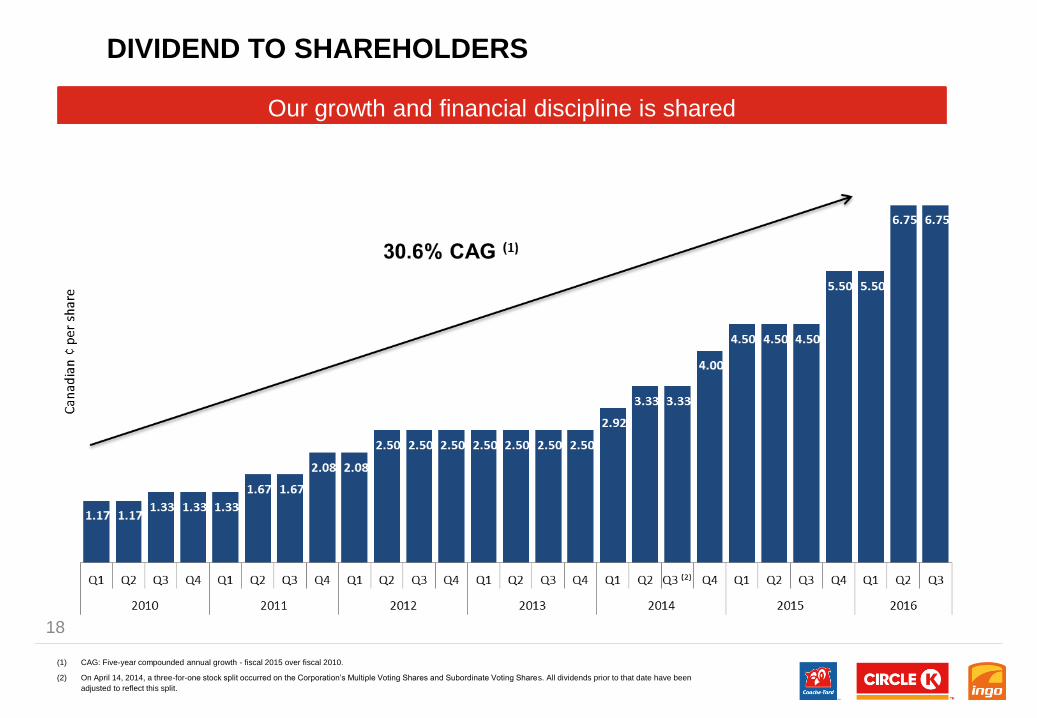
DIVIDEND TO SHAREHOLDERS
(1) CAG: Five-year compounded annual growth - fiscal 2015 over fiscal 2010.
(2) On April 14, 2014, a three-for-one stock split occurred on the Corporation’s Multiple Voting Shares and Subordinate Voting Shares. All dividends prior to that date have been
adjusted to reflect this split.
Our growth and financial discipline is shared
ALIMENTATION COUCHE-TARD INC.
FINANCIAL
HIGHLIGHTS
20
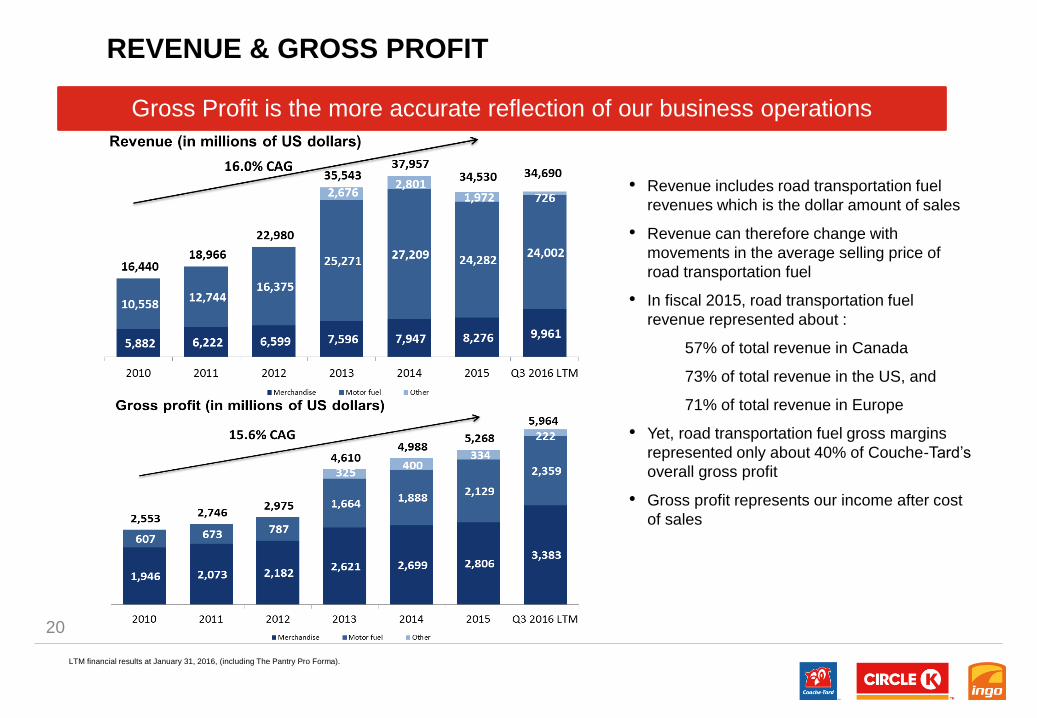
REVENUE & GROSS PROFIT
• Revenue includes road transportation fuel
revenues which is the dollar amount of sales
• Revenue can therefore change with
movements in the average selling price of
road transportation fuel
• In fiscal 2015, road transportation fuel
revenue represented about :
57% of total revenue in Canada
73% of total revenue in the US, and
71% of total revenue in Europe
• Yet, road transportation fuel gross margins
represented only about 40% of Couche-Tard’s
overall gross profit
• Gross profit represents our income after cost
of sales
LTM financial results at January 31, 2016, (including The Pantry Pro Forma).
Gross Profit is the more accurate reflection of our business operations

21
FUEL GROSS MARGIN VS AVERAGE SELLING PRICE
• No clear correlation between fuel selling price
and margins;
• Our margins are not directly impacted by
lower fuel selling prices;
• Lower fuel prices leave customers more
money in their pockets for their in-store
shopping.
U.S. Fuel Margins (CPG) Canadian Fuel Margins (CPL)
22
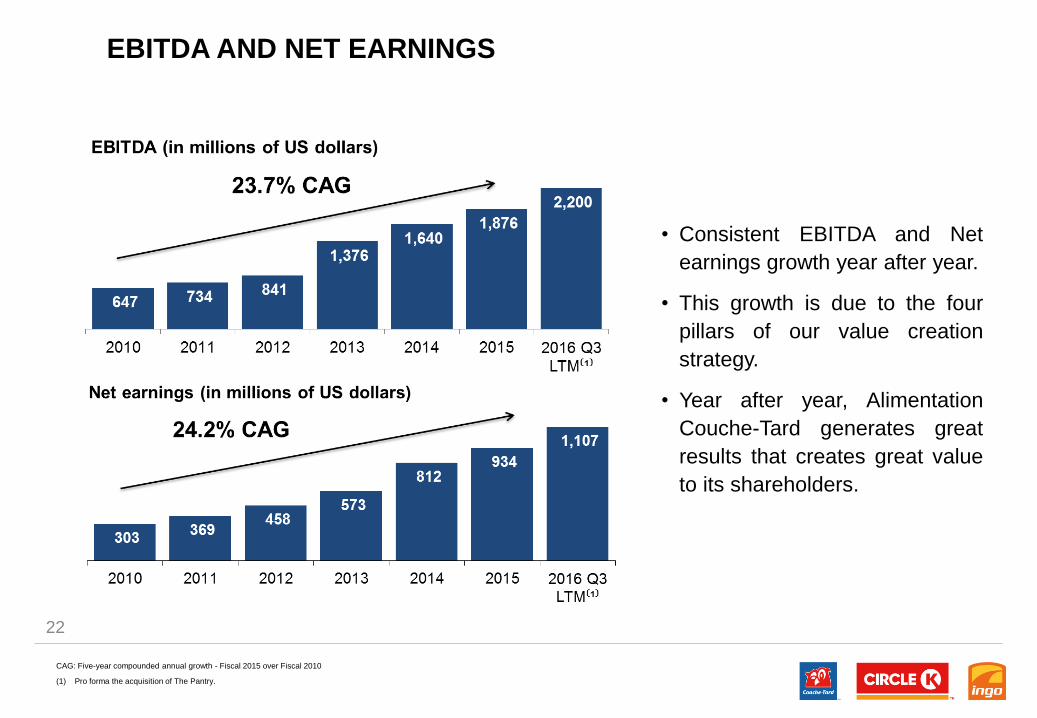
EBITDA AND NET EARNINGS
CAG: Five-year compounded annual growth - Fiscal 2015 over Fiscal 2010
(1) Pro forma the acquisition of The Pantry.
• Consistent EBITDA and Net
earnings growth year after year.
• This growth is due to the four
pillars of our value creation
strategy.
• Year after year, Alimentation
Couche-Tard generates great
results that creates great value
to its shareholders.
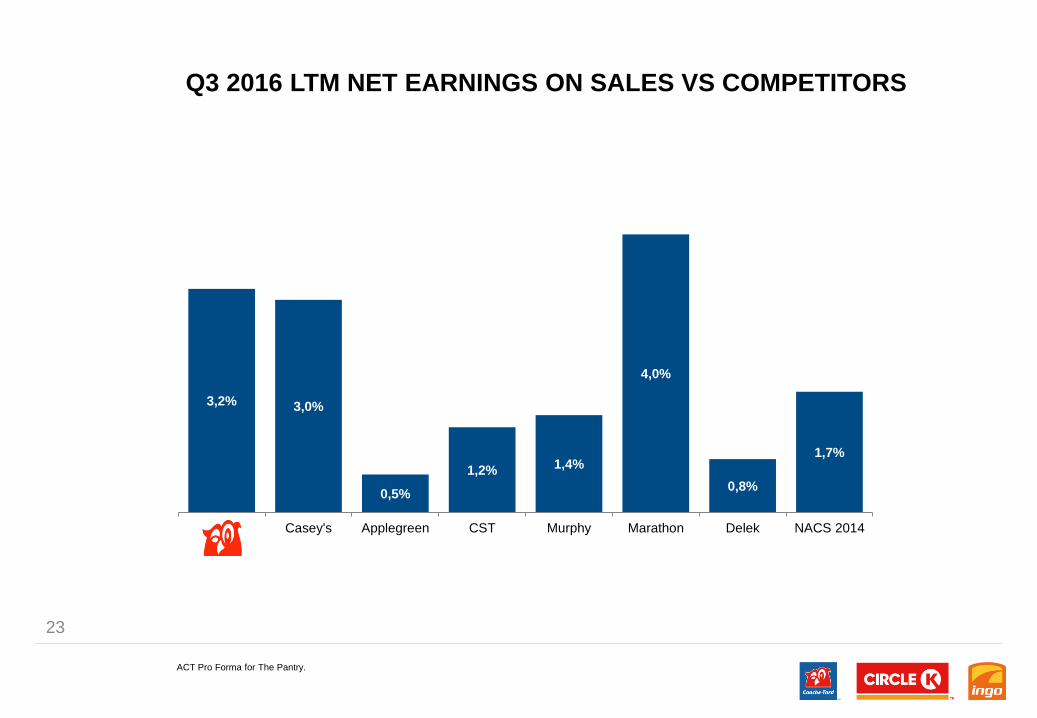
3,2% 3,0%
0,5%
1,2% 1,4%
4,0%
0,8%
1,7%
Casey's Applegreen CST Murphy Marathon Delek NACS 2014
Q3 2016 LTM NET EARNINGS ON SALES VS COMPETITORS
23
ACT Pro Forma for The Pantry.

24
CAPITAL INVESTMENT
Capital Investment primarily consists of the
investment in property and equipment net
of disposals and the ongoing improvement
of our network
• Construction of new stores
• Relocation and construction of existing
stores
• Replacement of equipment
• Information technology
Q3 2016 LTM has increased significantly
because of the integration of the Pantry
stores. 1,500 stores were added to
Couche-Tard’s storecount.
Capex spend has averaged about 35% of
EBITDA since 2010
202 198
289
487 459
563
799
2010 2011 2012 2013 2014 2015 2016 Q3 - LTM
NET CAPEX (in millions of US dollars)
25
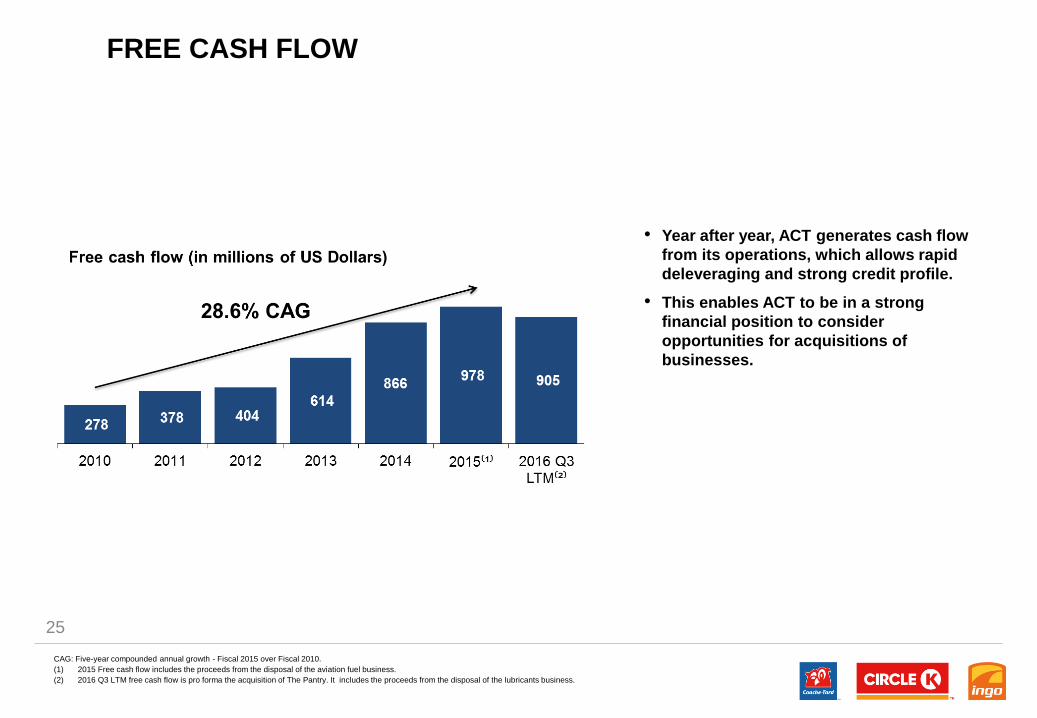
FREE CASH FLOW
CAG: Five-year compounded annual growth - Fiscal 2015 over Fiscal 2010.
(1) 2015 Free cash flow includes the proceeds from the disposal of the aviation fuel business.
(2) 2016 Q3 LTM free cash flow is pro forma the acquisition of The Pantry. It includes the proceeds from the disposal of the lubricants business.
• Year after year, ACT generates cash flow
from its operations, which allows rapid
deleveraging and strong credit profile.
• This enables ACT to be in a strong
financial position to consider
opportunities for acquisitions of
businesses.
26
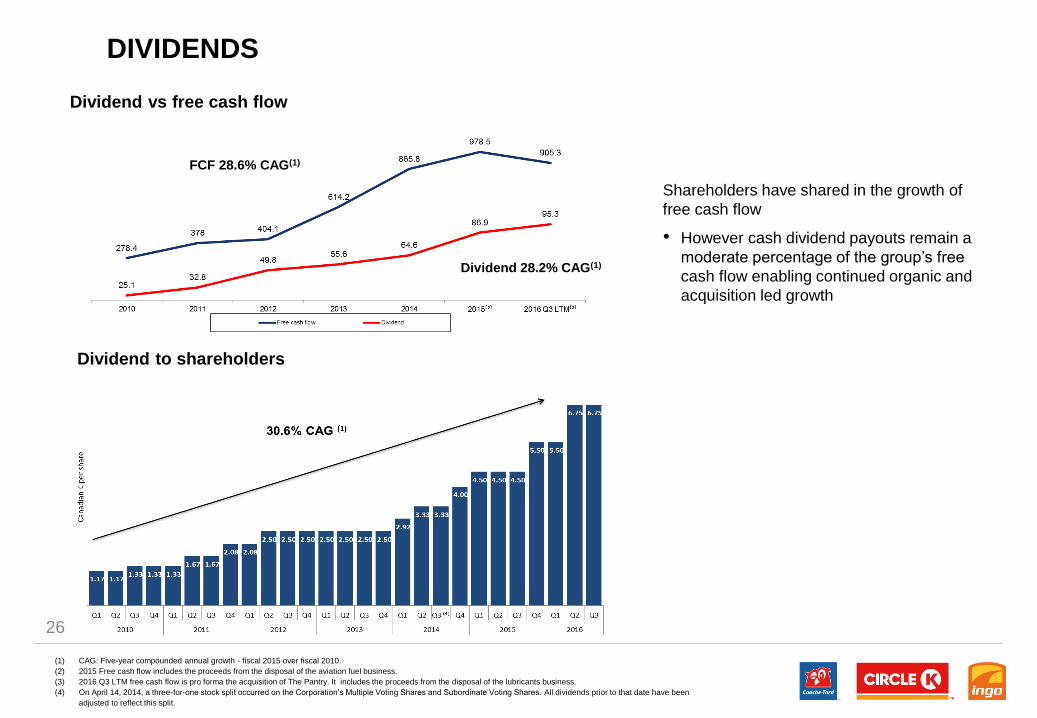
DIVIDENDS
(1) CAG: Five-year compounded annual growth - fiscal 2015 over fiscal 2010.
(2) 2015 Free cash flow includes the proceeds from the disposal of the aviation fuel business.
(3) 2016 Q3 LTM free cash flow is pro forma the acquisition of The Pantry. It includes the proceeds from the disposal of the lubricants business.
(4) On April 14, 2014, a three-for-one stock split occurred on the Corporation’s Multiple Voting Shares and Subordinate Voting Shares. All dividends prior to that date have been
adjusted to reflect this split.
Shareholders have shared in the growth of
free cash flow
• However cash dividend payouts remain a
moderate percentage of the group’s free
cash flow enabling continued organic and
acquisition led growth
Dividend to shareholders
Dividend vs free cash flow
FCF 28.6% CAG(1)
Dividend 28.2% CAG(1)

27
CAPITAL STRUCTURE
(1) Pro Forma The Pantry
Couche-Tard’s debt fluctuates primarily
with acquisitions, followed by strong
cash flow paying down debt
• Adjusted debt / adjusted EBITDAR
ratio includes lease obligations
• Couche-Tard’s term revolving
unsecured credit facilities include
financial covenants for :
Leverage – the ratio of net debt to
EBITDA for the four most recent
quarters
Interest Coverage – the ratio of
EBITDA to total interest paid for
the four most recent quarters
• Couche-Tard is in compliance with
these covenants
ADJUSTED NET DEBT/ ADJUSTED EBITDAR
TOTAL CAPITALIZATION
28
LIQUIDITY & CREDIT RATINGS
Strong Liquidity :
Couche-Tard maintains strong liquidity across cash balances, discretionary cash flow and availability under its revolving
credit facility
• Cash balances at January 31, 2016 were $972M, where $570M have been used on February 1st, 2016 for Topaz
acquisition.
• Couche-Tard’s revolving credit facility of $2,525M has a maturity date of December 2019.
• The available undrawn balance at January 31, 2016 was $1,339M.
Improving Credit Ratings : Baa2 st / BBB pos
Couche-Tard was first assigned a credit rating by Standard and Poor's in 2003
• In September 2014, Couche-Tard’s credit rating was raised to BBB
• In July 2015, the outlook was changed to positive (from stable)
Moody’s assigned Couche-Tard a Baa3 credit rating in 2012
• In August 2014, the credit rating was raised to Baa2, stable outlook
Strong Liquidity and improving Credit Ratings
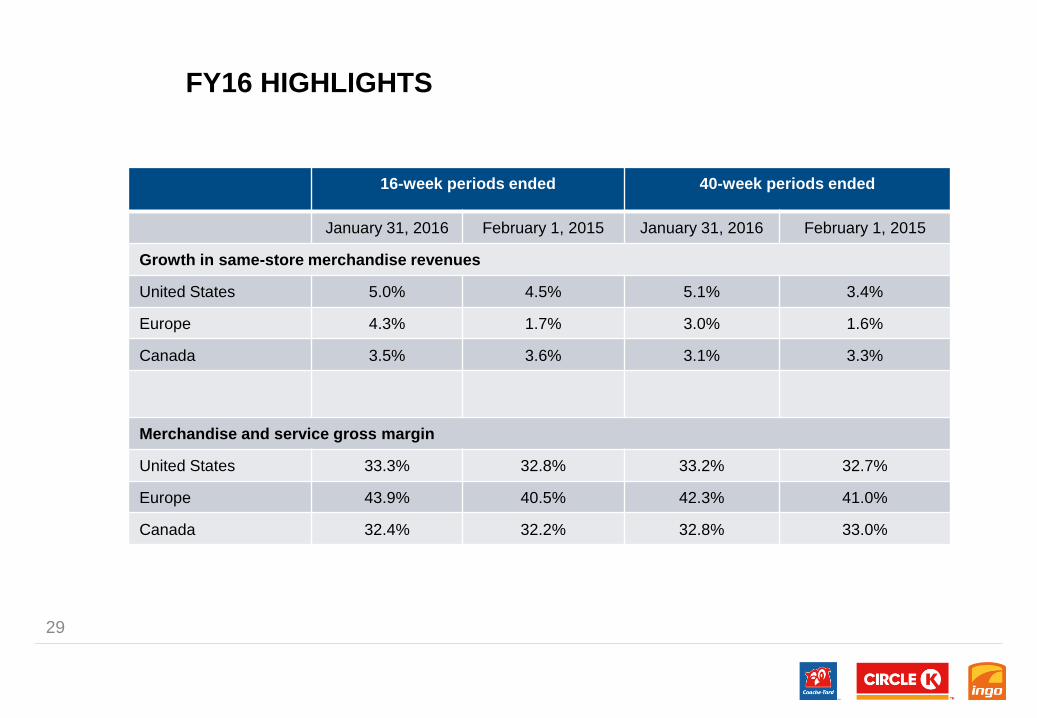
FY16 HIGHLIGHTS
29
16-week periods ended 40-week periods ended
January 31, 2016 February 1, 2015 January 31, 2016 February 1, 2015
Growth in same-store merchandise revenues
United States 5.0% 4.5% 5.1% 3.4%
Europe 4.3% 1.7% 3.0% 1.6%
Canada 3.5% 3.6% 3.1% 3.3%
Merchandise and service gross margin
United States 33.3% 32.8% 33.2% 32.7%
Europe 43.9% 40.5% 42.3% 41.0%
Canada 32.4% 32.2% 32.8% 33.0%

FY16 HIGHLIGHTS
30
16-week periods ended 40-week periods ended
January 31, 2016 February 1, 2015 January 31, 2016 February 1, 2015
Same-store motor fuel volume growth
United States 6.2% 2.8% 7.5% 2.3%
Europe 2.9% 2.1% 3.1% 2.0%
Canada (0.5%) (0.5%) 1.4% (0.5%)
Total motor fuel volume
United States (millions of
gallons)
2,177.6 1,491.3 5,557.8 3,720.3
Europe (millions of litres) 2,544.1 2,455.1 6,551.8 6,400.0
Canada (millions of litres) 918.8 904.1 2,399.8 2,326.4
Motor fuel gross margin
United States (US cents per
gallon)
19.90 24.93 21.18 24.15
Europe (US cents per litre) 8.69 9.81 9.26 10.90
Canada (CA cents per litre) 6.29 6.12 6.50 6.39
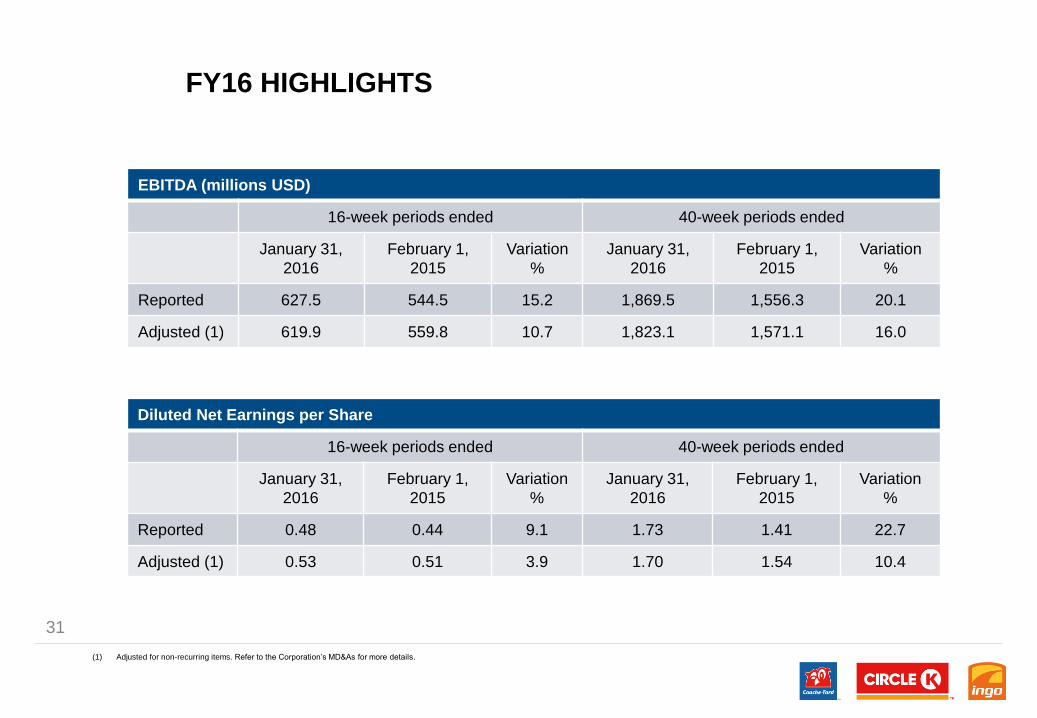
FY16 HIGHLIGHTS
31
Diluted Net Earnings per Share
16-week periods ended 40-week periods ended
January 31,
2016
February 1,
2015
Variation
%
January 31,
2016
February 1,
2015
Variation
%
Reported 0.48 0.44 9.1 1.73 1.41 22.7
Adjusted (1) 0.53 0.51 3.9 1.70 1.54 10.4
(1) Adjusted for non-recurring items. Refer to the Corporation’s MD&As for more details.
EBITDA (millions USD)
16-week periods ended 40-week periods ended
January 31,
2016
February 1,
2015
Variation
%
January 31,
2016
February 1,
2015
Variation
%
Reported 627.5 544.5 15.2 1,869.5 1,556.3 20.1
Adjusted (1) 619.9 559.8 10.7 1,823.1 1,571.1 16.0
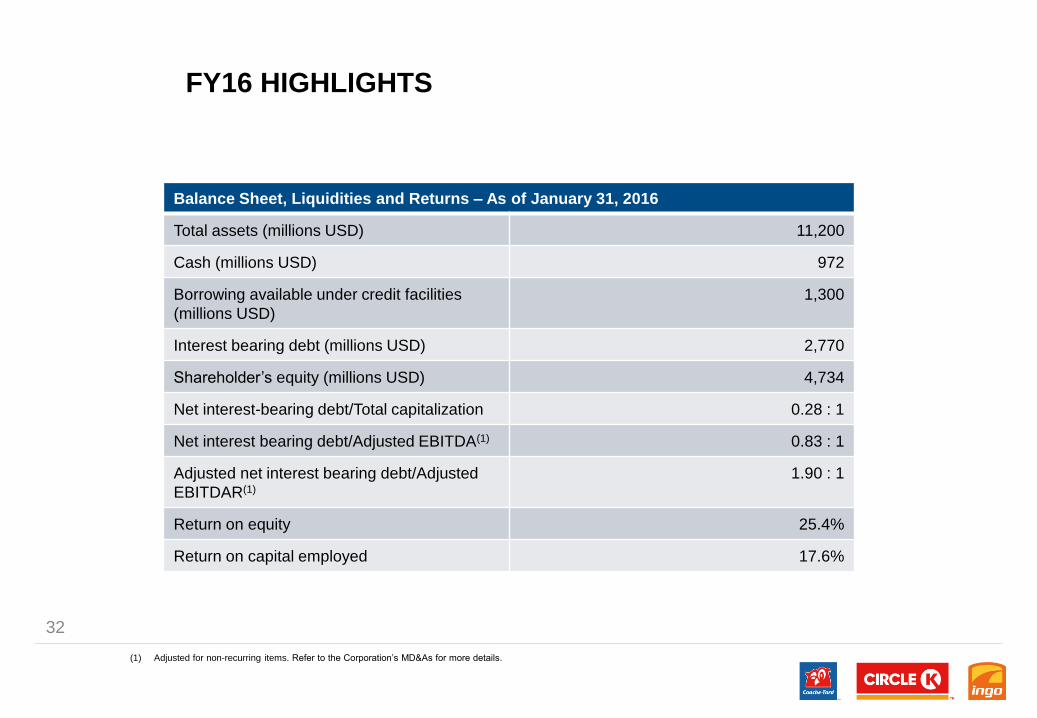
FY16 HIGHLIGHTS
32
(1) Adjusted for non-recurring items. Refer to the Corporation’s MD&As for more details.
Balance Sheet, Liquidities and Returns – As of January 31, 2016
Total assets (millions USD) 11,200
Cash (millions USD) 972
Borrowing available under credit facilities
(millions USD)
1,300
Interest bearing debt (millions USD) 2,770
Shareholder’s equity (millions USD) 4,734
Net interest-bearing debt/Total capitalization 0.28 : 1
Net interest bearing debt/Adjusted EBITDA(1) 0.83 : 1
Adjusted net interest bearing debt/Adjusted
EBITDAR(1)
1.90 : 1
Return on equity 25.4%
Return on capital employed 17.6%

ALIMENTATION COUCHE-TARD INC.
STRATEGY &
VALUE CREATION

EXPERIENCED MANAGEMENT TEAM
Brian P. Hannasch
President and Chief
Executive OfficerPLACE IMAGE
HERE
Jean Bernier
Group President Fuel
Americas and Operations
North-East
PLACE IMAGE
HERE
Darrell Davis
Senior Vice-President,
OperationsPLACE IMAGE
HERE
President and Chief
Executive Officer since 2014.
Previously Chief Operating
Officer since 2010 and
Senior Vice-President, U.S.
Operations from 2008 to
2010.
Appointed Group President
Fuel Americas and
Operations North-East on
July 30, 2012. He has over 25
years of experience in the
convenience store, fuel and
grocery store sectors of the
retail industry.
Appointed Senior Vice-
President, Operations in
May 2012. Previously, he
had been Vice-President
Operations, Florida since
March 2011.
Geoffrey C. Haxel
Senior Vice-President,
OperationsPLACE IMAGE
HEREAppointed Senior Vice-
President, Operations in
January 2011. He was
formerly Vice-President,
Operations, U.S. Arizona
Region since December
2003.
Hans-Olav Høidahl
Executive Vice-President,
ScandinaviaPLACE IMAGE
HERE
Jørn Madsen
Executive Vice-President,
Central & Eastern EuropePLACE IMAGE
HERE
Alex Miller
Senior Vice President,
Global FuelsPLACE IMAGE
HEREAppointed Executive Vice-
President, Scandinavia on
October 1, 2010. He was
formerly Vice President for
Energy Europe in the Statoil
Group since 2006.
Appointed Executive Vice-
President, Central & Eastern
Europe on October 1, 2010.
He was formerly Vice
President for country
operations in Statoil Energy &
Retail since 2007. He joined
Statoil in 1990.
Appointed Senior Vice-
President Global Fuels on
February 16, 2016.
Previously, he had been Vice-
President North American
Fuels since October 2012.
He joined Couche-Tard in
January 2012 as Director of
Operations Midwest.
Jacob Schram
Group President,
European OperationsPLACE IMAGE
HEREAppointed Group President,
European Operations in
June, 2012. He was
formerly Chief Executive
Officer for Statoil Fuel &
Retail from October 1st,
2010. He joined Statoil in
1996.
Claude Tessier
Chief Financial Officer
PLACE IMAGE
HERE
Dennis Tewell
Senior Vice-President,
OperationsPLACE IMAGE
HERE
Claude Tessier, CPA, CA, is
Couche-Tard’s Chief Financial
Officer since February 2016.
Beforehand, Mr. Tessier was
President of the IGA
Operations Business Unit part
of Sobeys since 2012.
Appointed Senior Vice-
President, Operations in June
2013. Prior to his current
appointment, He held the
position of Vice-President,
Worldwide Franchise as he
joined Couche-Tard in January
2011.
Alain Bouchard
Founder and Executive
Chairman of the BoardPLACE IMAGE
HEREOn September 24, 2014, Mr.
Bouchard stepped down as
President and Chief
Executive Officer and took on
a new role as Founder and
Executive Chairman of the
Board of Directors.
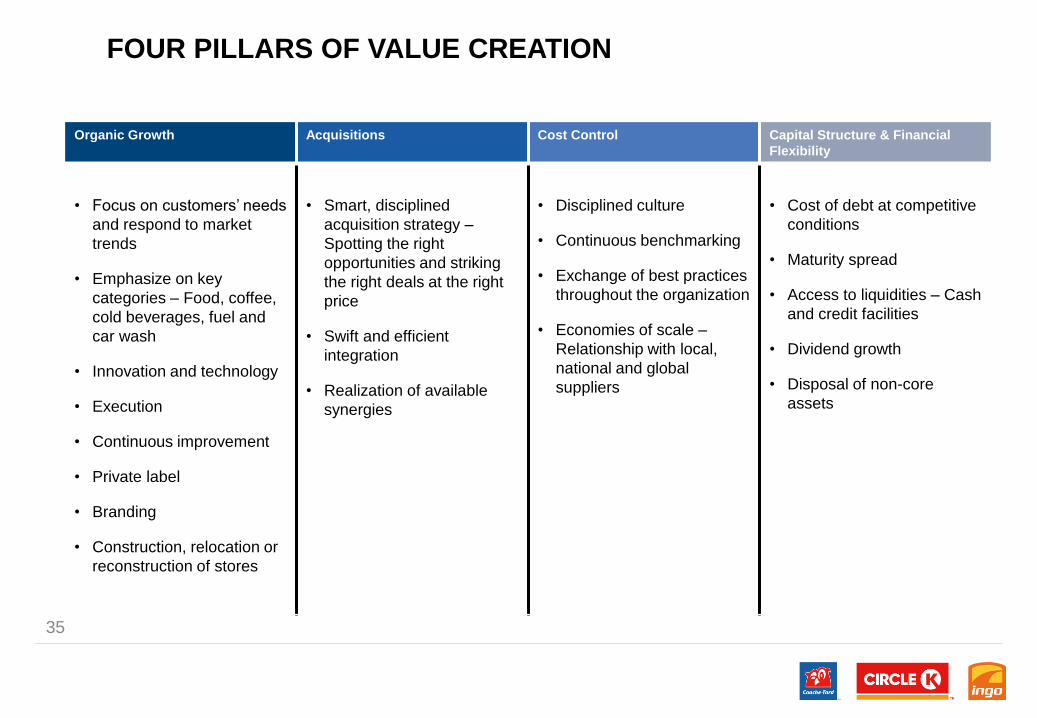
FOUR PILLARS OF VALUE CREATION
35
Organic Growth Acquisitions Cost Control Capital Structure & Financial
Flexibility
• Focus on customers’ needs
and respond to market
trends
• Emphasize on key
categories – Food, coffee,
cold beverages, fuel and
car wash
• Innovation and technology
• Execution
• Continuous improvement
• Private label
• Branding
• Construction, relocation or
reconstruction of stores
• Smart, disciplined
acquisition strategy –
Spotting the right
opportunities and striking
the right deals at the right
price
• Swift and efficient
integration
• Realization of available
synergies
• Disciplined culture
• Continuous benchmarking
• Exchange of best practices
throughout the organization
• Economies of scale –
Relationship with local,
national and global
suppliers
• Cost of debt at competitive
conditions
• Maturity spread
• Access to liquidities – Cash
and credit facilities
• Dividend growth
• Disposal of non-core
assets
ALIMENTATION COUCHE-TARD INC.
ORGANIC GROWTH
Value Creation
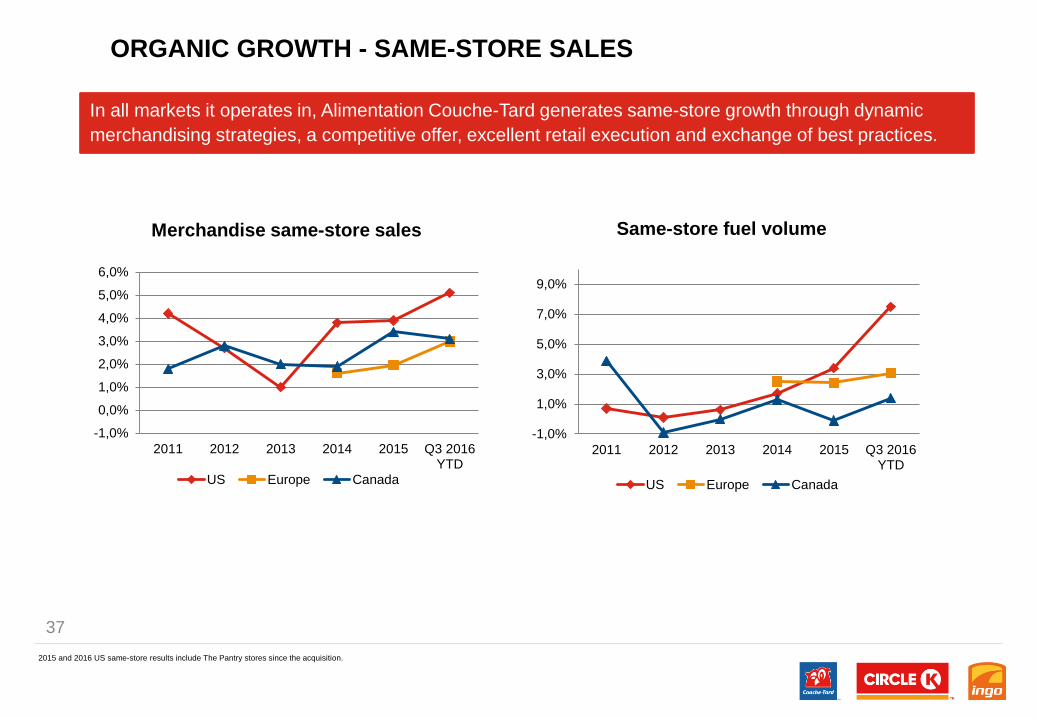
ORGANIC GROWTH - SAME-STORE SALES
In all markets it operates in, Alimentation Couche-Tard generates same-store growth through dynamic
merchandising strategies, a competitive offer, excellent retail execution and exchange of best practices.
2015 and 2016 US same-store results include The Pantry stores since the acquisition.
37
-1,0%
0,0%
1,0%
2,0%
3,0%
4,0%
5,0%
6,0%
2011 2012 2013 2014 2015 Q3 2016YTD
Merchandise same-store sales
US Europe Canada
-1,0%
1,0%
3,0%
5,0%
7,0%
9,0%
2011 2012 2013 2014 2015 Q3 2016YTD
Same-store fuel volume
US Europe Canada
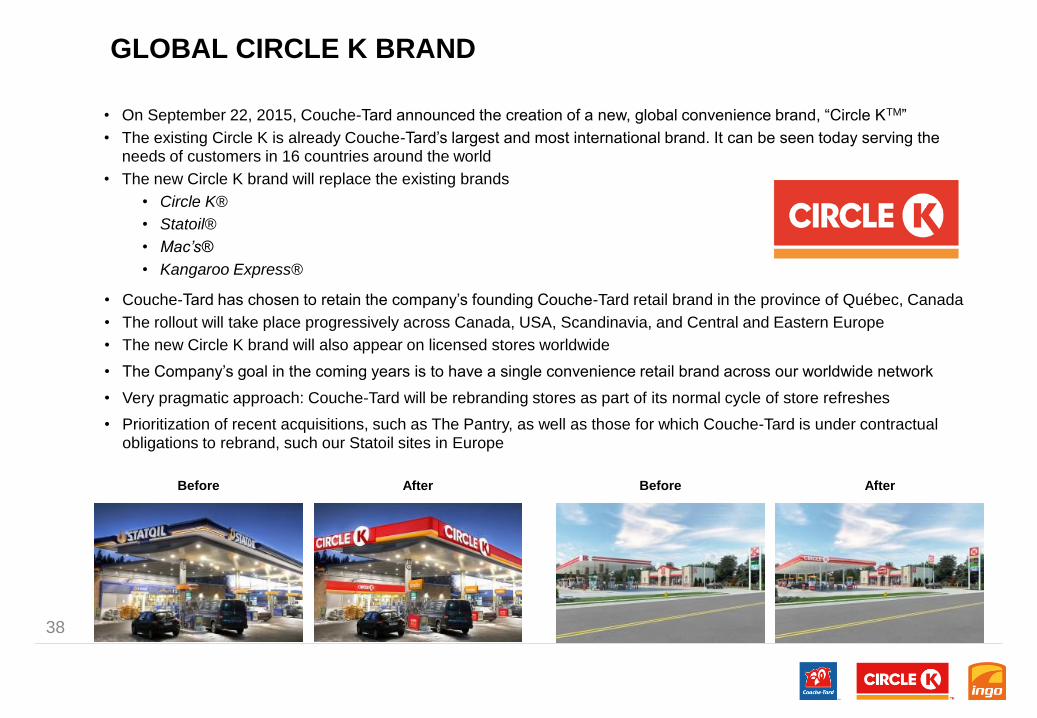
GLOBAL CIRCLE K BRAND
• On September 22, 2015, Couche-Tard announced the creation of a new, global convenience brand, “Circle KTM”
• The existing Circle K is already Couche-Tard’s largest and most international brand. It can be seen today serving the needs of customers in 16 countries around the world
• The new Circle K brand will replace the existing brands
• Circle K®
• Statoil®
• Mac’s®
• Kangaroo Express®
38
• Couche-Tard has chosen to retain the company’s founding Couche-Tard retail brand in the province of Québec, Canada
• The rollout will take place progressively across Canada, USA, Scandinavia, and Central and Eastern Europe
• The new Circle K brand will also appear on licensed stores worldwide
• The Company’s goal in the coming years is to have a single convenience retail brand across our worldwide network
• Very pragmatic approach: Couche-Tard will be rebranding stores as part of its normal cycle of store refreshes
• Prioritization of recent acquisitions, such as The Pantry, as well as those for which Couche-Tard is under contractual obligations to rebrand, such our Statoil sites in Europe
Before After Before After
ALIMENTATION COUCHE-TARD INC.
ACQUISITIONS
Value Creation
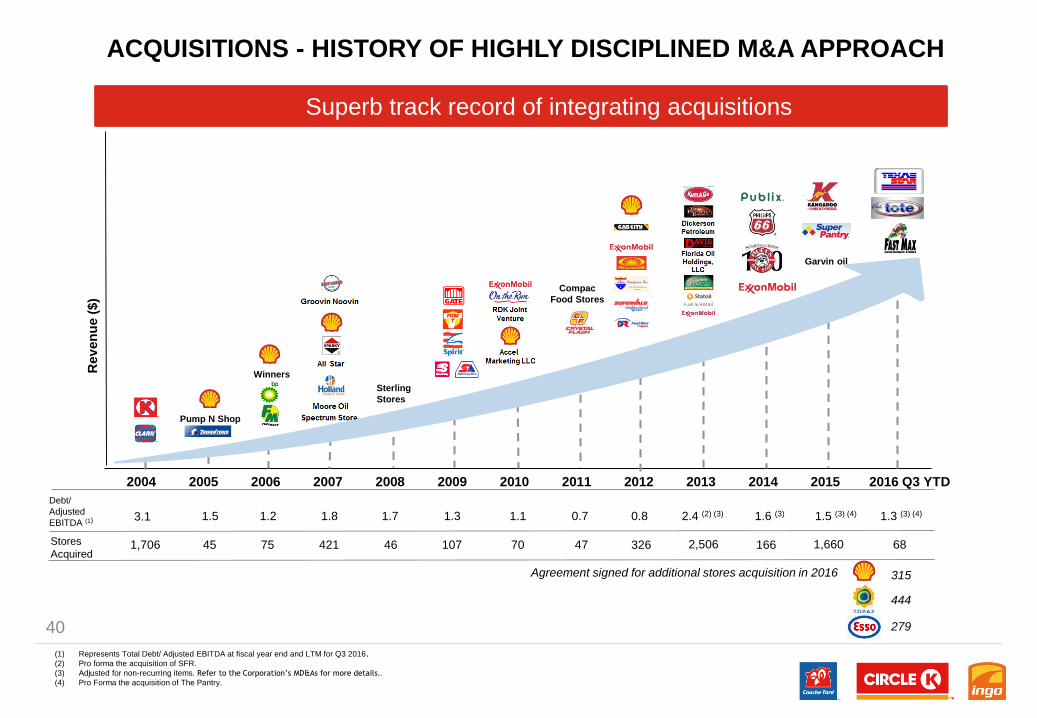
ACQUISITIONS - HISTORY OF HIGHLY DISCIPLINED M&A APPROACH
40
Rev
en
ue (
$)
Debt/
Adjusted
EBITDA (1)
Stores
Acquired
Agreement signed for additional stores acquisition in 2016 315
Superb track record of integrating acquisitions
Pump N Shop
Winners
Sterling
Stores
Compac
Food Stores
Garvin oil
3.1
1,706 45
1.5
75 421 46 107 70 47 326
1.2 1.8 1.7 1.3 1.1 0.7 0.8
2,506
2.4 (2) (3)
166
1.6 (3)
1,660
1.5 (3) (4)
68
1.3 (3) (4)
(1) Represents Total Debt/ Adjusted EBITDA at fiscal year end and LTM for Q3 2016.
(2) Pro forma the acquisition of SFR.
(3) Adjusted for non-recurring items. Refer to the Corporation’s MD&As for more details..
(4) Pro Forma the acquisition of The Pantry.
444
279
2004 2005 2006 2007 2008 2009 2010 2011 2012 2013 2014 2015 2016 Q3 YTD

TOPAZ SNAPSHOT
41
• Leading convenience and fuel retailer in Ireland, made up of 444 stations including its recently acquired Esso station network
• 158 are operated by Topaz and 286 by dealers. Company owns underlying real estate for about 100 sites
• Also commercial fuels operation, with over 30 depots and two owned terminals
• Extensive and attractive convenience and fuel network, with good locations, quality forecourts and stores, an excellent food
offering and very professional teams
• Allows Couche-Tard to expand our geographic footprint into what, today, is one of Europe’s best performing economies
• Great strategic fit for Couche-Tard and it would strengthen its position in Western Europe
• Superior growth anticipated in in-store sales and fuel volume through the improvement of operations; sharing of business
awareness and each company’s best practices; and better supply conditions
• Expected cost reduction synergies from integration into existing European platform
ESSO CANADA SNAPSHOT
• In March 2016, Couche-Tard announced an agreement to acquire 279 Esso-branded fuel and convenience sites in Canada
• 229 sites are located in the province of Ontario, the majority of which in the Greater Toronto Area
• 50 sites are located in the province of Québec, in the Greater Montréal Area, including the south shore of Montréal
• The agreement also includes 13 land banks and two dealer sites, as well as a long-term supply agreement for Esso branded
fuel
• Allows Couche-Tard to expand it’s geographic footprint into the Greater Toronto Area and the Montréal area
• Great strategic fit for Couche-Tard and it would strengthen its position in Canada
42
ALIMENTATION COUCHE-TARD INC.
COST CONTROL
Value Creation

DISCPLINED AND RIGOROUS COST CONTROL
44
Cost leadership is well anchored throughout the organization
(1) Excluding credit card fees. Adjusted for currency translation, impact from acquisitions, acquisition costs as well as, from time to time, for certain non-recurring costs. Refer to the
Corporation’s annual MD&As for more details.
• Cost synergies from major acquisitions :
SFRObjective $150-$200M
Realized $199M
The PantryObjective $85M
Identified $63M
Realized $43M
ALIMENTATION COUCHE-TARD INC.
CAPITAL STRUCTURE
& FINANCIAL
FLEXIBILITY
Value Creation
46
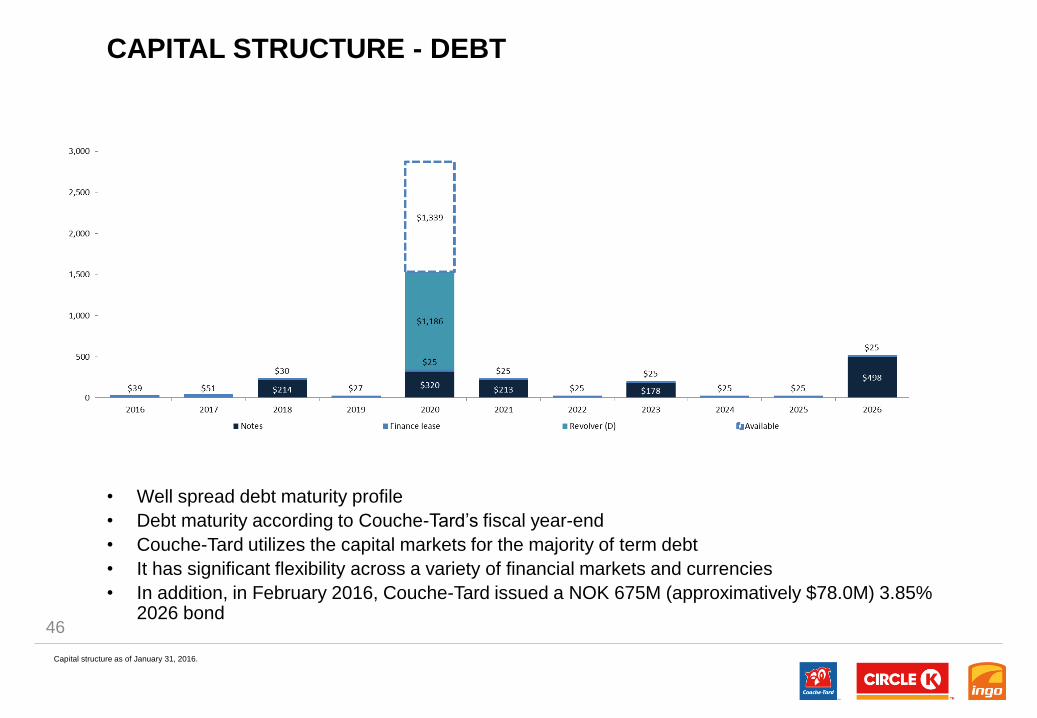
• Well spread debt maturity profile
• Debt maturity according to Couche-Tard’s fiscal year-end
• Couche-Tard utilizes the capital markets for the majority of term debt
• It has significant flexibility across a variety of financial markets and currencies
• In addition, in February 2016, Couche-Tard issued a NOK 675M (approximatively $78.0M) 3.85% 2026 bond
CAPITAL STRUCTURE - DEBT
Capital structure as of January 31, 2016.

AVERAGE INTEREST RATE ON DEBT
47
Competitive and attractive cost of debt
Based on latest Q4 information except for ACT which is as per January 31, 2016.

48
CAPITAL STRUCTURE – ADJUSTED NET DEBT/EBITDAR
• Our growth strategy is supported by our commitment to a strong capital structure
• Acquisitions are undertaken with the objective of rapid deleveraging
• Our credit ratings were raised to Baa2 / BBB in Q3 2014 and S&P revised to positive outlook in July 2015
(1) Pro Forma The Pantry.
Strong Capital Discipline
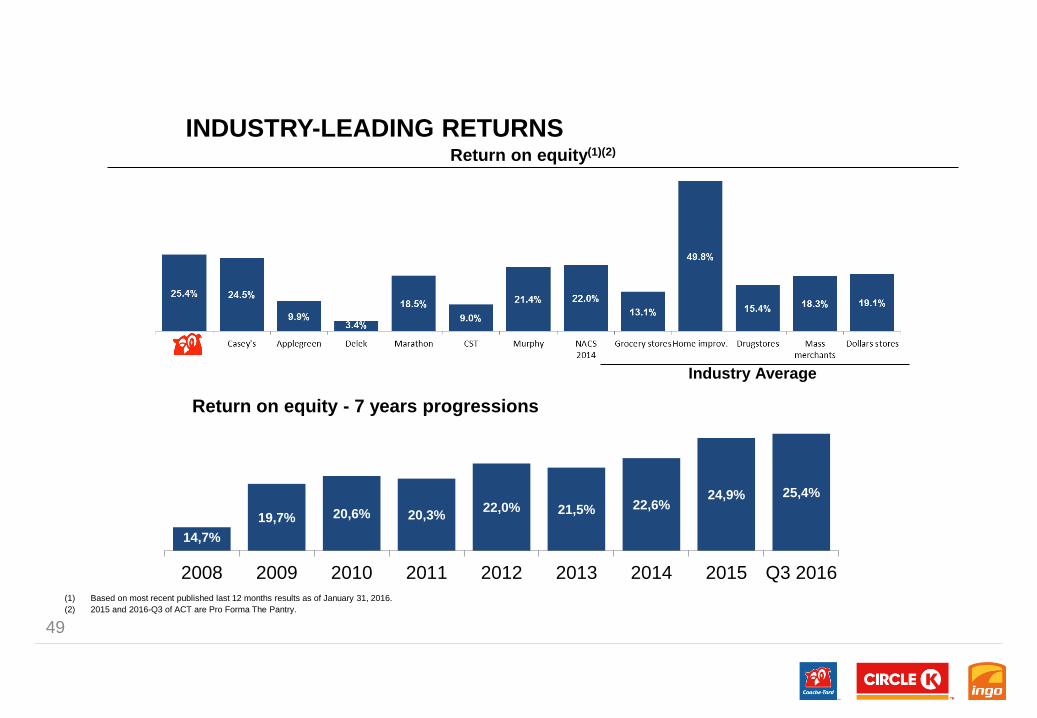
Industry Average
INDUSTRY-LEADING RETURNS
49
Return on equity(1)(2)
(1) Based on most recent published last 12 months results as of January 31, 2016.
(2) 2015 and 2016-Q3 of ACT are Pro Forma The Pantry.
14,7%
19,7% 20,6% 20,3%22,0% 21,5% 22,6%
24,9% 25,4%
2008 2009 2010 2011 2012 2013 2014 2015 Q3 2016
Return on equity - 7 years progressions
50
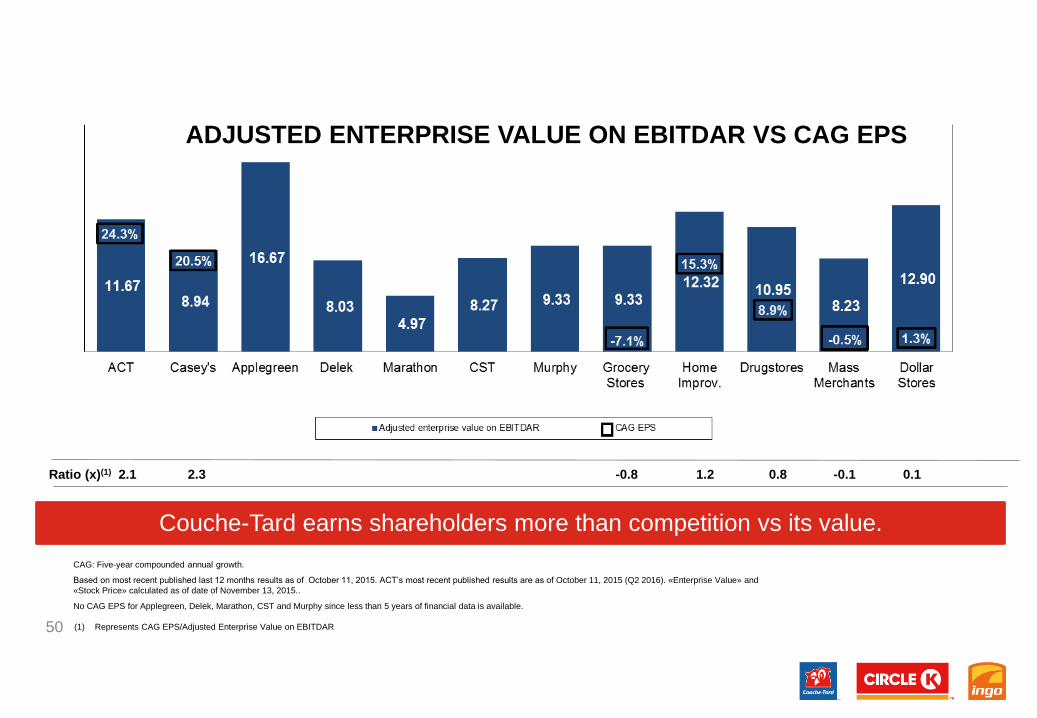
ADJUSTED ENTERPRISE VALUE ON EBITDAR VS CAG EPS
Couche-Tard earns shareholders more than competition vs its value.
CAG: Five-year compounded annual growth.
Based on most recent published last 12 months results as of October 11, 2015. ACT’s most recent published results are as of October 11, 2015 (Q2 2016). «Enterprise Value» and
«Stock Price» calculated as of date of November 13, 2015..
No CAG EPS for Applegreen, Delek, Marathon, CST and Murphy since less than 5 years of financial data is available.
(1) Represents CAG EPS/Adjusted Enterprise Value on EBITDAR
Ratio (x)(1) 2.1 2.3 -0.8 1.2 0.8 -0.1 0.1
ALIMENTATION COUCHE-TARD INC.
APPENDIX
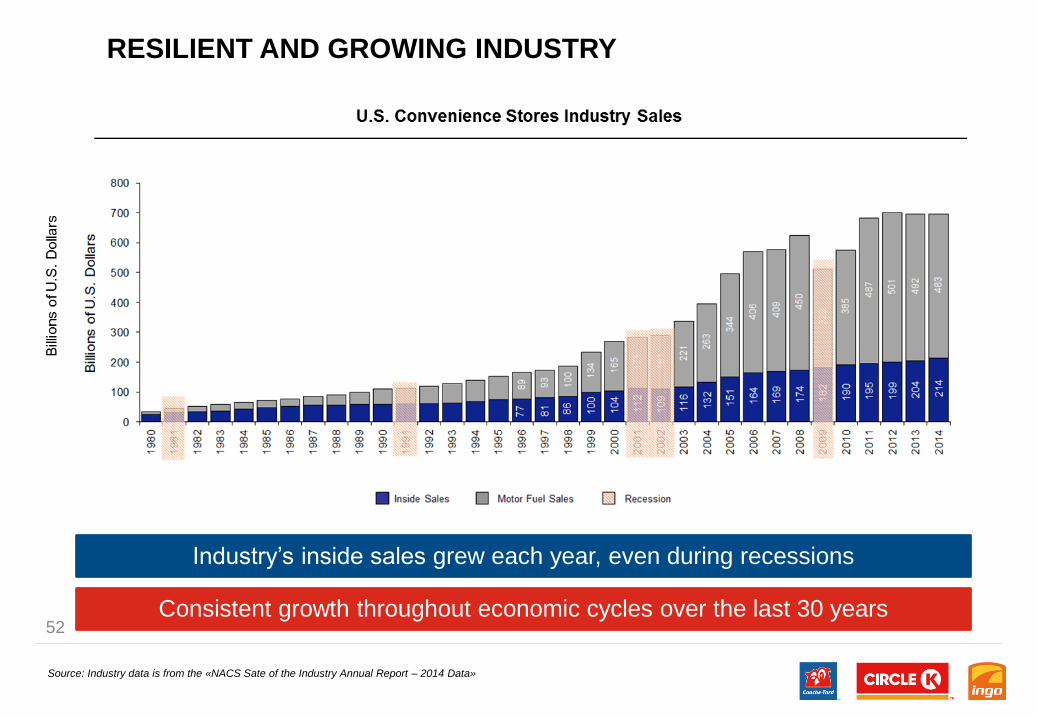
RESILIENT AND GROWING INDUSTRY
52
Industry’s inside sales grew each year, even during recessions
Consistent growth throughout economic cycles over the last 30 years
Source: Industry data is from the «NACS Sate of the Industry Annual Report – 2014 Data»