Embed Size (px)
Citation preview

This document contains confidential and proprietary information which is the property of Frank’s International. None of the information contained herein may
be disclosed, reproduced, distributed or used without prior written consent from Frank’s International. © 2014 Frank’s International. All rights reserved.
Investor PresentationQ4 2014
Nov 10, 2014
This document contains confidential and proprietary information which is the property of Frank’s International. None of the information contained herein may
be disclosed, reproduced, distributed or used without prior written consent from Frank’s International. © 2014 Frank’s International. All rights reserved.
Corporate Information
2
This presentation contains forward-looking statements within the meaning of Section 27A of the Securities Act of 1933and Section 21E of the Securities Exchange Act of 1934. All statements, other than statements of historical facts,included in this presentation that address activities, events or developments that the Company expects, believes oranticipates will or may occur in the future are forward-looking statements. Without limiting the generality of theforegoing, forward-looking statements contained in this presentation specifically include statements, estimates andprojections regarding the Company’s future business strategy and prospects for growth, cash flows and liquidity,financial strategy, budget, projections and operating results, the amount, nature and timing of capital expenditures,the availability and terms of capital, the level of activity in the oil and gas industry, volatility of oil and gas prices,unique risks associated with offshore operations, political, economic and regulatory uncertainties in internationaloperations, the ability to develop new technologies and products, the ability to protect intellectual property rights, theability to employ and retain skilled and qualified workers, the level of competition in the Company’s industry andother guidance. These statements are based on certain assumptions made by the Company based on management’sexperience, expectations and perception of historical trends, current conditions, anticipated future developments andother factors believed to be appropriate. Forward-looking statements are not guarantees of performance. Althoughthe Company believes the expectations reflected in its forward-looking statements are reasonable and are based onreasonable assumptions, no assurance can be given that these assumptions are accurate or that any of theseexpectations will be achieved (in full or at all) or will prove to have been correct. Moreover, such statements aresubject to a number of assumptions, risks and uncertainties, many of which are beyond the control of the Company,which may cause actual results to differ materially from those implied or expressed by the forward-lookingstatements. These include the factors discussed or referenced in the “Risk Factors” section of the Company’s AnnualReport on Form 10-K filed with the U.S. Securities and Exchange Commission (the “SEC”) on March 4, 2014 and itssubsequent filings with the SEC. Accordingly, you should not place undue reliance on any of the Company’s forward-looking statements. Any forward-looking statement speaks only as of the date on which such statement is made, andthe Company undertakes no obligation to correct or update any forward-looking statement, whether as a result of newinformation, future events or otherwise, except as required by applicable law, and we caution you not to rely on themunduly.
This presentation includes the non-GAAP financial measures of Adjusted EBITDA and Adjusted EBITDA margin, whichmay be used periodically by management when discussing the Company’s financial results with investors and analysts.Adjusted EBITDA and Adjusted EBITDA margin are presented because management believes these metrics provideadditional information relative to the performance of the Company’s business. These metrics are commonly employedby financial analysts and investors to evaluate the operating and financial performance of the Company from period toperiod and to compare it with the performance of other publicly traded companies within the industry. You should notconsider Adjusted EBITDA and Adjusted EBITDA margin in isolation or as a substitute for analysis of the Company’sresults as reported under GAAP. Because Adjusted EBITDA and Adjusted EBITDA margin may be defined differently byother companies in the Company’s industry, the Company’s presentation of Adjusted EBITDA and Adjusted EBITDAmargin may not be comparable to similarly titled measures of other companies, thereby diminishing their utility. For areconciliation of each to the nearest comparable measure in accordance with GAAP, please see the Appendix.
Keith Mosing
Chairman, President and CEO
John Sinders
Executive Vice President,
Administration, Interim CFO
John Walker
Executive Vice President, Operations
Thomas Dunavant
Manager, Finance and Investor Relations
Ph: (713) 358-7343
U.S. Headquarters
Frank’s International N.V.
10260 Westheimer, Suite 700
Houston, TX 77042
www.franksinternational.com
Disclaimer

This document contains confidential and proprietary information which is the property of Frank’s International. None of the information contained herein may
be disclosed, reproduced, distributed or used without prior written consent from Frank’s International. © 2014 Frank’s International. All rights reserved.
Investment Highlights
• Leveraged to deep, complex exploration and development wells
• Global footprint with a presence in all major oil & gas markets
• Well positioned for growth as rig counts increase
• Strong free cash flow in excess of capital
• Solid balance sheet with virtually no debt
• High dividend yield
3

This document contains confidential and proprietary information which is the property of Frank’s International. None of the information contained herein may
be disclosed, reproduced, distributed or used without prior written consent from Frank’s International. © 2014 Frank’s International. All rights reserved.
Leader in Well Construction
Frank’s International is a 75+ year old company focused on
providing well construction services to E&P companies
around the world
4
This document contains confidential and proprietary information which is the property of Frank’s International. None of the information contained herein may
be disclosed, reproduced, distributed or used without prior written consent from Frank’s International. © 2014 Frank’s International. All rights reserved.
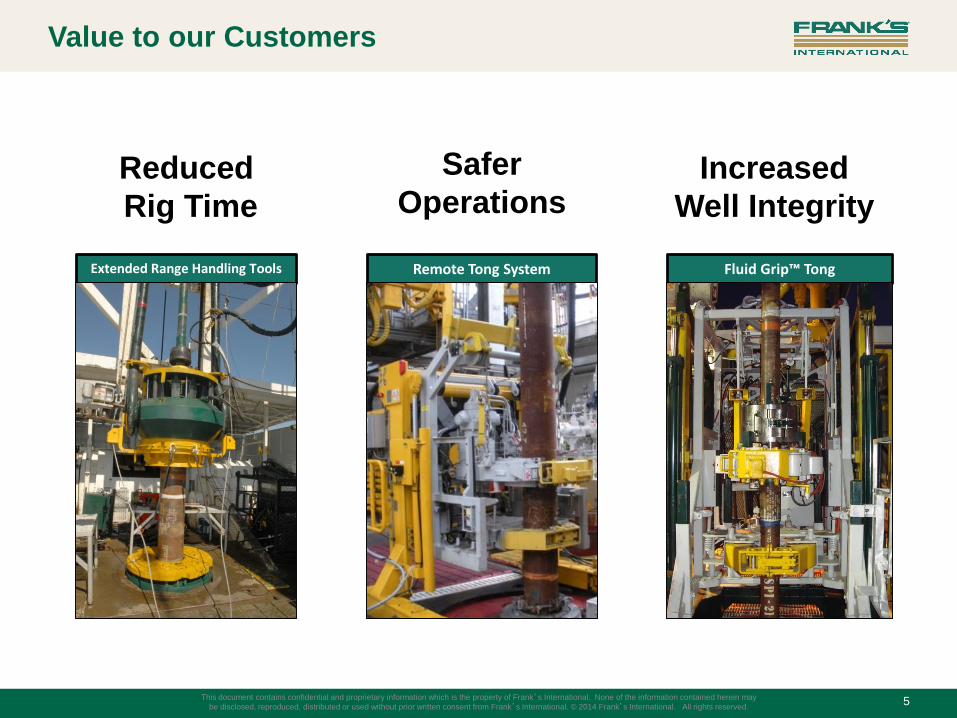
Value to our Customers
5
Reduced
Rig Time
Safer
OperationsIncreased
Well Integrity
Extended Range Handling Tools Remote Tong System Fluid Grip™ Tong
This document contains confidential and proprietary information which is the property of Frank’s International. None of the information contained herein may
be disclosed, reproduced, distributed or used without prior written consent from Frank’s International. © 2014 Frank’s International. All rights reserved.
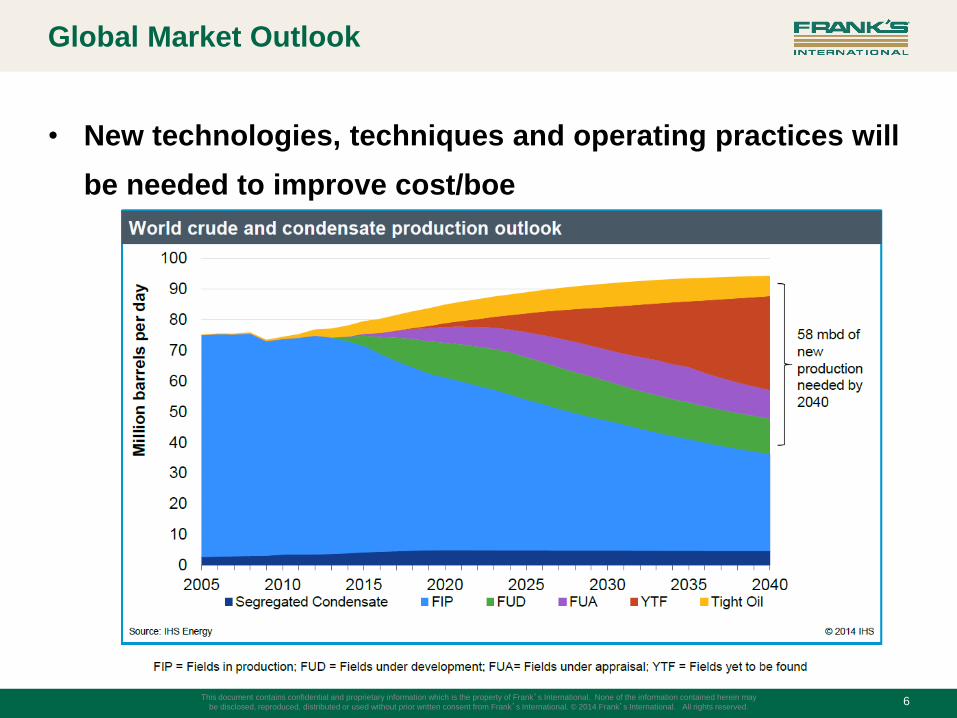
Global Market Outlook
• New technologies, techniques and operating practices will
be needed to improve cost/boe
6

This document contains confidential and proprietary information which is the property of Frank’s International. None of the information contained herein may
be disclosed, reproduced, distributed or used without prior written consent from Frank’s International. © 2014 Frank’s International. All rights reserved.
Sources of New Production
• Unconventional and deepwater new source production have the
highest expected growth
• Unconventional growth predominantly driven by North American
shale plays
• Conventional onshore and shallow water still significant
7
New Source Production by Asset Type
0
5,000
10,000
15,000
20,000
25,000
2013 2014 2015 2016 2017 2018 2019 2020 2021 2022 2023
mb
oe
/d
Unconventional Oil Sands
Deepwater Conventional Shallow
Conventional Onshore

This document contains confidential and proprietary information which is the property of Frank’s International. None of the information contained herein may
be disclosed, reproduced, distributed or used without prior written consent from Frank’s International. © 2014 Frank’s International. All rights reserved.
Gulf of Mexico
• Increasing offshore rig count
• Lower Tertiary trend
• Mexico reform – 2016 and
beyond
• FI Growth Drivers
• Increase jackup market share
• Increase completion market
share
8
Single Joint Elevator

This document contains confidential and proprietary information which is the property of Frank’s International. None of the information contained herein may
be disclosed, reproduced, distributed or used without prior written consent from Frank’s International. © 2014 Frank’s International. All rights reserved.
International Markets
• Deepwater growth
• West Africa
• Latin America
• Shallow water growth
• Middle East jackups
• FI Growth Drivers
• Increase market share in North
Sea, Middle East and Far East
• Integrated Project Management
(IPM) contracts
9
Remote Powertong Cassette Package

This document contains confidential and proprietary information which is the property of Frank’s International. None of the information contained herein may
be disclosed, reproduced, distributed or used without prior written consent from Frank’s International. © 2014 Frank’s International. All rights reserved.
U.S. Land
• More unconventional oil
sources
• FI growth drivers
• Investment in third-party
equipment
• Revised pricing strategy
10
FX350 Casing Running Tool (CRT)
This document contains confidential and proprietary information which is the property of Frank’s International. None of the information contained herein may
be disclosed, reproduced, distributed or used without prior written consent from Frank’s International. © 2014 Frank’s International. All rights reserved.
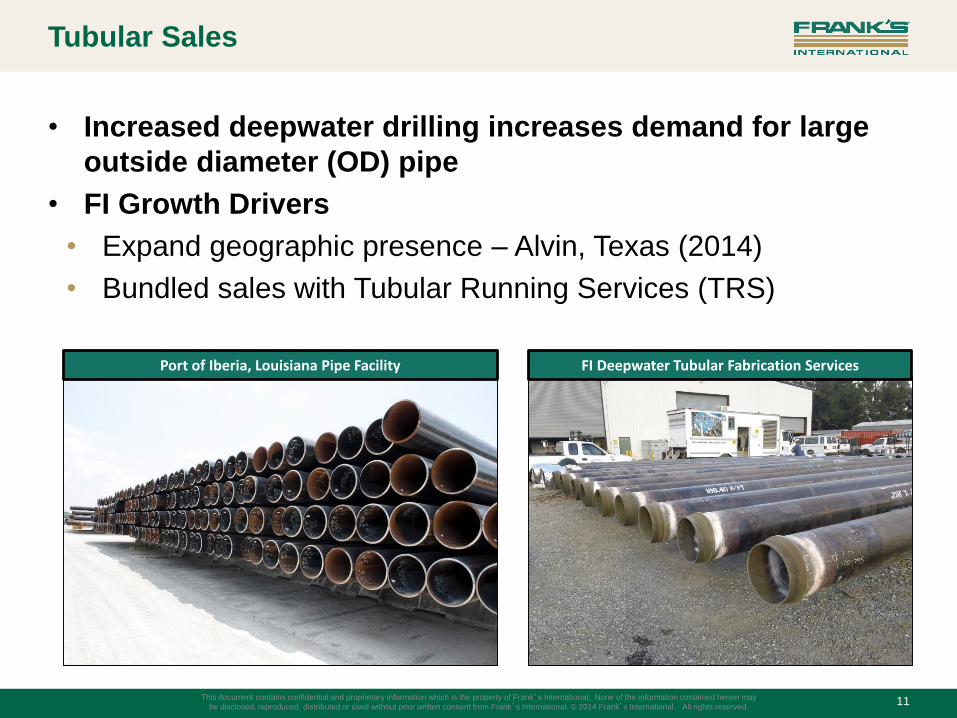
Tubular Sales
11
• Increased deepwater drilling increases demand for large
outside diameter (OD) pipe
• FI Growth Drivers
• Expand geographic presence – Alvin, Texas (2014)
• Bundled sales with Tubular Running Services (TRS)
FI Deepwater Tubular Fabrication ServicesPort of Iberia, Louisiana Pipe Facility

This document contains confidential and proprietary information which is the property of Frank’s International. None of the information contained herein may
be disclosed, reproduced, distributed or used without prior written consent from Frank’s International. © 2014 Frank’s International. All rights reserved.
Q3 Highlights
Total Company Revenue $296.2 Up 8.5% sequentially
Adjusted EBITDA(1) $120.5 Up 16.8% sequentially
Adjusted EBTIDA Margin 40.7% Up 290 bps sequentially
12
1) Adjusted EBITDA is a non-GAAP financial measure. See reconciliation of income from continuing operations to adjusted EBITDA included in the appendix2) Based on stock price as of 11/7/2014
Cash $468.4
Dividend Yield(2) 3.1%
($ in millions)

This document contains confidential and proprietary information which is the property of Frank’s International. None of the information contained herein may
be disclosed, reproduced, distributed or used without prior written consent from Frank’s International. © 2014 Frank’s International. All rights reserved.
YTD Highlights
Total Company Revenue $833.6 Up 4.8%
Adjusted EBITDA(1) $325.9 Down 0.8%
Adjusted EBTIDA Margin 39.1% Down 219 bps
13
1) Adjusted EBITDA is a non-GAAP financial measure. See reconciliation of income from continuing operations to adjusted EBITDA included in Supplemental Financials section2) Free Cash Flow is Cash Flow from Operations minus Capital Expenditures. See detailed calculation in Supplemental Financials section
U.S. Land $121.9 Down 7.4%
Gulf of Mexico $199.5 Up 5.2%
U.S. Services $321.5 Flat
International Services $391.4 Up 10.9%
Tubular Sales $120.8 Flat
Segment Revenue
($ in millions)
Free Cash Flow(2) $149.7 Up 32.1%

This document contains confidential and proprietary information which is the property of Frank’s International. None of the information contained herein may
be disclosed, reproduced, distributed or used without prior written consent from Frank’s International. © 2014 Frank’s International. All rights reserved.
2014 Expectations
• International Services revenue growth at least 10%
• U.S. Offshore revenue growth at least 10%
• U.S. Land revenue decline 10%
• Tubular Sales revenue growth at least 4%
• Overall Adjusted EBITDA margins between 37% and 39%
• Tax rate: 20% – 25%
• 2014 Diluted share count: Approximately 208 million
14

This document contains confidential and proprietary information which is the property of Frank’s International. None of the information contained herein may
be disclosed, reproduced, distributed or used without prior written consent from Frank’s International. © 2014 Frank’s International. All rights reserved.
Questions?