Embed Size (px)
Citation preview
Mkt. Cap Price Cons. Current EPS Estimates Previous Est.Company Name Ticker (MM) Rating Price Target Next FY 2014 2015 2016 2015 2016 D.B. Corp DBCL IN INR73.3BN BUY INR400.15 INR460.00▲ INR18.80 INR16.70 INR19.00 INR24.70 INR18.20 INR23.00Dish TV India DITV IN INR73.1BN UNPF INR68.65 INR49.00 INR(0.01) INR(1.45) INR(0.42) INR0.30 INR(0.42) INR0.30Jagran Prakashan JAGP IN INR43.8BN BUY INR138.45 INR160.00▲ INR8.10 INR7.27 INR8.18 INR10.44 INR9.00 INR11.54Zee Entertainment Z IN INR344.3BN HOLD INR360.90 INR340.00▲ INR9.30 INR9.30 INR9.90 INR11.90 INR9.40 INR11.10
INDUSTRY NOTE
Target | Estimate Change
India | Media | Media & Entertainment 13 January 2015
Media & Entertainment2015: On a Cyclical Uptrend
EQU
ITY R
ESEARC
H IN
DIA
Piyush Nahar *Equity Analyst
+91 22 4224 6113 [email protected]
* Jefferies India Private Limited
Key Takeaway
Media sector would likely see a cyclical recovery in 2015 driven by economicgrowth. We expect advertising growth to improve and subscription growth toremain strong. Further, commodity prices deflation should benefit print sector.Print is our preferred pick in 2015, while we maintain our cautious view on DishTV. Zee could remain range-bound, in our view, given elevated valuations andmuted near-term results.
Broadcasting - early signs of per subscriber model, benefits to be slow: The pastcouple of quarters have seen signs of shift to per subscriber contract with cable and DTHplayers. However, the benefits of this have been limited, as significant hikes in subscriptionrevenues need consumer pack prices to increase. Further, the per subscriber contracts leadto loss of viewership for many secondary channels of broadcasters, impacting ad revenues.While the recent trends are positive, we believe benefits would accrue only over the mediumterm. Advertising growth for the sector should see an improvement in 2015, led by arecovery in the economy. However, Zee's growth would likely be lower than recent growthgiven lack of market share gains going forward.
Print - in a sweet spot: Print sector would be in a sweet spot in 2015, in our view, ledby twin benefits of better advertising growth and lower commodity prices (newsprint). Posttwo years of weakness in advertising growth (8% pa), we expect growth to improve goingforward, led by an improvement in economic growth. Historically, advertising growth forprint has been closely linked to GDP growth. Further, newsprint prices are on a downtrend,declining c5% and could see further downside. This would significantly benefit margins forthe print players. We expect print to report c17-20% EPS growth over the next three years.
DTH - to see a cyclical rebound but with rising competition: We have maintainedour negative view on the DTH industry for the past two years. Our view has been thatdigitization is a negative for the DTH industry and this played out in Phase I and II forthe sector. The weak economic environment further impacted subscriber addition andprice hikes. Going forward, while we expect subscriber addition to see some cyclicalimprovement, additions would remain well below previous peaks. Further, while improvingeconomic conditions should allow DTH to take further price hikes, this is already inthe numbers. We are factoring c5% pa price hikes for Dish TV. However, the cyclicalimprovement in additions and price hike would likely come with increased competition,especially on STB subsidy, which would impact the profitability and capex for the players.
Radio - phase III auctions the key trigger. Radio has seen strong growth in the pastfew years and we expect this trend to continue. The key trigger would be Phase III auction,which would likely see new players entering the sector. The key beneficiary would likely beJAGP and DBCL.
Prefer DBCL, Underperform on DITV, Z to remain range-bound: We prefer printplayers DBCL and JAGP for 2015 and maintain our cautious view on DITV. Zee has reratedsharply to 32x FY16 PE, on expectations of increased subscription revenues. However, webelieve that significant benefits would take time to accrue and the stock could remain range-bound. We maintain Hold on Z IN with a revised PT of Rs340 (from Rs295). We also reviseour PTs for DBCL and JAGP to Rs460 (from Rs410) and Rs160 (from Rs140 ), respectively.
Jefferies does and seeks to do business with companies covered in its research reports. As a result, investors should be aware that Jefferies may have aconflict of interest that could affect the objectivity of this report. Investors should consider this report as only a single factor in making their investmentdecision. Please see analyst certifications, important disclosure information, and information regarding the status of non-US analysts on pages 19 to 23of this report.
Zee (Z IN): Valuations an overhang Zee has seen a sharp re-rating-led rally over the past three months, driven by
an expectation of shift towards per subscriber booking in subscription
revenues. We believe that expectation of significant subscription revenue
growth acceleration is premature, as seen in the Zee-Hathway deal which has
returned to negotiated deal. We expect subscription growth to see steady
growth of 16-17% pa in the near term. With the stock now trading at 32x
FY16 PE, we believe that the valuation overhang, lack of near-term triggers
and weak results would keep the share price range-bound. Maintain Hold
with revised TP of Rs 340 (from Rs295).
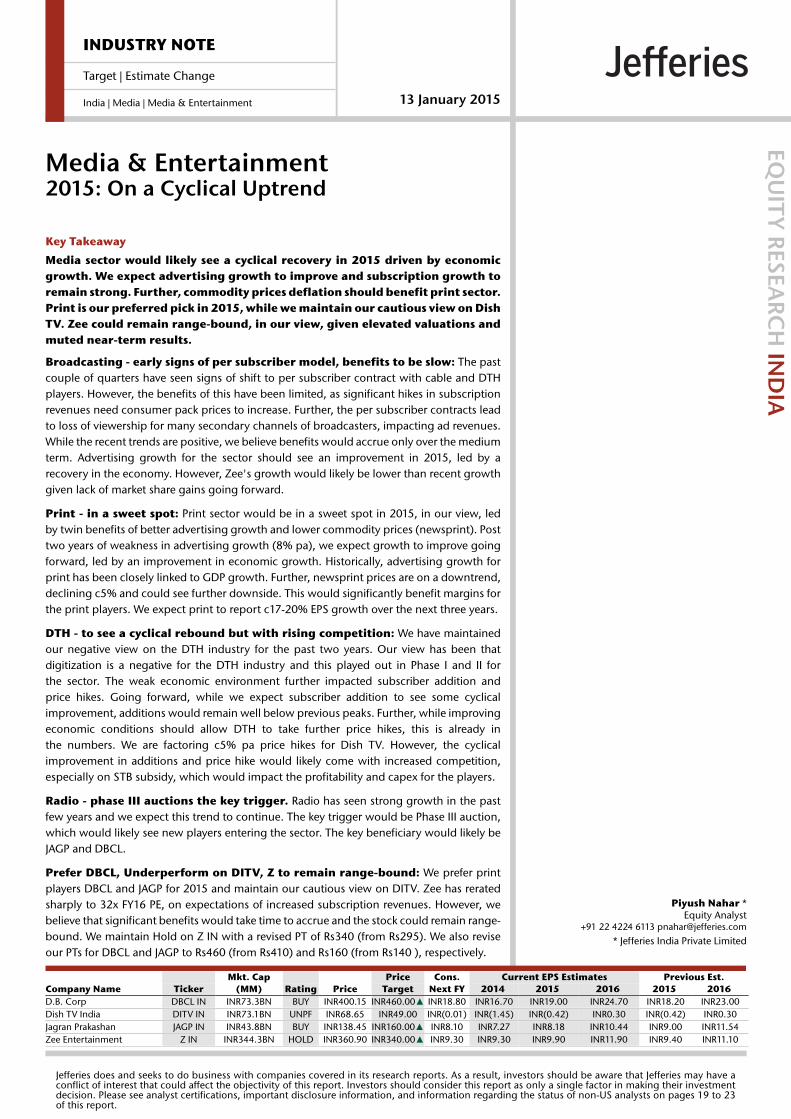
Advertising growth to see a slowdown: While we expect the sector advertising
growth to accelerate, Zee’s advertising growth would likely remain below recent levels.
This is because Zee has been gaining market share in the past couple of years and the
benefits of this are now behind us. Going, forward we expect advertising growth to
moderate to industry levels of 17% vs recent growth of 20%+.
Exhibit 1: Advertising growth to remain below recent peaks
Source: Company Data, Jefferies estimates
Exhibit 2: Subscription growth to remain strong
Source: Company Data, Jefferies estimates
Subscription growth to remain strong: Unlike advertising, we expect subscription
growth for the company to remain strong going forward. Both Zee and Star have recently
experimented with per subscriber contracts with cable operators. However, the feedback
has been that while they gained incremental revenues, Zee has reverted to a negotiated
deal. This could be due to per subscriber deal leading to loss of subscribers in the second-
tier channels of the broadcaster. In addition to subscription revenues, this would have also
impacted advertising revenues. Zee management has maintained that they are receiving
close to their fair share of revenues in the digitized market. Thus, for subscription growth
to increase significantly from current levels, it would have to be led by consumer package
price hikes. We believe that this would gain pace going forward and have increased our
subscription revenue growth forecast to 16% pa, from 12%.
Digitization benefits to be limited: With Phase III and IV digitization deadline pushed
to Dec 2015 and Dec 2016, respectively, the benefits of digitization would accrue only
from FY17. We believe that Phase III would see partial digitization, while we do not expect
any significant digitization in Phase IV.
Sports business losses to remain stable: Sports business losses would likely remain
stable in 2015 given lack of significant India cricket event and better advertising and
subscription revenues.
Strong 20% EPS growth but valuations an overhang: We expect Zee to report
20% EPS CAGR over FY15-17E, led by better top-line growth and increase in margins.
(10)
(5)
0
5
10
15
20
25
30
FY12 FY13 FY14 FY15E FY16E FY17E
Advertising Growth (%)
(10)
(5)
0
5
10
15
20
25
FY12 FY13 FY14 FY15E FY16E FY17E
Subscription revenue growth (%)
Media
Target | Estimate Change
13 January 2015
page 2 of 23 , Equity Analyst, +91 22 4224 6113, [email protected] Nahar
Please see important disclosure information on pages 19 - 23 of this report.
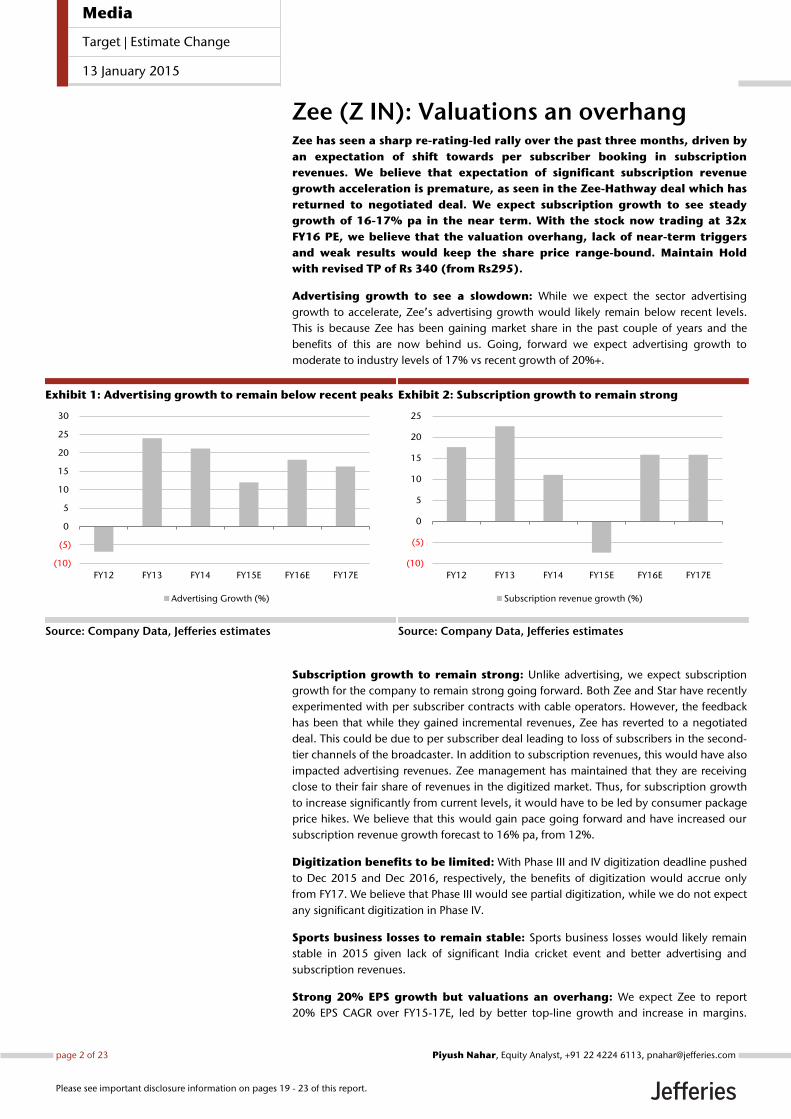
However, 2H15 growth would be muted, led by slower advertising growth and higher
costs led by launch of new channels. With the stock having re-rated 25% over the past
three months and now trading nearly 2 st. dev. above historical averages, we see limited
upside from current levels. We have revised our EPS by 5-6% as we factor in the increased
subscription revenue growth and lower sports losses. We have revised DCF-based PT to
Rs340 (from Rs 295), as we factor in higher EPS and roll forward our DCF to Mar-16. Risks:
1) weak economic recovery, 2) increased competition, 3) delay in subscription price hikes.
Exhibit 3: Expect margins to improve from FY16
Source: Jefferies estimates, company data
Exhibit 4: Valuations now at historical peaks and
significantly above average
Source: Factset, Jefferies estimates
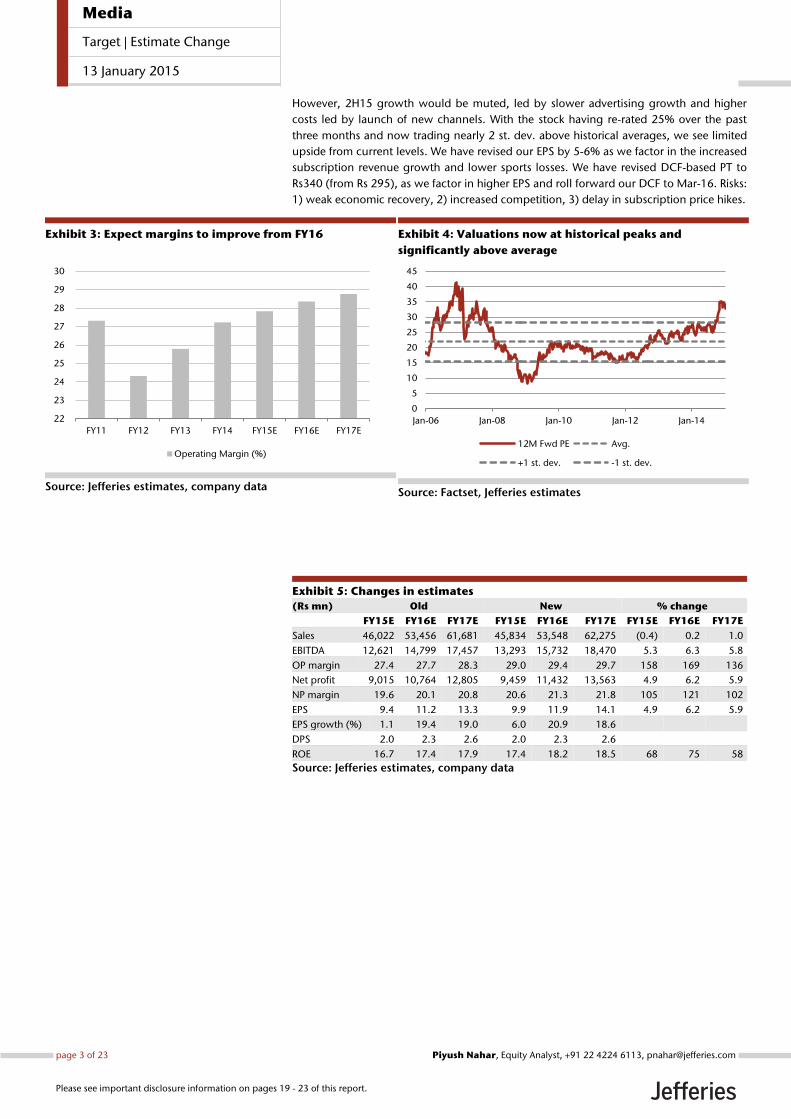
Exhibit 5: Changes in estimates
(Rs mn) Old New % change
FY15E FY16E FY17E FY15E FY16E FY17E FY15E FY16E FY17E
Sales 46,022 53,456 61,681 45,834 53,548 62,275 (0.4) 0.2 1.0
EBITDA 12,621 14,799 17,457 13,293 15,732 18,470 5.3 6.3 5.8
OP margin 27.4 27.7 28.3 29.0 29.4 29.7 158 169 136
Net profit 9,015 10,764 12,805 9,459 11,432 13,563 4.9 6.2 5.9
NP margin 19.6 20.1 20.8 20.6 21.3 21.8 105 121 102
EPS 9.4 11.2 13.3 9.9 11.9 14.1 4.9 6.2 5.9
EPS growth (%) 1.1 19.4 19.0 6.0 20.9 18.6
DPS 2.0 2.3 2.6 2.0 2.3 2.6
ROE 16.7 17.4 17.9 17.4 18.2 18.5 68 75 58
Source: Jefferies estimates, company data
22
23
24
25
26
27
28
29
30
FY11 FY12 FY13 FY14 FY15E FY16E FY17E
Operating Margin (%)
0
5
10
15
20
25
30
35
40
45
Jan-06 Jan-08 Jan-10 Jan-12 Jan-14
12M Fwd PE Avg.
+1 st. dev. -1 st. dev.
Media
Target | Estimate Change
13 January 2015
page 3 of 23 , Equity Analyst, +91 22 4224 6113, [email protected] Nahar
Please see important disclosure information on pages 19 - 23 of this report.
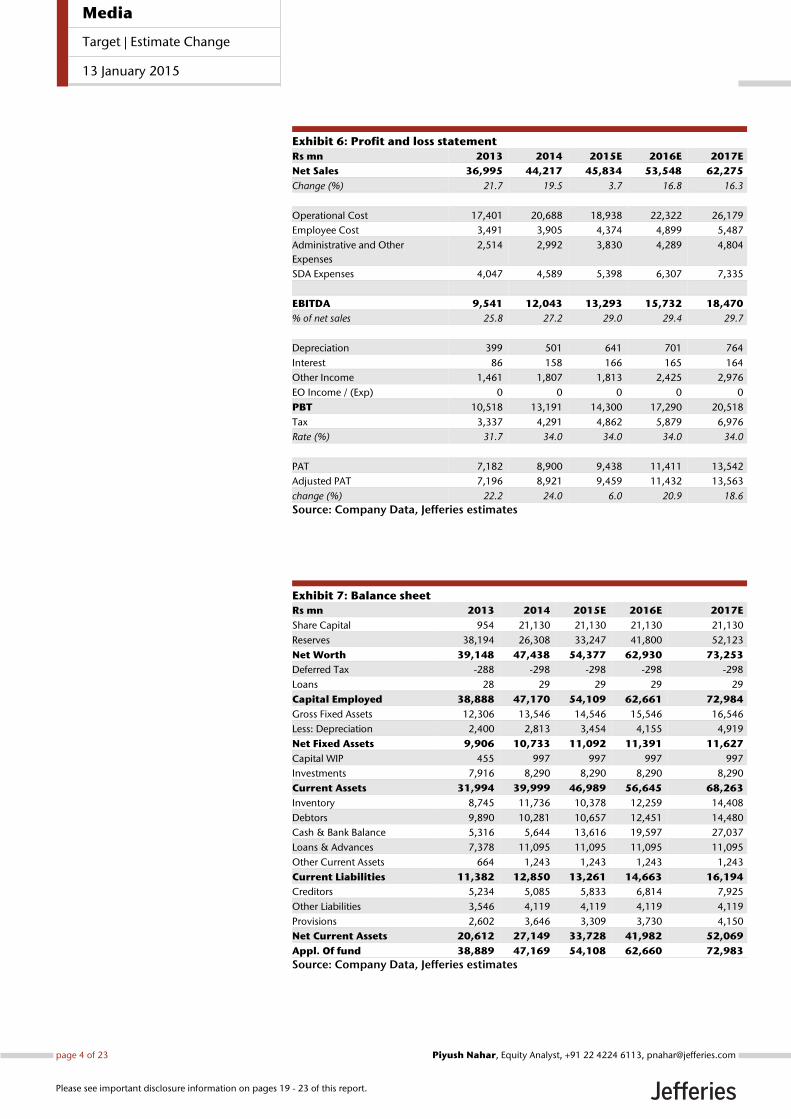
Exhibit 6: Profit and loss statement
Rs mn 2013 2014 2015E 2016E 2017E
Net Sales 36,995 44,217 45,834 53,548 62,275
Change (%) 21.7 19.5 3.7 16.8 16.3
Operational Cost 17,401 20,688 18,938 22,322 26,179
Employee Cost 3,491 3,905 4,374 4,899 5,487
Administrative and Other
Expenses
2,514 2,992 3,830 4,289 4,804
SDA Expenses 4,047 4,589 5,398 6,307 7,335
EBITDA 9,541 12,043 13,293 15,732 18,470
% of net sales 25.8 27.2 29.0 29.4 29.7
Depreciation 399 501 641 701 764
Interest 86 158 166 165 164
Other Income 1,461 1,807 1,813 2,425 2,976
EO Income / (Exp) 0 0 0 0 0
PBT 10,518 13,191 14,300 17,290 20,518
Tax 3,337 4,291 4,862 5,879 6,976
Rate (%) 31.7 34.0 34.0 34.0 34.0
PAT 7,182 8,900 9,438 11,411 13,542
Adjusted PAT 7,196 8,921 9,459 11,432 13,563
change (%) 22.2 24.0 6.0 20.9 18.6
Source: Company Data, Jefferies estimates
Exhibit 7: Balance sheet
Rs mn 2013 2014 2015E 2016E 2017E
Share Capital 954 21,130 21,130 21,130 21,130
Reserves 38,194 26,308 33,247 41,800 52,123
Net Worth 39,148 47,438 54,377 62,930 73,253
Deferred Tax -288 -298 -298 -298 -298
Loans 28 29 29 29 29
Capital Employed 38,888 47,170 54,109 62,661 72,984
Gross Fixed Assets 12,306 13,546 14,546 15,546 16,546
Less: Depreciation 2,400 2,813 3,454 4,155 4,919
Net Fixed Assets 9,906 10,733 11,092 11,391 11,627
Capital WIP 455 997 997 997 997
Investments 7,916 8,290 8,290 8,290 8,290
Current Assets 31,994 39,999 46,989 56,645 68,263
Inventory 8,745 11,736 10,378 12,259 14,408
Debtors 9,890 10,281 10,657 12,451 14,480
Cash & Bank Balance 5,316 5,644 13,616 19,597 27,037
Loans & Advances 7,378 11,095 11,095 11,095 11,095
Other Current Assets 664 1,243 1,243 1,243 1,243
Current Liabilities 11,382 12,850 13,261 14,663 16,194
Creditors 5,234 5,085 5,833 6,814 7,925
Other Liabilities 3,546 4,119 4,119 4,119 4,119
Provisions 2,602 3,646 3,309 3,730 4,150
Net Current Assets 20,612 27,149 33,728 41,982 52,069
Appl. Of fund 38,889 47,169 54,108 62,660 72,983
Source: Company Data, Jefferies estimates
Media
Target | Estimate Change
13 January 2015
page 4 of 23 , Equity Analyst, +91 22 4224 6113, [email protected] Nahar
Please see important disclosure information on pages 19 - 23 of this report.
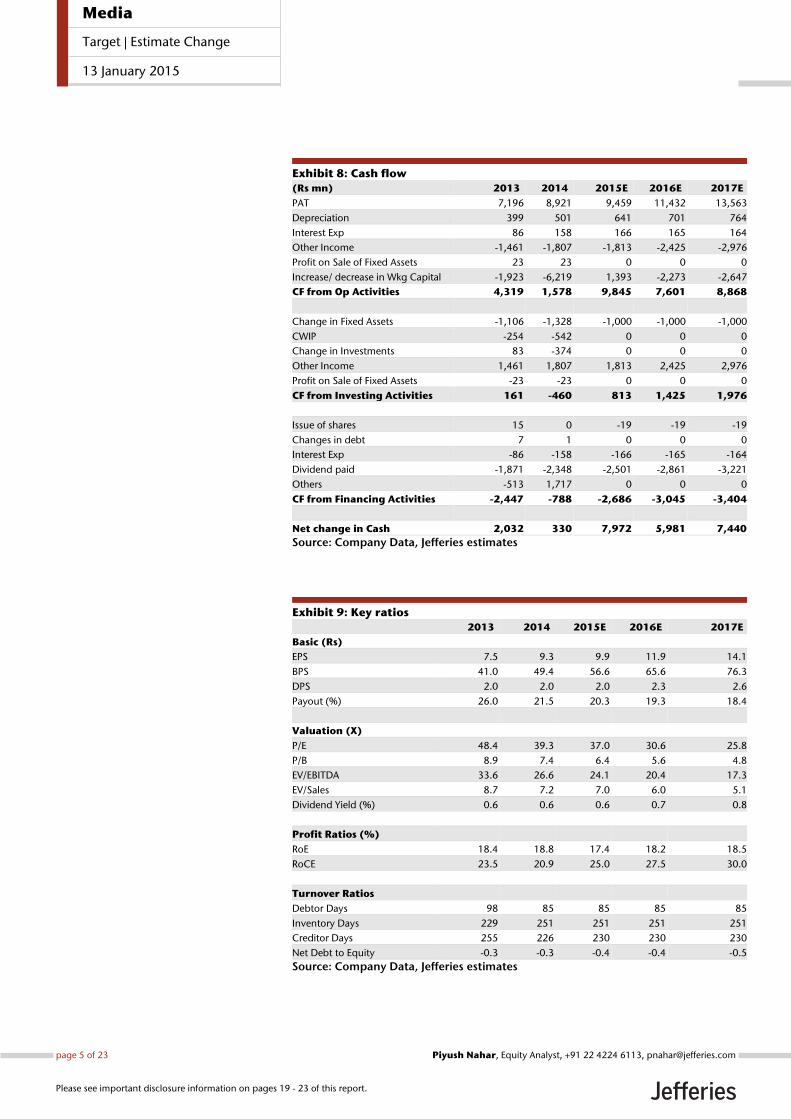
Exhibit 8: Cash flow
(Rs mn) 2013 2014 2015E 2016E 2017E
PAT 7,196 8,921 9,459 11,432 13,563
Depreciation 399 501 641 701 764
Interest Exp 86 158 166 165 164
Other Income -1,461 -1,807 -1,813 -2,425 -2,976
Profit on Sale of Fixed Assets 23 23 0 0 0
Increase/ decrease in Wkg Capital -1,923 -6,219 1,393 -2,273 -2,647
CF from Op Activities 4,319 1,578 9,845 7,601 8,868
Change in Fixed Assets -1,106 -1,328 -1,000 -1,000 -1,000
CWIP -254 -542 0 0 0
Change in Investments 83 -374 0 0 0
Other Income 1,461 1,807 1,813 2,425 2,976
Profit on Sale of Fixed Assets -23 -23 0 0 0
CF from Investing Activities 161 -460 813 1,425 1,976
Issue of shares 15 0 -19 -19 -19
Changes in debt 7 1 0 0 0
Interest Exp -86 -158 -166 -165 -164
Dividend paid -1,871 -2,348 -2,501 -2,861 -3,221
Others -513 1,717 0 0 0
CF from Financing Activities -2,447 -788 -2,686 -3,045 -3,404
Net change in Cash 2,032 330 7,972 5,981 7,440
Source: Company Data, Jefferies estimates
Exhibit 9: Key ratios
2013 2014 2015E 2016E 2017E
Basic (Rs)
EPS 7.5 9.3 9.9 11.9 14.1
BPS 41.0 49.4 56.6 65.6 76.3
DPS 2.0 2.0 2.0 2.3 2.6
Payout (%) 26.0 21.5 20.3 19.3 18.4
Valuation (X)
P/E 48.4 39.3 37.0 30.6 25.8
P/B 8.9 7.4 6.4 5.6 4.8
EV/EBITDA 33.6 26.6 24.1 20.4 17.3
EV/Sales 8.7 7.2 7.0 6.0 5.1
Dividend Yield (%) 0.6 0.6 0.6 0.7 0.8
Profit Ratios (%)
RoE 18.4 18.8 17.4 18.2 18.5
RoCE 23.5 20.9 25.0 27.5 30.0
Turnover Ratios
Debtor Days 98 85 85 85 85
Inventory Days 229 251 251 251 251
Creditor Days 255 226 230 230 230
Net Debt to Equity -0.3 -0.3 -0.4 -0.4 -0.5
Source: Company Data, Jefferies estimates
Media
Target | Estimate Change
13 January 2015
page 5 of 23 , Equity Analyst, +91 22 4224 6113, [email protected] Nahar
Please see important disclosure information on pages 19 - 23 of this report.
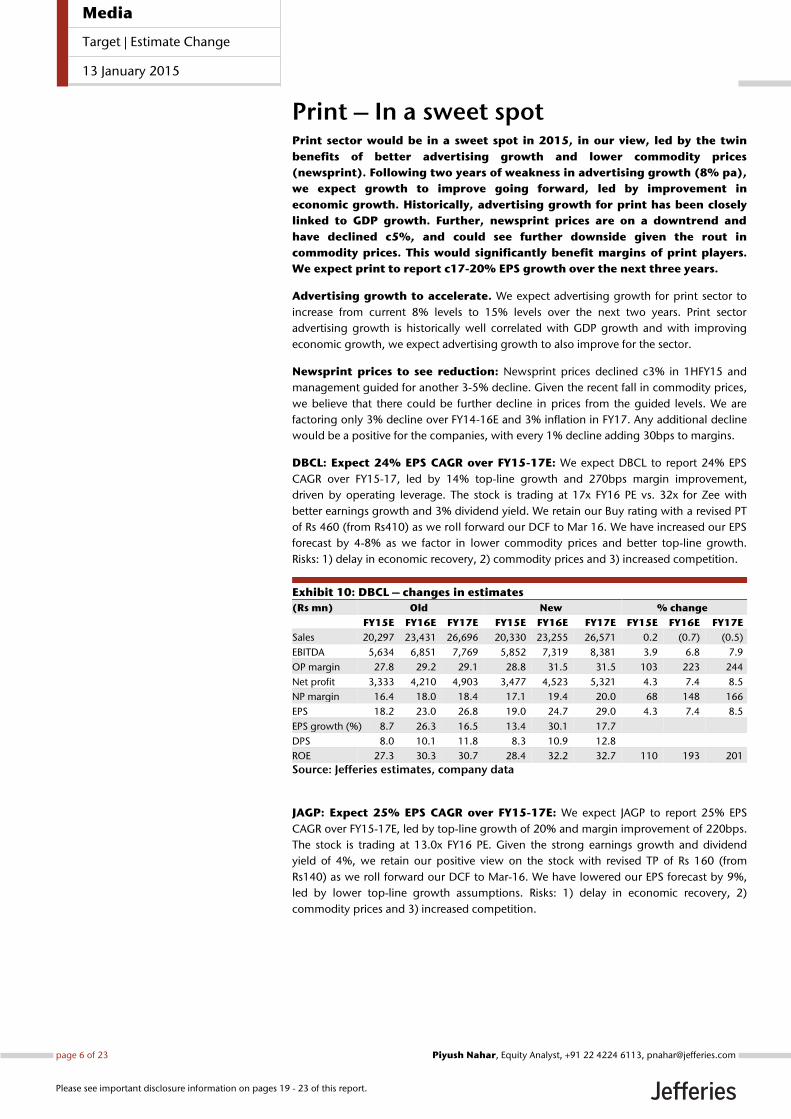
Print – In a sweet spot Print sector would be in a sweet spot in 2015, in our view, led by the twin
benefits of better advertising growth and lower commodity prices
(newsprint). Following two years of weakness in advertising growth (8% pa),
we expect growth to improve going forward, led by improvement in
economic growth. Historically, advertising growth for print has been closely
linked to GDP growth. Further, newsprint prices are on a downtrend and
have declined c5%, and could see further downside given the rout in
commodity prices. This would significantly benefit margins of print players.
We expect print to report c17-20% EPS growth over the next three years.
Advertising growth to accelerate. We expect advertising growth for print sector to
increase from current 8% levels to 15% levels over the next two years. Print sector
advertising growth is historically well correlated with GDP growth and with improving
economic growth, we expect advertising growth to also improve for the sector.
Newsprint prices to see reduction: Newsprint prices declined c3% in 1HFY15 and
management guided for another 3-5% decline. Given the recent fall in commodity prices,
we believe that there could be further decline in prices from the guided levels. We are
factoring only 3% decline over FY14-16E and 3% inflation in FY17. Any additional decline
would be a positive for the companies, with every 1% decline adding 30bps to margins.
DBCL: Expect 24% EPS CAGR over FY15-17E: We expect DBCL to report 24% EPS
CAGR over FY15-17, led by 14% top-line growth and 270bps margin improvement,
driven by operating leverage. The stock is trading at 17x FY16 PE vs. 32x for Zee with
better earnings growth and 3% dividend yield. We retain our Buy rating with a revised PT
of Rs 460 (from Rs410) as we roll forward our DCF to Mar 16. We have increased our EPS
forecast by 4-8% as we factor in lower commodity prices and better top-line growth.
Risks: 1) delay in economic recovery, 2) commodity prices and 3) increased competition.
Exhibit 10: DBCL – changes in estimates
(Rs mn) Old New % change
FY15E FY16E FY17E FY15E FY16E FY17E FY15E FY16E FY17E
Sales 20,297 23,431 26,696 20,330 23,255 26,571 0.2 (0.7) (0.5)
EBITDA 5,634 6,851 7,769 5,852 7,319 8,381 3.9 6.8 7.9
OP margin 27.8 29.2 29.1 28.8 31.5 31.5 103 223 244
Net profit 3,333 4,210 4,903 3,477 4,523 5,321 4.3 7.4 8.5
NP margin 16.4 18.0 18.4 17.1 19.4 20.0 68 148 166
EPS 18.2 23.0 26.8 19.0 24.7 29.0 4.3 7.4 8.5
EPS growth (%) 8.7 26.3 16.5 13.4 30.1 17.7
DPS 8.0 10.1 11.8 8.3 10.9 12.8
ROE 27.3 30.3 30.7 28.4 32.2 32.7 110 193 201
Source: Jefferies estimates, company data
JAGP: Expect 25% EPS CAGR over FY15-17E: We expect JAGP to report 25% EPS
CAGR over FY15-17E, led by top-line growth of 20% and margin improvement of 220bps.
The stock is trading at 13.0x FY16 PE. Given the strong earnings growth and dividend
yield of 4%, we retain our positive view on the stock with revised TP of Rs 160 (from
Rs140) as we roll forward our DCF to Mar-16. We have lowered our EPS forecast by 9%,
led by lower top-line growth assumptions. Risks: 1) delay in economic recovery, 2)
commodity prices and 3) increased competition.
Media
Target | Estimate Change
13 January 2015
page 6 of 23 , Equity Analyst, +91 22 4224 6113, [email protected] Nahar
Please see important disclosure information on pages 19 - 23 of this report.
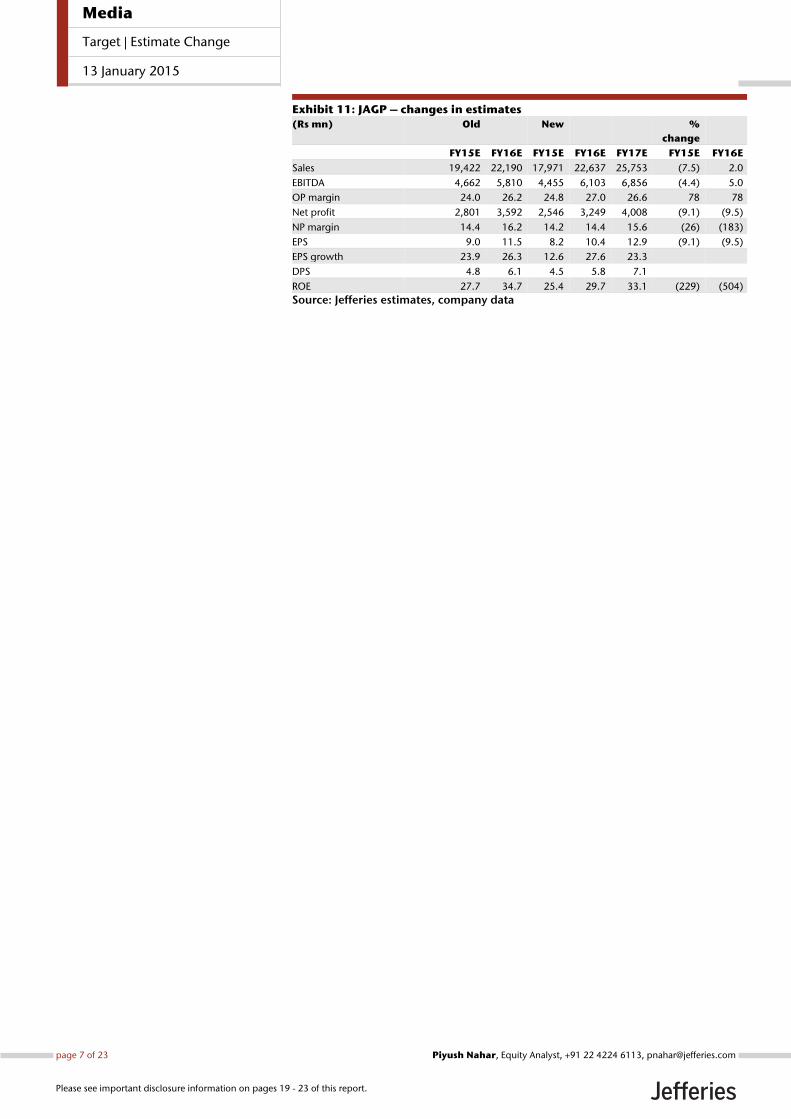
Exhibit 11: JAGP – changes in estimates
(Rs mn) Old New %
change
FY15E FY16E FY15E FY16E FY17E FY15E FY16E
Sales 19,422 22,190 17,971 22,637 25,753 (7.5) 2.0
EBITDA 4,662 5,810 4,455 6,103 6,856 (4.4) 5.0
OP margin 24.0 26.2 24.8 27.0 26.6 78 78
Net profit 2,801 3,592 2,546 3,249 4,008 (9.1) (9.5)
NP margin 14.4 16.2 14.2 14.4 15.6 (26) (183)
EPS 9.0 11.5 8.2 10.4 12.9 (9.1) (9.5)
EPS growth 23.9 26.3 12.6 27.6 23.3
DPS 4.8 6.1 4.5 5.8 7.1
ROE 27.7 34.7 25.4 29.7 33.1 (229) (504)
Source: Jefferies estimates, company data
Media
Target | Estimate Change
13 January 2015
page 7 of 23 , Equity Analyst, +91 22 4224 6113, [email protected] Nahar
Please see important disclosure information on pages 19 - 23 of this report.
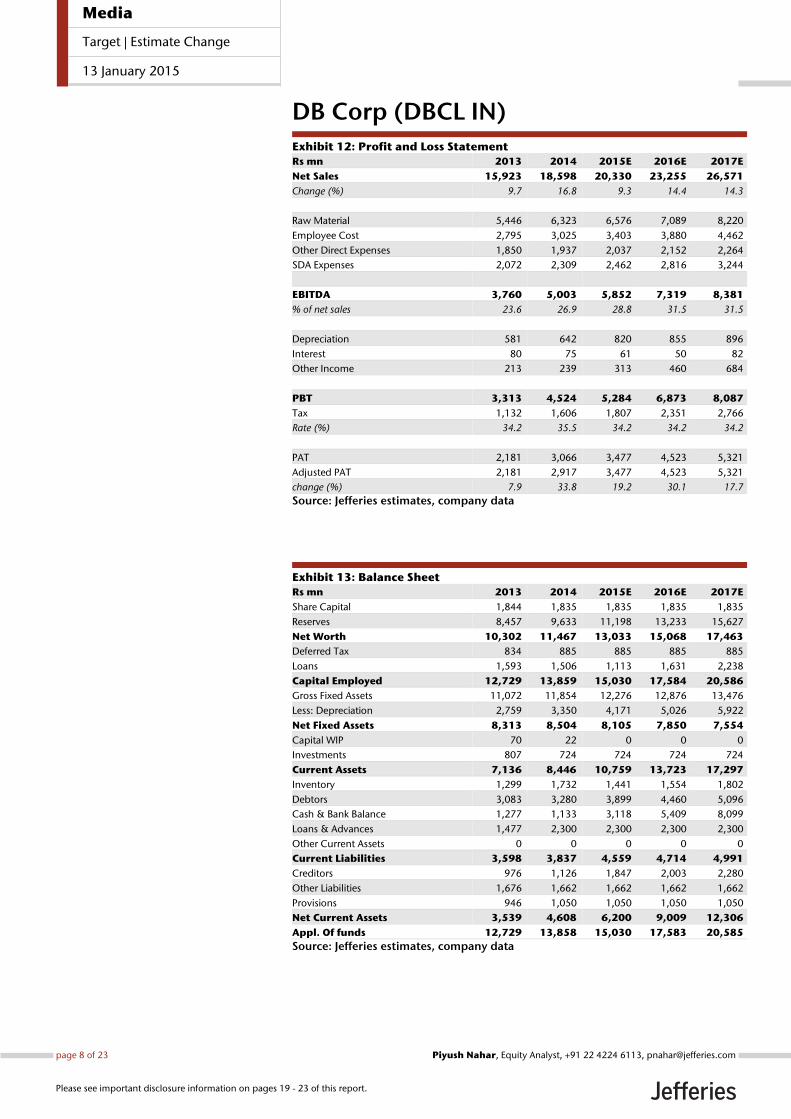
DB Corp (DBCL IN)
Exhibit 12: Profit and Loss Statement
Rs mn 2013 2014 2015E 2016E 2017E
Net Sales 15,923 18,598 20,330 23,255 26,571
Change (%) 9.7 16.8 9.3 14.4 14.3
Raw Material 5,446 6,323 6,576 7,089 8,220
Employee Cost 2,795 3,025 3,403 3,880 4,462
Other Direct Expenses 1,850 1,937 2,037 2,152 2,264
SDA Expenses 2,072 2,309 2,462 2,816 3,244
EBITDA 3,760 5,003 5,852 7,319 8,381
% of net sales 23.6 26.9 28.8 31.5 31.5
Depreciation 581 642 820 855 896
Interest 80 75 61 50 82
Other Income 213 239 313 460 684
PBT 3,313 4,524 5,284 6,873 8,087
Tax 1,132 1,606 1,807 2,351 2,766
Rate (%) 34.2 35.5 34.2 34.2 34.2
PAT 2,181 3,066 3,477 4,523 5,321
Adjusted PAT 2,181 2,917 3,477 4,523 5,321
change (%) 7.9 33.8 19.2 30.1 17.7
Source: Jefferies estimates, company data
Exhibit 13: Balance Sheet
Rs mn 2013 2014 2015E 2016E 2017E
Share Capital 1,844 1,835 1,835 1,835 1,835
Reserves 8,457 9,633 11,198 13,233 15,627
Net Worth 10,302 11,467 13,033 15,068 17,463
Deferred Tax 834 885 885 885 885
Loans 1,593 1,506 1,113 1,631 2,238
Capital Employed 12,729 13,859 15,030 17,584 20,586
Gross Fixed Assets 11,072 11,854 12,276 12,876 13,476
Less: Depreciation 2,759 3,350 4,171 5,026 5,922
Net Fixed Assets 8,313 8,504 8,105 7,850 7,554
Capital WIP 70 22 0 0 0
Investments 807 724 724 724 724
Current Assets 7,136 8,446 10,759 13,723 17,297
Inventory 1,299 1,732 1,441 1,554 1,802
Debtors 3,083 3,280 3,899 4,460 5,096
Cash & Bank Balance 1,277 1,133 3,118 5,409 8,099
Loans & Advances 1,477 2,300 2,300 2,300 2,300
Other Current Assets 0 0 0 0 0
Current Liabilities 3,598 3,837 4,559 4,714 4,991
Creditors 976 1,126 1,847 2,003 2,280
Other Liabilities 1,676 1,662 1,662 1,662 1,662
Provisions 946 1,050 1,050 1,050 1,050
Net Current Assets 3,539 4,608 6,200 9,009 12,306
Appl. Of funds 12,729 13,858 15,030 17,583 20,585
Source: Jefferies estimates, company data
Media
Target | Estimate Change
13 January 2015
page 8 of 23 , Equity Analyst, +91 22 4224 6113, [email protected] Nahar
Please see important disclosure information on pages 19 - 23 of this report.
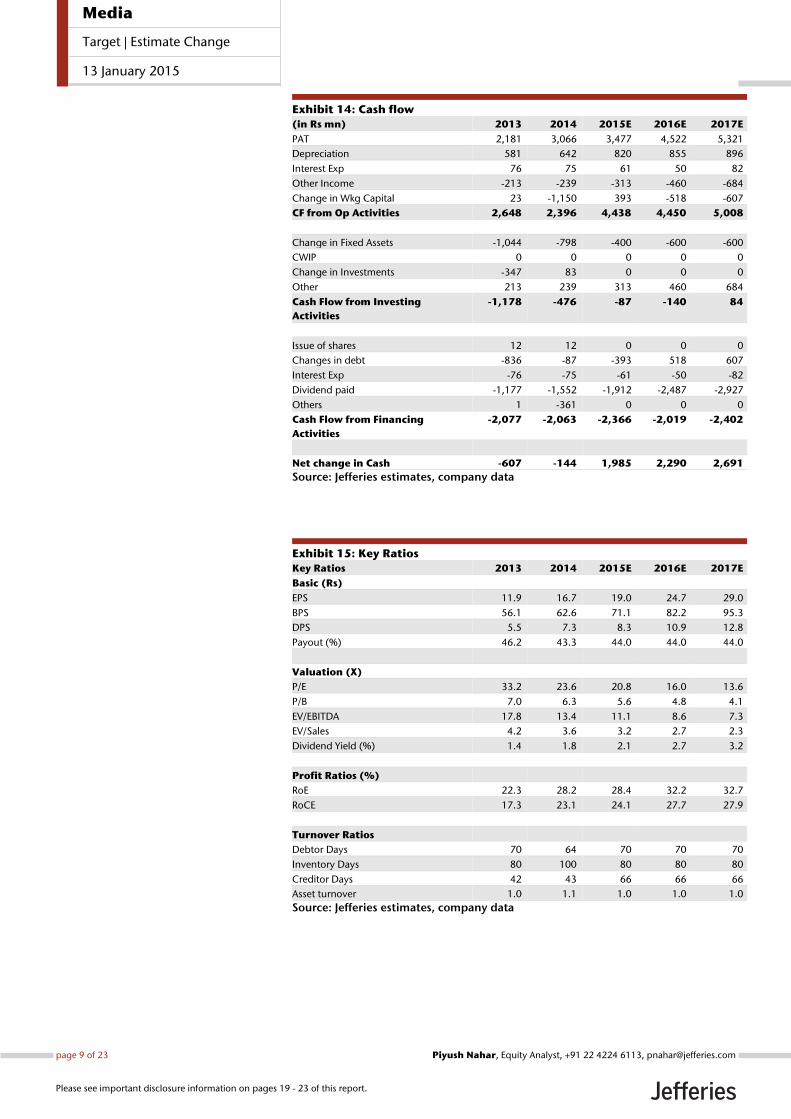
Exhibit 14: Cash flow
(in Rs mn) 2013 2014 2015E 2016E 2017E
PAT 2,181 3,066 3,477 4,522 5,321
Depreciation 581 642 820 855 896
Interest Exp 76 75 61 50 82
Other Income -213 -239 -313 -460 -684
Change in Wkg Capital 23 -1,150 393 -518 -607
CF from Op Activities 2,648 2,396 4,438 4,450 5,008
Change in Fixed Assets -1,044 -798 -400 -600 -600
CWIP 0 0 0 0 0
Change in Investments -347 83 0 0 0
Other 213 239 313 460 684
Cash Flow from Investing
Activities
-1,178 -476 -87 -140 84
Issue of shares 12 12 0 0 0
Changes in debt -836 -87 -393 518 607
Interest Exp -76 -75 -61 -50 -82
Dividend paid -1,177 -1,552 -1,912 -2,487 -2,927
Others 1 -361 0 0 0
Cash Flow from Financing
Activities
-2,077 -2,063 -2,366 -2,019 -2,402
Net change in Cash -607 -144 1,985 2,290 2,691
Source: Jefferies estimates, company data
Exhibit 15: Key Ratios
Key Ratios 2013 2014 2015E 2016E 2017E
Basic (Rs)
EPS 11.9 16.7 19.0 24.7 29.0
BPS 56.1 62.6 71.1 82.2 95.3
DPS 5.5 7.3 8.3 10.9 12.8
Payout (%) 46.2 43.3 44.0 44.0 44.0
Valuation (X)
P/E 33.2 23.6 20.8 16.0 13.6
P/B 7.0 6.3 5.6 4.8 4.1
EV/EBITDA 17.8 13.4 11.1 8.6 7.3
EV/Sales 4.2 3.6 3.2 2.7 2.3
Dividend Yield (%) 1.4 1.8 2.1 2.7 3.2
Profit Ratios (%)
RoE 22.3 28.2 28.4 32.2 32.7
RoCE 17.3 23.1 24.1 27.7 27.9
Turnover Ratios
Debtor Days 70 64 70 70 70
Inventory Days 80 100 80 80 80
Creditor Days 42 43 66 66 66
Asset turnover 1.0 1.1 1.0 1.0 1.0
Source: Jefferies estimates, company data
Media
Target | Estimate Change
13 January 2015
page 9 of 23 , Equity Analyst, +91 22 4224 6113, [email protected] Nahar
Please see important disclosure information on pages 19 - 23 of this report.
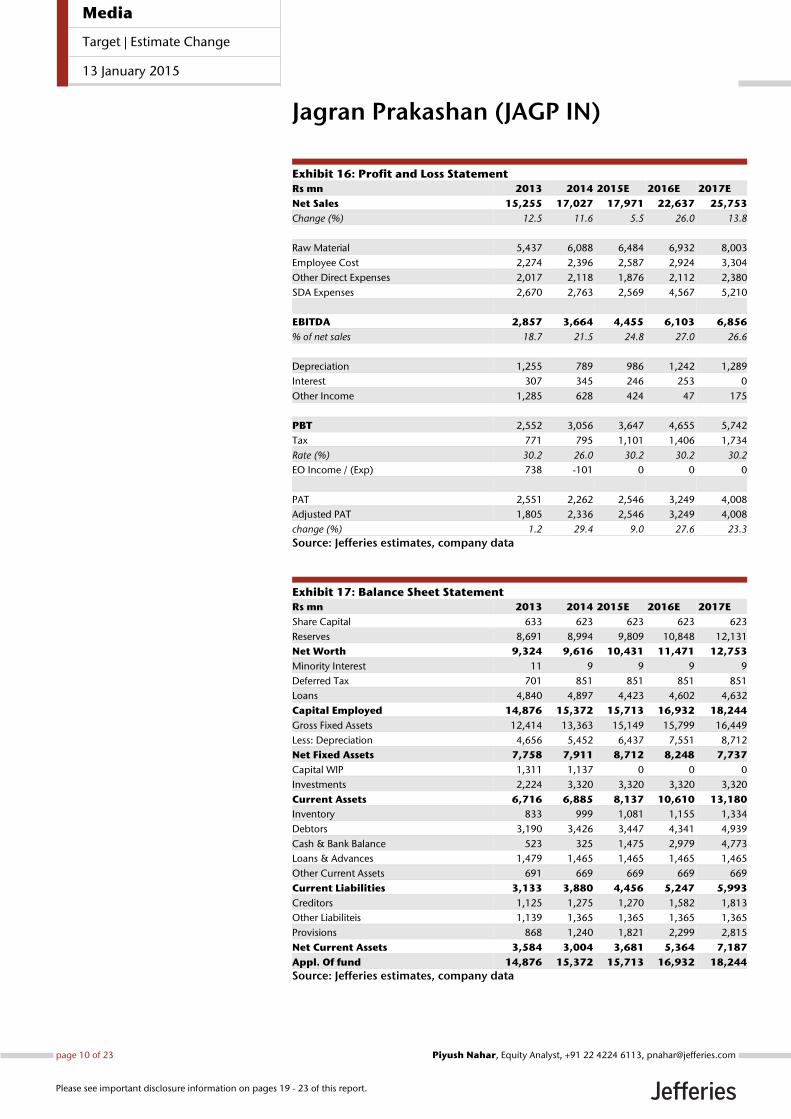
Jagran Prakashan (JAGP IN)
Exhibit 16: Profit and Loss Statement
Rs mn 2013 2014 2015E 2016E 2017E
Net Sales 15,255 17,027 17,971 22,637 25,753
Change (%) 12.5 11.6 5.5 26.0 13.8
Raw Material 5,437 6,088 6,484 6,932 8,003
Employee Cost 2,274 2,396 2,587 2,924 3,304
Other Direct Expenses 2,017 2,118 1,876 2,112 2,380
SDA Expenses 2,670 2,763 2,569 4,567 5,210
EBITDA 2,857 3,664 4,455 6,103 6,856
% of net sales 18.7 21.5 24.8 27.0 26.6
Depreciation 1,255 789 986 1,242 1,289
Interest 307 345 246 253 0
Other Income 1,285 628 424 47 175
PBT 2,552 3,056 3,647 4,655 5,742
Tax 771 795 1,101 1,406 1,734
Rate (%) 30.2 26.0 30.2 30.2 30.2
EO Income / (Exp) 738 -101 0 0 0
PAT 2,551 2,262 2,546 3,249 4,008
Adjusted PAT 1,805 2,336 2,546 3,249 4,008
change (%) 1.2 29.4 9.0 27.6 23.3
Source: Jefferies estimates, company data
Exhibit 17: Balance Sheet Statement
Rs mn 2013 2014 2015E 2016E 2017E
Share Capital 633 623 623 623 623
Reserves 8,691 8,994 9,809 10,848 12,131
Net Worth 9,324 9,616 10,431 11,471 12,753
Minority Interest 11 9 9 9 9
Deferred Tax 701 851 851 851 851
Loans 4,840 4,897 4,423 4,602 4,632
Capital Employed 14,876 15,372 15,713 16,932 18,244
Gross Fixed Assets 12,414 13,363 15,149 15,799 16,449
Less: Depreciation 4,656 5,452 6,437 7,551 8,712
Net Fixed Assets 7,758 7,911 8,712 8,248 7,737
Capital WIP 1,311 1,137 0 0 0
Investments 2,224 3,320 3,320 3,320 3,320
Current Assets 6,716 6,885 8,137 10,610 13,180
Inventory 833 999 1,081 1,155 1,334
Debtors 3,190 3,426 3,447 4,341 4,939
Cash & Bank Balance 523 325 1,475 2,979 4,773
Loans & Advances 1,479 1,465 1,465 1,465 1,465
Other Current Assets 691 669 669 669 669
Current Liabilities 3,133 3,880 4,456 5,247 5,993
Creditors 1,125 1,275 1,270 1,582 1,813
Other Liabiliteis 1,139 1,365 1,365 1,365 1,365
Provisions 868 1,240 1,821 2,299 2,815
Net Current Assets 3,584 3,004 3,681 5,364 7,187
Appl. Of fund 14,876 15,372 15,713 16,932 18,244
Source: Jefferies estimates, company data
Media
Target | Estimate Change
13 January 2015
page 10 of 23 , Equity Analyst, +91 22 4224 6113, [email protected] Nahar
Please see important disclosure information on pages 19 - 23 of this report.
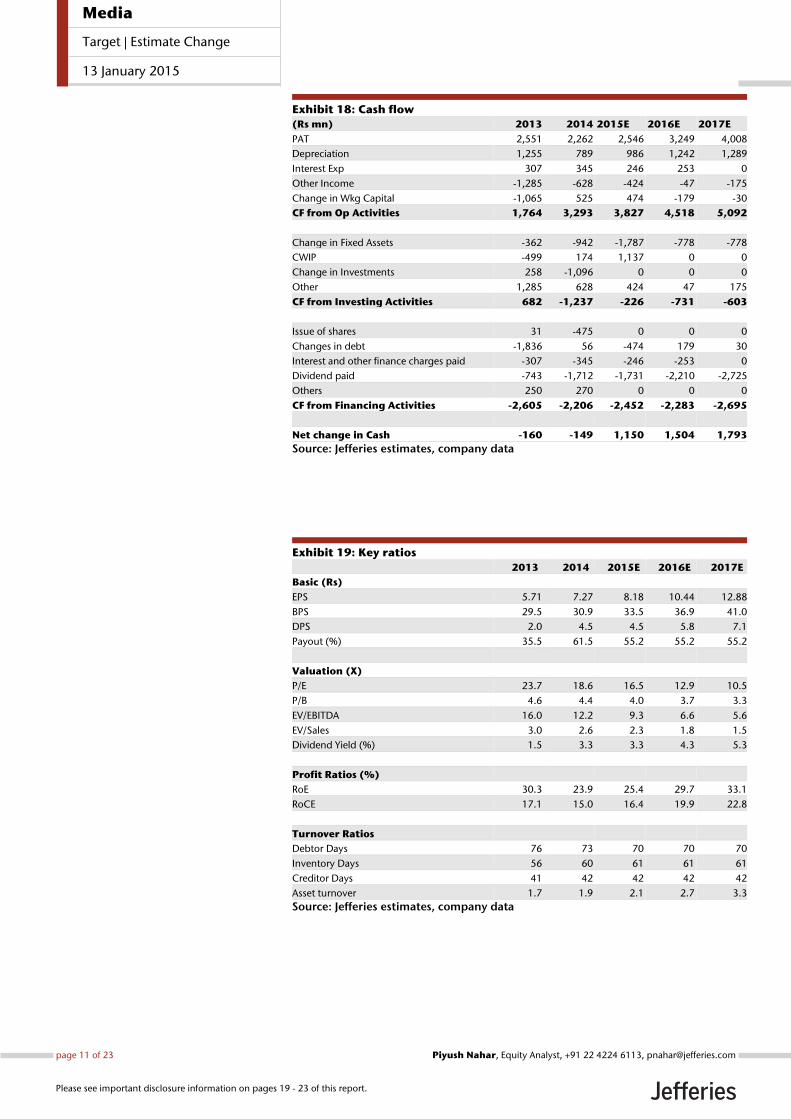
Exhibit 18: Cash flow
(Rs mn) 2013 2014 2015E 2016E 2017E
PAT 2,551 2,262 2,546 3,249 4,008
Depreciation 1,255 789 986 1,242 1,289
Interest Exp 307 345 246 253 0
Other Income -1,285 -628 -424 -47 -175
Change in Wkg Capital -1,065 525 474 -179 -30
CF from Op Activities 1,764 3,293 3,827 4,518 5,092
Change in Fixed Assets -362 -942 -1,787 -778 -778
CWIP -499 174 1,137 0 0
Change in Investments 258 -1,096 0 0 0
Other 1,285 628 424 47 175
CF from Investing Activities 682 -1,237 -226 -731 -603
Issue of shares 31 -475 0 0 0
Changes in debt -1,836 56 -474 179 30
Interest and other finance charges paid -307 -345 -246 -253 0
Dividend paid -743 -1,712 -1,731 -2,210 -2,725
Others 250 270 0 0 0
CF from Financing Activities -2,605 -2,206 -2,452 -2,283 -2,695
Net change in Cash -160 -149 1,150 1,504 1,793
Source: Jefferies estimates, company data
Exhibit 19: Key ratios
2013 2014 2015E 2016E 2017E
Basic (Rs)
EPS 5.71 7.27 8.18 10.44 12.88
BPS 29.5 30.9 33.5 36.9 41.0
DPS 2.0 4.5 4.5 5.8 7.1
Payout (%) 35.5 61.5 55.2 55.2 55.2
Valuation (X)
P/E 23.7 18.6 16.5 12.9 10.5
P/B 4.6 4.4 4.0 3.7 3.3
EV/EBITDA 16.0 12.2 9.3 6.6 5.6
EV/Sales 3.0 2.6 2.3 1.8 1.5
Dividend Yield (%) 1.5 3.3 3.3 4.3 5.3
Profit Ratios (%)
RoE 30.3 23.9 25.4 29.7 33.1
RoCE 17.1 15.0 16.4 19.9 22.8
Turnover Ratios
Debtor Days 76 73 70 70 70
Inventory Days 56 60 61 61 61
Creditor Days 41 42 42 42 42
Asset turnover 1.7 1.9 2.1 2.7 3.3
Source: Jefferies estimates, company data
Media
Target | Estimate Change
13 January 2015
page 11 of 23 , Equity Analyst, +91 22 4224 6113, [email protected] Nahar
Please see important disclosure information on pages 19 - 23 of this report.
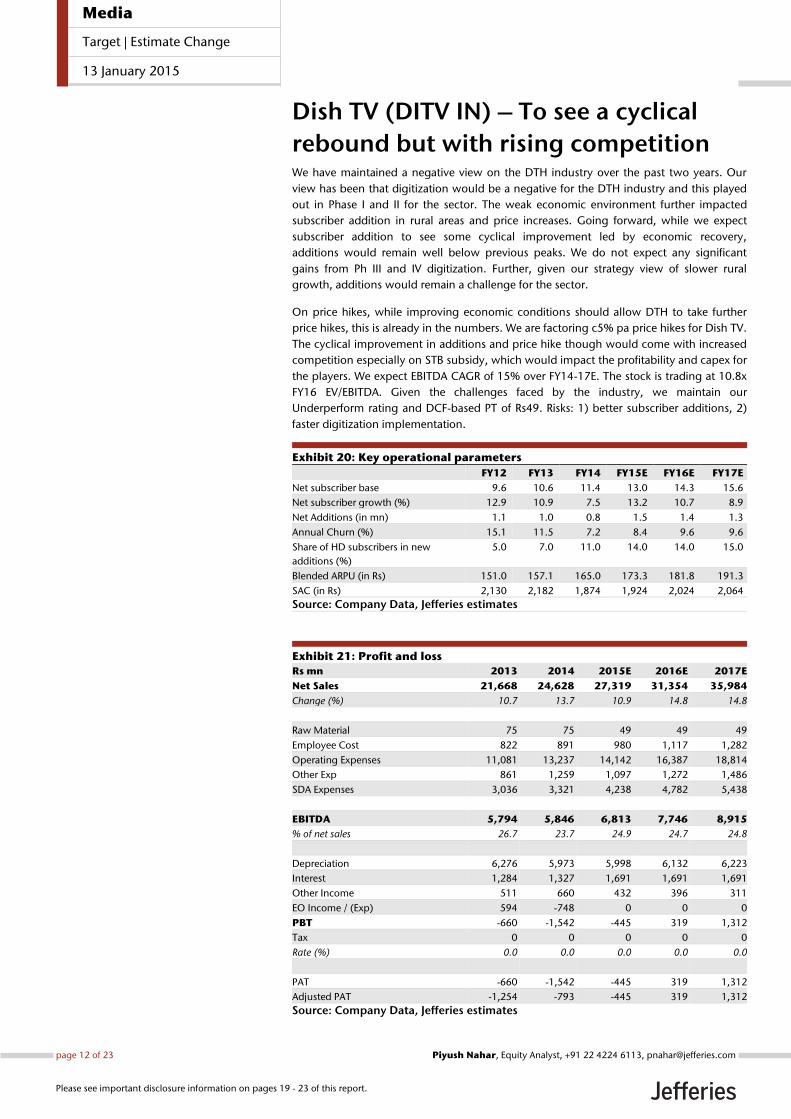
Dish TV (DITV IN) – To see a cyclical
rebound but with rising competition We have maintained a negative view on the DTH industry over the past two years. Our
view has been that digitization would be a negative for the DTH industry and this played
out in Phase I and II for the sector. The weak economic environment further impacted
subscriber addition in rural areas and price increases. Going forward, while we expect
subscriber addition to see some cyclical improvement led by economic recovery,
additions would remain well below previous peaks. We do not expect any significant
gains from Ph III and IV digitization. Further, given our strategy view of slower rural
growth, additions would remain a challenge for the sector.
On price hikes, while improving economic conditions should allow DTH to take further
price hikes, this is already in the numbers. We are factoring c5% pa price hikes for Dish TV.
The cyclical improvement in additions and price hike though would come with increased
competition especially on STB subsidy, which would impact the profitability and capex for
the players. We expect EBITDA CAGR of 15% over FY14-17E. The stock is trading at 10.8x
FY16 EV/EBITDA. Given the challenges faced by the industry, we maintain our
Underperform rating and DCF-based PT of Rs49. Risks: 1) better subscriber additions, 2)
faster digitization implementation.
Exhibit 20: Key operational parameters
FY12 FY13 FY14 FY15E FY16E FY17E
Net subscriber base 9.6 10.6 11.4 13.0 14.3 15.6
Net subscriber growth (%) 12.9 10.9 7.5 13.2 10.7 8.9
Net Additions (in mn) 1.1 1.0 0.8 1.5 1.4 1.3
Annual Churn (%) 15.1 11.5 7.2 8.4 9.6 9.6
Share of HD subscribers in new
additions (%)
5.0 7.0 11.0 14.0 14.0 15.0
Blended ARPU (in Rs) 151.0 157.1 165.0 173.3 181.8 191.3
SAC (in Rs) 2,130 2,182 1,874 1,924 2,024 2,064
Source: Company Data, Jefferies estimates
Exhibit 21: Profit and loss
Rs mn 2013 2014 2015E 2016E 2017E
Net Sales 21,668 24,628 27,319 31,354 35,984
Change (%) 10.7 13.7 10.9 14.8 14.8
Raw Material 75 75 49 49 49
Employee Cost 822 891 980 1,117 1,282
Operating Expenses 11,081 13,237 14,142 16,387 18,814
Other Exp 861 1,259 1,097 1,272 1,486
SDA Expenses 3,036 3,321 4,238 4,782 5,438
EBITDA 5,794 5,846 6,813 7,746 8,915
% of net sales 26.7 23.7 24.9 24.7 24.8
Depreciation 6,276 5,973 5,998 6,132 6,223
Interest 1,284 1,327 1,691 1,691 1,691
Other Income 511 660 432 396 311
EO Income / (Exp) 594 -748 0 0 0
PBT -660 -1,542 -445 319 1,312
Tax 0 0 0 0 0
Rate (%) 0.0 0.0 0.0 0.0 0.0
PAT -660 -1,542 -445 319 1,312
Adjusted PAT -1,254 -793 -445 319 1,312
Source: Company Data, Jefferies estimates
Media
Target | Estimate Change
13 January 2015
page 12 of 23 , Equity Analyst, +91 22 4224 6113, [email protected] Nahar
Please see important disclosure information on pages 19 - 23 of this report.
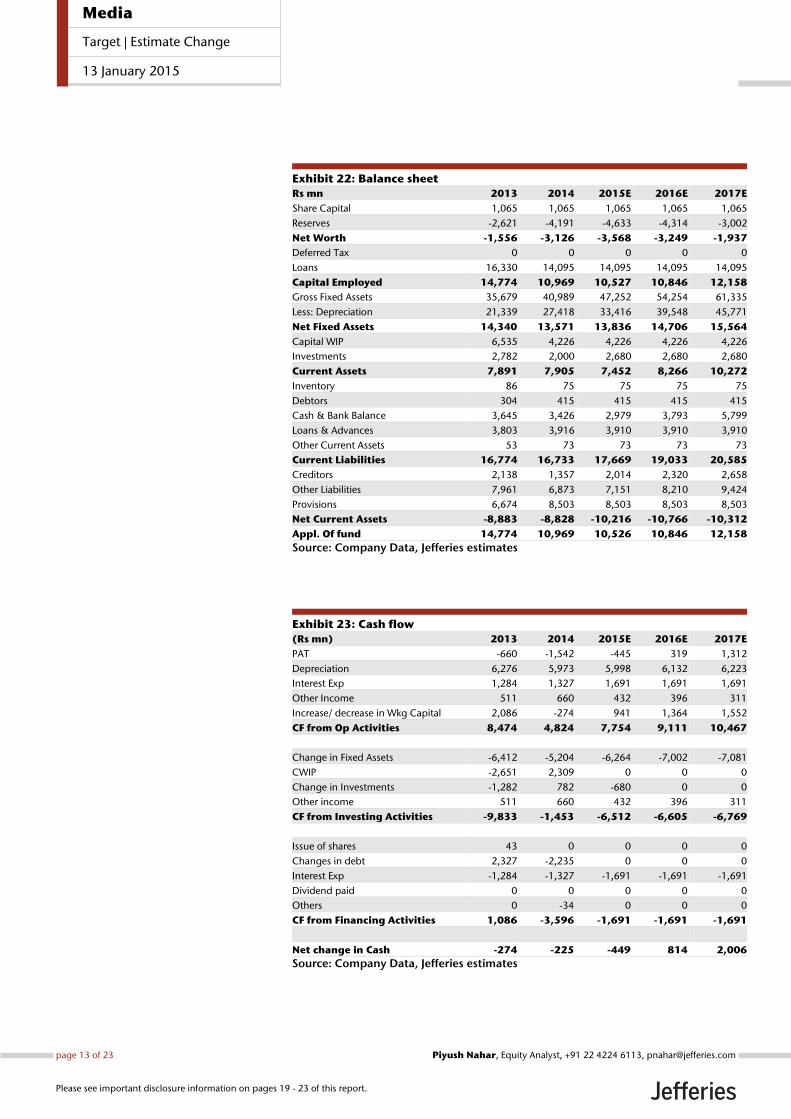
Exhibit 22: Balance sheet
Rs mn 2013 2014 2015E 2016E 2017E
Share Capital 1,065 1,065 1,065 1,065 1,065
Reserves -2,621 -4,191 -4,633 -4,314 -3,002
Net Worth -1,556 -3,126 -3,568 -3,249 -1,937
Deferred Tax 0 0 0 0 0
Loans 16,330 14,095 14,095 14,095 14,095
Capital Employed 14,774 10,969 10,527 10,846 12,158
Gross Fixed Assets 35,679 40,989 47,252 54,254 61,335
Less: Depreciation 21,339 27,418 33,416 39,548 45,771
Net Fixed Assets 14,340 13,571 13,836 14,706 15,564
Capital WIP 6,535 4,226 4,226 4,226 4,226
Investments 2,782 2,000 2,680 2,680 2,680
Current Assets 7,891 7,905 7,452 8,266 10,272
Inventory 86 75 75 75 75
Debtors 304 415 415 415 415
Cash & Bank Balance 3,645 3,426 2,979 3,793 5,799
Loans & Advances 3,803 3,916 3,910 3,910 3,910
Other Current Assets 53 73 73 73 73
Current Liabilities 16,774 16,733 17,669 19,033 20,585
Creditors 2,138 1,357 2,014 2,320 2,658
Other Liabilities 7,961 6,873 7,151 8,210 9,424
Provisions 6,674 8,503 8,503 8,503 8,503
Net Current Assets -8,883 -8,828 -10,216 -10,766 -10,312
Appl. Of fund 14,774 10,969 10,526 10,846 12,158
Source: Company Data, Jefferies estimates
Exhibit 23: Cash flow
(Rs mn) 2013 2014 2015E 2016E 2017E
PAT -660 -1,542 -445 319 1,312
Depreciation 6,276 5,973 5,998 6,132 6,223
Interest Exp 1,284 1,327 1,691 1,691 1,691
Other Income 511 660 432 396 311
Increase/ decrease in Wkg Capital 2,086 -274 941 1,364 1,552
CF from Op Activities 8,474 4,824 7,754 9,111 10,467
Change in Fixed Assets -6,412 -5,204 -6,264 -7,002 -7,081
CWIP -2,651 2,309 0 0 0
Change in Investments -1,282 782 -680 0 0
Other income 511 660 432 396 311
CF from Investing Activities -9,833 -1,453 -6,512 -6,605 -6,769
Issue of shares 43 0 0 0 0
Changes in debt 2,327 -2,235 0 0 0
Interest Exp -1,284 -1,327 -1,691 -1,691 -1,691
Dividend paid 0 0 0 0 0
Others 0 -34 0 0 0
CF from Financing Activities 1,086 -3,596 -1,691 -1,691 -1,691
Net change in Cash -274 -225 -449 814 2,006
Source: Company Data, Jefferies estimates
Media
Target | Estimate Change
13 January 2015
page 13 of 23 , Equity Analyst, +91 22 4224 6113, [email protected] Nahar
Please see important disclosure information on pages 19 - 23 of this report.
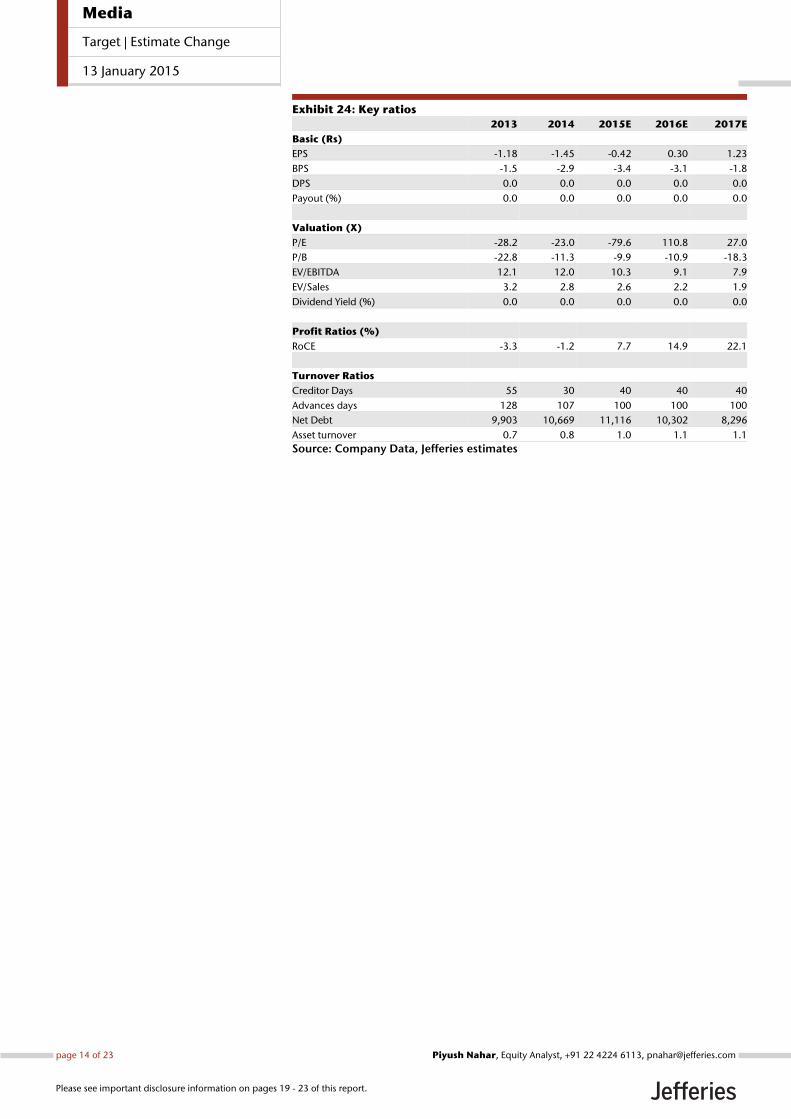
Exhibit 24: Key ratios
2013 2014 2015E 2016E 2017E
Basic (Rs)
EPS -1.18 -1.45 -0.42 0.30 1.23
BPS -1.5 -2.9 -3.4 -3.1 -1.8
DPS 0.0 0.0 0.0 0.0 0.0
Payout (%) 0.0 0.0 0.0 0.0 0.0
Valuation (X)
P/E -28.2 -23.0 -79.6 110.8 27.0
P/B -22.8 -11.3 -9.9 -10.9 -18.3
EV/EBITDA 12.1 12.0 10.3 9.1 7.9
EV/Sales 3.2 2.8 2.6 2.2 1.9
Dividend Yield (%) 0.0 0.0 0.0 0.0 0.0
Profit Ratios (%)
RoCE -3.3 -1.2 7.7 14.9 22.1
Turnover Ratios
Creditor Days 55 30 40 40 40
Advances days 128 107 100 100 100
Net Debt 9,903 10,669 11,116 10,302 8,296
Asset turnover 0.7 0.8 1.0 1.1 1.1
Source: Company Data, Jefferies estimates
Media
Target | Estimate Change
13 January 2015
page 14 of 23 , Equity Analyst, +91 22 4224 6113, [email protected] Nahar
Please see important disclosure information on pages 19 - 23 of this report.
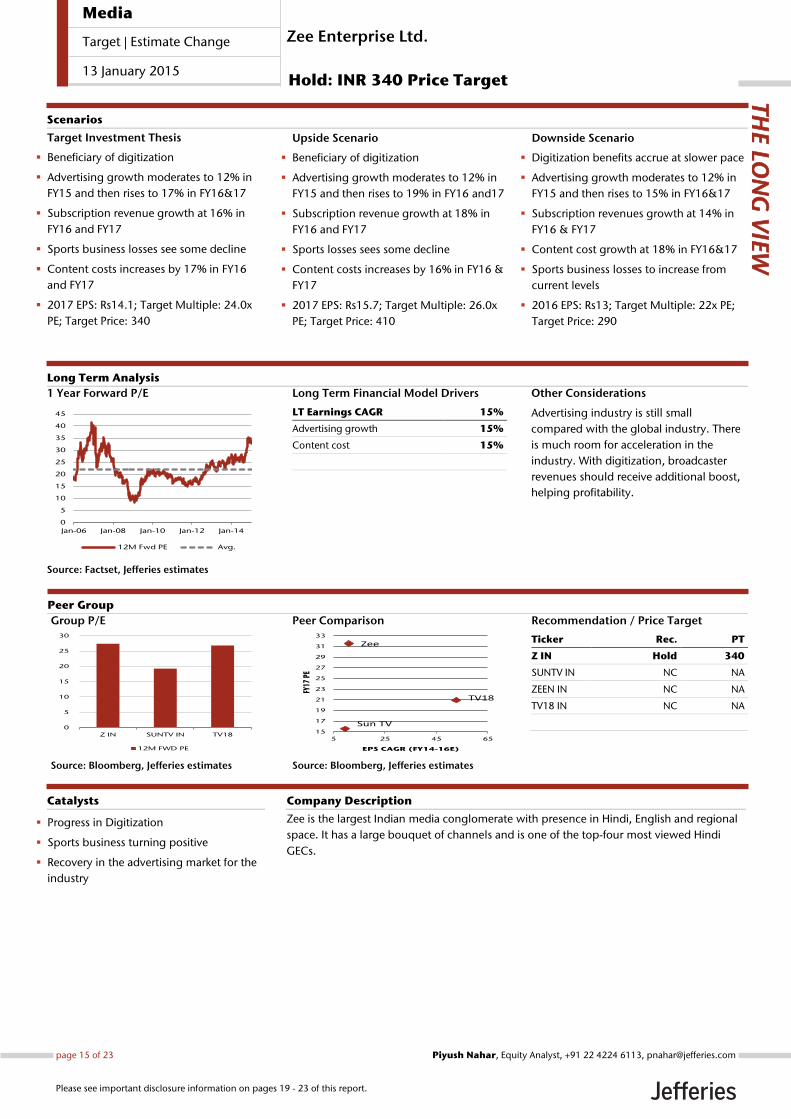
Long Term Financial Model Drivers
LT Earnings CAGR 15%
Advertising growth 15%
Content cost 15%
Other Considerations
Advertising industry is still small
compared with the global industry. There
is much room for acceleration in the
industry. With digitization, broadcaster
revenues should receive additional boost,
helping profitability.
1 Year Forward P/E
Source: Factset, Jefferies estimates
0
5
10
15
20
25
30
35
40
45
Jan-06 Jan-08 Jan-10 Jan-12 Jan-14
12M Fwd PE Avg.
Zee is the largest Indian media conglomerate with presence in Hindi, English and regional
space. It has a large bouquet of channels and is one of the top-four most viewed Hindi
GECs.
Progress in Digitization
Sports business turning positive
Recovery in the advertising market for the
industry
Catalysts
Target Investment Thesis
Beneficiary of digitization
Advertising growth moderates to 12% in
FY15 and then rises to 17% in FY16&17
Subscription revenue growth at 16% in
FY16 and FY17
Sports business losses see some decline
Content costs increases by 17% in FY16
and FY17
2017 EPS: Rs14.1; Target Multiple: 24.0x
PE; Target Price: 340
Upside Scenario
Beneficiary of digitization
Advertising growth moderates to 12% in
FY15 and then rises to 19% in FY16 and17
Subscription revenue growth at 18% in
FY16 and FY17
Sports losses sees some decline
Content costs increases by 16% in FY16 &
FY17
2017 EPS: Rs15.7; Target Multiple: 26.0x
PE; Target Price: 410
Downside Scenario
Digitization benefits accrue at slower pace
Advertising growth moderates to 12% in
FY15 and then rises to 15% in FY16&17
Subscription revenues growth at 14% in
FY16 & FY17
Content cost growth at 18% in FY16&17
Sports business losses to increase from
current levels
2016 EPS: Rs13; Target Multiple: 22x PE;
Target Price: 290
Long Term Analysis
Scenarios
Group P/E
Source: Bloomberg, Jefferies estimates
0
5
10
15
20
25
30
Z IN SUNTV IN TV18
12M FWD PE
Peer Comparison
Source: Bloomberg, Jefferies estimates
Zee
Sun TV
TV18
15
17
19
21
23
25
27
29
31
33
5 25 45 65
FY17
PE
EPS CAGR (FY14-16E)
Recommendation / Price Target
Ticker Rec. PT
Z IN Hold 340
SUNTV IN NC NA
ZEEN IN NC NA
TV18 IN NC NA
Company Description
THE LO
NG
VIE
W
Peer Group
Zee Enterprise Ltd.
Hold: INR 340 Price Target
Media
Target | Estimate Change
13 January 2015
page 15 of 23 , Equity Analyst, +91 22 4224 6113, [email protected] Nahar
Please see important disclosure information on pages 19 - 23 of this report.
Long Term Financial Model Drivers
LT Earnings CAGR 16%
Organic Revenue Growth 11-20%
Operating Margin Expansion 5.0%
Other Considerations
The newspaper industry grows as incomes
and consumption spend increase. With
this, the industry is expected to grow at a
strong 15% rate. Expect Jagran to grow
stronger as its footprint states are seeing
faster growth than the rest of the country,
leading to higher consumption growth
and thus higher ad spend in these
markets.
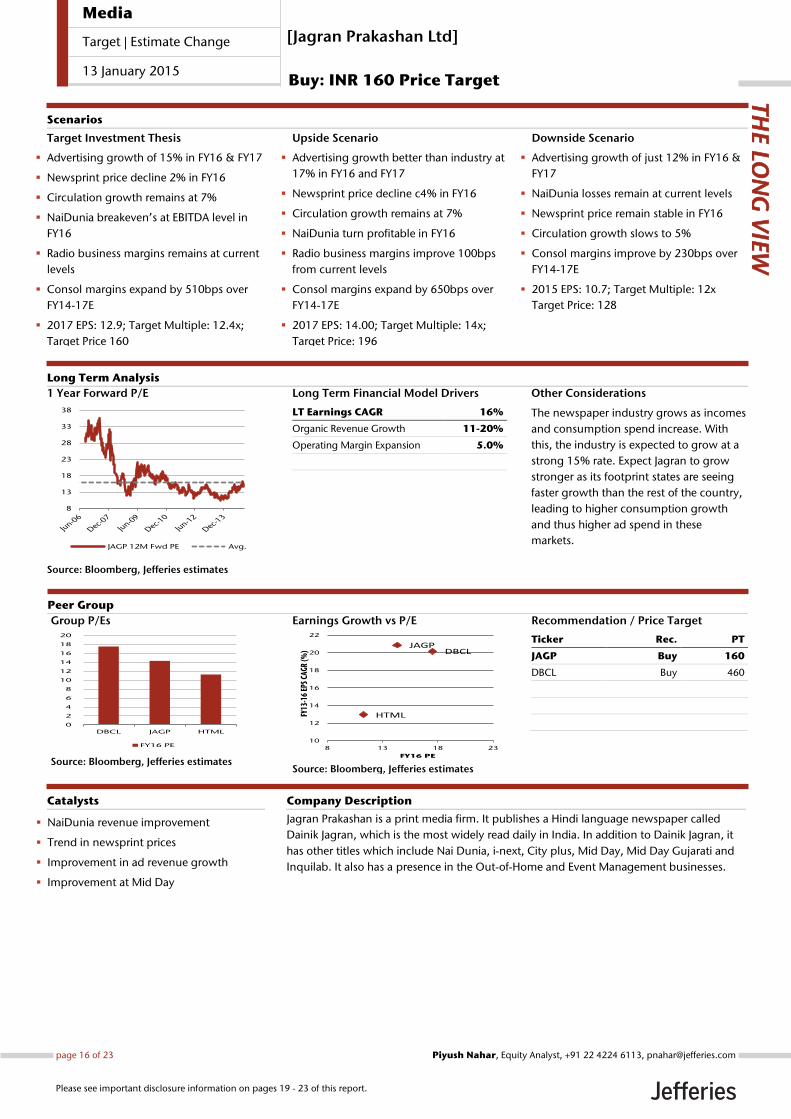
1 Year Forward P/E
Source: Bloomberg, Jefferies estimates
8
13
18
23
28
33
38
JAGP 12M Fwd PE Avg.
Jagran Prakashan is a print media firm. It publishes a Hindi language newspaper called
Dainik Jagran, which is the most widely read daily in India. In addition to Dainik Jagran, it
has other titles which include Nai Dunia, i-next, City plus, Mid Day, Mid Day Gujarati and
Inquilab. It also has a presence in the Out-of-Home and Event Management businesses.
NaiDunia revenue improvement
Trend in newsprint prices
Improvement in ad revenue growth
Improvement at Mid Day
Catalysts
Target Investment Thesis
Advertising growth of 15% in FY16 & FY17
Newsprint price decline 2% in FY16
Circulation growth remains at 7%
NaiDunia breakeven’s at EBITDA level in
FY16
Radio business margins remains at current
levels
Consol margins expand by 510bps over
FY14-17E
2017 EPS: 12.9; Target Multiple: 12.4x;
Target Price 160
Upside Scenario
Advertising growth better than industry at
17% in FY16 and FY17
Newsprint price decline c4% in FY16
Circulation growth remains at 7%
NaiDunia turn profitable in FY16
Radio business margins improve 100bps
from current levels
Consol margins expand by 650bps over
FY14-17E
2017 EPS: 14.00; Target Multiple: 14x;
Target Price: 196
Downside Scenario
Advertising growth of just 12% in FY16 &
FY17
NaiDunia losses remain at current levels
Newsprint price remain stable in FY16
Circulation growth slows to 5%
Consol margins improve by 230bps over
FY14-17E
2015 EPS: 10.7; Target Multiple: 12x
Target Price: 128
Long Term Analysis
Scenarios
Group P/Es
Source: Bloomberg, Jefferies estimates
0
2
4
6
8
10
12
14
16
18
20
DBCL JAGP HTML
FY16 PE
Earnings Growth vs P/E
Source: Bloomberg, Jefferies estimates
DBCLJAGP
HTML
10
12
14
16
18
20
22
8 13 18 23
FY13
-16
EPS
CAGR
(%)
FY16 PE
Recommendation / Price Target
Ticker Rec. PT
JAGP Buy 160
DBCL Buy 460
Company Description
THE LO
NG
VIE
W
Peer Group
[Jagran Prakashan Ltd]
Buy: INR 160 Price Target
Media
Target | Estimate Change
13 January 2015
page 16 of 23 , Equity Analyst, +91 22 4224 6113, [email protected] Nahar
Please see important disclosure information on pages 19 - 23 of this report.
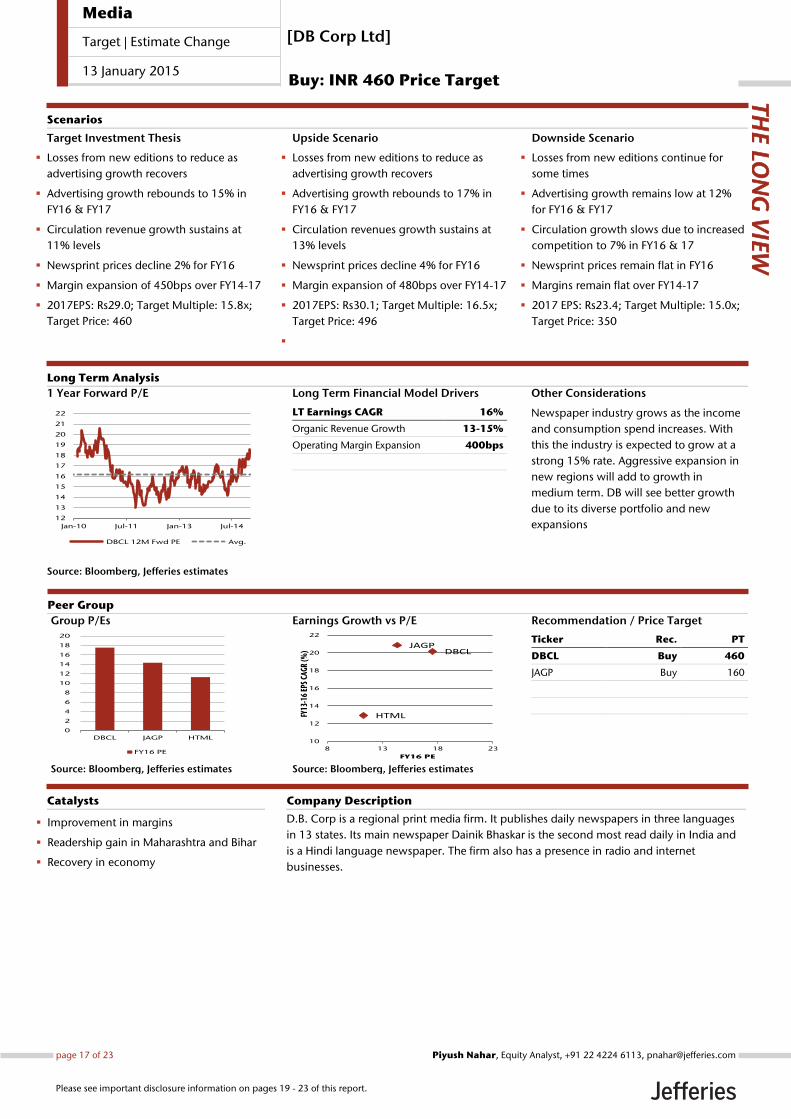
Long Term Financial Model Drivers
LT Earnings CAGR 16%
Organic Revenue Growth 13-15%
Operating Margin Expansion 400bps
Other Considerations
Newspaper industry grows as the income
and consumption spend increases. With
this the industry is expected to grow at a
strong 15% rate. Aggressive expansion in
new regions will add to growth in
medium term. DB will see better growth
due to its diverse portfolio and new
expansions
1 Year Forward P/E
Source: Bloomberg, Jefferies estimates
12
13
14
15
16
17
18
19
20
21
22
Jan-10 Jul-11 Jan-13 Jul-14
DBCL 12M Fwd PE Avg.
D.B. Corp is a regional print media firm. It publishes daily newspapers in three languages
in 13 states. Its main newspaper Dainik Bhaskar is the second most read daily in India and
is a Hindi language newspaper. The firm also has a presence in radio and internet
businesses.
Improvement in margins
Readership gain in Maharashtra and Bihar
Recovery in economy
Catalysts
Target Investment Thesis
Losses from new editions to reduce as
advertising growth recovers
Advertising growth rebounds to 15% in
FY16 & FY17
Circulation revenue growth sustains at
11% levels
Newsprint prices decline 2% for FY16
Margin expansion of 450bps over FY14-17
2017EPS: Rs29.0; Target Multiple: 15.8x;
Target Price: 460
Upside Scenario
Losses from new editions to reduce as
advertising growth recovers
Advertising growth rebounds to 17% in
FY16 & FY17
Circulation revenues growth sustains at
13% levels
Newsprint prices decline 4% for FY16
Margin expansion of 480bps over FY14-17
2017EPS: Rs30.1; Target Multiple: 16.5x;
Target Price: 496
Downside Scenario
Losses from new editions continue for
some times
Advertising growth remains low at 12%
for FY16 & FY17
Circulation growth slows due to increased
competition to 7% in FY16 & 17
Newsprint prices remain flat in FY16
Margins remain flat over FY14-17
2017 EPS: Rs23.4; Target Multiple: 15.0x;
Target Price: 350
Long Term Analysis
Scenarios
Group P/Es
Source: Bloomberg, Jefferies estimates
0
2
4
6
8
10
12
14
16
18
20
DBCL JAGP HTML
FY16 PE
Earnings Growth vs P/E
Source: Bloomberg, Jefferies estimates
DBCLJAGP
HTML
10
12
14
16
18
20
22
8 13 18 23
FY13
-16
EPS
CAGR
(%)
FY16 PE
Recommendation / Price Target
Ticker Rec. PT
DBCL Buy 460
JAGP Buy 160
Company Description
THE LO
NG
VIE
W
Peer Group
[DB Corp Ltd]
Buy: INR 460 Price Target
Media
Target | Estimate Change
13 January 2015
page 17 of 23 , Equity Analyst, +91 22 4224 6113, [email protected] Nahar
Please see important disclosure information on pages 19 - 23 of this report.
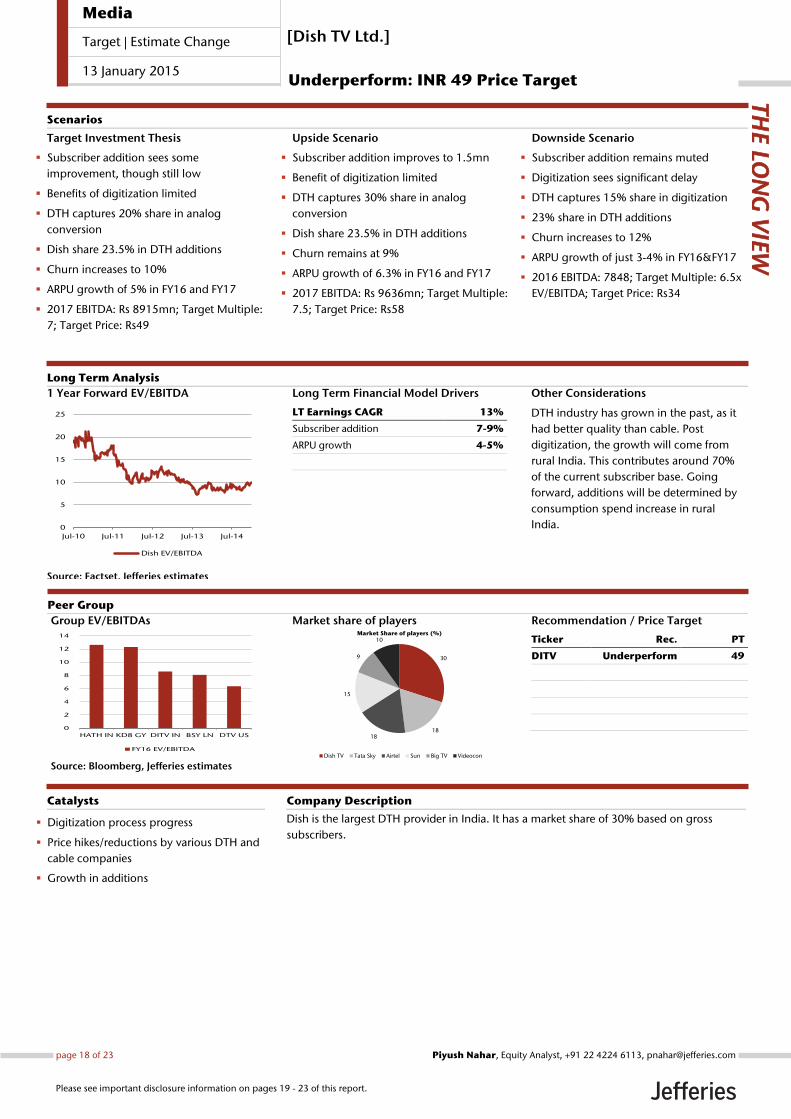
Long Term Financial Model Drivers
LT Earnings CAGR 13%
Subscriber addition 7-9%
ARPU growth 4-5%
Other Considerations
DTH industry has grown in the past, as it
had better quality than cable. Post
digitization, the growth will come from
rural India. This contributes around 70%
of the current subscriber base. Going
forward, additions will be determined by
consumption spend increase in rural
India.
1 Year Forward EV/EBITDA
Source: Factset, Jefferies estimates
0
5
10
15
20
25
Jul-10 Jul-11 Jul-12 Jul-13 Jul-14
Dish EV/EBITDA
Dish is the largest DTH provider in India. It has a market share of 30% based on gross
subscribers. Digitization process progress
Price hikes/reductions by various DTH and
cable companies
Growth in additions
Catalysts
Target Investment Thesis
Subscriber addition sees some
improvement, though still low
Benefits of digitization limited
DTH captures 20% share in analog
conversion
Dish share 23.5% in DTH additions
Churn increases to 10%
ARPU growth of 5% in FY16 and FY17
2017 EBITDA: Rs 8915mn; Target Multiple:
7; Target Price: Rs49
Upside Scenario
Subscriber addition improves to 1.5mn
Benefit of digitization limited
DTH captures 30% share in analog
conversion
Dish share 23.5% in DTH additions
Churn remains at 9%
ARPU growth of 6.3% in FY16 and FY17
2017 EBITDA: Rs 9636mn; Target Multiple:
7.5; Target Price: Rs58
Downside Scenario
Subscriber addition remains muted
Digitization sees significant delay
DTH captures 15% share in digitization
23% share in DTH additions
Churn increases to 12%
ARPU growth of just 3-4% in FY16&FY17
2016 EBITDA: 7848; Target Multiple: 6.5x
EV/EBITDA; Target Price: Rs34
Long Term Analysis
Scenarios
Group EV/EBITDAs
Source: Bloomberg, Jefferies estimates
0
2
4
6
8
10
12
14
HATH IN KD8 GY DITV IN BSY LN DTV US
FY16 EV/EBITDA
Market share of players
30
1818
15
9
10Market Share of players (%)
Dish TV Tata Sky Airtel Sun Big TV Videocon
Recommendation / Price Target
Ticker Rec. PT
DITV Underperform 49
Company Description
THE LO
NG
VIE
W
Peer Group
[Dish TV Ltd.]
Underperform: INR 49 Price Target
Media
Target | Estimate Change
13 January 2015
page 18 of 23 , Equity Analyst, +91 22 4224 6113, [email protected] Nahar
Please see important disclosure information on pages 19 - 23 of this report.
Company DescriptionD.B. Corp is a regional print media firm. It publishes daily newspapers in three languages from 13 states. Its main paper Dainik Bhaskar is thesecond most read daily in India and is a Hindi language paper. The firm in addition has a presence in the Radio and Internet businesses.
Jagran Prakashan is a print media firm. It publishes a Hindi language newspaper under the title Dainik Jagran. Dainik Jagran is the most readdaily in India. In addition to Dainik Jagran it has other titles which include i-next, City plus, Mid-day, Mid-day Gujarati and Inquilab. It alsohas a presence in the Out-of-Home and Event Management business.
Zee produces and develops Hindi films., serials game shows and children’s program. It is one of India’s leading television, media andentertainment companies. It broadcasts channels in Hindi and regional channels in India and across 167 other countries.
Dish TV offers direct broadcast satellite subscription television service in India. It is the largest Direct to Home player in India with 30% marketshare.
Analyst Certification:I, Piyush Nahar, certify that all of the views expressed in this research report accurately reflect my personal views about the subject security(ies) andsubject company(ies). I also certify that no part of my compensation was, is, or will be, directly or indirectly, related to the specific recommendationsor views expressed in this research report.Registration of non-US analysts: Piyush Nahar is employed by Jefferies India Private Limited, a non-US affiliate of Jefferies LLC and is not registered/qualified as a research analyst with FINRA. This analyst(s) may not be an associated person of Jefferies LLC, a FINRA member firm, and therefore maynot be subject to the NASD Rule 2711 and Incorporated NYSE Rule 472 restrictions on communications with a subject company, public appearancesand trading securities held by a research analyst.
As is the case with all Jefferies employees, the analyst(s) responsible for the coverage of the financial instruments discussed in this report receivescompensation based in part on the overall performance of the firm, including investment banking income. We seek to update our research asappropriate, but various regulations may prevent us from doing so. Aside from certain industry reports published on a periodic basis, the large majorityof reports are published at irregular intervals as appropriate in the analyst's judgement.
Meanings of Jefferies RatingsBuy - Describes stocks that we expect to provide a total return (price appreciation plus yield) of 15% or more within a 12-month period.Hold - Describes stocks that we expect to provide a total return (price appreciation plus yield) of plus 15% or minus 10% within a 12-month period.Underperform - Describes stocks that we expect to provide a total negative return (price appreciation plus yield) of 10% or more within a 12-monthperiod.The expected total return (price appreciation plus yield) for Buy rated stocks with an average stock price consistently below $10 is 20% or more withina 12-month period as these companies are typically more volatile than the overall stock market. For Hold rated stocks with an average stock priceconsistently below $10, the expected total return (price appreciation plus yield) is plus or minus 20% within a 12-month period. For Underperformrated stocks with an average stock price consistently below $10, the expected total return (price appreciation plus yield) is minus 20% within a 12-month period.NR - The investment rating and price target have been temporarily suspended. Such suspensions are in compliance with applicable regulations and/or Jefferies policies.CS - Coverage Suspended. Jefferies has suspended coverage of this company.NC - Not covered. Jefferies does not cover this company.Restricted - Describes issuers where, in conjunction with Jefferies engagement in certain transactions, company policy or applicable securitiesregulations prohibit certain types of communications, including investment recommendations.Monitor - Describes stocks whose company fundamentals and financials are being monitored, and for which no financial projections or opinions onthe investment merits of the company are provided.
Valuation MethodologyJefferies' methodology for assigning ratings may include the following: market capitalization, maturity, growth/value, volatility and expected totalreturn over the next 12 months. The price targets are based on several methodologies, which may include, but are not restricted to, analyses of marketrisk, growth rate, revenue stream, discounted cash flow (DCF), EBITDA, EPS, cash flow (CF), free cash flow (FCF), EV/EBITDA, P/E, PE/growth, P/CF,P/FCF, premium (discount)/average group EV/EBITDA, premium (discount)/average group P/E, sum of the parts, net asset value, dividend returns,and return on equity (ROE) over the next 12 months.
Jefferies Franchise PicksJefferies Franchise Picks include stock selections from among the best stock ideas from our equity analysts over a 12 month period. Stock selectionis based on fundamental analysis and may take into account other factors such as analyst conviction, differentiated analysis, a favorable risk/rewardratio and investment themes that Jefferies analysts are recommending. Jefferies Franchise Picks will include only Buy rated stocks and the numbercan vary depending on analyst recommendations for inclusion. Stocks will be added as new opportunities arise and removed when the reason forinclusion changes, the stock has met its desired return, if it is no longer rated Buy and/or if it triggers a stop loss. Stocks having 120 day volatility inthe bottom quartile of S&P stocks will continue to have a 15% stop loss, and the remainder will have a 20% stop. Franchise Picks are not intendedto represent a recommended portfolio of stocks and is not sector based, but we may note where we believe a Pick falls within an investment stylesuch as growth or value.
Media
Target | Estimate Change
13 January 2015
page 19 of 23 , Equity Analyst, +91 22 4224 6113, [email protected] Nahar
Please see important disclosure information on pages 19 - 23 of this report.
Risk which may impede the achievement of our Price TargetThis report was prepared for general circulation and does not provide investment recommendations specific to individual investors. As such, thefinancial instruments discussed in this report may not be suitable for all investors and investors must make their own investment decisions basedupon their specific investment objectives and financial situation utilizing their own financial advisors as they deem necessary. Past performance ofthe financial instruments recommended in this report should not be taken as an indication or guarantee of future results. The price, value of, andincome from, any of the financial instruments mentioned in this report can rise as well as fall and may be affected by changes in economic, financialand political factors. If a financial instrument is denominated in a currency other than the investor's home currency, a change in exchange rates mayadversely affect the price of, value of, or income derived from the financial instrument described in this report. In addition, investors in securities suchas ADRs, whose values are affected by the currency of the underlying security, effectively assume currency risk.
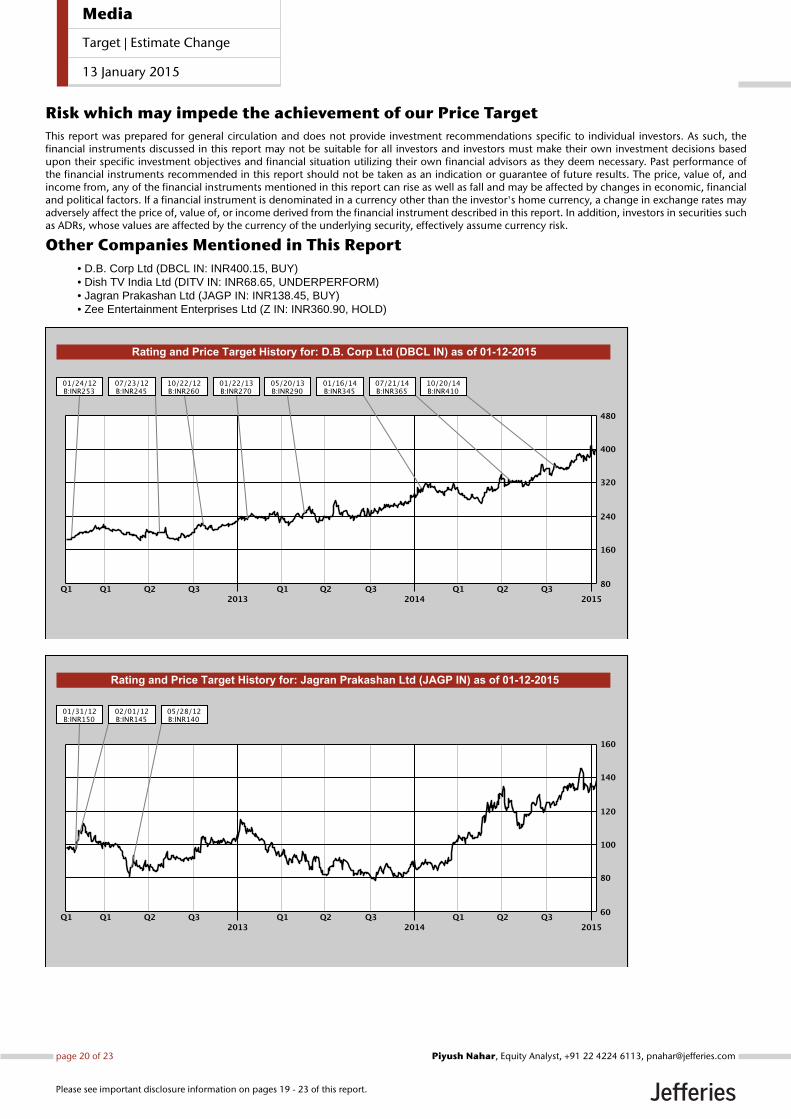
Other Companies Mentioned in This Report• D.B. Corp Ltd (DBCL IN: INR400.15, BUY)• Dish TV India Ltd (DITV IN: INR68.65, UNDERPERFORM)• Jagran Prakashan Ltd (JAGP IN: INR138.45, BUY)• Zee Entertainment Enterprises Ltd (Z IN: INR360.90, HOLD)
Media
Target | Estimate Change
13 January 2015
page 20 of 23 , Equity Analyst, +91 22 4224 6113, [email protected] Nahar
Please see important disclosure information on pages 19 - 23 of this report.
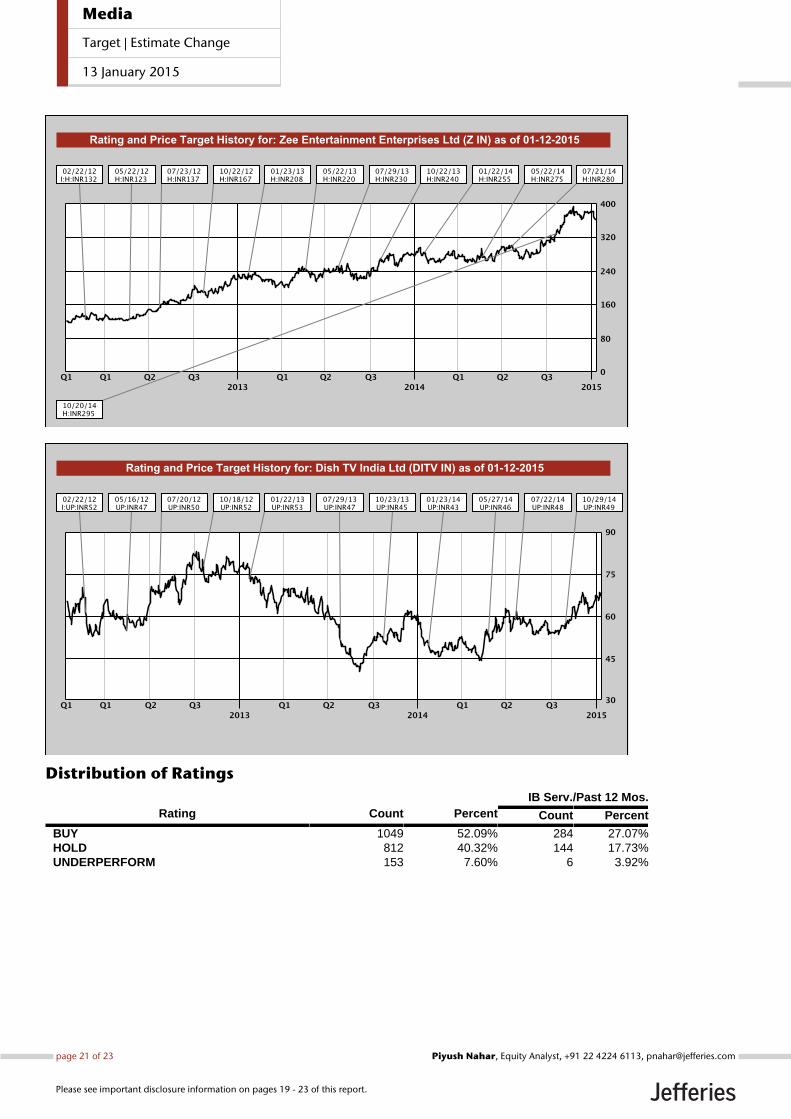
Distribution of RatingsIB Serv./Past 12 Mos.
Rating Count Percent Count Percent
BUY 1049 52.09% 284 27.07%HOLD 812 40.32% 144 17.73%UNDERPERFORM 153 7.60% 6 3.92%
Media
Target | Estimate Change
13 January 2015
page 21 of 23 , Equity Analyst, +91 22 4224 6113, [email protected] Nahar
Please see important disclosure information on pages 19 - 23 of this report.
Other Important Disclosures
Jefferies Equity Research refers to research reports produced by analysts employed by one of the following Jefferies Group LLC (“Jefferies”) groupcompanies:
United States: Jefferies LLC which is an SEC registered firm and a member of FINRA.
United Kingdom: Jefferies International Limited, which is authorized and regulated by the Financial Conduct Authority; registered in England andWales No. 1978621; registered office: Vintners Place, 68 Upper Thames Street, London EC4V 3BJ; telephone +44 (0)20 7029 8000; facsimile +44 (0)207029 8010.
Hong Kong: Jefferies Hong Kong Limited, which is licensed by the Securities and Futures Commission of Hong Kong with CE number ATS546; locatedat Suite 2201, 22nd Floor, Cheung Kong Center, 2 Queen’s Road Central, Hong Kong.
Singapore: Jefferies Singapore Limited, which is licensed by the Monetary Authority of Singapore; located at 80 Raffles Place #15-20, UOB Plaza 2,Singapore 048624, telephone: +65 6551 3950.
Japan: Jefferies (Japan) Limited, Tokyo Branch, which is a securities company registered by the Financial Services Agency of Japan and is a memberof the Japan Securities Dealers Association; located at Hibiya Marine Bldg, 3F, 1-5-1 Yuraku-cho, Chiyoda-ku, Tokyo 100-0006; telephone +813 52516100; facsimile +813 5251 6101.
India: Jefferies India Private Limited (CIN - U74140MH2007PTC200509), which is licensed by the Securities and Exchange Board of India as a MerchantBanker (INM000011443) and a Stock Broker with Bombay Stock Exchange Limited (INB011491033) and National Stock Exchange of India Limited(INB231491037) in the Capital Market Segment; located at 42/43, 2 North Avenue, Maker Maxity, Bandra-Kurla Complex, Bandra (East) Mumbai 400051, India; Tel +91 22 4356 6000.
This material has been prepared by Jefferies employing appropriate expertise, and in the belief that it is fair and not misleading. The information setforth herein was obtained from sources believed to be reliable, but has not been independently verified by Jefferies. Therefore, except for any obligationunder applicable rules we do not guarantee its accuracy. Additional and supporting information is available upon request. Unless prohibited by theprovisions of Regulation S of the U.S. Securities Act of 1933, this material is distributed in the United States ("US"), by Jefferies LLC, a US-registeredbroker-dealer, which accepts responsibility for its contents in accordance with the provisions of Rule 15a-6, under the US Securities Exchange Act of1934. Transactions by or on behalf of any US person may only be effected through Jefferies LLC. In the United Kingdom and European EconomicArea this report is issued and/or approved for distribution by Jefferies International Limited and is intended for use only by persons who have, or havebeen assessed as having, suitable professional experience and expertise, or by persons to whom it can be otherwise lawfully distributed. JefferiesInternational Limited has adopted a conflicts management policy in connection with the preparation and publication of research, the details of whichare available upon request in writing to the Compliance Officer. Jefferies International Limited may allow its analysts to undertake private consultancywork. Jefferies International Limited’s conflicts management policy sets out the arrangements Jefferies International Limited employs to manage anypotential conflicts of interest that may arise as a result of such consultancy work. For Canadian investors, this material is intended for use only byprofessional or institutional investors. None of the investments or investment services mentioned or described herein is available to other personsor to anyone in Canada who is not a "Designated Institution" as defined by the Securities Act (Ontario). In Singapore, Jefferies Singapore Limited isregulated by the Monetary Authority of Singapore. For investors in the Republic of Singapore, this material is provided by Jefferies Singapore Limitedpursuant to Regulation 32C of the Financial Advisers Regulations. The material contained in this document is intended solely for accredited, expert orinstitutional investors, as defined under the Securities and Futures Act (Cap. 289 of Singapore). If there are any matters arising from, or in connectionwith this material, please contact Jefferies Singapore Limited, located at 80 Raffles Place #15-20, UOB Plaza 2, Singapore 048624, telephone: +656551 3950. In Japan this material is issued and distributed by Jefferies (Japan) Limited to institutional investors only. In Hong Kong, this report isissued and approved by Jefferies Hong Kong Limited and is intended for use only by professional investors as defined in the Hong Kong Securities andFutures Ordinance and its subsidiary legislation. In the Republic of China (Taiwan), this report should not be distributed. The research in relation tothis report is conducted outside the PRC. This report does not constitute an offer to sell or the solicitation of an offer to buy any securities in the PRC.PRC investors shall have the relevant qualifications to invest in such securities and shall be responsible for obtaining all relevant approvals, licenses,verifications and/or registrations from the relevant governmental authorities themselves. In India this report is made available by Jefferies India PrivateLimited. In Australia this information is issued solely by Jefferies International Limited and is directed solely at wholesale clients within the meaning ofthe Corporations Act 2001 of Australia (the "Act") in connection with their consideration of any investment or investment service that is the subject ofthis document. Any offer or issue that is the subject of this document does not require, and this document is not, a disclosure document or productdisclosure statement within the meaning of the Act. Jefferies International Limited is authorised and regulated by the Financial Conduct Authorityunder the laws of the United Kingdom, which differ from Australian laws. Jefferies International Limited has obtained relief under Australian Securitiesand Investments Commission Class Order 03/1099, which conditionally exempts it from holding an Australian financial services licence under theAct in respect of the provision of certain financial services to wholesale clients. Recipients of this document in any other jurisdictions should informthemselves about and observe any applicable legal requirements in relation to the receipt of this document.
This report is not an offer or solicitation of an offer to buy or sell any security or derivative instrument, or to make any investment. Any opinion orestimate constitutes the preparer's best judgment as of the date of preparation, and is subject to change without notice. Jefferies assumes no obligationto maintain or update this report based on subsequent information and events. Jefferies, its associates or affiliates, and its respective officers, directors,and employees may have long or short positions in, or may buy or sell any of the securities, derivative instruments or other investments mentioned ordescribed herein, either as agent or as principal for their own account. Upon request Jefferies may provide specialized research products or servicesto certain customers focusing on the prospects for individual covered stocks as compared to other covered stocks over varying time horizons orunder differing market conditions. While the views expressed in these situations may not always be directionally consistent with the long-term viewsexpressed in the analyst's published research, the analyst has a reasonable basis and any inconsistencies can be reasonably explained. This materialdoes not constitute a personal recommendation or take into account the particular investment objectives, financial situations, or needs of individualclients. Clients should consider whether any advice or recommendation in this report is suitable for their particular circumstances and, if appropriate,seek professional advice, including tax advice. The price and value of the investments referred to herein and the income from them may fluctuate. Pastperformance is not a guide to future performance, future returns are not guaranteed, and a loss of original capital may occur. Fluctuations in exchangerates could have adverse effects on the value or price of, or income derived from, certain investments. This report has been prepared independently ofany issuer of securities mentioned herein and not in connection with any proposed offering of securities or as agent of any issuer of securities. Noneof Jefferies, any of its affiliates or its research analysts has any authority whatsoever to make any representations or warranty on behalf of the issuer(s).Jefferies policy prohibits research personnel from disclosing a recommendation, investment rating, or investment thesis for review by an issuer prior
Media
Target | Estimate Change
13 January 2015
page 22 of 23 , Equity Analyst, +91 22 4224 6113, [email protected] Nahar
Please see important disclosure information on pages 19 - 23 of this report.
to the publication of a research report containing such rating, recommendation or investment thesis. Any comments or statements made herein arethose of the author(s) and may differ from the views of Jefferies.
This report may contain information obtained from third parties, including ratings from credit ratings agencies such as Standard & Poor’s. Reproductionand distribution of third party content in any form is prohibited except with the prior written permission of the related third party. Third party contentproviders do not guarantee the accuracy, completeness, timeliness or availability of any information, including ratings, and are not responsible forany errors or omissions (negligent or otherwise), regardless of the cause, or for the results obtained from the use of such content. Third party contentproviders give no express or implied warranties, including, but not limited to, any warranties of merchantability or fitness for a particular purpose oruse. Third party content providers shall not be liable for any direct, indirect, incidental, exemplary, compensatory, punitive, special or consequentialdamages, costs, expenses, legal fees, or losses (including lost income or profits and opportunity costs) in connection with any use of their content,including ratings. Credit ratings are statements of opinions and are not statements of fact or recommendations to purchase, hold or sell securities. Theydo not address the suitability of securities or the suitability of securities for investment purposes, and should not be relied on as investment advice.
Jefferies research reports are disseminated and available primarily electronically, and, in some cases, in printed form. Electronic research issimultaneously available to all clients. This report or any portion hereof may not be reprinted, sold or redistributed without the written consent ofJefferies. Neither Jefferies nor any officer nor employee of Jefferies accepts any liability whatsoever for any direct, indirect or consequential damagesor losses arising from any use of this report or its contents.
For Important Disclosure information, please visit our website at https://javatar.bluematrix.com/sellside/Disclosures.action or call 1.888.JEFFERIES
© 2015 Jefferies Group LLC
Media
Target | Estimate Change
13 January 2015
page 23 of 23 , Equity Analyst, +91 22 4224 6113, [email protected] Nahar
Please see important disclosure information on pages 19 - 23 of this report.