Embed Size (px)
Citation preview

Investor PresentationMay - 2018

2
Safe Harbor
No representation or warranty, express or implied is made as to, and no relianceshould be placed on, the fairness, accuracy, completeness or correctness of suchinformation or opinions contained herein. The information contained in thispresentation is only current as of its date. Certain statements made in thispresentation may not be based on historical information or facts and may be “forwardlooking statements”, including those relating to the Company’s general business plansand strategy, its future financial condition and growth prospects, and futuredevelopments in its industry and its competitive and regulatory environment. Actualresults may differ materially from these forward-looking statements due to a numberof factors, including future changes or developments in the Company’s business, itscompetitive environment and political, economic, legal and social conditions in India.This communication is for general information purpose only, without regard tospecific objectives, financial situations and needs of any particular person. Thispresentation does not constitute an offer or invitation to purchase or subscribe forany shares in the Company and neither any part of it shall form the basis of or berelied upon in connection with any contract or commitment whatsoever. TheCompany may alter, modify or otherwise change in any manner the content of thispresentation, without obligation to notify any person of such revision or changes. Thispresentation can not be copied and/or disseminated in any manner.

3
Contents
About Us
Q4 FY18 Highlights
Performance Matrix
Next Generation Bank
An Inflection Point
Business Strategy
4
Q4 FY18 Highlights

5
We have ‘Zero’ accounts in our watchlist of Large Corporate Loan Book
FY18 Advances growth at ~17%
Retail (excluding Gold), SME and Agriculture Loan book growth at ~20%
Increase of ~23% YoY in Transaction Fee and Technologyincome for FY18
Financial Results in line with guidance
Key Highlights
6
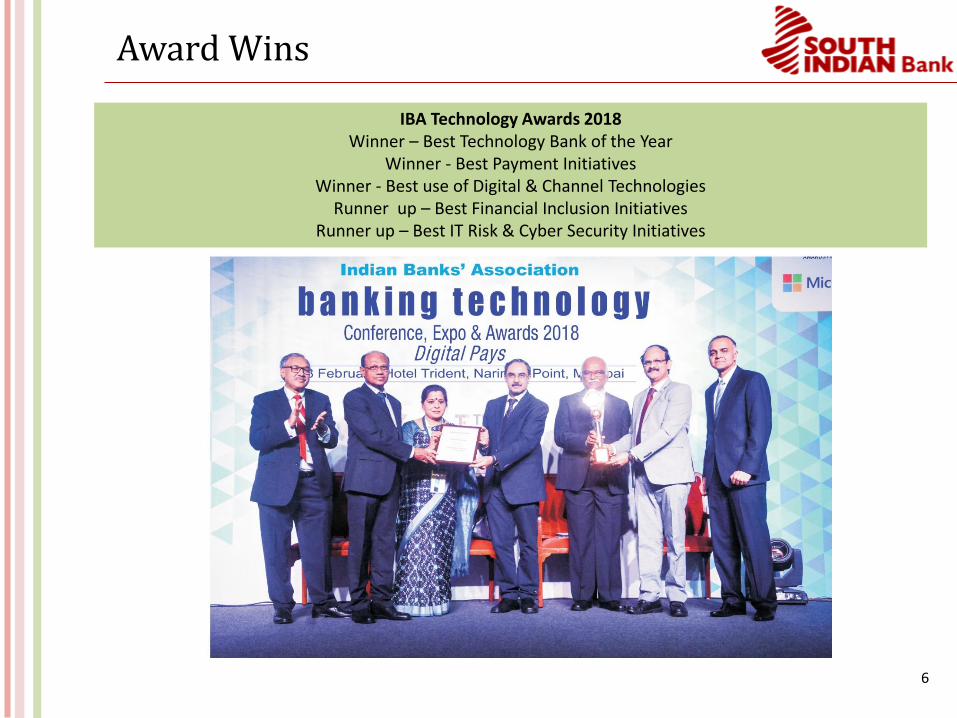
Award Wins
IBA Technology Awards 2018Winner – Best Technology Bank of the Year
Winner - Best Payment Initiatives Winner - Best use of Digital & Channel Technologies
Runner up – Best Financial Inclusion InitiativesRunner up – Best IT Risk & Cyber Security Initiatives

7
Award Wins
ASSOCHAM - Won Social Banking Excellence Award 2017
(Priority Sector Lending)
8
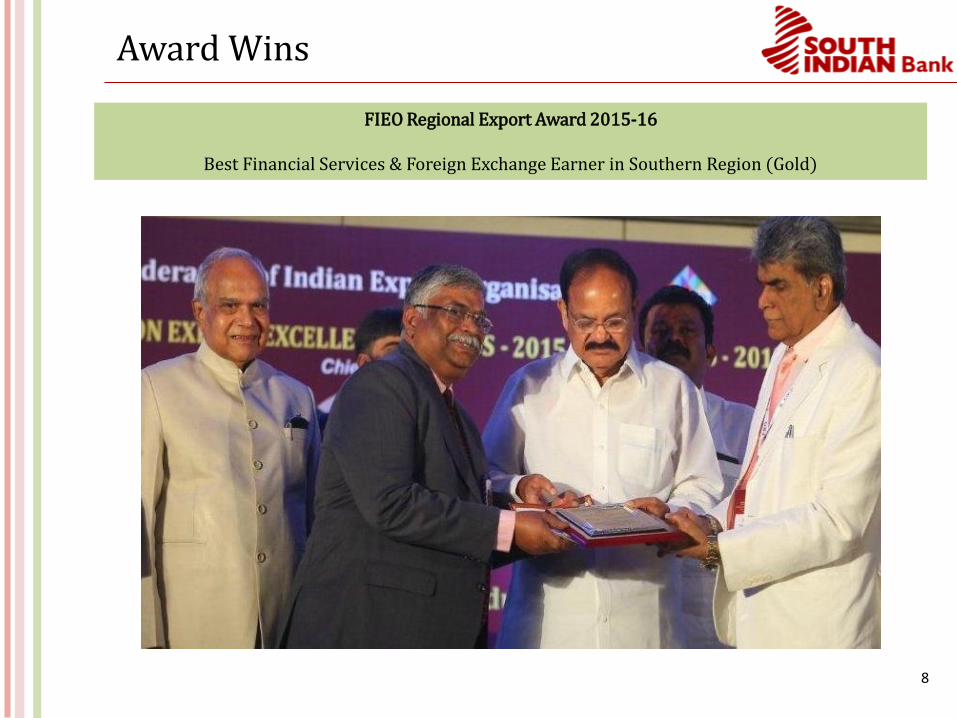
Award Wins
FIEO Regional Export Award 2015-16
Best Financial Services & Foreign Exchange Earner in Southern Region (Gold)

9
Key Performance Highlights- Q4 FY18
17%9%
Deposits
72,030
66,117
Q4 FY18
Q4 FY17
Advances
55,109
47,084
Q4 FY18
Q4 FY17
CASA
17,142
15,746
Q4 FY18
Q4 FY17
9%
Net Interest Income
Q4 FY18
Q4 FY17
492
439
12%
Q4 FY18
Q4 FY17
Other Income
179
138
30%
Rs Crs
PAT
114
76
Q4 FY18
Q4 FY17
51%
PPOP
311
281
Q4 FY18
11%
Q4 FY17

10
Business Strategy

11
Our Strategy…
• Focus on retail loan products
• Efficient branches for faster processing of loans
• Continuous training of work force
• Advanced technology for ease of customers
• Invest in Brand Building
Expand Retail
Business
• Cluster based approach in industry hubs
• Sole Banker to SMEs for all banking needs
• Dedicated vertical to penetrate SME banking
Strengthen SME Base
• Strategy & Road map in place to increase CASA funds
• Centralized processes allowing branches to focus on garnering low cost funds
Improve CASA
• Granulize loan portfolio to spread out risk
• Cautious approach on large corporate lending
• Special cell for monitoring non performing and restructured assets
Enhance Asset
Quality
• Focus on increasing banking services for SME, Retail, NRI
• Enhance treasury capabilities & increase branch strength
• Expand PoS & ATM Network
• Leveraging technology to introduce modern & new-age banking products
Improve share of
other Income

12
…Performance in Line with Strategy
INCREASE20% YoY
Expand Retail, SME & Agriculture Business
Rs. 33,314 Crs
Strengthen SME Base
Rs. 12,965 Crs
Improve CASA
Rs. 17,142 Crs
INCREASE18% YoY
INCREASE9% YoY
Enhance Asset Quality(Restructured Book)
Rs. 297 Crs
DECREASE48% YoY
Improve share of other Income in FY18
Rs. 837 Crs
INCREASE17% YoY

13
Shall continue to focus on Core Strengths
01 Increase …
CASA
02 Retail Business …
More Products
03 SME Business …
Sole Banker
04 Improve
NIM
05 Increase…
Fee Income
06 Sustainable…
Asset Quality
RetailRelationships
SMERelationships

14
...Increase Retail & SME Business
• Enhanced risk management
• KYC compliance and fraud prevention tools
Loan Processing
• Penetrate further in the existing set of Customers
• Faster Sanctions
Retail Business
• Focus on particular geographies and open additional branches
• Improve Branch Profitability
Branch Profitability
Centralized Marketing & Processing
Centre (Kochi)
01 02 03
Retail Hub
• Home Loan• Auto Loan• MSME Loan• LAP
Cluster Branches
15
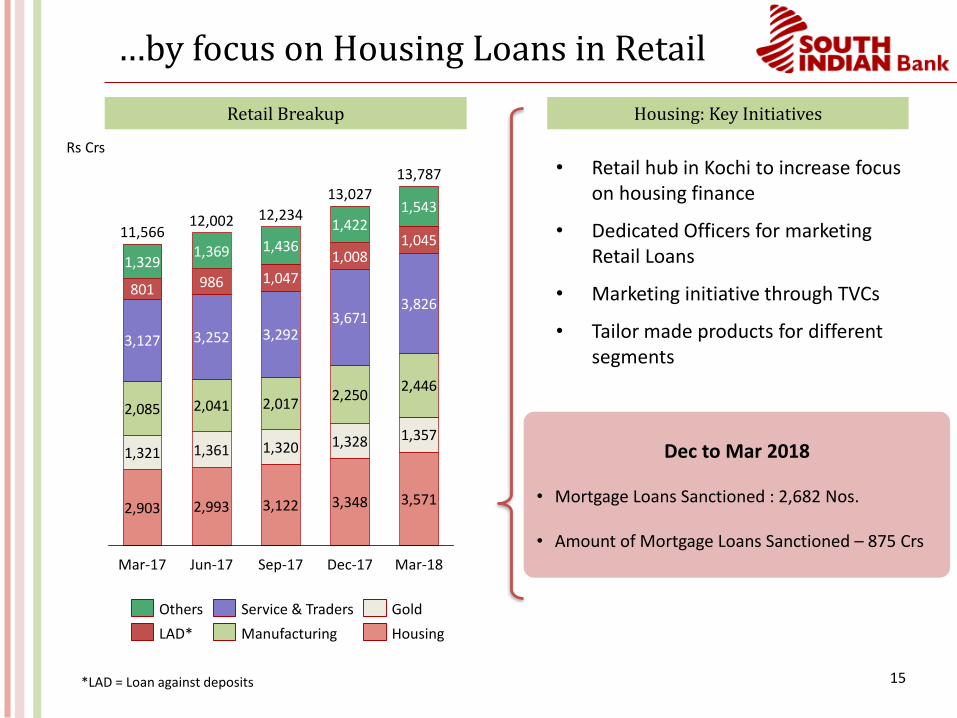
…by focus on Housing Loans in Retail
2,903 2,993 3,122 3,348 3,571
1,321 1,361 1,320 1,328 1,357
2,085 2,041 2,0172,250
2,446
3,127 3,252 3,2923,671
3,826801 986 1,047
1,0081,045
1,3291,369 1,436
1,4221,543
Jun-17
12,23412,002
Dec-17
13,027
Sep-17Mar-17
11,566
13,787
Mar-18
Retail Breakup
Gold
HousingLAD*
Others
Manufacturing
Service & Traders
Housing: Key Initiatives
• Retail hub in Kochi to increase focus on housing finance
• Dedicated Officers for marketing Retail Loans
• Marketing initiative through TVCs
• Tailor made products for different segments
Dec to Mar 2018
• Mortgage Loans Sanctioned : 2,682 Nos.
• Amount of Mortgage Loans Sanctioned – 875 Crs
Rs Crs
*LAD = Loan against deposits
16
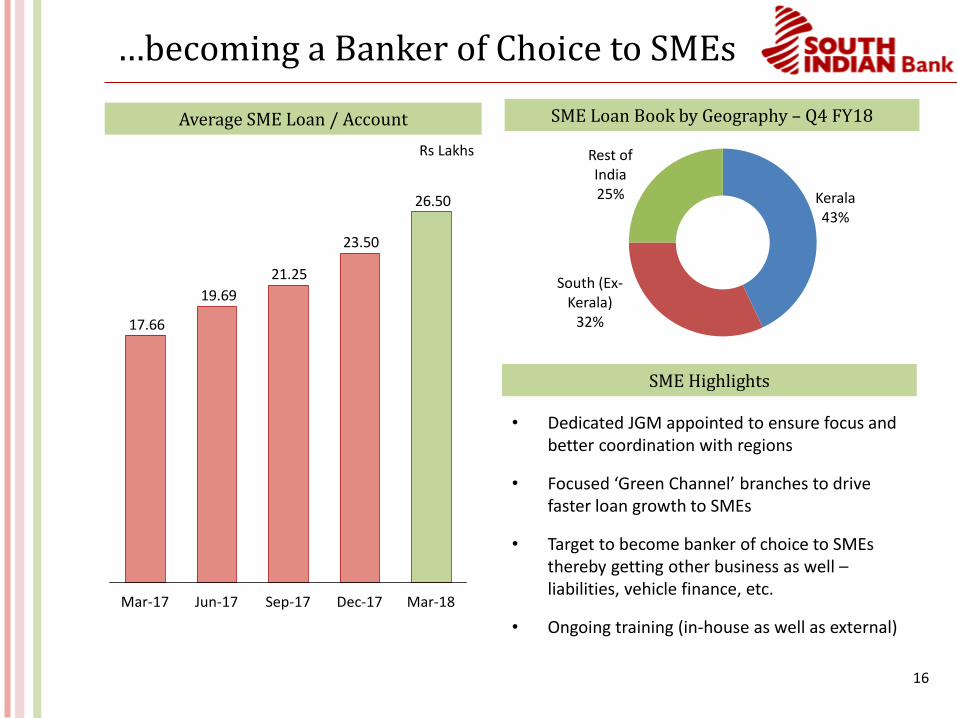
…becoming a Banker of Choice to SMEs
SME Loan Book by Geography – Q4 FY18
• Dedicated JGM appointed to ensure focus and better coordination with regions
• Focused ‘Green Channel’ branches to drive faster loan growth to SMEs
• Target to become banker of choice to SMEs thereby getting other business as well –liabilities, vehicle finance, etc.
• Ongoing training (in-house as well as external)
SME Highlights
Average SME Loan / Account
26.50
23.50
21.25
19.69
17.66
Jun-17 Mar-18Sep-17 Dec-17Mar-17
Rs Lakhs
Kerala43%
South (Ex-Kerala)
32%
Rest of India25%

17
…with the help of our Branch Network
Branch Location*No of
Branches
Kerala 464
South India (Ex-Kerala) 248
Rest of India 142
Total 854
Total Branch Network
Total ATM Network
854850834822794738
FY14FY13
+3.0%
FY18FY15 FY16 FY17
1,3821,3201,2871,2001,000
800
FY14 FY16FY13
+11.6%
FY18FY17FY15
*Map for illustration purpose only
18
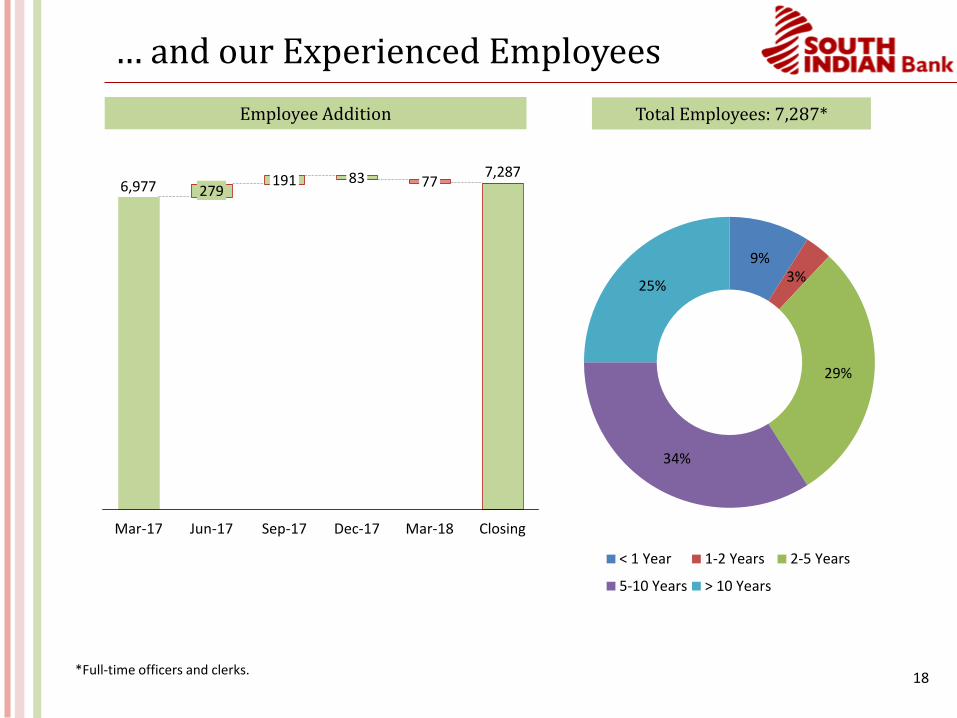
… and our Experienced Employees
Total Employees: 7,287*
9%3%
29%
34%
25%
< 1 Year 1-2 Years 2-5 Years
5-10 Years > 10 Years
Employee Addition
7,2876,977
ClosingMar-18
77
Dec-17
83279
Jun-17Mar-17
191
Sep-17
*Full-time officers and clerks.

19
Performance Matrix

20
Strong Deposit Franchise
Core & Non-Core Deposits
CASA Deposits
6%
Core Deposit Non-Core Deposit Total Deposit
Mar-18 Mar-18
Mar-17 Mar-1754,216
57,469
66,117
72,030
9%
Current Deposit Savings Deposit Total CASA
Mar-18 Mar-18 Mar-18
Mar-17 Mar-17 Mar-17
2,753 12,994
14,084
15,747
17,142
11% 8% 9%
3,058
Rs Crs
Rs Crs
22%
Mar-18
Mar-1711,902
14,561
21
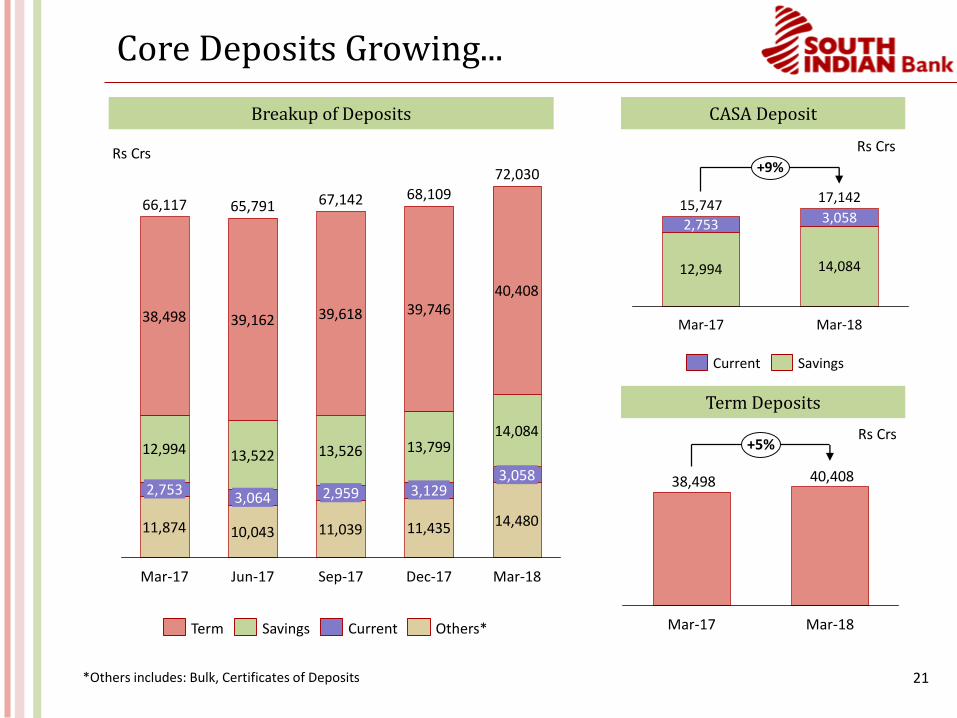
Core Deposits Growing...
Breakup of Deposits
11,874 10,043 11,039 11,435 14,480
12,994 13,522 13,526 13,79914,084
38,498 39,162 39,618 39,74640,408
3,064
Mar-17
66,117
2,753
65,791
Jun-17
67,142
2,959
Dec-17
68,109
3,129
Sep-17 Mar-18
72,030
3,058
Others*CurrentTerm Savings
CASA Deposit
3,0582,753
15,747
+9%
Mar-17
12,994
Mar-18
17,142
14,084
Term Deposits
40,40838,498
Mar-17
+5%
Mar-18
Rs Crs Rs Crs
SavingsCurrent
Rs Crs
*Others includes: Bulk, Certificates of Deposits
22
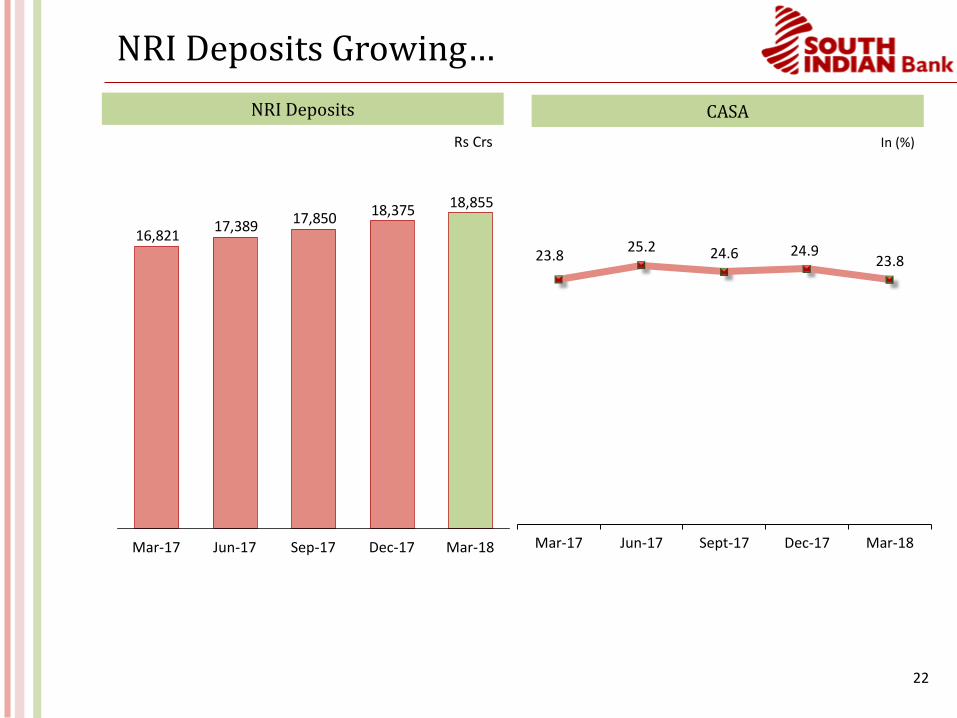
NRI Deposits Growing…
23.8 25.2 24.6 24.9
23.8
Mar-17 Jun-17 Sept-17 Dec-17 Mar-18
CASA NRI Deposits
18,85518,37517,85017,389
16,821
Jun-17Mar-17 Mar-18Dec-17Sep-17
In (%)Rs Crs

23
Break Up of Non Resident Deposits
Deposit Type (Rs Crs) Q4-FY 17 Q1-FY 18 Q2-FY 18 Q3-FY 18 Q4-FY 18
NRE SB 2,908 3,089 3,106 3,212 3,335
NRO SB 508 520 539 603 618
FCNR (B), RFC & Others 1,446 1,508 1,568 1,598 1,634
Low Cost NRI Deposit (Sub Total)
4,862 5,117 5,213 5,413 5,587
NRE Term Deposit 11,453 11,767 12,130 12,427 12,704
NRO Term Deposit 506 505 507 535 564
Total NRI Deposit 16,821 17,389 17,850 18,375 18,855
24
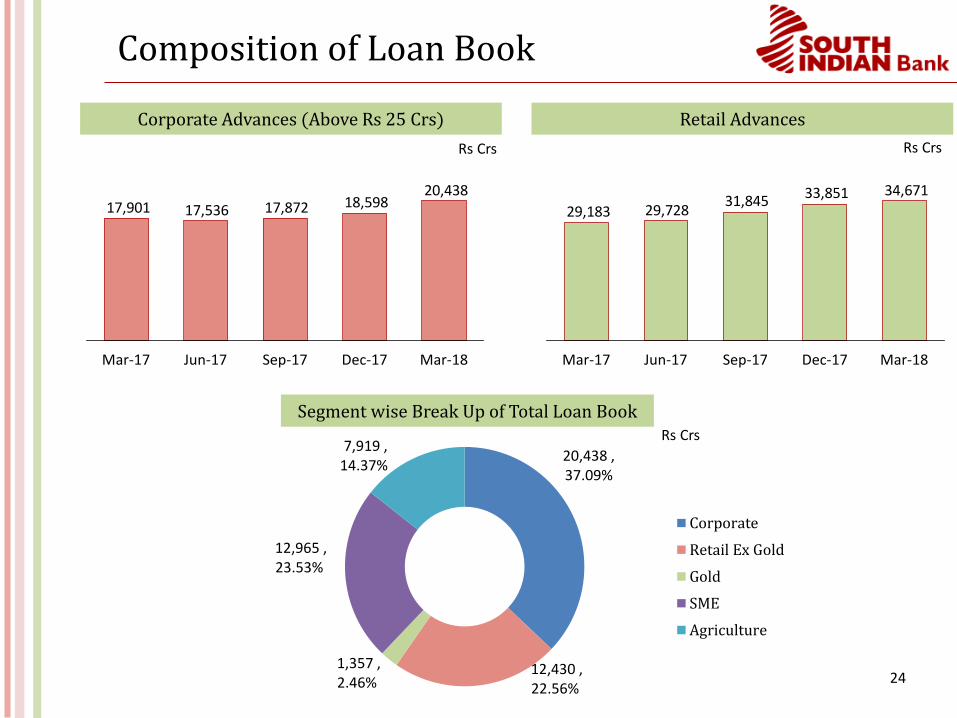
Composition of Loan Book
34,67133,85131,845
29,72829,183
Dec-17Sep-17Jun-17Mar-17 Mar-18
Corporate Advances (Above Rs 25 Crs)
Rs Crs
20,43818,59817,87217,53617,901
Jun-17 Sep-17 Dec-17Mar-17 Mar-18
Retail Advances
Rs Crs
Segment wise Break Up of Total Loan BookRs Crs
20,438 ,37.09%
12,430 , 22.56%
1,357 , 2.46%
12,965 , 23.53%
7,919 , 14.37%
Corporate
Retail Ex Gold
Gold
SME
Agriculture
25
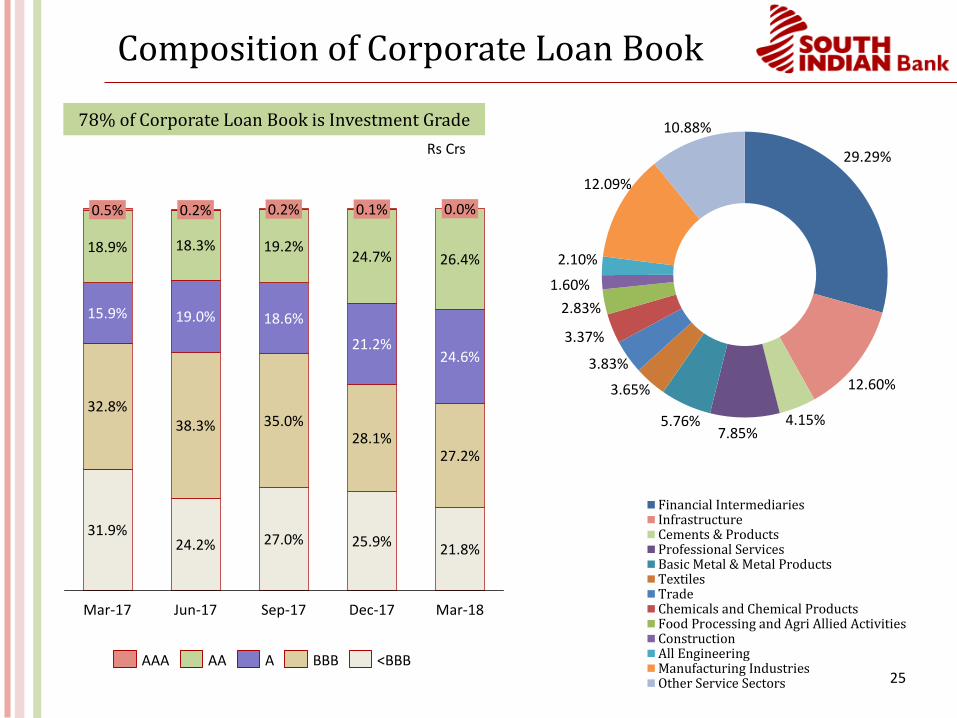
Composition of Corporate Loan Book
78% of Corporate Loan Book is Investment Grade
Rs Crs
27.2%
24.6%
Mar-18
21.8%
26.4%
Sep-17
27.0%
Jun-17
21.2%
0.2% 0.0%
Dec-17
28.1%
0.1%
18.6%
19.2%
35.0%
25.9%
24.7%18.3%
38.3%
19.0%
18.9%
31.9%
32.8%
0.2%0.5%
24.2%
Mar-17
15.9%
BBB <BBBAAAA AA
29.29%
12.60%
4.15%7.85%
5.76%
3.65%
3.83%
3.37%
2.83%
1.60%
2.10%
12.09%
10.88%
Financial IntermediariesInfrastructureCements & ProductsProfessional ServicesBasic Metal & Metal ProductsTextilesTradeChemicals and Chemical ProductsFood Processing and Agri Allied ActivitiesConstructionAll EngineeringManufacturing IndustriesOther Service Sectors

26
Key Focus : Retail, SME & Agriculture
Retail excluding Gold Gold ( Average LTV – 65%)
SMEAgriculture
12,43011,69910,91410,64110,245
Mar-18Sep-17 Dec-17Jun-17Mar-17
1,357
Mar-17 Mar-18Dec-17Sep-17
1,321 1,3281,361 1,320
Jun-17
12,96513,25512,42510,85110,984
Mar-18Dec-17Mar-17 Jun-17 Sep-17
7,9197,5697,1856,8766,633
Mar-17 Dec-17Jun-17 Mar-18Sep-17
~16% of the Agriculture & SME
Loans are backed byAdditional Security
by way of GOLD
Retail Loans (Excl. Gold), Agriculture &
SME has grown by 20% (Y-o-Y)
Rs Crs
Rs Crs
Rs Crs
Rs Crs
27
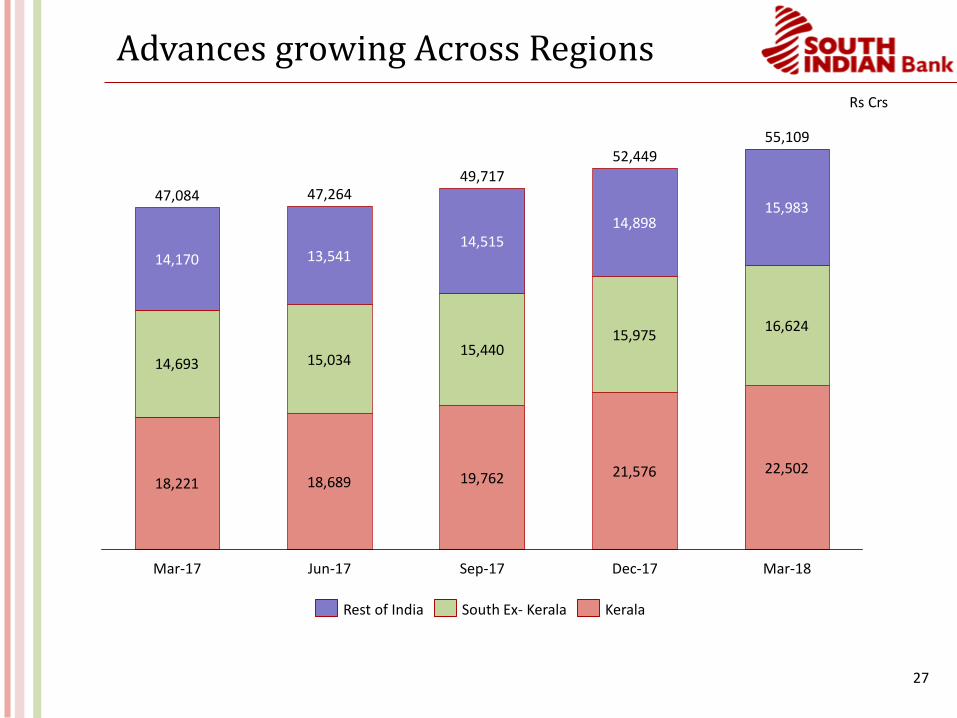
Advances growing Across Regions
18,221 18,689 19,762 21,576 22,502
14,693 15,03415,440
15,97516,624
14,170 13,54114,515
14,89815,983
Jun-17
47,084 47,264
Mar-17
55,109
Mar-18Dec-17
52,449
Sep-17
49,717
South Ex- KeralaRest of India Kerala
Rs Crs
28
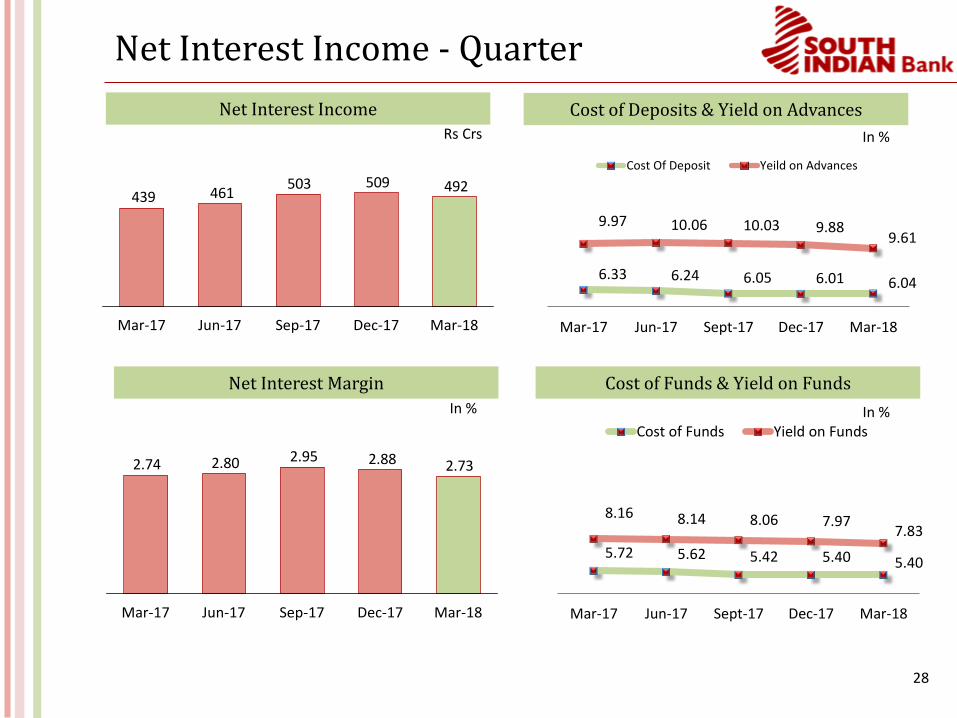
Net Interest Income - Quarter
Net Interest Income
492509503461439
Dec-17Jun-17 Sep-17 Mar-18Mar-17
Cost of Deposits & Yield on Advances
Net Interest Margin
2.732.882.952.802.74
Mar-18Sep-17Mar-17 Jun-17 Dec-17
Cost of Funds & Yield on Funds
Rs Crs
In %
In %
5.72 5.62 5.42 5.40 5.40
8.16 8.14 8.06 7.977.83
Mar-17 Jun-17 Sept-17 Dec-17 Mar-18
Cost of Funds Yield on FundsIn %
6.33 6.24 6.05 6.01 6.04
9.97 10.06 10.03 9.88 9.61
Mar-17 Jun-17 Sept-17 Dec-17 Mar-18
Cost Of Deposit Yeild on Advances

29
Net Interest Income - Cumulative
Net Interest Income
1,966
1,473
964
461
1,675
Dec-17Jun-17 Sep-17 Mar-18Mar-17
6.64 6.24 6.14 6.10 6.08
10.4310.06 10.05 9.99
9.89
Mar -17 Jun -17 Sept -17 Dec -17 Mar -18
Cost of Deposits Yield on Advances
Cost of Deposits & Yield on Advances
Net Interest Margin
2.842.872.872.802.72
Sep-17Mar-17 Jun-17 Dec-17 Mar-18
Cost of Funds & Yield on Funds
Rs Crs
In %
In %
6.06 5.62 5.52 5.46 5.44
8.508.14 8.10 8.04
7.97
Mar -17 Jun -17 Sept -17 Dec-17 Mar-18
Cost of Funds Yield on FundsIn %

30
Improving Operating Efficiency
49.20
44.19 42.6345.12
47.17
Mar -17 Jun -17 Sept -17 Dec -17 Mar -18
C/I Ratio
Business per Employee Business per Branch
14.914.514.114.313.8
Dec-17Sep-17Jun-17Mar-17 Mar-18
134132130129120
Sep-17Jun-17Mar-17 Dec-17 Mar-18
Employee Additions
-6
279
191
-83-77
Mar -17 Jun -17 Sept -17 Dec -17 Mar -18
In %
Rs Crs Rs Crs
31
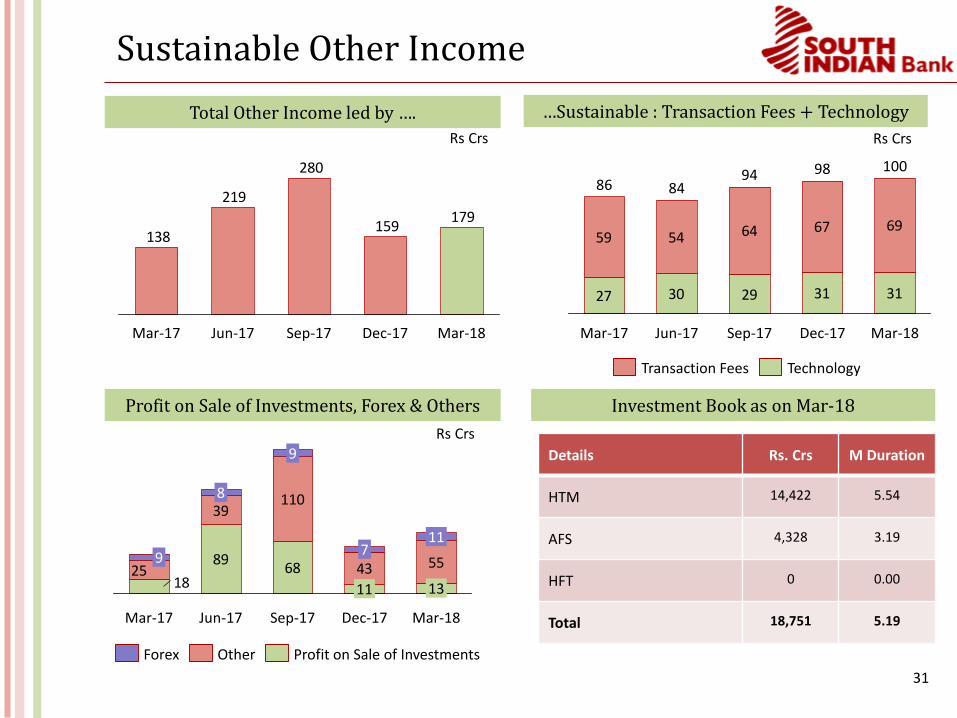
Sustainable Other Income
…Sustainable : Transaction Fees + Technology
27 30 29 31 31
59 54 64 67 69
Mar-18Sep-17 Dec-17
98
Jun-17
10094
86
Mar-17
84
Total Other Income led by ….
TechnologyTransaction Fees
Investment Book as on Mar-18
Rs Crs Rs Crs
39110
43 558968
1825
11
Sep-17
8
Mar-17
9
11
7
Jun-17
13
9
Mar-18Dec-17
Profit on Sale of InvestmentsOtherForex
Profit on Sale of Investments, Forex & Others
Rs Crs
179159
280
219
138
Mar-17 Dec-17Sep-17Jun-17 Mar-18
Details Rs. Crs M Duration
HTM 14,422 5.54
AFS 4,328 3.19
HFT 0 0.00
Total 18,751 5.19
32
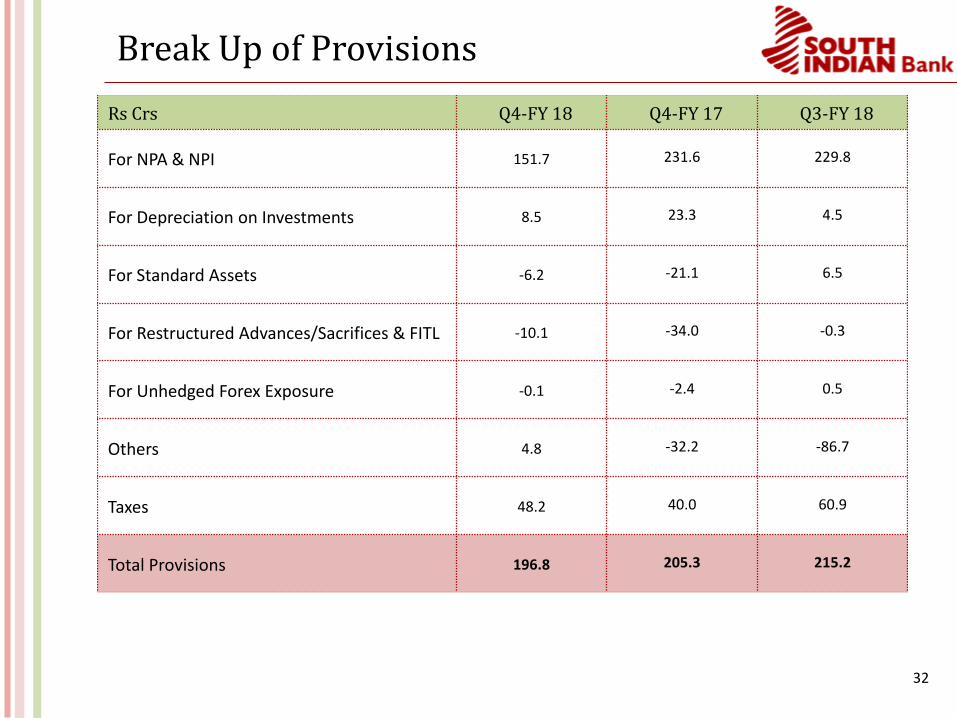
Break Up of Provisions
Rs Crs Q4-FY 18 Q4-FY 17 Q3-FY 18
For NPA & NPI 151.7 231.6 229.8
For Depreciation on Investments 8.5 23.3 4.5
For Standard Assets -6.2 -21.1 6.5
For Restructured Advances/Sacrifices & FITL -10.1 -34.0 -0.3
For Unhedged Forex Exposure -0.1 -2.4 0.5
Others 4.8 -32.2 -86.7
Taxes 48.2 40.0 60.9
Total Provisions 196.8 205.3 215.2

33
Non Performing Assets
Net NPA
1.45%
2.54% 2.57% 2.35% 2.60%
Mar-17 Jun-17 Sept-17 Dec-17 Mar-18
Gross NPA
2.45%
3.61% 3.57% 3.40% 3.59%
Mar-17 Jun-17 Sept-17 Dec-17 Mar-18
Net NPA MovementGross NPA Movement
Rs Crs Mar-17 Jun-17 Sept-17 Dec-17 Mar-18
Opening 1,787 1,149 1,696 1,766 1,775
Additions 1,150 686 252 258 614
Deductions 1,788 140 182 249 408
Closing 1,149 1,696 1,766 1,775 1,980
Rs Crs Mar-17 Jun-17 Sept-17 Dec-17 Mar-18
Opening 1,116 675 1,183 1,256 1,211
Additions 991 580 209 89 510
Deductions 1,432 72 136 134 305
Closing 675 1,183 1,256 1,211 1,416
34
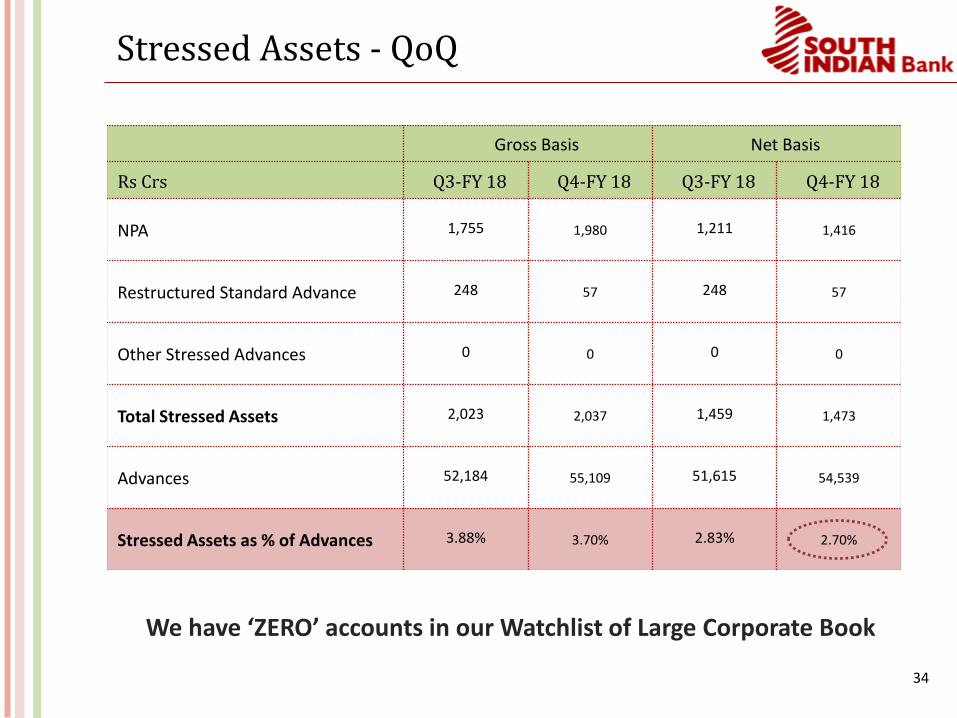
Stressed Assets - QoQ
Gross Basis Net Basis
Rs Crs Q3-FY 18 Q4-FY 18 Q3-FY 18 Q4-FY 18
NPA 1,755 1,980 1,211 1,416
Restructured Standard Advance 248 57 248 57
Other Stressed Advances 0 0 0 0
Total Stressed Assets 2,023 2,037 1,459 1,473
Advances 52,184 55,109 51,615 54,539
Stressed Assets as % of Advances 3.88% 3.70% 2.83% 2.70%
We have ‘ZERO’ accounts in our Watchlist of Large Corporate Book
35
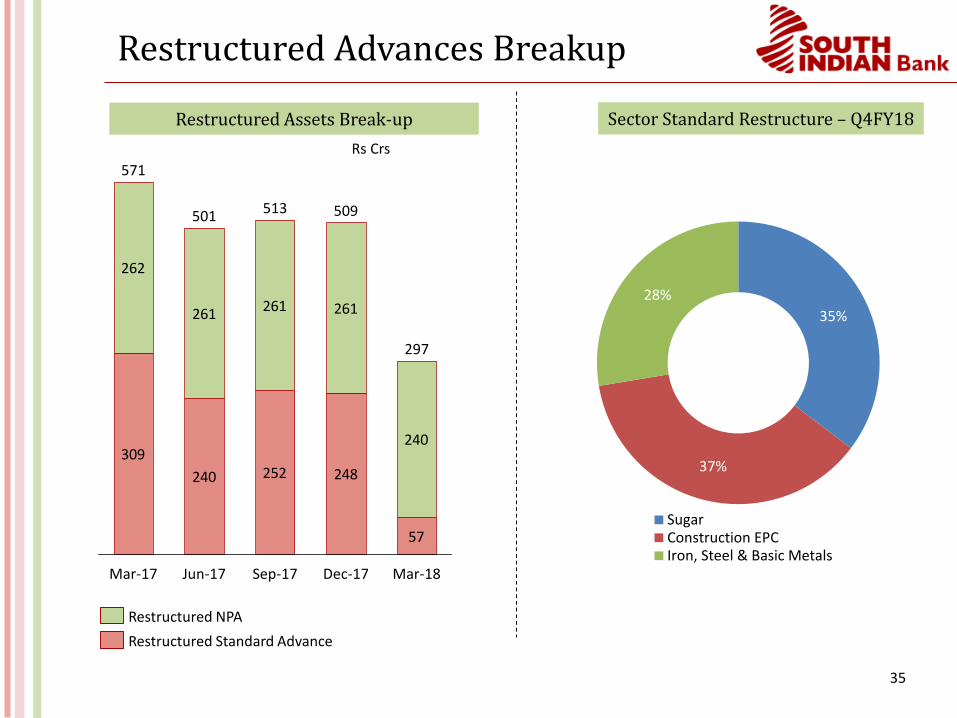
Restructured Advances Breakup
Restructured Assets Break-up
309
240 252 248
57
262
261 261 261
240
Sep-17Mar-17
571
Jun-17
513501
297
Dec-17
509
Mar-18
Restructured Standard Advance
Restructured NPA
Sector Standard Restructure – Q4FY18
35%
37%
28%
SugarConstruction EPCIron, Steel & Basic Metals
Rs Crs
36
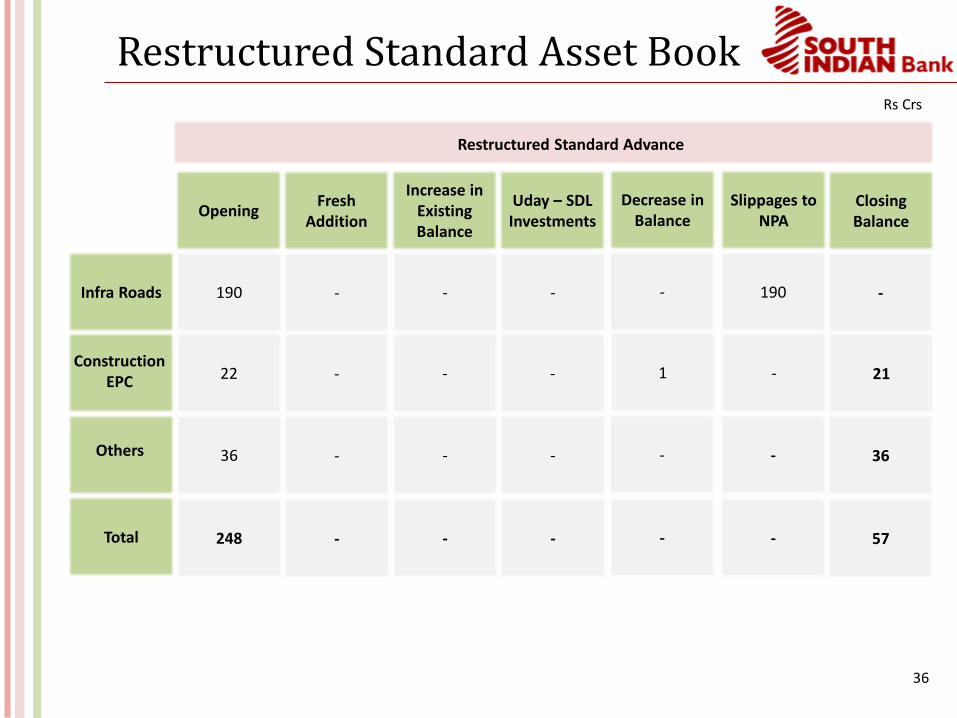
Restructured Standard Advance
Restructured Standard Asset BookRs Crs
190 - -
22 - -
36 - -
Infra Roads
OpeningIncrease in
Existing Balance
Uday – SDLInvestments
Construction EPC
Others
190
-
-
Slippages to NPA
248 - -Total -
-
21
36
Closing Balance
57
-
-
-
Fresh Addition
-
-
1
-
Decrease in Balance
-

37
Movement in Restructured Accounts
Movement in Restructured Accounts
219
297
509
8
Opening Fresh Addition
0
Dec in Balance
Closing
0
1
Closure Including Write Off
Upgradation in Standard
Category
Increase in Balance
Shift of focus from Large Corporate
toSMEs
Defocusing from Stressed Sectors
Special Cell & Asset Monitoring Cell
Rs Crs
38
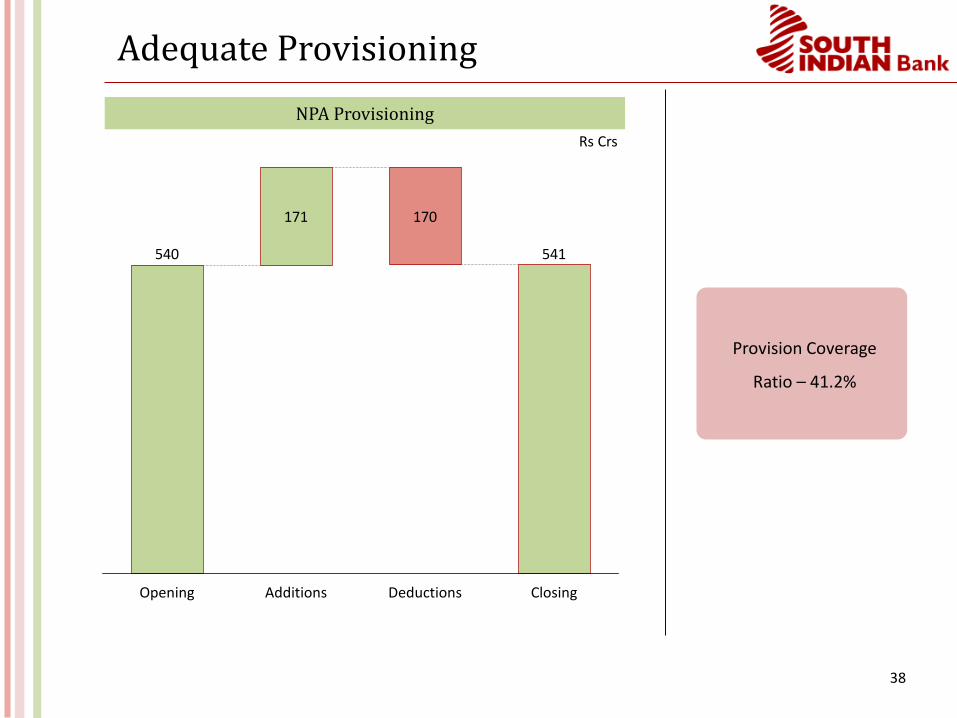
Adequate Provisioning
NPA Provisioning
171 170
541540
ClosingDeductionsAdditionsOpening
Provision Coverage
Ratio – 41.2%
Rs Crs
39
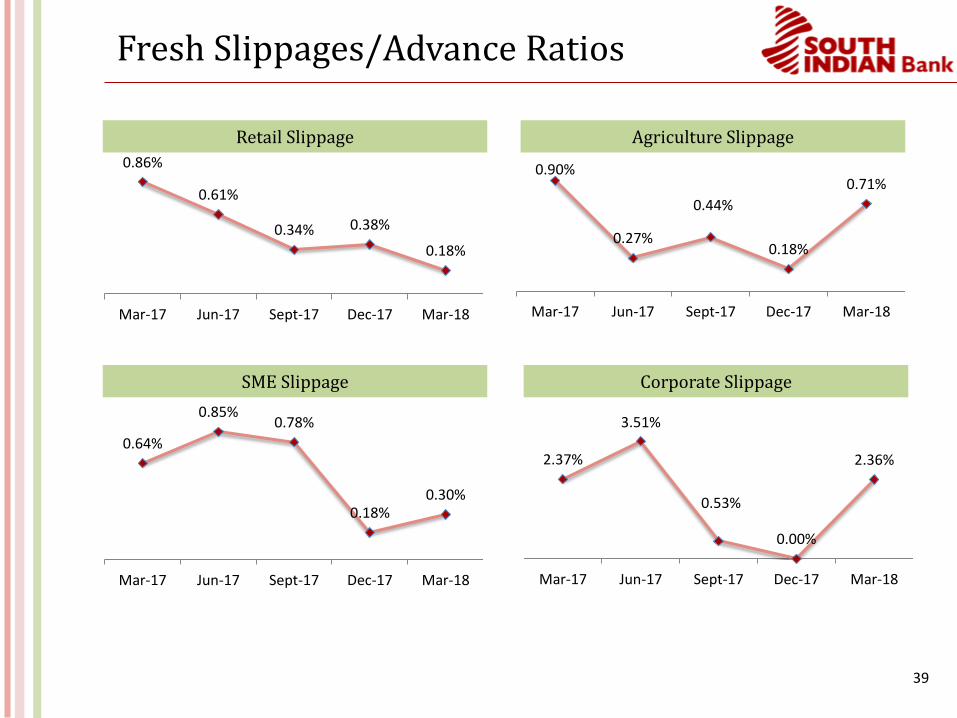
Fresh Slippages/Advance Ratios
SME Slippage
Retail Slippage
Corporate Slippage
0.86%
0.61%
0.34% 0.38%
0.18%
Mar-17 Jun-17 Sept-17 Dec-17 Mar-18
Agriculture Slippage
0.90%
0.27%
0.44%
0.18%
0.71%
Mar-17 Jun-17 Sept-17 Dec-17 Mar-18
0.64%
0.85%0.78%
0.18%0.30%
Mar-17 Jun-17 Sept-17 Dec-17 Mar-18
2.37%
3.51%
0.53%
0.00%
2.36%
Mar-17 Jun-17 Sept-17 Dec-17 Mar-18
40
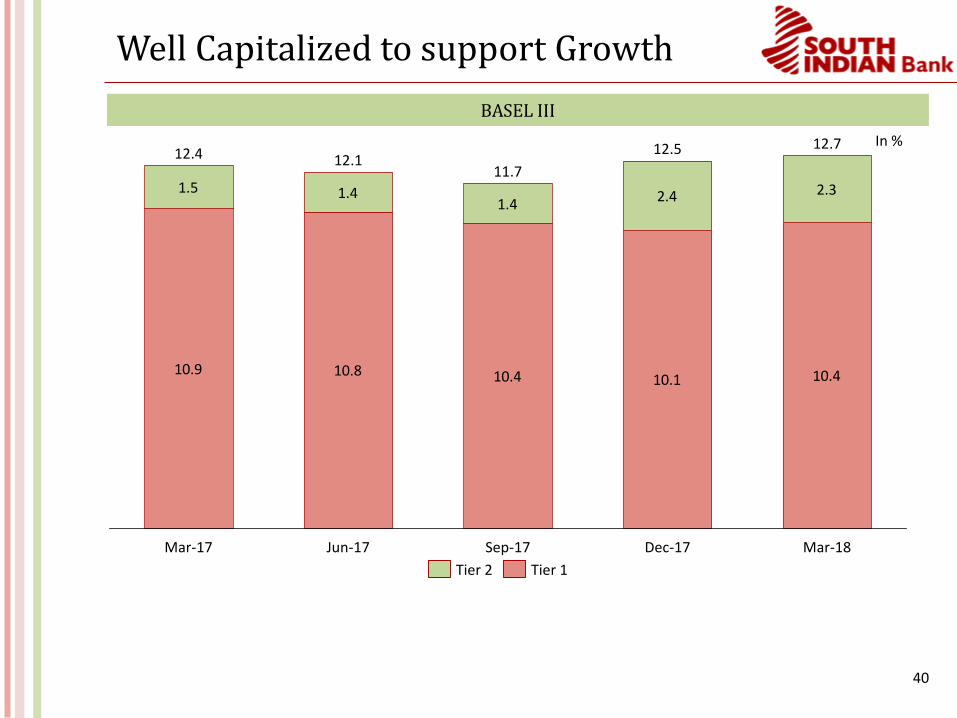
Well Capitalized to support Growth
BASEL III
In %
10.9 10.8 10.4 10.1 10.4
1.5 1.41.4 2.4 2.3
12.1
Sep-17Jun-17 Dec-17
12.5
11.7
Mar-17 Mar-18
12.412.7
Tier 2 Tier 1
41
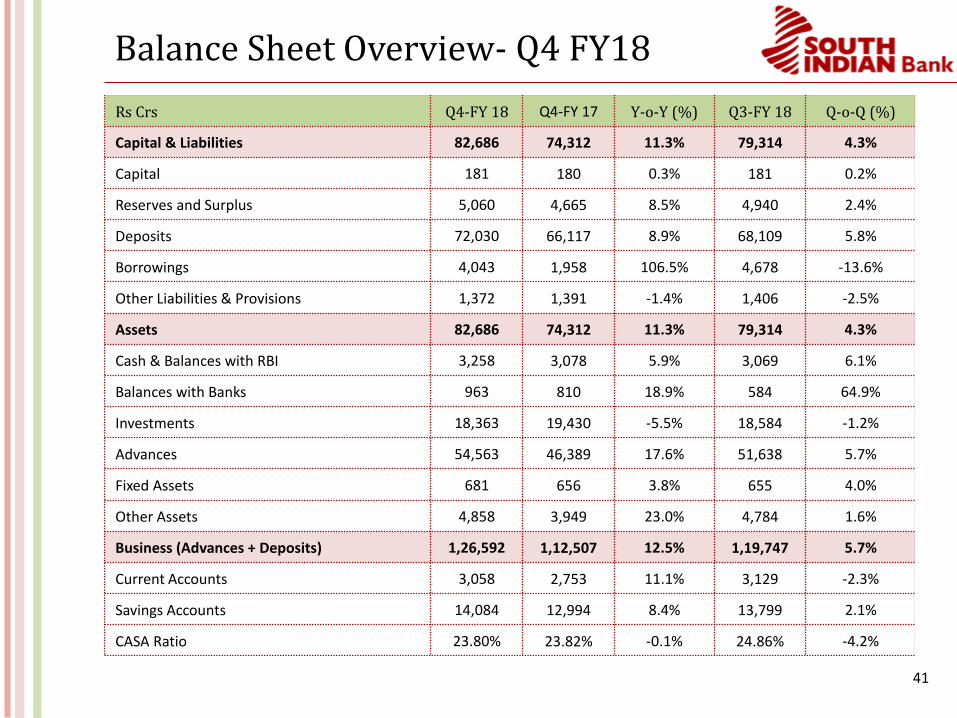
Balance Sheet Overview- Q4 FY18
Rs Crs Q4-FY 18 Q4-FY 17 Y-o-Y (%) Q3-FY 18 Q-o-Q (%)
Capital & Liabilities 82,686 74,312 11.3% 79,314 4.3%
Capital 181 180 0.3% 181 0.2%
Reserves and Surplus 5,060 4,665 8.5% 4,940 2.4%
Deposits 72,030 66,117 8.9% 68,109 5.8%
Borrowings 4,043 1,958 106.5% 4,678 -13.6%
Other Liabilities & Provisions 1,372 1,391 -1.4% 1,406 -2.5%
Assets 82,686 74,312 11.3% 79,314 4.3%
Cash & Balances with RBI 3,258 3,078 5.9% 3,069 6.1%
Balances with Banks 963 810 18.9% 584 64.9%
Investments 18,363 19,430 -5.5% 18,584 -1.2%
Advances 54,563 46,389 17.6% 51,638 5.7%
Fixed Assets 681 656 3.8% 655 4.0%
Other Assets 4,858 3,949 23.0% 4,784 1.6%
Business (Advances + Deposits) 1,26,592 1,12,507 12.5% 1,19,747 5.7%
Current Accounts 3,058 2,753 11.1% 3,129 -2.3%
Savings Accounts 14,084 12,994 8.4% 13,799 2.1%
CASA Ratio 23.80% 23.82% -0.1% 24.86% -4.2%
42
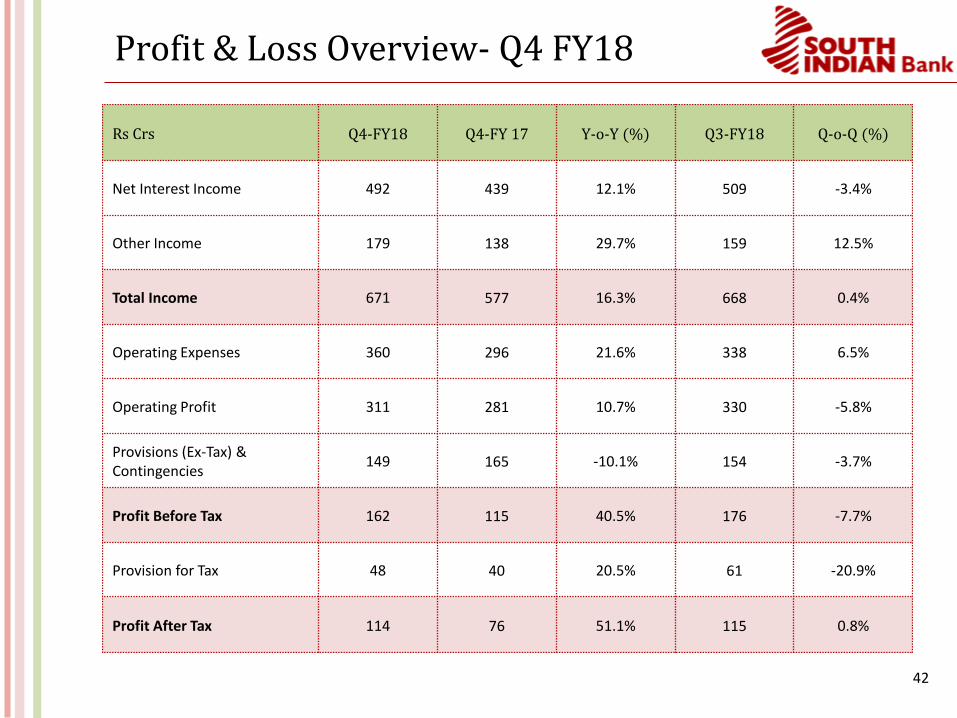
Profit & Loss Overview- Q4 FY18
Rs Crs Q4-FY18 Q4-FY 17 Y-o-Y (%) Q3-FY18 Q-o-Q (%)
Net Interest Income 492 439 12.1% 509 -3.4%
Other Income 179 138 29.7% 159 12.5%
Total Income 671 577 16.3% 668 0.4%
Operating Expenses 360 296 21.6% 338 6.5%
Operating Profit 311 281 10.7% 330 -5.8%
Provisions (Ex-Tax) & Contingencies
149 165 -10.1% 154 -3.7%
Profit Before Tax 162 115 40.5% 176 -7.7%
Provision for Tax 48 40 20.5% 61 -20.9%
Profit After Tax 114 76 51.1% 115 0.8%

43
Key Metrics- Quarterly
Particulars FY15 FY16 FY17 FY18
Q1 Q2 Q3 Q4 Q1 Q2 Q3 Q4 Q1 Q2 Q3 Q4 Q1 Q2 Q3 Q4Net Interest Margin (NIM) %
2.7 2.9 2.5 2.7 2.5 2.8 2.9 2.6 2.7 2.8 2.7 2.7 2.8 2.9 2.9 2.7
CRAR Basel III 12.2 12.1 11.4 12.1 11.4 11.9 11.7 11.8 11.7 11.1 11.1 12.4 12.1 11.7 12.5 12.7
RoAA (Annualized) 0.5 0.6 0.6 0.1 0.5 0.6 0.7 0.5 0.6 0.7 0.6 0.4 0.6 0.02 0.6 0.6
Provision Coverage 62.5 62.9 60.4 61.0 56.1 55.3 50.3 40.3 42.6 46.1 50.2 55.1 44.6 44.1 49.4 41.2
CASA 22.1 22.1 21.5 20.6 22.3 22.8 23.0 22.4 23.2 22.8 25.9 23.8 25.2 24.6 24.9 23.8
Gross NPA 1.5 1.6 1.8 1.7 1.9 2.2 2.8 3.8 4.0 4.0 4.0 2.5 3.6 3.6 3.4 3.6
Net NPA 0.9 0.9 1.0 1.0 1.2 1.4 1.8 2.9 2.9 2.8 2.5 1.5 2.5 2.6 2.4 2.6
Book Value per Share (Rs.)
25.9 26.5 27.1 26.6 27.1 27.8 28.5 28.5 30.0 30.8 31.6 26.9 27.7 27.6 28.4 29.0
EPS (Rs.) (Annualized) 3.8 3.0 2.9 2.3 1.9 2.3 2.6 2.5 2.8 3.0 3.1 2.6 2.3 0.1 2.5 2.6
Branches
- Kerala 439 440 441 444 447 447 447 449 453 454 455 463 463 463 463 464
- South India (Ex-Kerala)
230 232 233 239 242 244 244 245 245 245 245 246 246 246 246 248
- Rest of India 132 133 136 139 139 140 140 140 140 140 140 141 142 142 142 142
Total Branches 801 805 810 822 828 831 831 834 838 839 840 850 851 851 851 854
ATMs
- Kerala 565 587 607 651 670 682 688 698 701 713 718 724 745 756 769 783
- South India (Ex-Kerala)
297 313 325 365 378 380 384 387 388 391 393 394 396 393 396 398
- Rest of India 156 163 176 184 196 198 200 202 202 202 202 202 203 205 205 201
Total ATMs 1,018 1,063 1,108 1,200 1,244 1,260 1,272 1,287 1,291 1,306 1,313 1,320 1,344 1,354 1,370 1,382
44
Next Generation Bank

45
Present across Customer Touch Points
SIB Mirror + Mobile Banking
Point of SaleInternet Banking
ATMs
1,382 ATMs across India
Branches
854 Branches & 55 Extension Counters
Traditional & Alternate Channels

46
Technology Initiatives
SIB Mirror is a mobile-led platform with instant account access, balance retrieval, immediate fund transfers, all account intimations, and much more
SIB-er Net is a suite of comprehensive internet banking services positioning SIB as a technology-driven bank offering superior services to retail customers
Retail branches now interconnected with single-window service and providing real-time online, real-time transactions to customers
SIB offers Visa, MasterCard, and RuPay debit cards with online access to users for secure domestic and international transactions
Centralized Processing Center allows enhanced risk management and customer creation with complete KYC compliance and fraud prevention tools
47
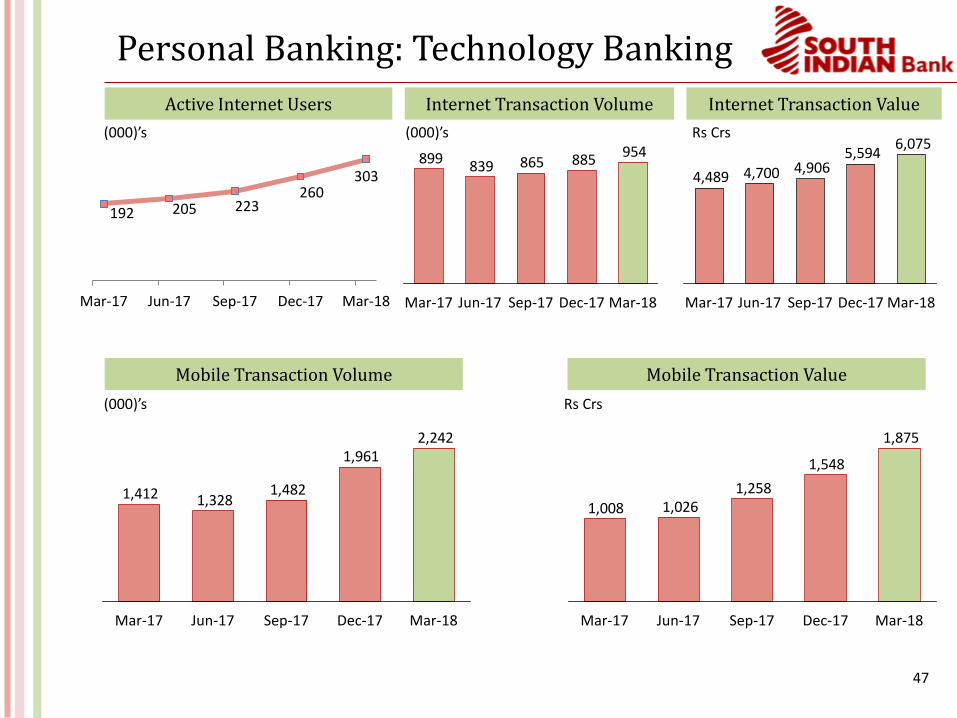
Personal Banking: Technology Banking
Active Internet Users
192 205 223 260
303
Mar-17 Jun-17 Sep-17 Dec-17 Mar-18
Mobile Transaction Volume
Internet Transaction Volume Internet Transaction Value
Mobile Transaction Value
954885865839899
Sep-17 Dec-17Mar-17 Jun-17 Mar-18
6,0755,594
4,9064,7004,489
Dec-17Sep-17Jun-17Mar-17 Mar-18
2,2421,961
1,4821,3281,412
Sep-17Jun-17Mar-17 Dec-17 Mar-18
1,875
1,548
1,2581,0261,008
Dec-17Mar-17 Sep-17Jun-17 Mar-18
(000)’s (000)’s
(000)’s
Rs Crs
Rs Crs

48
Personal Banking: Debit Cards
3.2 3.3
3.5 3.6
3.8
Mar-17 Jun-17 Sep-17 Dec-17 Mar-18
No of Active Debit Cards Debit Card Transaction Volumes
Debit Card Transaction Value
37.236.733.833.633.7
Mar-18Dec-17Sep-17Mar-17 Jun-17
In Millions In Millions
Rs Crs 7,0906,9496,6856,655
5,480
Mar-18Dec-17Jun-17 Sep-17Mar-17

49
An Inflection Point

50
Moving Towards Vision 2020…
▪ Provides advisory support to bank on the medium and long term strategy for significant growth in retail, agriculture and SME sectors
Appointed International
Finance Corporation
▪ Facilitates loans to MSE and promotes the MSME credit portfolio of the Bank
Entered Memorandum
of Understanding with NSIC
▪ Houses the Bank’s Marketing Dept, Retail Loan Hub and Transaction Banking Dept
Opened Centralized
Marketing & Processing
Centre
....to become Retail Banking Power House

51
About Us
52
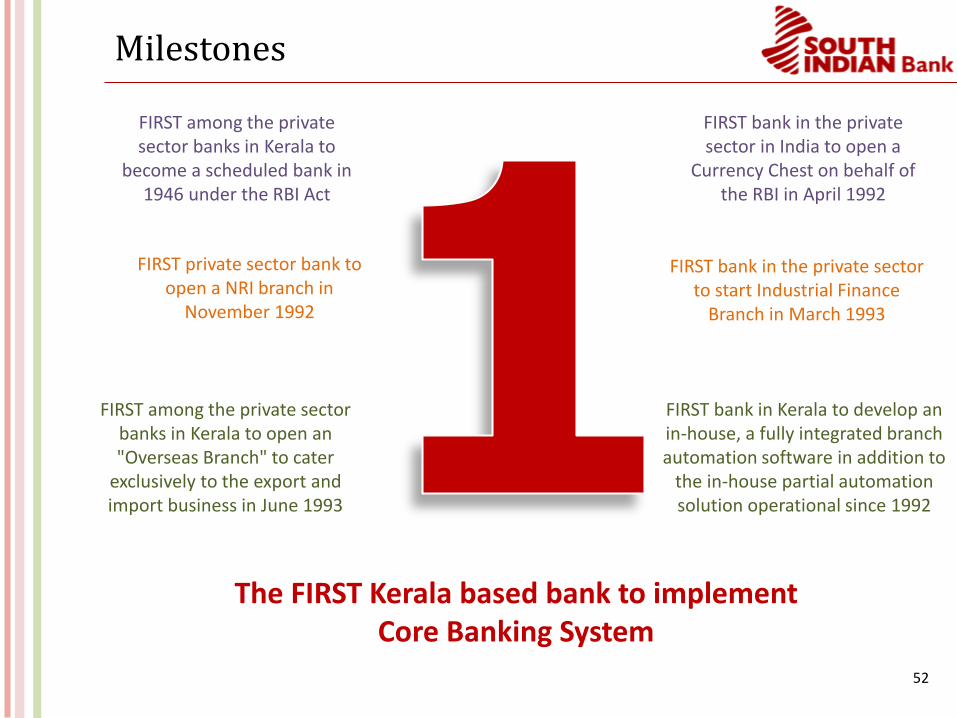
Milestones
FIRST among the private sector banks in Kerala to
become a scheduled bank in 1946 under the RBI Act
FIRST bank in the private sector in India to open a
Currency Chest on behalf of the RBI in April 1992
FIRST private sector bank to open a NRI branch in
November 1992
FIRST bank in the private sector to start Industrial Finance
Branch in March 1993
FIRST among the private sector banks in Kerala to open an "Overseas Branch" to cater
exclusively to the export and import business in June 1993
FIRST bank in Kerala to develop an in-house, a fully integrated branch automation software in addition to
the in-house partial automation solution operational since 1992
The FIRST Kerala based bank to implement Core Banking System

53
Expansion since FY07
Branch Network
142
122
248
277
464
66
854
~2X
FY18FY07
465
Kerala Others (Rest of India)South Ex-Kerala
ATM Network
783
201
398
84
1,382
FY07
174
51
FY18
~8X
39

54
Performance since FY07
1,966
368
CAGR : 16%
FY18FY07
Net Interest Income
20,158
FY18
127,139
CAGR : 18%
FY07
Business (Advances + Deposits)
335
104
FY07
CAGR : 11%
FY18
Profit After Tax
3.593.94
FY18
35bps
FY07
Gross NPA
Rs Crs Rs Crs
Rs Crs In %

55
Leadership Team
Mr. V. G Mathew , MD & CEO
▪ Post Graduate in Physics and CAIIB with over 37 years of experience
▪ Joined SIB in January, 2014 as Executive Vice President and appointed as MD & CEO in October, 2014
▪ Significant experience in Retail & Corporate Credit, Technology and Risk Management
▪ Joined SBI as a probationary officer in the Ahmadabad Circle in 1978 and was Chief General Manager before joining SIB
▪ The major assignments handled by Mr. Mathew in SBI are
▪ Dy. General Manager (IT Networking Project)
▪ Dy. General Manager and Branch Head, (Overseas Branch, Bangalore)
▪ General Manager, (Corporate Accounts Group-Mumbai Branch)
▪ Chief General Manager (Risk Management)
▪ Chief General Manager (Corporate Accounts Group)
▪ He has served on various committees at Corporate Center of SBI such as Wholesale Banking Credit Committee,
Investment Committee, Corporate Centre Credit Committee and was a Director on the Board of SBI Macquarie
Infrastructure Trustee (P) Limited

56
Leadership Team
Mr. Thomas Joseph K, EVP (Operations)
• Bachelors Degree in Engineering and Diploma in Management & CAIIB
• He is associated with SIB since 1984 and heads Departments such as Risk Management, Technology, Marketing, Corporate Financial Management, Human Resource and Inspection & Vigilance
• He was Head of Credit handling a portfolio of Rs.40,000 crores and was instrumental in the execution of the Retail Strategy of the Bank which saw significant growth in the MSME & Agriculture Sectors
Mr. G Sivakumar, EVP (Credit)
• Postgraduate in Chemistry and holds Masters Degree in Business Administration & CAIIB
• He heads Credit and Legal Departments
• He has over 35 Years of Experience in Domestic and International Banking in India and Abroad
• Before joining SIB, he was the General Manager and Head of Private Equity Vertical in State Bank of India where he was
responsible for Private Equity and Venture Capital Investments made by the Bank
• He was also a nominee director on the Board of Directors of four companies and Investment Committee of more than
ten Alternative Investment Funds
Mr. K N Reghunathan, EVP (Treasury)
• Commerce Graduate & CAIIB
• He is responsible for Treasury Operations of the Bank along with International Banking Division
• Before joining SIB, he was associated with Union Bank of India and was General Manager of Treasury and International
Banking Division.
• He was the Bank’s nominee on the Board of FIMMDA and SBI Global Factors and Member of the Advisory Committee
of Metropolitan Stock Exchange of India, IDFC Investment Fund, TATA Growth Fund, TATA Innovative Fund, India
Advantage Fund I & II
57
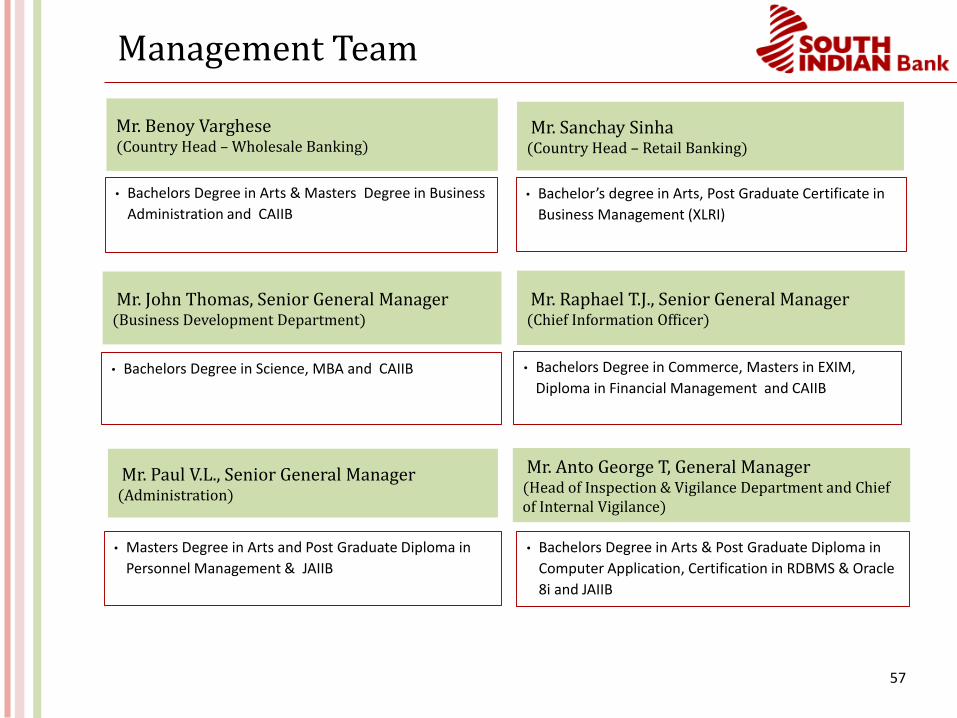
Management Team
Mr. John Thomas, Senior General Manager (Business Development Department)
• Bachelors Degree in Science, MBA and CAIIB
Mr. Raphael T.J., Senior General Manager (Chief Information Officer)
• Bachelors Degree in Commerce, Masters in EXIM,
Diploma in Financial Management and CAIIB
Mr. Anto George T, General Manager (Head of Inspection & Vigilance Department and Chief of Internal Vigilance)
• Bachelors Degree in Arts & Post Graduate Diploma in
Computer Application, Certification in RDBMS & Oracle
8i and JAIIB
• Bachelors Degree in Arts & Masters Degree in Business
Administration and CAIIB
Mr. Benoy Varghese (Country Head – Wholesale Banking)
Mr. Paul V.L., Senior General Manager (Administration)
• Masters Degree in Arts and Post Graduate Diploma in
Personnel Management & JAIIB
Mr. Sanchay Sinha (Country Head – Retail Banking)
• Bachelor’s degree in Arts, Post Graduate Certificate in
Business Management (XLRI)

58
Management Team
Mr. C.P. Gireesh, Chief Financial Officer
• Bachelors Degree in Mathematics
• Fellow member of the Institute of Chartered Accountants of India and Certified Associate of the Indian Institute of
Banking & Finance
Mr. Jacob EA, Chief Compliance Officer
• Bachelors Degree in Science & CAIIB - I
Mr. Jimmy Mathew, Company Secretary
• Bachelors Degree in Commerce, Associate Member of
Institute of Company Secretary of India and Institute of
Cost & Management Accountants of India. Also a Certified
Associate of the Indian Institute of Banking & Finance
Mr. Reddy N J, General Manager
• Masters Degree in Commerce & LLB
Mr. Shelly Joseph, General Manager
• Masters Degree in Commerce & CAIIB

59
Award Wins
Won Digital India Excellence Award 2017
Digital India Excellence Award 2017 for its innovation in mobile app ‘Digital e-lock’ in the 5th PAN-IIM World Management Awards 2017
60
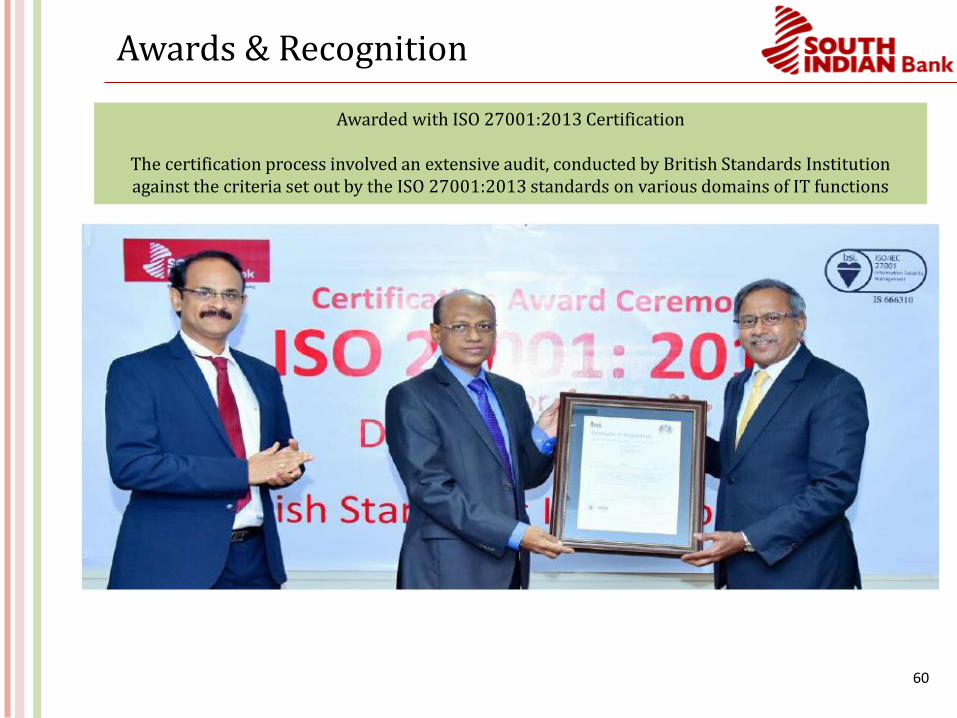
Awards & Recognition
Awarded with ISO 27001:2013 Certification
The certification process involved an extensive audit, conducted by British Standards Institution against the criteria set out by the ISO 27001:2013 standards on various domains of IT functions

61
Awards & Recognition
Won National Payments Excellence Awards -2016
Won Finnoviti Award - 2017
Won “IBA Banking Technology Awards”
62
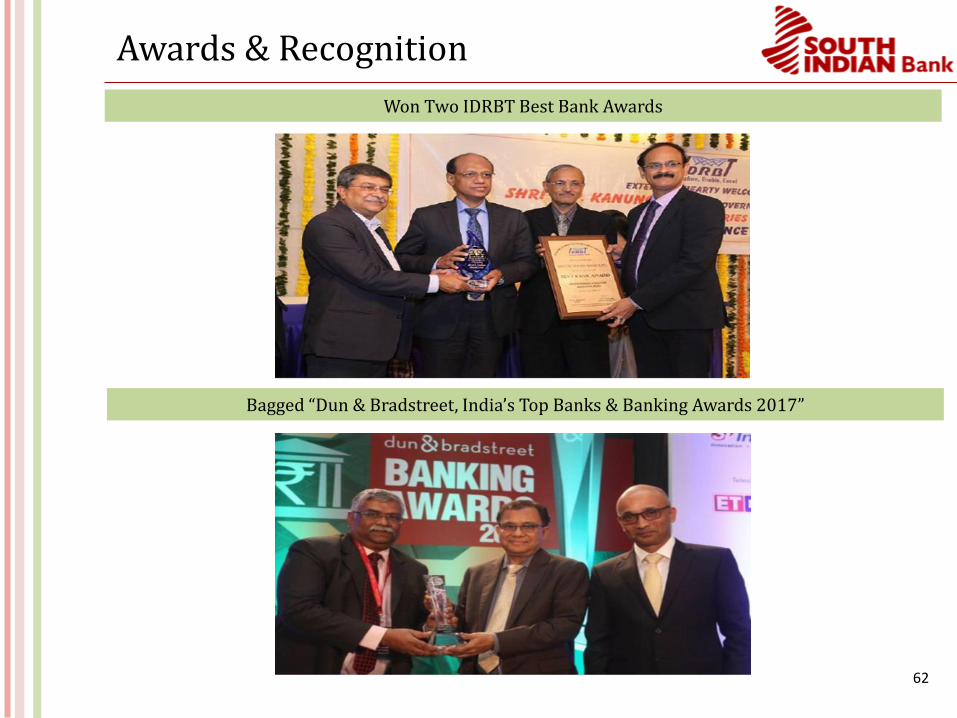
Awards & Recognition
Won Two IDRBT Best Bank Awards
Bagged “Dun & Bradstreet, India’s Top Banks & Banking Awards 2017”
63
Company Investor Relations Advisors
The South Indian Bank Ltd.CIN – L65191KL1929PLC001017Mr. C. P. Gireesh, CFO/Mr. Vijith S, Dy. General Manager [email protected]@sib.co.in
www.southindianbank.com
Strategic Growth Advisors Pvt. Ltd.CIN - U74140MH2010PTC204285Mr. Shogun Jain/ Mr. Sagar [email protected] / [email protected]+91 77383 77756 / +91 98205 19303www.sgapl.net
For further information, please contact: