Embed Size (px)
Citation preview

Investor Presentation
June 2005

2
CONFIDENTIAL \\nnyc14p20004\HMosbach$\UAP\IPO\UAP IPO Roadshow_3.ppt /2
Forward Looking Statements and Non-GAAP Measures
This presentation may contain statements that are forward looking, as that term is defined by the Private Securities Litigation Reform Act of 1995 or by the Securities and Exchange Commission in its rules, regulations and releases. These statements include, but are not limited to, discussions regarding industry outlook, the company’s expectations regarding the performance of its business, its liquidity and capital resources and the other non-historical statements in the discussion and analysis. These forward-looking statements are based on management’s beliefs, as well as assumptions made by, and information currently available to, management. When used in this presentation, the words “believe,”“anticipate,” “estimate,” “expect,” “intend” and similar expressions are intended to identify forward-looking statements. Although management believes that the expectations reflected in these forward-looking statements are reasonable, it can give no assurance that these expectations will prove to have been correct. These statements are subject to certain risks, uncertainties and assumptions, including risks related to the seasonality of the company’s business and weather conditions in its markets, its substantial leverage and restrictions contained in its debt agreements, the possibility of liability for pollution and other damage that is not covered by insurance or that exceeds its insurance coverage, its dependence on rebate programs, and other risks identified and discussed under the caption "Risk Factors" in the Form 10-K, filed with the Securities and Exchange Commission on May 27, 2005, and in the other documents the company files with the SEC from time to time.

3
CONFIDENTIAL \\nnyc14p20004\HMosbach$\UAP\IPO\UAP IPO Roadshow_3.ppt /3
Forward Looking Statements and Non-GAAP Measures
This presentation uses the non-GAAP financial measures of EBITDA, adjusted EBITDA, free cash flow and average trade working capital. These financial measures exclude the impact of gains on certain asset sales and expenses related to the company’s previously proposed offering of income deposit securities, the write-up of inventory to fair market value, the transition services provided by ConAgra Foods and the management fees paid to Apollo. We believe that EBITDA, adjusted EBITDA, free cash flow and average trade working capital best reflect our ongoing performance and business operations during the periods presented and are more useful to investors for comparative purposes. In addition, management uses these financial measures in internal reporting, in its budgeting and long-range planning processes and in determining performance-based compensation.
The presentation of EBITDA, adjusted EBITDA, free cash flow and average trade working capital is intended to supplement investors’ understanding of our operating performance. These non-GAAP financial measures may not be comparable to similar measures used by other companies. Furthermore, these non-GAAP financial measures are not intended to replace net income (loss), cash flows, financial position, comprehensive income (loss), and working capital, as determined in accordance with principles generally accepted in the United States.

COMPANY STORY
Kenny Cordell – Chief Executive Officer

5
CONFIDENTIAL \\nnyc14p20004\HMosbach$\UAP\IPO\UAP IPO Roadshow_3.ppt /5
Strong, Proven Management Team
Kenny CordellPresident & CEO
Dave BullockExecutive Vice President
& CFO
Joined UAP in November 2001Over 25 years of agricultural industry experience, including positions with FMC (10 years), BASF (3 years) and Rohm & Haas (10 years)
Joined UAP in June 2002Over 13 years of industry experience including positions with FMC (7 years) and Air Products and Chemicals (4 years)
Management has over an 8% ownership stake in UAP on a fully diluted basis

6
CONFIDENTIAL \\nnyc14p20004\HMosbach$\UAP\IPO\UAP IPO Roadshow_3.ppt /6
Competitive Strengths
Largest independent distributor of agricultural inputs in the U.S. and Canada in a large yet fragmented industry
Unrivaled nationwide distribution network with 1,100 sales people
Multiple opportunities to leverage existing distribution channel for growth
Strong free cash flow generation
Strong management team with significant shareholder interest alignment

7
CONFIDENTIAL \\nnyc14p20004\HMosbach$\UAP\IPO\UAP IPO Roadshow_3.ppt /7
Agricultural Inputs - Large and Stable Industry
331.2 326.3 325.4 326.5 319.5 325.7 318.3 333.7 332.1 330.0 329.6 328.3 324.8 327.9318.0
1988 1989 1990 1991 1992 1993 1994 1995 1996 1997 1998 1999 2000 2001 2003
Planted Acres(in millions)
Source: USDA
Chemicals Fertilizer Seed
1993 1994 1995 1996 1997 1998 1999 2000 2001 2002 2003
$20.3 $21.8 $23.2 $25.6 $26.6 $26.8 $25.7 $26.0 $27.1 $26.8 $27.7
$6.7
$8.4$5.2
$7.2
$9.2
$5.4
$7.7
$10.0
$5.5
$8.5
$10.9
$6.2
$9.0
$10.9
$6.7
$9.0
$10.6
$7.2
$8.6
$9.9
$7.2
$8.5
$7.5
$8.6
$10.3
$8.2
$8.9
$9.6
$8.3
$8.4
$10.0
$9.3
10.0
Farm Production Expenditures($ in billions)
Planted acres have remained stable over the past 15 years
Farm production expenditures have grown at a CAGR of 3.2% over the past 10 years
CAGR = 3.2%
8
CONFIDENTIAL \\nnyc14p20004\HMosbach$\UAP\IPO\UAP IPO Roadshow_3.ppt /8
$0
$200
$400
$600
$800
$1,000
$1,200
$1,400
$1,600
UAP HelenaChemical
Wilbur-Ellis
Royster-Clark
Agrillance SouthernStates
Cooperative
Simplot WesternFarm
Service
CropProductionServices
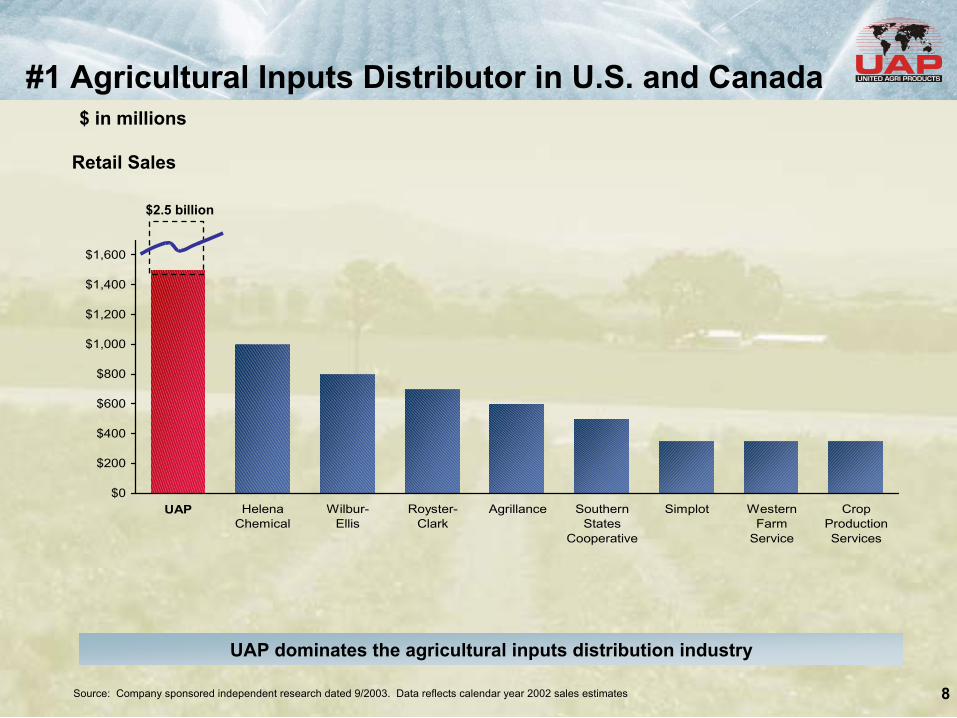
#1 Agricultural Inputs Distributor in U.S. and Canada
Retail Sales
$2.5 billion
Source: Company sponsored independent research dated 9/2003. Data reflects calendar year 2002 sales estimates
UAP dominates the agricultural inputs distribution industry
$ in millions

9
CONFIDENTIAL \\nnyc14p20004\HMosbach$\UAP\IPO\UAP IPO Roadshow_3.ppt /9
Unrivaled Nationwide Distribution Network
Extensive distribution network creates a significant competitive advantage for UAP
Greenville, MS
Greeley, CO
Fremont, NE
Billings, MT
Caldwell, ID
3 formulation facilities330 retail/wholesale facilities3,300 employees1,100 sales peoplesales peopleCorporate Headquarters
Formulation FacilitiesRetail Facility

10
CONFIDENTIAL \\nnyc14p20004\HMosbach$\UAP\IPO\UAP IPO Roadshow_3.ppt /10
Significant Growth Opportunities within Existing Markets
Focused strategy to close market share gaps on a territory-by-territory basis primarily with existing customer base
TotalMarket
Size($ billion)
5%
$10 $20
Seed3% Market Share
Fertilizer5% Market Share
MarketShare
Non-crop7%
MarketShare
Chemicals19% Market Share
$30
10%
15%
20%
$3.2 Billion Market Opportunity
Source: UAP Management estimates

11
CONFIDENTIAL \\nnyc14p20004\HMosbach$\UAP\IPO\UAP IPO Roadshow_3.ppt /11
Multiple Opportunities for Growth
Industry Consolidation
Seed
Private Label
Fertilizer
UAP and other national distributors gaining market share
12% CAGR since 2001 (17% in 2005)
Rapidly increasing share of overall sales (100bps increase in 2005)
Growth opportunity with existing customer base
15% Adjusted EBITDA FY2005 year-over-year growth

FINANCIAL OVERVIEW
Dave Bullock – Chief Financial Officer

13
CONFIDENTIAL \\nnyc14p20004\HMosbach$\UAP\IPO\UAP IPO Roadshow_3.ppt /13
Key Financial Characteristics
Stable and growing revenue streamCustomer and geographic diversificationStable end market demandContinued market share growth
Several margin enhancement opportunitiesPrivate LabelAdditional cost savings from best practicesScalable footprint
Strong free cash flow generationHigh return on invested capital97% of EBITDA converted to operating free cash flow (FY2005)Growth requires minimal capital expendituresSignificant working capital reduction opportunities
14
CONFIDENTIAL \\nnyc14p20004\HMosbach$\UAP\IPO\UAP IPO Roadshow_3.ppt /14
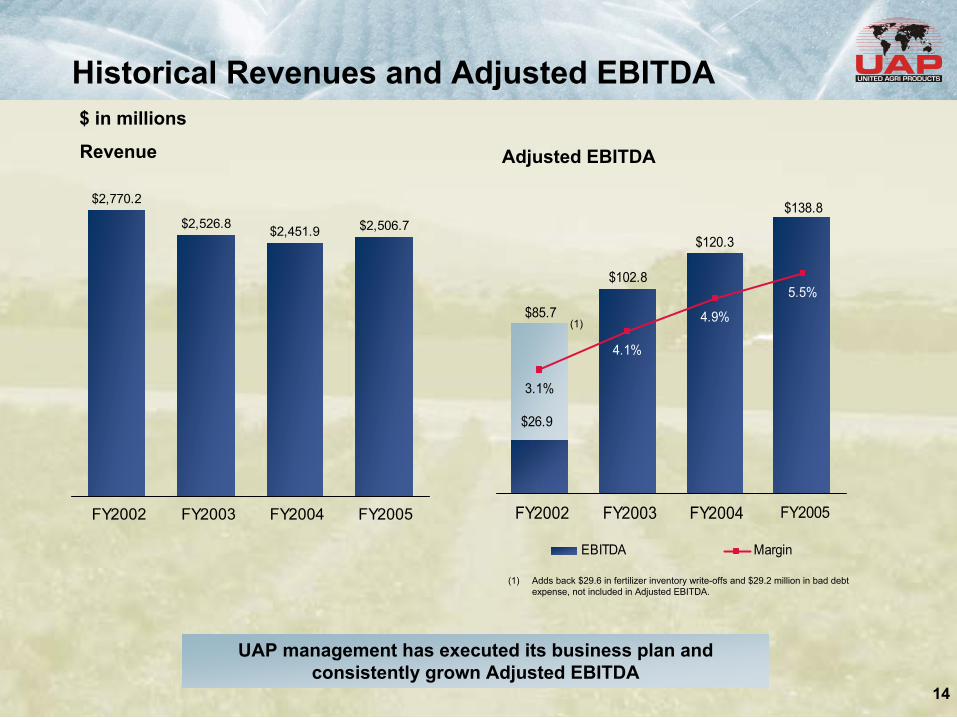
Historical Revenues and Adjusted EBITDA
$26.9
4.1%
4.9%
5.5%
3.1%
EBITDA Margin
FY2002 FY2003 FY2004 FY2005
$85.7
$102.8
$120.3
$138.8$
Revenue Adjusted EBITDA
(1)
(1) Adds back $29.6 in fertilizer inventory write-offs and $29.2 million in bad debt expense, not included in Adjusted EBITDA.
UAP management has executed its business plan and consistently grown Adjusted EBITDA
$ in millions
$2,506.7$2,451.9$2,526.8
$2,770.2
FY2002 FY2003 FY2004 FY2005

15
CONFIDENTIAL \\nnyc14p20004\HMosbach$\UAP\IPO\UAP IPO Roadshow_3.ppt /15
Highly Effective Working Capital Management
Average Trade Working Capital1 Average trade working capital has been reduced by more than half since 2002
Significant opportunities for further trade working capital improvements through:
Faster collection of supplier rebatesExtending accounts payable with several suppliersContinued implementation of Market Segmentation Analysis to drive SKU reductionIncreased Supplier Segmentation to drive further cooperation from suppliers
Our long-term goal is to reduce trade working capital below 10% of sales
¹ Represents monthly average trade working capital excluding cash and short-term debt.
$355.8
$739.9
$599.3
$476.2
14.2%
23.7%
26.7%
19.4%
Aver
age
Trad
e W
orki
ng C
apita
l ($M
M)
% o
f Net
Sal
es
FY2002 FY2003 FY2004 FY2005
$ in millions

16
CONFIDENTIAL \\nnyc14p20004\HMosbach$\UAP\IPO\UAP IPO Roadshow_3.ppt /16
Strong 2005 Free Cash Flow Generation
Approximately 60% of Adjusted EBITDA converted to After-tax Free Cash Flow
Working capital improvements will drive additional free cash flow generation
Flexible operating model:Variable cost structureLow capital expenditure requirementsEfficient working capital management
Adjusted EBITDA $138.8
Maintenance Capex (4.8)
Operating Free Cash Flow $134.0
% of Adjusted EBITDA 96.5%
Cash Interest (31.8)
Cash Taxes (18.7)
After-tax Free Cash Flow $83.5
% of Adjusted EBITDA 60.2%
$ in millions
17
CONFIDENTIAL \\nnyc14p20004\HMosbach$\UAP\IPO\UAP IPO Roadshow_3.ppt /17
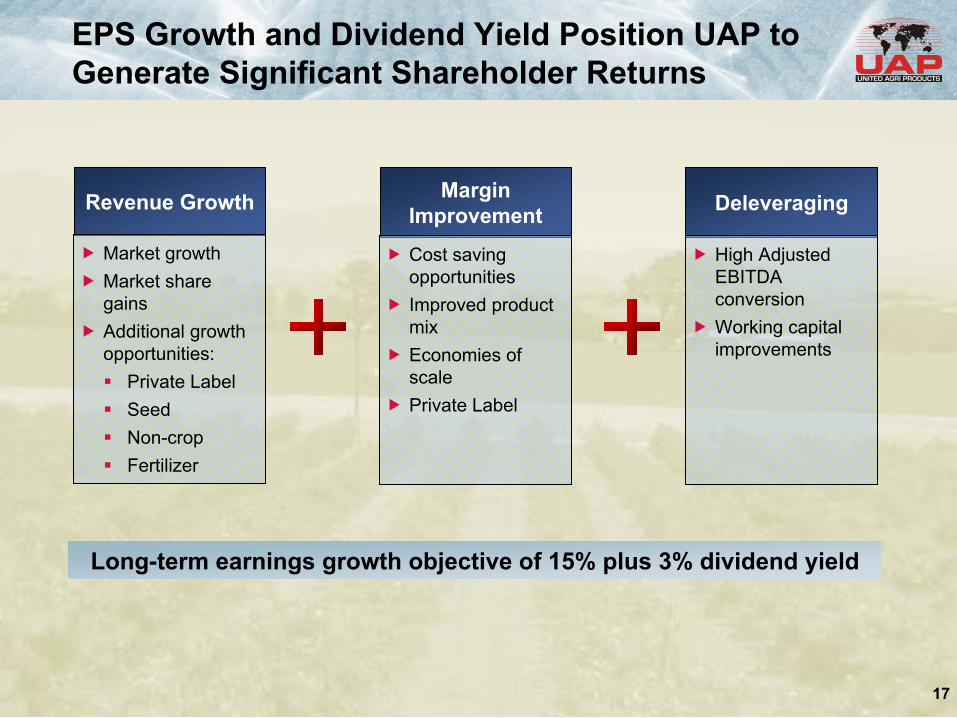
EPS Growth and Dividend Yield Position UAP to Generate Significant Shareholder Returns
Revenue Growth
Market growthMarket share gainsAdditional growth opportunities:
Private LabelSeedNon-cropFertilizer
Margin Improvement
Cost saving opportunitiesImproved product mixEconomies of scalePrivate Label
Deleveraging
High Adjusted EBITDA conversionWorking capital improvements
Long-term earnings growth objective of 15% plus 3% dividend yield

Selected Discussion Topics

19
CONFIDENTIAL \\nnyc14p20004\HMosbach$\UAP\IPO\UAP IPO Roadshow_3.ppt /19
Selected Topics
Seasonality Revisited
Working Capital
Understanding UAP’s Trade Working Capital
Average vs. Period End
Supplier Prepays
Rebates

20
CONFIDENTIAL \\nnyc14p20004\HMosbach$\UAP\IPO\UAP IPO Roadshow_3.ppt /20
Seasonality of Business
Despite quarterly fluctuations good visibility early on for the full year
Mar Jun Sept MarDec
Planting starts in March in southern states and continues through June in northern statesRevenue: Farmers purchase seed, some of which has been prepaid
Growers apply chemical treatment (application patterns/mix vary by region)Revenue: Farmers purchase chemicals, some of which have been prepaid
Harvest starts in August and continues as late as NovemberCash in: Collection of receivables (supplier and customer), grower prepays for upcoming chemicals, seed and fertilizer purchases
Cash out: UAP may selectively prepay suppliers for fertilizer
Growers apply fertilizers in advance of next planting seasonRevenue: Farmers purchase fertilizerCash-in: Receivables collection (supplier and customer)
Cash-out: UAP may prepay for early season discounts on seeds and chemicalsCash-in: Receivable collection from supplier
PlantingHarvesting
Fertilizer Application

21
CONFIDENTIAL \\nnyc14p20004\HMosbach$\UAP\IPO\UAP IPO Roadshow_3.ppt /21
Seasonality of Business – 2005 Revenue and Adjusted EBITDA
$277
$704
$1,259
$267
$78
$51
$(28)
$38
$(500)
$0
$500
$1,000
$1,500
Rev
enue
s
$(30)
$(10)
$10.0
$30.0
$50.0
$70.0
$90.0
Revenues Adjusted EBITDA
Mar Jun Sep Dec Mar
Q1 Q2 Q3 Q4
Despite quarterly fluctuations good visibility early on for the full year
$ in millions
Adjusted EB
ITDA
PlantingHarvesting
Fertilizer Application

22
CONFIDENTIAL \\nnyc14p20004\HMosbach$\UAP\IPO\UAP IPO Roadshow_3.ppt /22
UAP Trade Working Capital¹
¹ Trade working capital is defined as working capital excluding cash and short-term debt. See Non-GAAP reconciliation in Appendix.
$552.6$589.4
$545.5
$53.6
$499.9
$208.6
$298.9
$447.4
Q1 Q2 Q3 Q4
2004 2005 2004 Average 2005 Average
2004Average$476.2
~$120mm Reduction
2005Average$355.7
$ in millions

23
CONFIDENTIAL \\nnyc14p20004\HMosbach$\UAP\IPO\UAP IPO Roadshow_3.ppt /23
Understanding UAP’s Trade Working Capital -Customer and Rebate Receivables
2004 and 2005 2004 and 2005 Quarterly BalancesQuarterly Balances DriversDrivers
SalesEarly collectionsRebates tend to grow over time
Sales growthTiming of sales (weather)Credit policyRegional climate disruptions
$694$555
$381
$156
$793
$577$440
$212
$475
Q1 Q2 Q3 Q4
$112 $106
$15
$103$129
$91
$23$50
$73
Q1 Q2 Q3 Q4
OpportunityOpportunity
Faster collection from suppliersCollected $163 million by December 1, 2004
Shift to private labels eliminates rebates
Limited opportunity
2004 and 2005 2004 and 2005 Quarterly BalancesQuarterly Balances DriversDrivers OpportunityOpportunity
$ in millions
Customer ReceivablesCustomer Receivables
Rebate ReceivablesRebate Receivables
2004 2005 2005 Average
2004 2005 2005 Average

24
CONFIDENTIAL \\nnyc14p20004\HMosbach$\UAP\IPO\UAP IPO Roadshow_3.ppt /24
Understanding UAP’s Trade Working Capital -Inventory
$ in millions
Weather delaying salesAdvance of purchase of rescue productsLevel of supplier prepays$688
$452
$475
$641
$450
$491
$697
$594
$556
Q1 Q2 Q3 Q4
SKU reductionSupply chain efficienciesRegional improvement driven by KPI metrics
2004 and 2005 2004 and 2005 Quarterly BalancesQuarterly Balances DriversDrivers
OpportunityOpportunity
2004 2005 2005 Average

25
CONFIDENTIAL \\nnyc14p20004\HMosbach$\UAP\IPO\UAP IPO Roadshow_3.ppt /25
Understanding UAP’s Trade Working Capital -Supplier Prepay
2004 and 2005 2004 and 2005 Quarterly BalancesQuarterly Balances
$ in millions
DriversDrivers
OpportunityOpportunity
$0
$14 $14
$58
$28
$149
$42$39
$62
Q1 Q2 Q3 Q4
Discounts offered versus cost of short-term debtAdvances from customers
Discretionary—limited opportunity
2004 2005 2005 Average

26
CONFIDENTIAL \\nnyc14p20004\HMosbach$\UAP\IPO\UAP IPO Roadshow_3.ppt /26
Understanding UAP’s Trade Working Capital -Accounts Payable
$ in millions
Level of customer advancesLevel of supplier prepaySupplier early payment discounts
$757
$387$356
$689
$996
$823
$557 $532
$685
Q1 Q2 Q3 Q4
2004 2005 2005 Average
Continue to work with suppliersSeed growth will drive customer advances
2004 and 2005 2004 and 2005 Quarterly BalancesQuarterly Balances DriversDrivers
OpportunityOpportunity

27
CONFIDENTIAL \\nnyc14p20004\HMosbach$\UAP\IPO\UAP IPO Roadshow_3.ppt /27
Seasonality of Business – 2005 Trade Working Capital and Revolver
$447
$299
$500
$209
$34
$180$212
$(48)$(100)
$0
$100
$200
$300
$400
$500
$600
Trade Working Capital Revolver Balance
Mar Jun Sep Dec Mar
Q1 Q2 Q3 Q4
Farming season drives quarterly fluctuations
$ in millions
Avg. Trade Working Capital 2005 = $356
Avg. Revolver 2005 = $94
PlantingHarvesting
Fertilizer Application
28
CONFIDENTIAL \\nnyc14p20004\HMosbach$\UAP\IPO\UAP IPO Roadshow_3.ppt /28
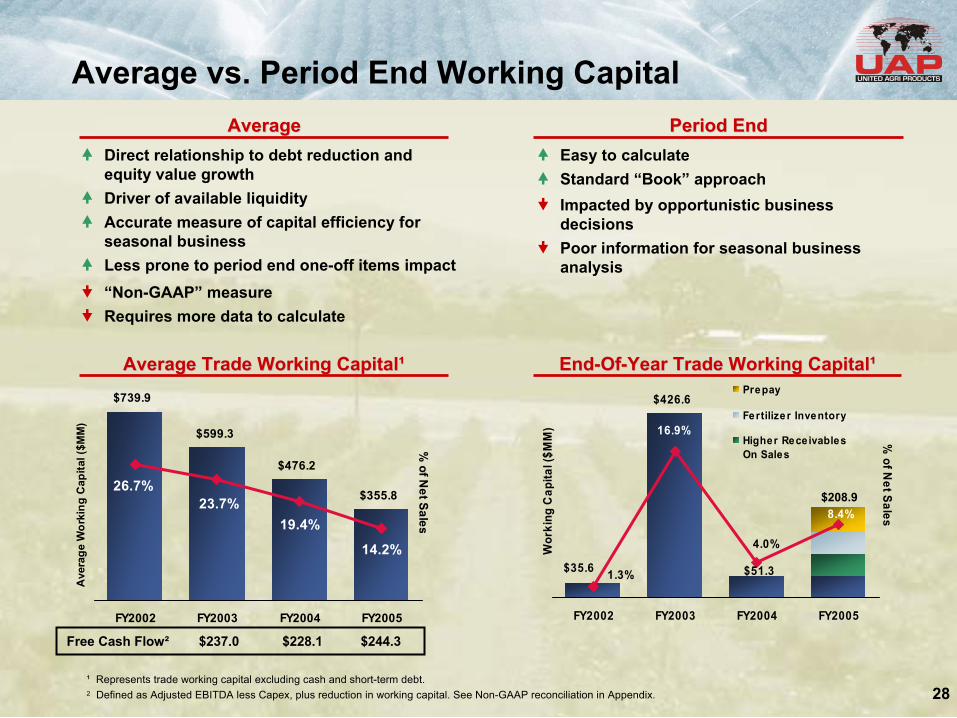
Average vs. Period End Working Capital
$739.9
$599.3
$476.2
$355.8
14.2%
19.4%23.7%
26.7%
FY2002 FY2003 FY2004 FY2005
Ave
rage
Wor
king
Cap
ital (
$MM
)
% of N
et Sales
¹ Represents trade working capital excluding cash and short-term debt.2 Defined as Adjusted EBITDA less Capex, plus reduction in working capital. See Non-GAAP reconciliation in Appendix.
EndEnd--OfOf--Year Trade Working CapitalYear Trade Working Capital¹¹Average Trade Working CapitalAverage Trade Working Capital¹¹
Easy to calculateStandard “Book” approach
Direct relationship to debt reduction and equity value growthDriver of available liquidityAccurate measure of capital efficiency for seasonal businessLess prone to period end one-off items impact
Impacted by opportunistic business decisionsPoor information for seasonal business analysis
“Non-GAAP” measureRequires more data to calculate
AverageAverage Period EndPeriod End
$51.3
$426.6
$35.6
8.4%
4.0%
1.3%
16.9%
FY2002 FY2003 FY2004 FY2005
Wor
king
Cap
ital (
$MM
)
% of N
et Sales
Prepay
Fertilizer Inventory
Higher ReceivablesOn Sales
$208.9
Free Cash Flow² $237.0 $228.1 $244.3
29
CONFIDENTIAL \\nnyc14p20004\HMosbach$\UAP\IPO\UAP IPO Roadshow_3.ppt /29
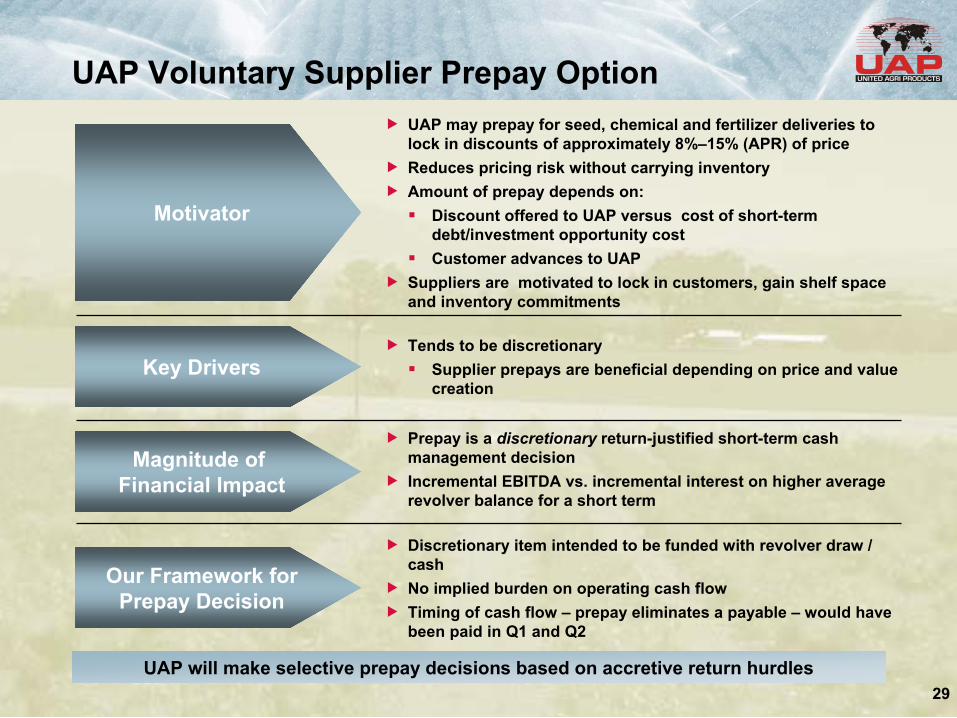
UAP Voluntary Supplier Prepay Option
Our Framework forPrepay Decision
Discretionary item intended to be funded with revolver draw / cashNo implied burden on operating cash flowTiming of cash flow – prepay eliminates a payable – would have been paid in Q1 and Q2
Key DriversTends to be discretionary
Supplier prepays are beneficial depending on price and value creation
Magnitude of Financial Impact
Prepay is a discretionary return-justified short-term cash management decisionIncremental EBITDA vs. incremental interest on higher average revolver balance for a short term
Motivator
UAP may prepay for seed, chemical and fertilizer deliveries to lock in discounts of approximately 8%–15% (APR) of priceReduces pricing risk without carrying inventoryAmount of prepay depends on:
Discount offered to UAP versus cost of short-term debt/investment opportunity costCustomer advances to UAP
Suppliers are motivated to lock in customers, gain shelf space and inventory commitments
UAP will make selective prepay decisions based on accretive return hurdles

30
CONFIDENTIAL \\nnyc14p20004\HMosbach$\UAP\IPO\UAP IPO Roadshow_3.ppt /30
Supplier Rebates
PurposeIndustry standardLegacy pricing mechanismApproximately 90% fixed under contracts
Rebate Mechanics
Accrued monthly on sales at historic ratesAccrued to rebate receivable
Balance received at regular intervals, and substantially all by end of February of each year
Typically results in income benefit at year-end
Ongoing ImprovementMeasures
Speeding up collectionContinue working with top suppliers
More private labels = less rebates = working capital opportunities
Products CoveredBranded chemicals (approximately 90% of all rebates)
Rate creep-up over time due to competition and mixBranded seed
Rebates are predictable and present a working capital opportunity
APPENDIX

32
CONFIDENTIAL \\nnyc14p20004\HMosbach$\UAP\IPO\UAP IPO Roadshow_3.ppt /32
Non-GAAP Reconciliation: Trade Working Capital
208.6447.4499.9298.953.7545.5589.4552.6Trade Working Capital
0.1211.6180.342.1----Short Term Debt
-10.036.7--11.6--Checks not Yet Presented
48.2-14.67.8172.6---Cash
$256.7$225.9$297.5$264.6$226.3$533.8$589.4$552.6Working Capital
4th Qtr3rd Qtr2nd Qtr1ST Qtr4th Qtr3rd Qtr2nd Qtr1ST Qtr
FY 05FY 04
$ in millions
33
CONFIDENTIAL \\nnyc14p20004\HMosbach$\UAP\IPO\UAP IPO Roadshow_3.ppt /33
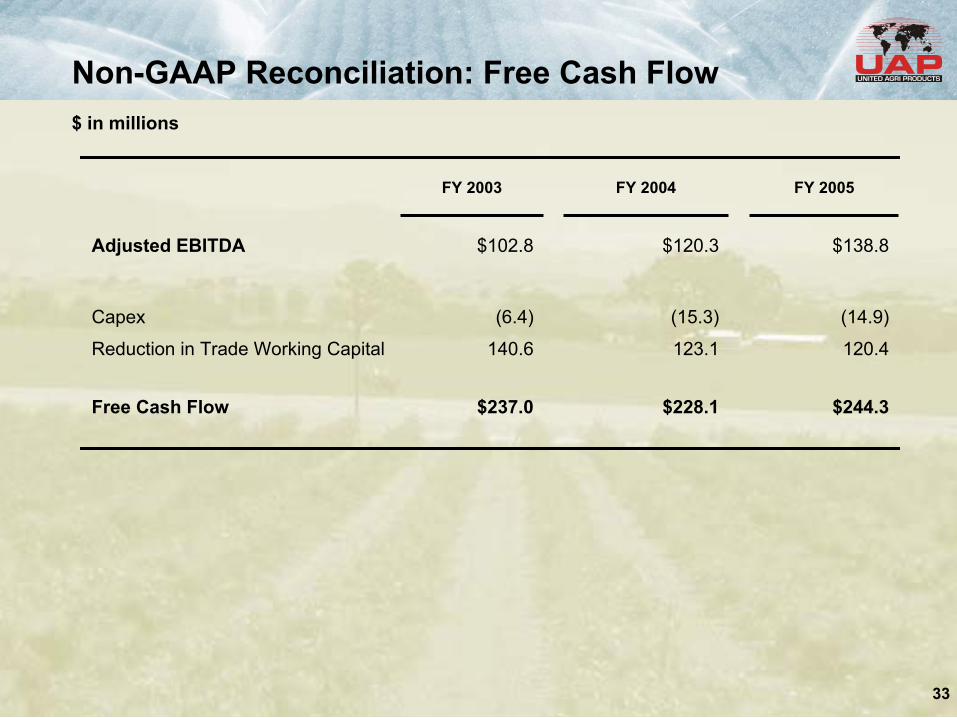
Non-GAAP Reconciliation: Free Cash Flow
$244.3$228.1$237.0Free Cash Flow
120.4123.1140.6Reduction in Trade Working Capital
(14.9)(15.3)(6.4)Capex
$138.8$120.3$102.8Adjusted EBITDA
FY 2005FY 2004FY 2003
$ in millions