Embed Size (px)
Citation preview

Conrad Lower Manhattan New York, New York
Investor PresentationDecember 2016
Disclaimer
1© 2016 Hilton Confidential and Proprietary
This presentation contains forward-looking statements within the meaning of Section 27A of the Securities Act of 1933, as amended, and Section 21E of the Securities Exchange
Act of 1934, as amended. These statements include, but are not limited to, statements related to our expectations regarding the performance of our business, our financial results,
our liquidity and capital resources, the planned spin-offs and other non-historical statements. You can identify these forward-looking statements by the use of words such as
“outlook,” “believes,” “expects,” “potential,” “continues,” “may,” “will,” “should,” “could,” “seeks,” “approximately,” “projects,” “predicts,” “intends,” “plans,” “estimates,” “anticipates” or
the negative version of these words or other comparable words. Such forward-looking statements are subject to various risks and uncertainties, including, among others, risks
inherent to the hospitality industry, macroeconomic factors beyond our control, competition for hotel guests, management and franchise agreements and timeshare sales, risks
related to doing business with third-party hotel owners, our significant investments in owned and leased real estate, performance of our information technology systems, growth of
reservation channels outside of our system, risks of doing business outside of the United States, risks related to our planned spin-offs and our indebtedness, as well as those
described under the section entitled “Risk Factors” in Hilton Worldwide Holdings Inc.’s Annual Report on Form 10-K for the year ended December 31, 2015, as such factors may be
updated from time to time in our periodic filings with the SEC, which are accessible on the SEC’s website at www.sec.gov. Accordingly, there are or will be important factors that
could cause actual outcomes or results to differ materially from those indicated in these statements. These factors should not be construed as exhaustive and should be read in
conjunction with the other cautionary statements that are included in this presentation and in our filings with the SEC. We undertake no obligation to publicly update or review any
forward-looking statement, whether as a result of new information, future developments or otherwise, except as required by law.
This presentation includes certain non-GAAP financial measures, including Adjusted earnings before interest expense, taxes, depreciation and amortization (“Adj. EBITDA”), Adj.
EBITDA Margin, Net Debt, Net Debt / Adj. EBITDA and Free Cash Flow. Non-GAAP financial measures Adj. EBITDA, Adj. EBITDA Margin, Net Debt, Net Debt / Adj. EBITDA and
Free Cash Flow should be considered only as supplemental to, and not as superior to, financial measures prepared in accordance with U.S. GAAP. Please refer to the Appendix
and footnotes of this presentation for a reconciliation of the historical non-GAAP financial measures included in this presentation to the most directly comparable financial measures
prepared in accordance with U.S. GAAP. In addition, this presentation includes projected Pro Forma Adjusted EBITDA and Pro Forma net leverage ratio information as of and for
the year ending December 31, 2016 for each of Hilton, Park Hotels & Resorts (“Park”) and Hilton Grand Vacations (“HGV”). Reconciliations of projected Pro Forma Adjusted
EBITDA and Pro Forma net leverage ratio to measures calculated in accordance with GAAP are not available without unreasonable effort due to the unavailability of certain
information needed to calculate certain reconciling items. Additionally, this financial information does not represent pro forma results prepared in according with Regulation S-X and
does not include all adjustments that might be required under Regulation S-X, and actual pro forma results could differ materially.
Slides in this presentation include certain Adj. EBITDA amounts that are used only for illustrative purposes to present illustrative Adj. EBITDA amounts by applying assumptions to
existing room pipeline, increases of in-place rates and increases in RevPAR, as applicable, in each case based on twelve months ended (“LTM”) 9/30/2016 information. These
amounts do not represent projections of future results and may not be realized. Value information on such slides that is derived from such illustrative Adj. EBITDA amounts is
indicative only, based upon a number of assumptions, and does not reflect actual valuation. Please review carefully the detailed footnotes in this presentation.
We have disclosed more details about the proposed spin-offs in registration statements with the SEC, as they may be amended from time to time, including financial and other
details. The transactions are subject to a number of conditions and other customary matters. The spin-offs are expected to be completed around year-end but there can be no
assurance regarding the ultimate timing of the spin-offs or that either or both of the spin-offs will ultimately occur.

What we have accomplished
2© 2016 Hilton Confidential and Proprietary
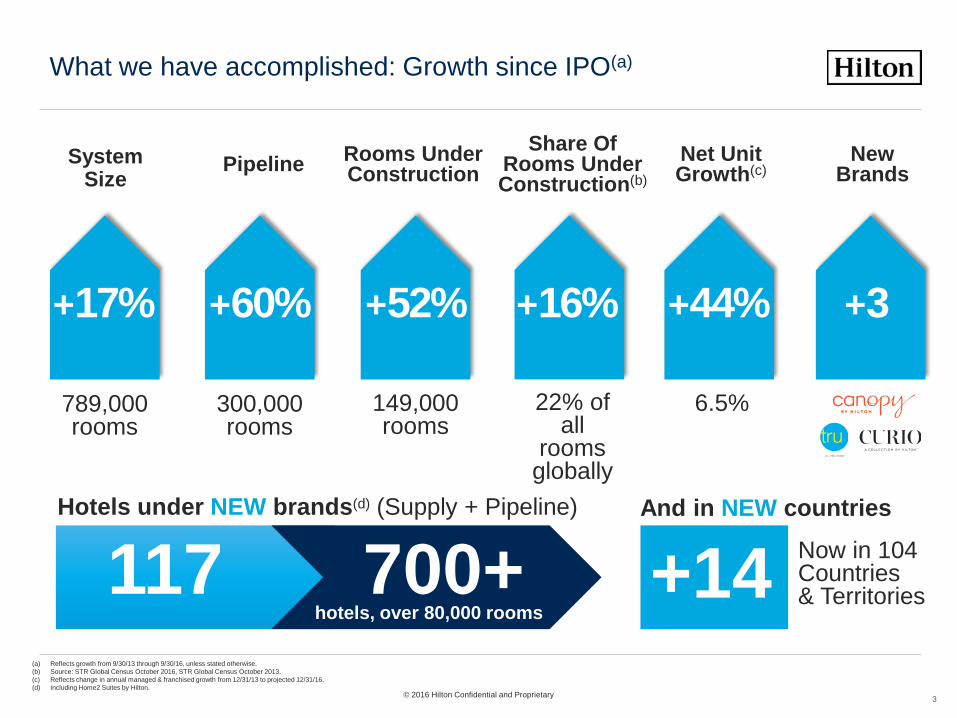
What we have accomplished: Growth since IPO(a)
System Size
+52%
149,000 rooms
+17%
Rooms Under Construction
789,000 rooms
+16%
22% of all
rooms globally
Share Of Rooms Under Construction(b)
New Brands
+3
Net Unit Growth(c)
+44%
6.5%
Hotels under NEW brands(d) (Supply + Pipeline)
Pipeline
+60%
300,000 rooms
117 700+hotels, over 80,000 rooms
(a) Reflects growth from 9/30/13 through 9/30/16, unless stated otherwise.
(b) Source: STR Global Census October 2016, STR Global Census October 2013.
(c) Reflects change in annual managed & franchised growth from 12/31/13 to projected 12/31/16.
(d) Including Home2 Suites by Hilton.
3
And in NEW countries
+14Now in 104Countries & Territories
© 2016 Hilton Confidential and Proprietary
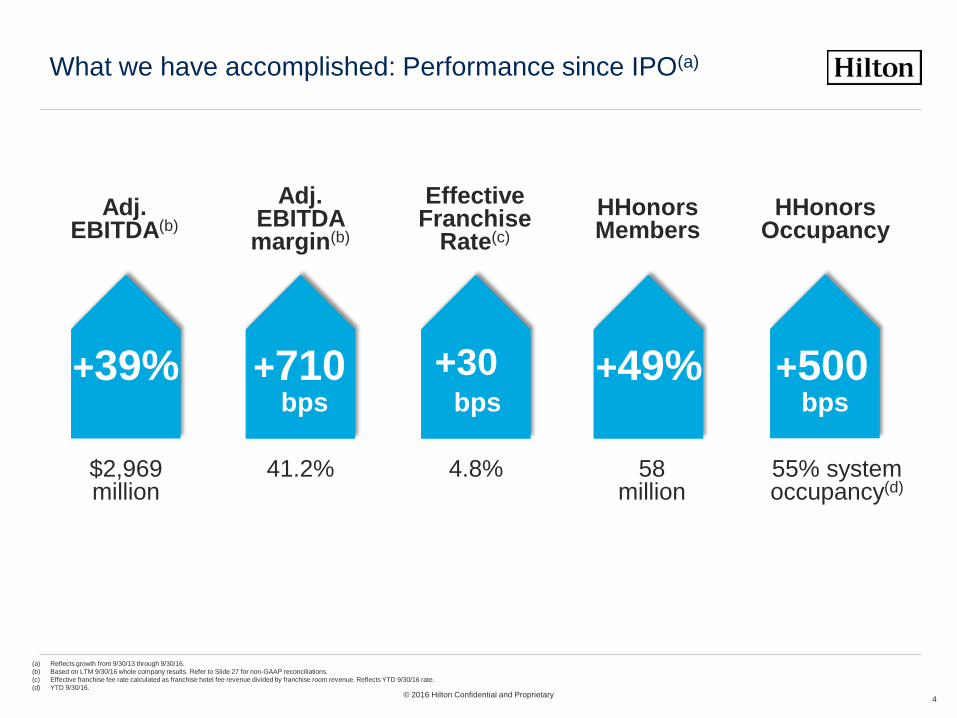
What we have accomplished: Performance since IPO(a)
4
+39%
$2,969 million
Adj. EBITDA(b)
41.2%
Adj. EBITDA margin(b)
+710
Effective Franchise
Rate(c)
+30
4.8% 58 million
HHonors Members
+49%
55% system occupancy(d)
HHonors Occupancy
+500bps bps bps
(a) Reflects growth from 9/30/13 through 9/30/16.
(b) Based on LTM 9/30/16 whole company results. Refer to Slide 27 for non-GAAP reconciliations.
(c) Effective franchise fee rate calculated as franchise hotel fee revenue divided by franchise room revenue. Reflects YTD 9/30/16 rate.
(d) YTD 9/30/16.© 2016 Hilton Confidential and Proprietary
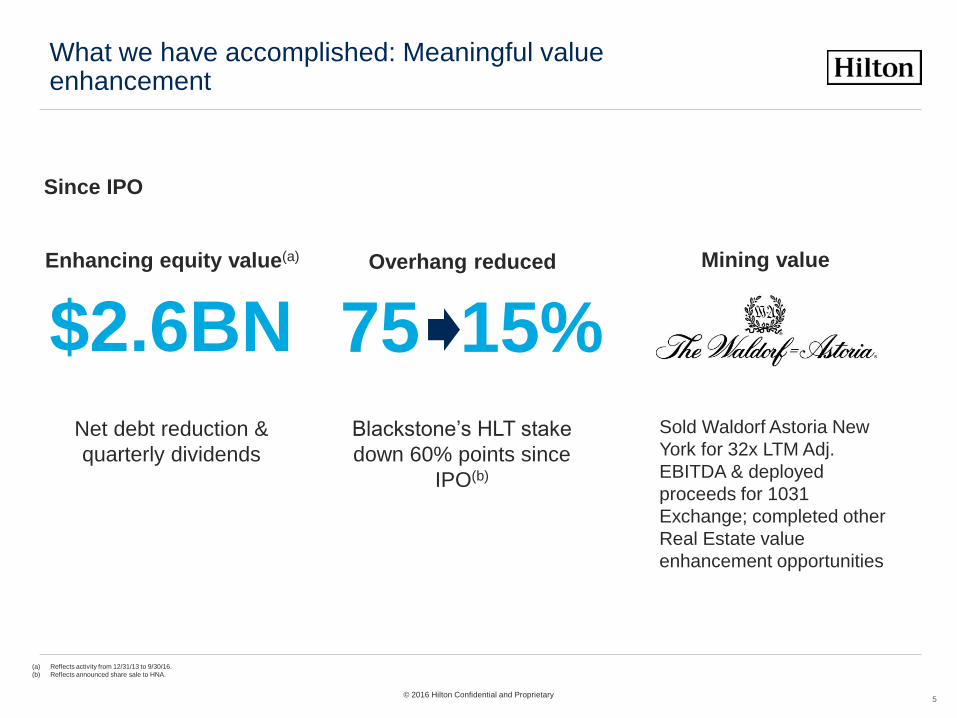
What we have accomplished: Meaningful value enhancement
($ in millions)
Net debt reduction &
quarterly dividends
$2.6BNEnhancing equity value(a)
Sold Waldorf Astoria New
York for 32x LTM Adj.
EBITDA & deployed
proceeds for 1031
Exchange; completed other
Real Estate value
enhancement opportunities
Blackstone’s HLT stake
down 60% points since
IPO(b)
75 15%Overhang reduced
($ in millions)
Since IPO
© 2016 Hilton Confidential and Proprietary
Mining value
(a) Reflects activity from 12/31/13 to 9/30/16.
(b) Reflects announced share sale to HNA.
5
Further catalysts for value
6
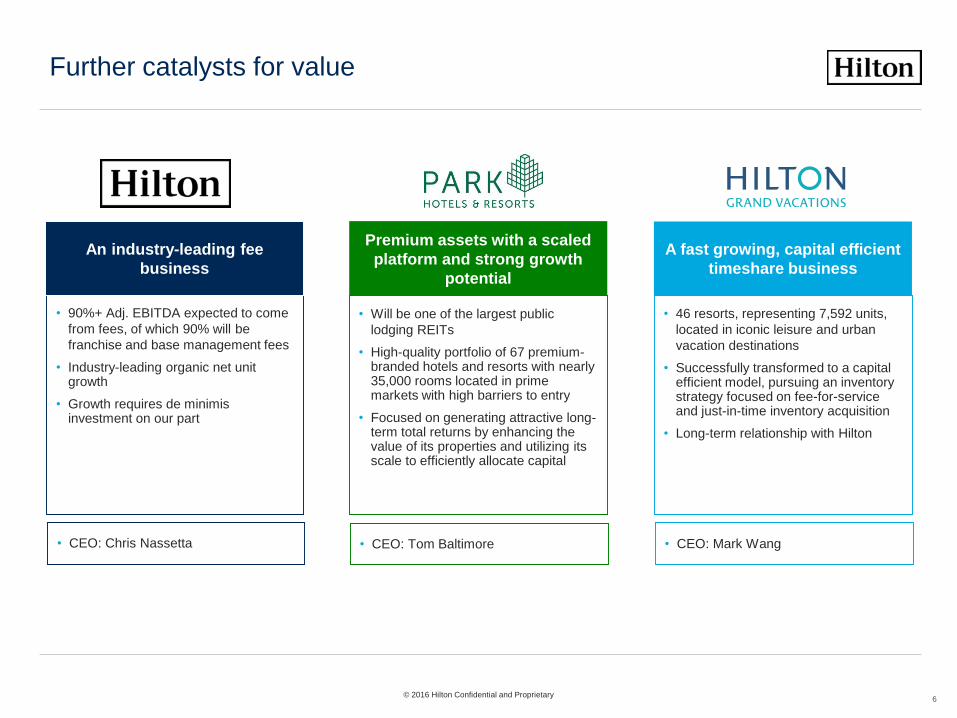
• 90%+ Adj. EBITDA expected to come
from fees, of which 90% will be
franchise and base management fees
• Industry-leading organic net unit growth
• Growth requires de minimis investment on our part
• Will be one of the largest public
lodging REITs
• High-quality portfolio of 67 premium-branded hotels and resorts with nearly 35,000 rooms located in prime markets with high barriers to entry
• Focused on generating attractive long-term total returns by enhancing the value of its properties and utilizing its scale to efficiently allocate capital
• 46 resorts, representing 7,592 units,
located in iconic leisure and urban
vacation destinations
• Successfully transformed to a capital efficient model, pursuing an inventory strategy focused on fee-for-service and just-in-time inventory acquisition
• Long-term relationship with Hilton
6
An industry-leading fee
business
Premium assets with a scaled
platform and strong growth
potential
A fast growing, capital efficient
timeshare business
• CEO: Chris Nassetta • CEO: Tom Baltimore • CEO: Mark Wang
© 2016 Hilton Confidential and Proprietary

Waldorf Astoria Resort Boca Raton, Florida
Company Overview
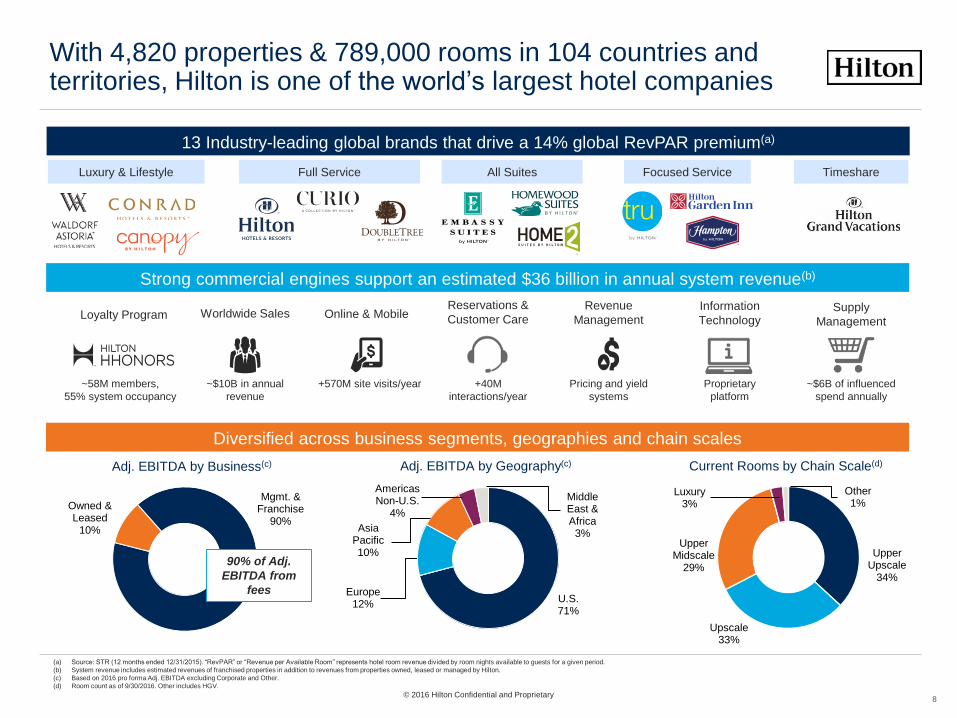
13 Industry-leading global brands that drive a 14% global RevPAR premium(a)
~58M members,
55% system occupancy
Loyalty Program Online & Mobile
+570M site visits/year
Revenue
Management
Pricing and yield
systems
Worldwide Sales
~$10B in annual
revenue
Reservations &
Customer Care
+40M
interactions/year
Supply
Management
~$6B of influenced
spend annually
Information
Technology
Proprietary
platform
(a) Source: STR (12 months ended 12/31/2015). “RevPAR” or “Revenue per Available Room” represents hotel room revenue divided by room nights available to guests for a given period.
(b) System revenue includes estimated revenues of franchised properties in addition to revenues from properties owned, leased or managed by Hilton.
(c) Based on 2016 pro forma Adj. EBITDA excluding Corporate and Other.
(d) Room count as of 9/30/2016. Other includes HGV.
With 4,820 properties & 789,000 rooms in 104 countries and territories, Hilton is one of the world’s largest hotel companies
8
Owned & Leased
10%
Mgmt. & Franchise
90%
Adj. EBITDA by Business(c) Adj. EBITDA by Geography(c) Current Rooms by Chain Scale(d)
U.S.71%
Europe12%
Asia Pacific10%
Americas Non-U.S.
4%
Middle East & Africa
3%
Upper Upscale
34%
Upscale 33%
Upper Midscale
29%
Luxury 3%
Other 1%
Strong commercial engines support an estimated $36 billion in annual system revenue(b)
Diversified across business segments, geographies and chain scales
Full Service All Suites Focused Service TimeshareLuxury & Lifestyle
© 2016 Hilton Confidential and Proprietary
90% of Adj.
EBITDA from
fees

Company value proposition
9
Hilton's scale, global presence and leading brands at multiple price points drive a “loyalty effect,” leading to
industry-leading performance for our hotel owners and the company
Leading Brands
serving virtually
any lodging need
anywhere
Satisfied,
Loyal
Customers
Premium,
Growing
Market ShareSatisfied
Owners
Leading
Hotel
Supply &
Pipeline
HLT Financial
Performance
• Award-winning brands that serve guests
for virtually any lodging need they have
anywhere in the world
• Leads to satisfied customers, including
approximately 58 million HHonors
loyalty members
• Creates a “loyalty effect” that drives a
strong global RevPAR premium of 14%
• These premiums drive strong financial
returns for the company and our hotel
owners
• Satisfied owners continue to invest in
growing Hilton’s brands, driving leading
organic net unit growth with de minimis
use of capital
• We believe the reinforcing nature of
these activities will allow Hilton to
outperform the competition
© 2016 Hilton Confidential and Proprietary

Value proposition supported by a disciplined strategy
10
• Performance-driven culture based on common vision, mission, values and key
strategic priorities
ALIGN CULTURE &
ORGANIZATION
STRENGTHEN
BRANDS &
COMMERCIAL
SERVICES PLATFORM
EXPAND GLOBAL
FOOTPRINT
MAXIMIZE
PERFORMANCE
• Maximize relevance of existing brands, and strategically add new brands
• Build on leading commercial capabilities to maximize revenues
• Lead in digital and personalization capabilities
• Drive deeper loyalty and more direct relationships with guests through HHonors
• Deliver industry-leading, high-quality organic net unit growth
• Fill market gaps with the right brand in the right location at the right time
• Expand luxury portfolio; execute China growth strategy
• Grow market share
• Grow free cash flow per share, preserve strong balance sheet, and accelerate
return of capital
© 2016 Hilton Confidential and Proprietary

• Target incremental market
segments, build network effect
• In last 7 years, have launched
Home2, Canopy, Curio and Tru,
currently ~20% of pipeline
Hilton’s brand portfolio is driving market-leading net unit growth . . .
Best performing brands
• Pure bred portfolio of clearly-defined brands, each leading their respective segments
• Consistent, compelling product and service offerings of clear value to guests and hotel owners
• Connected by best loyalty program and commercial engines in the business
Existing brands in current markets
• Highly fragmented market
presents opportunities for our
existing brands
• ~55% of pipeline
Existing brands in new markets
• Strategically deploy brands
globally
• Examples include HGI/Hampton in
China, DoubleTree in Europe
• ~25% of pipeline
Organically develop new brands
• Record pipelines across all brand segments
• Minimal HLT capital investment – current pipeline of ~300,000 rooms
represents only $140 million in HLT key money commitments
Resulting
in…
White space: Urban micro, Luxury Lifestyle,
Luxury & Upscale Collections, Hilton+
11© 2016 Hilton Confidential and Proprietary

. . . as seen in our system growth to date, all accomplished without brand acquisitions . . .
8
2007 Today % Growth
496,000 789,000 59%
111,000 169,000 52%
782,000 1,155,000 47%
564,000 754,000 34%
542,000 690,000 27%
487,000 575,000 18%
446,000 509,000 14%
Global System (# of Rooms)
(a)
(b)
(a)
Note: “2007” metrics are as of 6/30/2007, except for Hyatt which is as of 12/31/2007; “Today” metrics are as of 9/30/2016. This page contains additional trademarks, service marks and trade names of others, which are the property of their respective owners. All trademarks, service marks and trade
names appearing in this presentation are, to our knowledge, the property of their respective owners.
(a) Reflects MAR acquisition of HOT in both periods presented. Excludes timeshare properties due to lack of 2007 data availability for Starwood and Wyndham; Marriott spun off its timeshare business in 2011. Hilton growth excluding timeshare properties is 59%. Marriott growth including
timeshare is 47%.
(b) Accor data reflects sale of Motel 6 and Studio 6 brands and the acquisition of Fairmont Raffles Hotels International Group.
Source: Company filings
12© 2016 Hilton Confidential and Proprietary
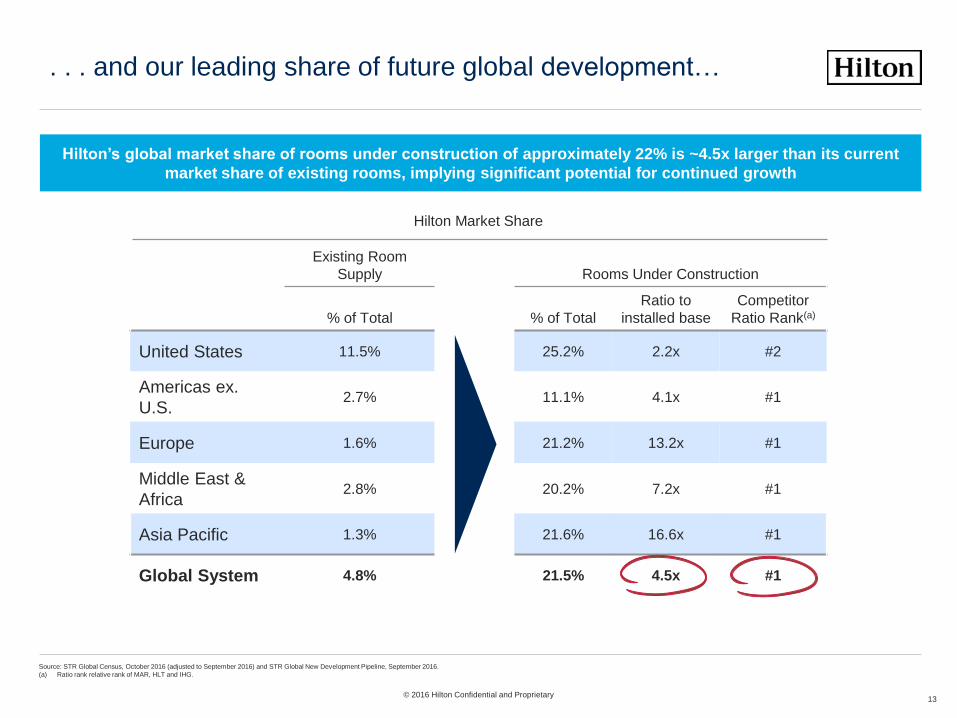
Existing Room
Supply Rooms Under Construction
% of Total % of Total
Ratio to
installed base
Competitor
Ratio Rank(a)
United States 11.5% 25.2% 2.2x #2
Americas ex.
U.S. 2.7% 11.1% 4.1x #1
Europe 1.6% 21.2% 13.2x #1
Middle East &
Africa2.8% 20.2% 7.2x #1
Asia Pacific 1.3% 21.6% 16.6x #1
Global System 4.8% 21.5% 4.5x #1
. . . and our leading share of future global development…
Hilton’s global market share of rooms under construction of approximately 22% is ~4.5x larger than its current
market share of existing rooms, implying significant potential for continued growth
Hilton Market Share
9
13
Source: STR Global Census, October 2016 (adjusted to September 2016) and STR Global New Development Pipeline, September 2016.
(a) Ratio rank relative rank of MAR, HLT and IHG.
© 2016 Hilton Confidential and Proprietary
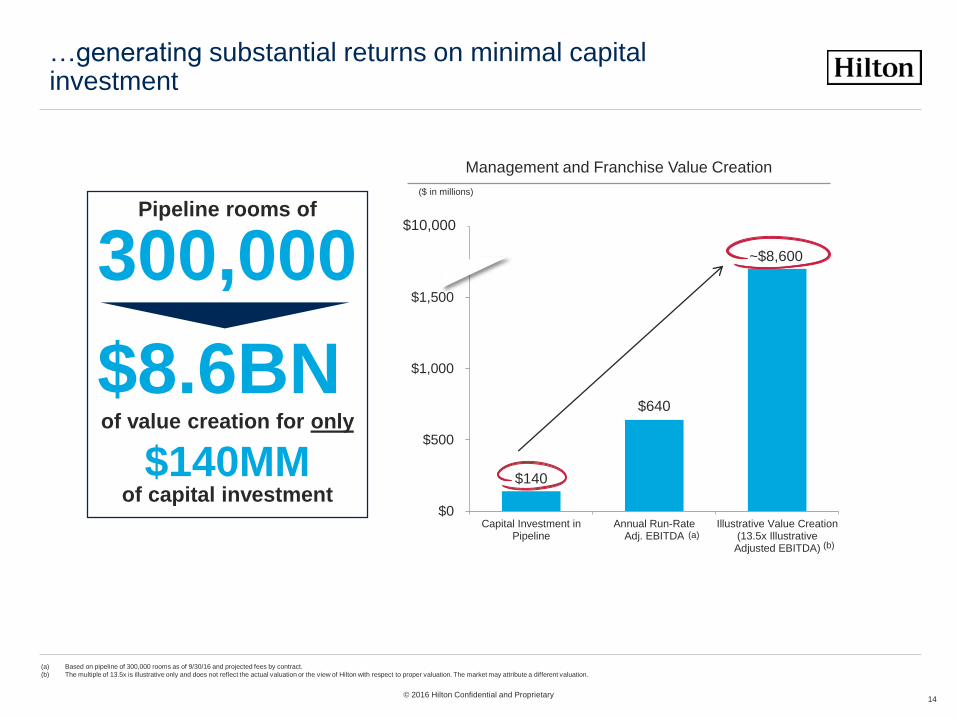
…generating substantial returns on minimal capital investment
14
Management and Franchise Value Creation
(a) Based on pipeline of 300,000 rooms as of 9/30/16 and projected fees by contract.
(b) The multiple of 13.5x is illustrative only and does not reflect the actual valuation or the view of Hilton with respect to proper valuation. The market may attribute a different valuation.
(b)
($ in millions)
$140
$640
~$8,600
$0
$500
$1,000
$1,500
$2,000
Capital Investment inPipeline
Annual Run-RateAdj. EBITDA
Illustrative Value Creation(13.5x IllustrativeAdjusted EBITDA)
(a)
$10,000
300,000Pipeline rooms of
$8.6BNof value creation for only
$140MMof capital investment
© 2016 Hilton Confidential and Proprietary
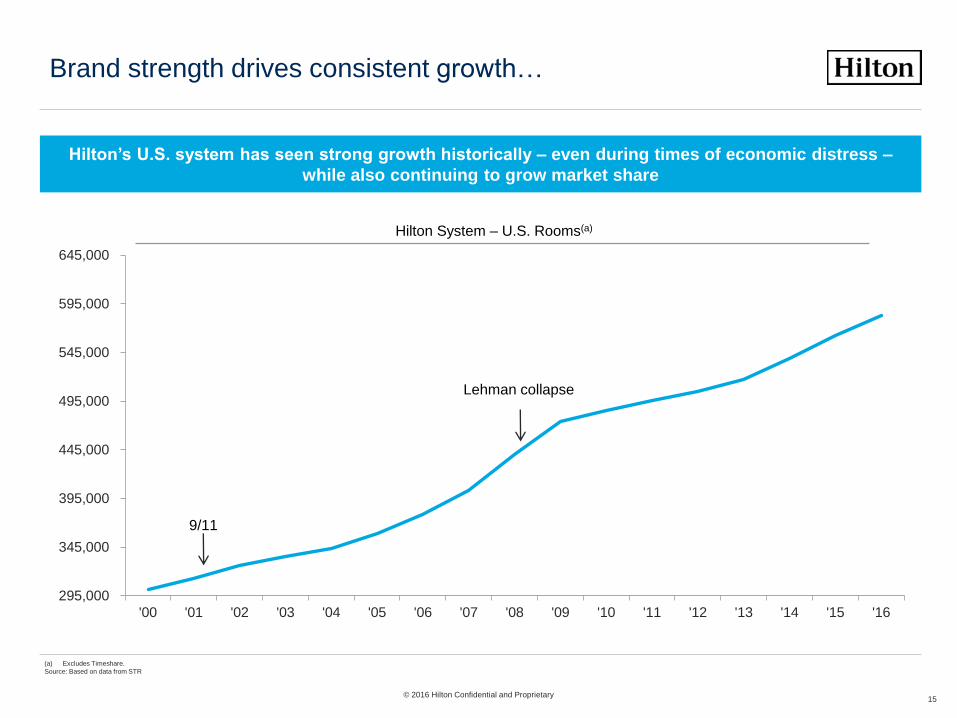
Hilton System – U.S. Rooms(a)
(a) Excludes Timeshare.
Source: Based on data from STR
Brand strength drives consistent growth…
Hilton’s U.S. system has seen strong growth historically – even during times of economic distress –
while also continuing to grow market share
15
295,000
345,000
395,000
445,000
495,000
545,000
595,000
645,000
'00 '01 '02 '03 '04 '05 '06 '07 '08 '09 '10 '11 '12 '13 '14 '15 '16
9/11
Lehman collapse
© 2016 Hilton Confidential and Proprietary

. . . supported by strong fundamentals
16
Growing base of customers that can and
want to travel
Hotel under-penetration in high growth
markets
Global middle
class
Hotel rooms per capita(a)
2x Last 20 years,
double again
next 20 years 15.8
1.5
Un
ite
d S
tate
s
Ch
ina
Global Tourist
Arrivals +1BNIncremental annual trips
expected over next 20
years
1.1
Bra
zil
0.2In
dia
Sources: STR, UNWTO, World Bank, OECD
(a) Hotel rooms as of December 2015, Population as of 2014.
© 2016 Hilton Confidential and Proprietary
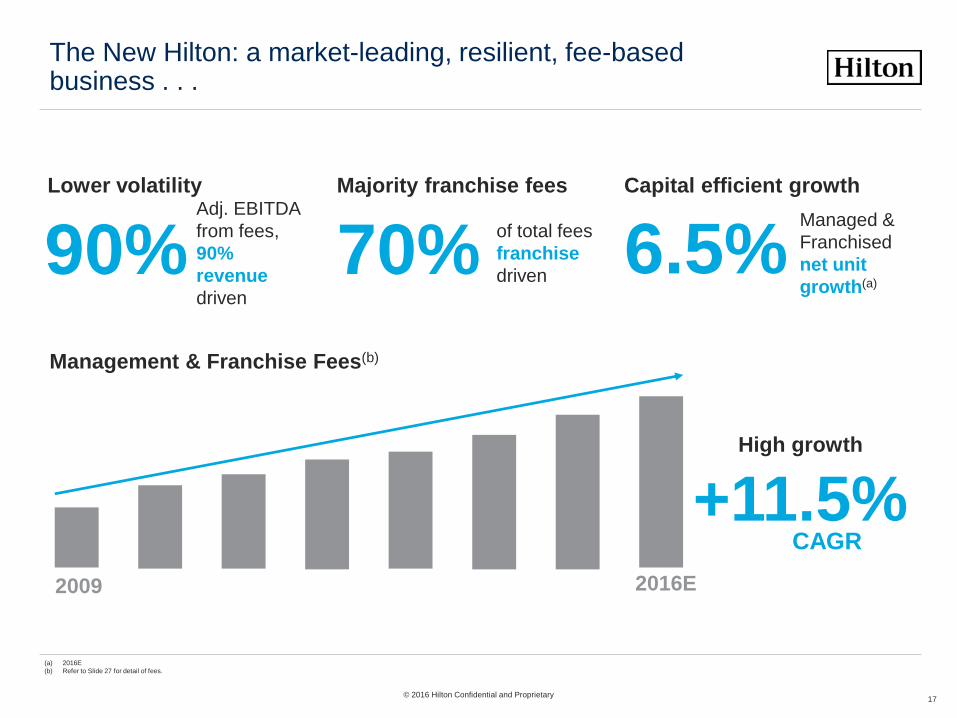
The New Hilton: a market-leading, resilient, fee-based business . . .
17
Adj. EBITDA
from fees,
90%
revenue
driven
90%Lower volatility Capital efficient growth
Managed &
Franchised
net unit
growth(a)
+11.5%CAGR
High growth
Management & Franchise Fees(b)
2009 2016E
of total fees
franchise
driven70%Majority franchise fees
(a) 2016E
(b) Refer to Slide 27 for detail of fees.
6.5%
© 2016 Hilton Confidential and Proprietary
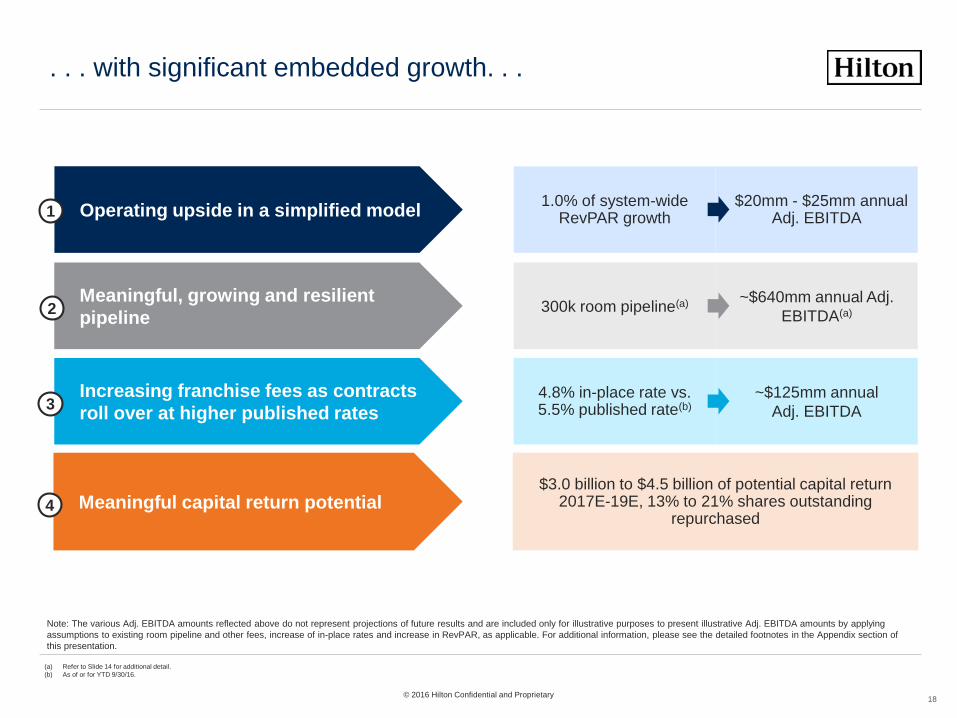
. . . with significant embedded growth. . .
Note: The various Adj. EBITDA amounts reflected above do not represent projections of future results and are included only for illustrative purposes to present illustrative Adj. EBITDA amounts by applying
assumptions to existing room pipeline and other fees, increase of in-place rates and increase in RevPAR, as applicable. For additional information, please see the detailed footnotes in the Appendix section of
this presentation.
Meaningful, growing and resilient
pipeline
Increasing franchise fees as contracts
roll over at higher published rates
Operating upside in a simplified model
2
3
1
300k room pipeline(a) ~$640mm annual Adj.
EBITDA(a)
1.0% of system-wide RevPAR growth
$20mm - $25mm annual Adj. EBITDA
4.8% in-place rate vs. 5.5% published rate(b)
~$125mm annual
Adj. EBITDA
Meaningful capital return potential4
$3.0 billion to $4.5 billion of potential capital return 2017E-19E, 13% to 21% shares outstanding
repurchased
© 2016 Hilton Confidential and Proprietary
(a) Refer to Slide 14 for additional detail.
(b) As of or for YTD 9/30/16.
18
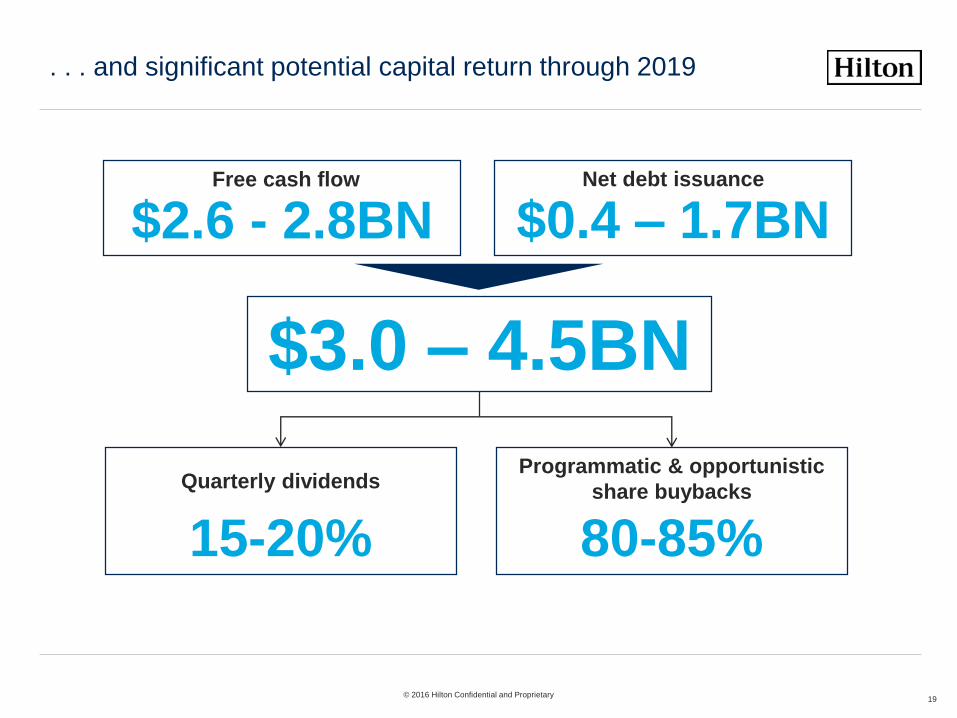
. . . and significant potential capital return through 2019
19© 2016 Hilton Confidential and Proprietary
$2.6 - 2.8BNFree cash flow
$3.0 – 4.5BN
$0.4 – 1.7BNNet debt issuance
15-20%
Quarterly dividends
80-85%
Programmatic & opportunistic
share buybacks

Summary: Key investment highlights
20
Large cap, lower-beta business
Premier global brands with leading average global RevPAR index premium
Industry-leading organic growth - with good visibility and on a lag to the
broader economy
Strong industry fundamentals
Low capital requirements
Significant free cash flow
Disciplined capital allocation and commitment to return capital
Proven and experienced management team
Hilton is a leading hospitality company with world-class brands, well-positioned to benefit from the
continued long-term growth of the global hotel industry, with minimal capital investment
© 2016 Hilton Confidential and Proprietary

Hilton Phuket Arcadia Resort, Thailand
Appendix: Supplemental Financial Information
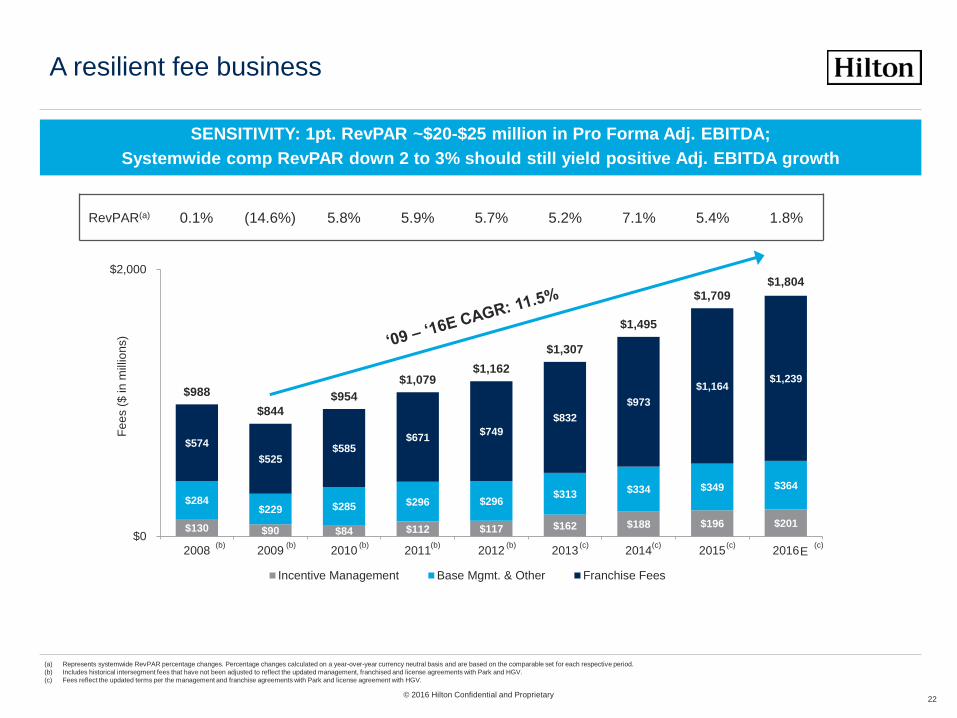
A resilient fee business
22
SENSITIVITY: 1pt. RevPAR ~$20-$25 million in Pro Forma Adj. EBITDA;
Systemwide comp RevPAR down 2 to 3% should still yield positive Adj. EBITDA growth
(b) (b) (b) (b) (b) (c) (c) (c) (c)
RevPAR(a) 0.1% (14.6%) 5.8% 5.9% 5.7% 5.2% 7.1% 5.4% 1.8%
$130 $90 $84 $112 $117 $162 $188 $196 $201
$284 $229 $285 $296 $296
$313 $334 $349 $364
$574
$525 $585
$671 $749
$832
$973
$1,164 $1,239
$988
$844
$954
$1,079 $1,162
$1,307
$1,495
$1,709 $1,804
$0
$2,000
2008 2009 2010 2011 2012 2013 2014 2015 2016
Fe
es (
$ in
mill
ion
s)
Incentive Management Base Mgmt. & Other Franchise Fees
© 2016 Hilton Confidential and Proprietary
E
(a) Represents systemwide RevPAR percentage changes. Percentage changes calculated on a year-over-year currency neutral basis and are based on the comparable set for each respective period.
(b) Includes historical intersegment fees that have not been adjusted to reflect the updated management, franchised and license agreements with Park and HGV.
(c) Fees reflect the updated terms per the management and franchise agreements with Park and license agreement with HGV.
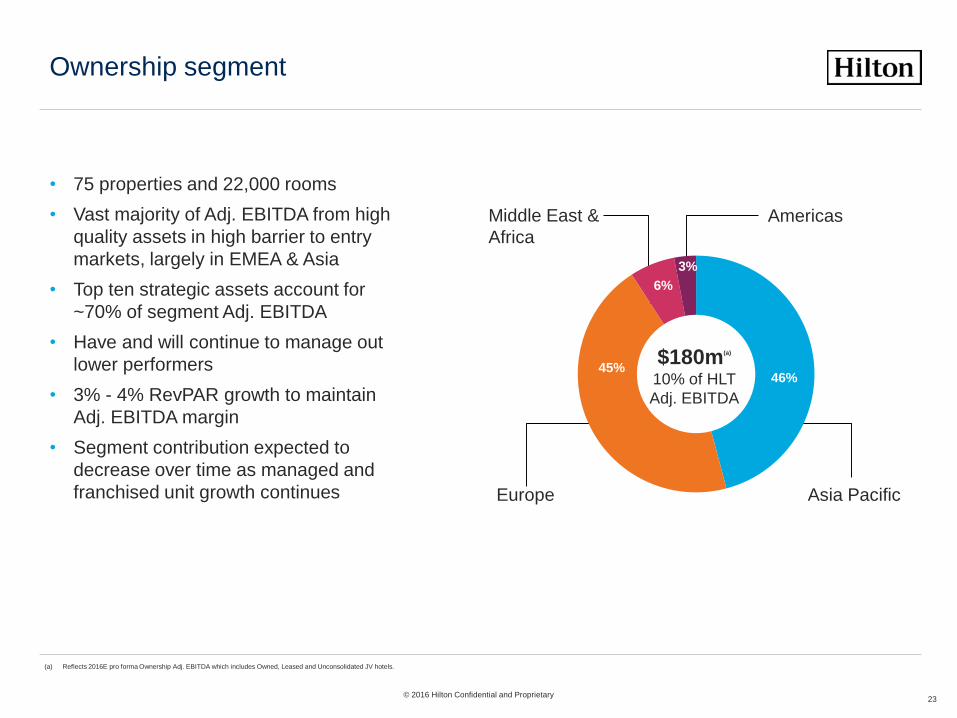
Ownership segment
• 75 properties and 22,000 rooms
• Vast majority of Adj. EBITDA from high
quality assets in high barrier to entry
markets, largely in EMEA & Asia
• Top ten strategic assets account for
~70% of segment Adj. EBITDA
• Have and will continue to manage out
lower performers
• 3% - 4% RevPAR growth to maintain
Adj. EBITDA margin
• Segment contribution expected to
decrease over time as managed and
franchised unit growth continues
23
46%45%
6%
3%
$180m(a)
10% of HLT
Adj. EBITDA
Middle East &
Africa
Europe
Americas
Asia Pacific
© 2016 Hilton Confidential and Proprietary
(a) Reflects 2016E pro forma Ownership Adj. EBITDA which includes Owned, Leased and Unconsolidated JV hotels.
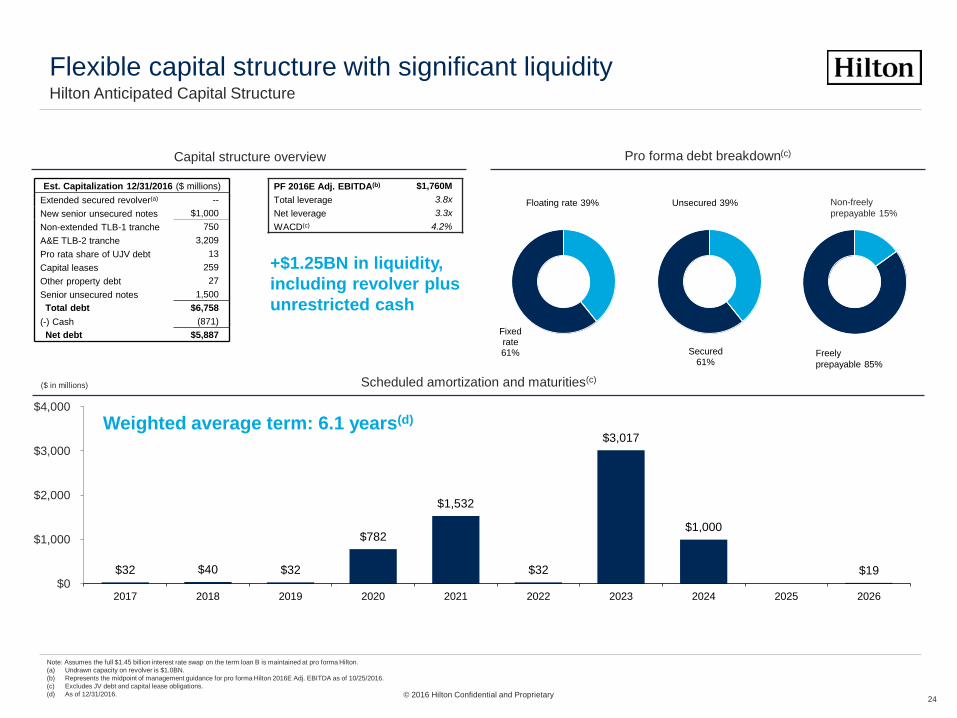
Flexible capital structure with significant liquidity
24
Hilton Anticipated Capital Structure
Pro forma debt breakdown(c)Capital structure overview
Scheduled amortization and maturities(c)($ in millions)
$32 $40 $32
$782
$1,532
$32
$3,017
$1,000
$19 $0
$1,000
$2,000
$3,000
$4,000
2017 2018 2019 2020 2021 2022 2023 2024 2025 2026
Secured61%
Unsecured 39%
Est. Capitalization 12/31/2016 ($ millions)
Extended secured revolver(a) --
New senior unsecured notes $1,000
Non-extended TLB-1 tranche 750
A&E TLB-2 tranche 3,209
Pro rata share of UJV debt 13
Capital leases 259
Other property debt 27
Senior unsecured notes 1,500
Total debt $6,758
(-) Cash (871)
Net debt $5,887
PF 2016E Adj. EBITDA(b) $1,760M
Total leverage 3.8x
Net leverage 3.3x
WACD(c) 4.2%
Note: Assumes the full $1.45 billion interest rate swap on the term loan B is maintained at pro forma Hilton.
(a) Undrawn capacity on revolver is $1.0BN.
(b) Represents the midpoint of management guidance for pro forma Hilton 2016E Adj. EBITDA as of 10/25/2016.
(c) Excludes JV debt and capital lease obligations.
(d) As of 12/31/2016.
Non-freely
prepayable 15%
Freely
prepayable 85%
© 2016 Hilton Confidential and Proprietary
Fixed rate 61%
Floating rate 39%
+$1.25BN in liquidity,
including revolver plus
unrestricted cash
Weighted average term: 6.1 years(d)
Financial policy
• Overall objective of achieving a low grade investment grade credit profile through use of
excess free cash flow and continued earnings growth
• Supported through the following policies:
– Continue to focus on capital light, organic growth of Management & Franchise business
– Disciplined capital allocation: manage any significant external growth opportunities in a
disciplined manner that would be accretive to credit
– Liquidity: maintain in a manner that ensures adequate cash/revolver availability in all
phases of the cycle
• Management believes that approximately $1.25 billion of available liquidity
(between unrestricted cash and revolver capacity) is a prudent level to maintain
going forward
– Dividends: maintain quarterly dividend with targeted payout ratio of 20-25% of recurring
Free Cash Flow
– Leverage: target and maintain a 3.0x to 3.5x net leverage ratio
– Return excess cash to shareholders, likely through programmatic and opportunistic share
buybacks
25© 2016 Hilton Confidential and Proprietary

Three year model summary
26
SAME STORE NET UNIT FEE RATE
GROWTH IN
(CAGR)
Adj. EBITDA Sensitivity(b)
Corporate & Other
Adj. EBITDA
Free cash flow
Reduction of shares
RevPAR(+1 to 3%)
Net Unit Growth (+ 6.0%)
Effective Franchise
Rate (a)
5 to 8% CAGR
(~3%) CAGR
(a) Effective franchise fee rate is 4.8% in Q3 2016, up 77 bps since FY2007, moving towards published rate of 5.5%, Effective franchise rate calculated as total Franchise fee revenue divided by total Franchise room revenue. Published Franchise rates calculated as the weighted average of
current published brand Franchise fee rates.
(b) Sensitivity within the ranges given.
(c) Typically get roughly 1/2 to 2/3 of steady-state fee revenue in year 1.
12 to 15% CAGR
4 to 8% CAGR
1 Pt. = ~$20-25MM10K rooms =
~$20MM steady-state (c)
5 bps = ~$8-10MM
© 2016 Hilton Confidential and Proprietary

Reconciliations
27
Net Income to Adj. EBITDA reconciliation & Adj. EBITDA margin reconciliation
($ in millions) Hilton WholeCo.
LTM
9/30/16
Net income $1,562
Interest expense 578
Income tax expense (benefit) (220)
Depreciation and amortization 682
Interest expense, income tax and depreciation and amortization included in
equity in earnings (losses) from unconsolidated affiliates35
EBITDA 2,637
Gain on sales of assets, net (2)
Loss (gain) on foreign currency transactions 53
FF&E replacement reserve(a)54
Share-based compensation expense 89
Impairment losses 24
Other gain (loss), net 10
Other adjustment items(b)104
Adj. EBITDA $2.969
($ in millions) 9/30/16
Total revenues$11,599
Less: other revenues from managed and franchised properties(4,398)
Total revenues, other revenues from managed and franchised properties7,201
Adj. EBITDA$2,969
Adj. EBITDA margin41.2%
(a) Represents FF&E replacement reserves established for the benefit of lessors for requisition of capital assets under certain lease agreements.
(b) Represents adjustments for spin-off and reorganization costs, severance, offering costs and other items.
© 2016 Hilton Confidential and Proprietary
Conrad Bora Bora Nui, French Polynesia