Embed Size (px)
Citation preview
Intact Financial Corporation
Intact Financial Corporation (TSX:IFC)
December 2015
INVESTOR PRESENTATION
Intact Financial Corporation 2
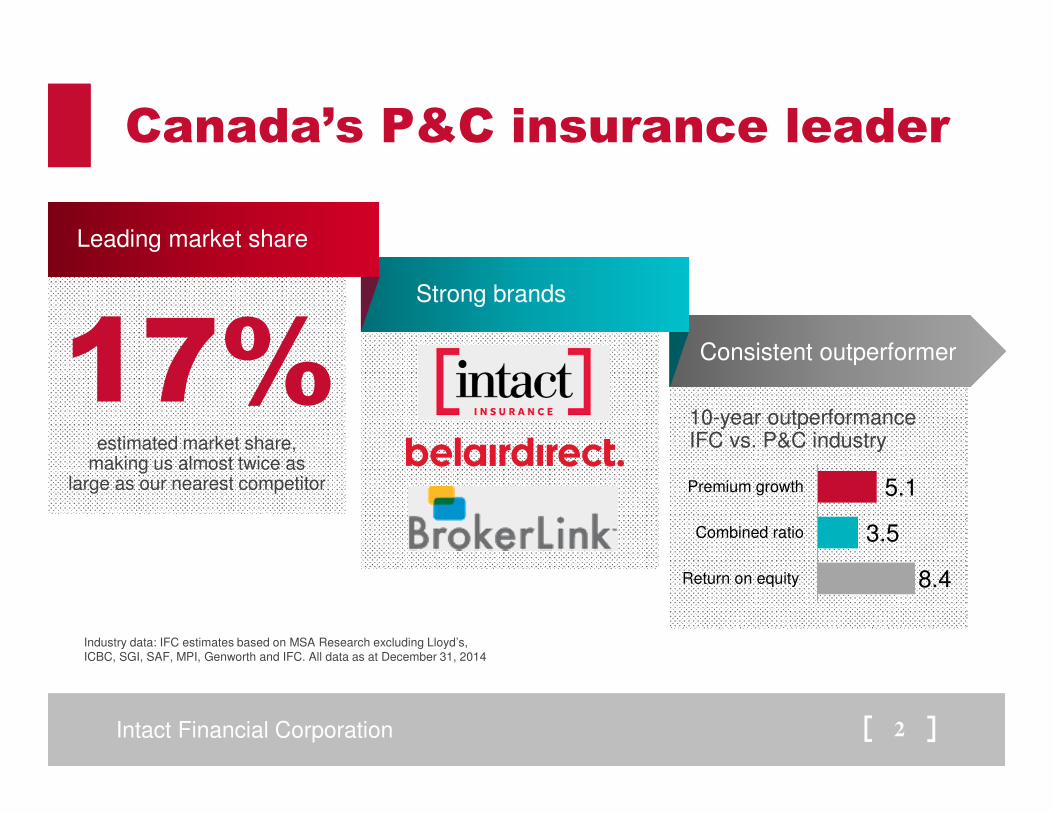
Canada’s P&C insurance leader
Consistent outperformer
Strong brands
estimated market share, making us almost twice as
large as our nearest competitor
Leading market share
10-year outperformance IFC vs. P&C industry
8.4
3.5
5.1
Return on equity
Combined ratio
Premium growth
Industry data: IFC estimates based on MSA Research excluding Lloyd’s, ICBC, SGI, SAF, MPI, Genworth and IFC. All data as at December 31, 2014
17%
Intact Financial Corporation 3
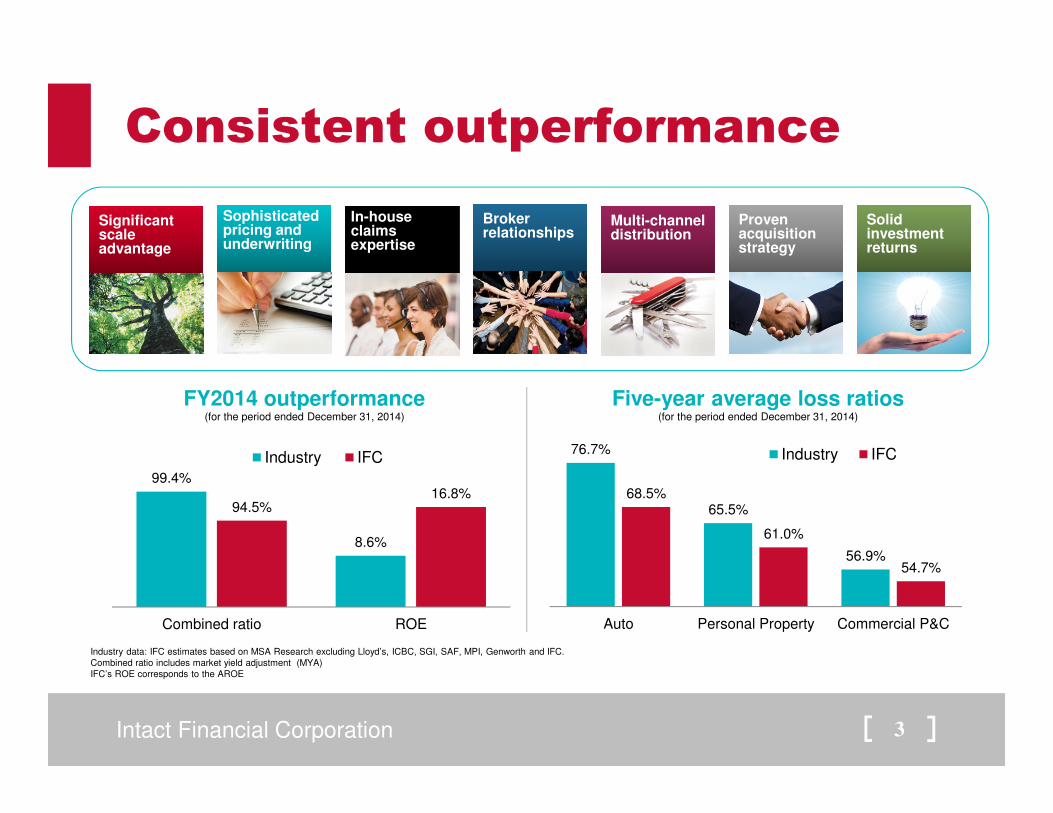
Consistent outperformance
Significant scale advantage
Significant scale advantage
Significant scale advantage
Sophisticated pricing and underwriting
Sophisticated pricing and underwriting
Sophisticated pricing and underwriting
In-house claims expertise
In-house claims expertise
In-house claims expertise
Proven acquisition strategy
Proven acquisition strategy
Proven acquisition strategy
Multi-channel distribution Multi-channel distribution Multi-channel distribution
Broker relationshipsBroker relationshipsBroker relationships
Solid investment returns
Solid investment returns
Solid investment returns
99.4%
8.6%
94.5%16.8%
Combined ratio ROE
Industry IFC76.7%
65.5%
56.9%
68.5%
61.0%
54.7%
Auto Personal Property Commercial P&C
Industry IFC
Five-year average loss ratiosFY2014 outperformance(for the period ended December 31, 2014)(for the period ended December 31, 2014)
Industry data: IFC estimates based on MSA Research excluding Lloyd’s, ICBC, SGI, SAF, MPI, Genworth and IFC. Combined ratio includes market yield adjustment (MYA)IFC’s ROE corresponds to the AROE

Intact Financial Corporation 4
How we will achieve our objectives
* Leaves 2 points to reinvest in customer experience (price, product, service, brand)
Beat industryROE by 5 points every
year
Investments & Capital Mgmt
2 points
Pricing & Segmentation
2 points
Claims management
3 points
NOIPS growthof 10% per
year over time
Organic Growth3-5%
MarginImprovement
0-3%
Capital Mgmt & Deployment
3-5%
Intact Financial Corporation 5
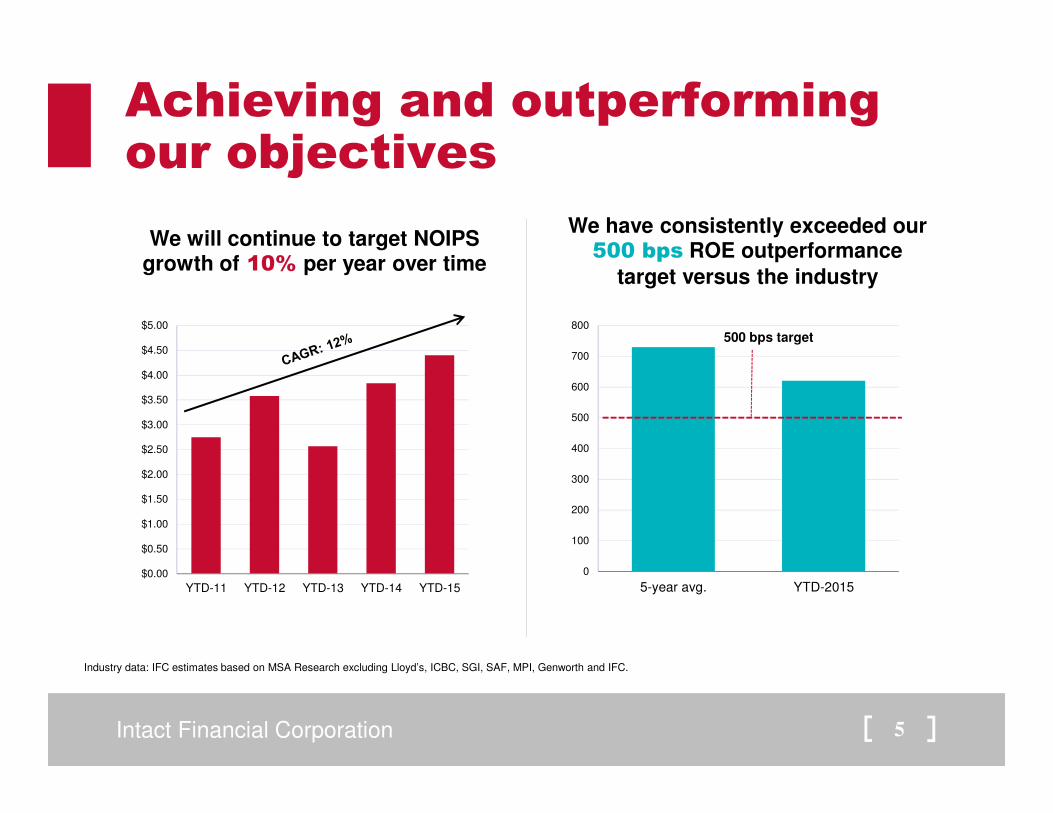
Achieving and outperforming our objectives
We have consistently exceeded our 500 bps ROE outperformance
target versus the industry
We will continue to target NOIPS growth of 10% per year over time
Industry data: IFC estimates based on MSA Research excluding Lloyd’s, ICBC, SGI, SAF, MPI, Genworth and IFC.
$0.00
$0.50
$1.00
$1.50
$2.00
$2.50
$3.00
$3.50
$4.00
$4.50
$5.00
YTD-11 YTD-12 YTD-13 YTD-14 YTD-15
0
100
200
300
400
500
600
700
800
5-year avg. YTD-2015
500 bps target
Intact Financial Corporation 6
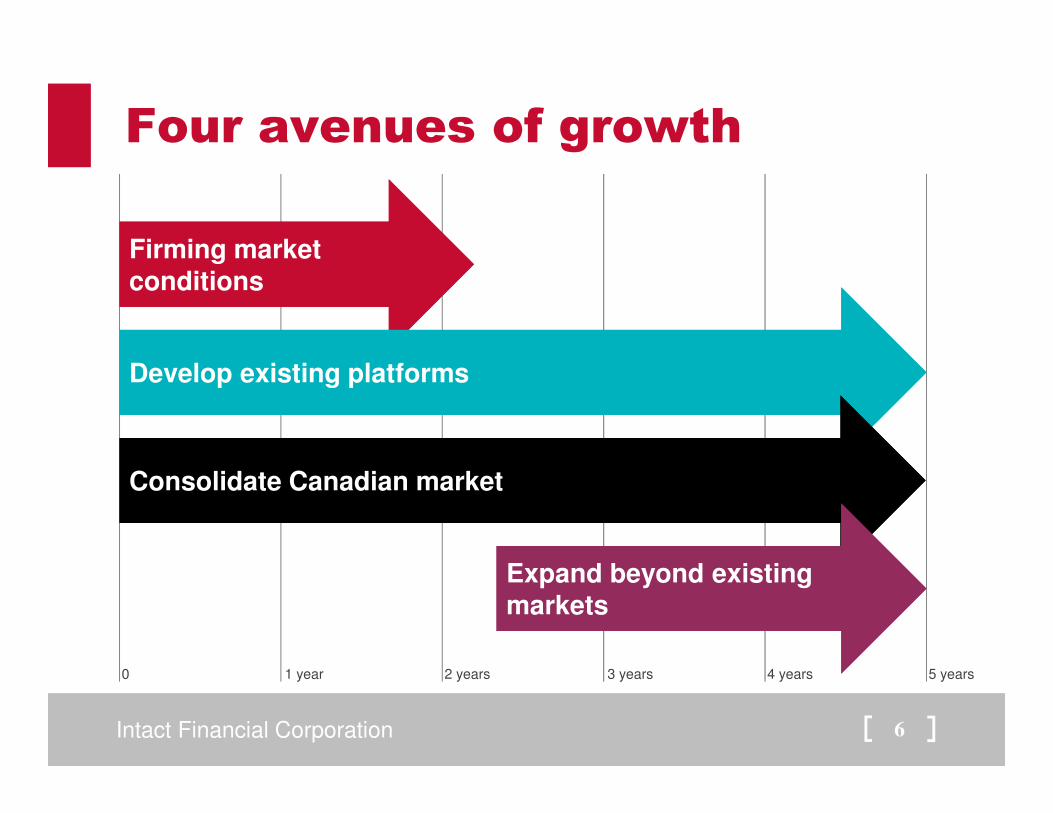
Four avenues of growth
Firming marketconditions Firming marketconditions
Develop existing platformsDevelop existing platforms
Consolidate Canadian marketConsolidate Canadian market
Expand beyond existingmarketsExpand beyond existingmarkets
0 1 year 2 years 3 years 4 years 5 years
Intact Financial Corporation 7
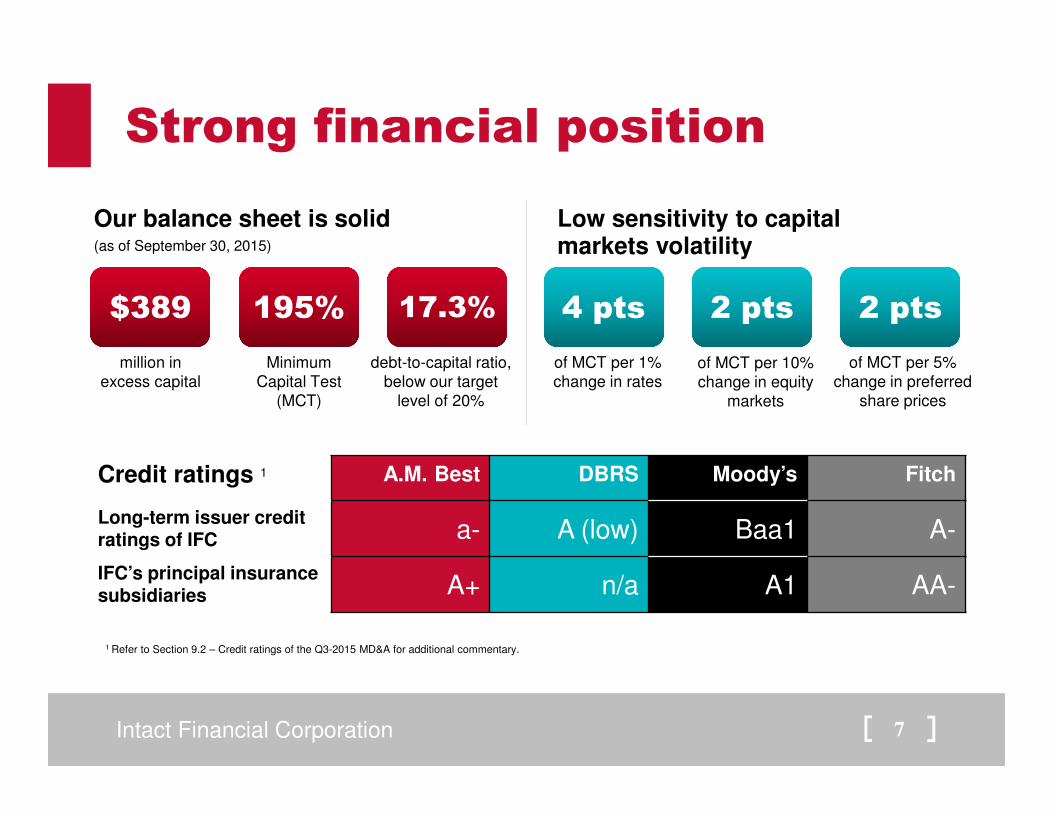
Strong financial position
Credit ratings 1 A.M. Best DBRS Moody’s Fitch
Long-term issuer credit ratings of IFC a- A (low) Baa1 A-
IFC’s principal insurance subsidiaries A+ n/a A1 AA-
Our balance sheet is solid(as of September 30, 2015)
$389$389 195%195%
million in excess capital
Minimum Capital Test
(MCT)
debt-to-capital ratio, below our target
level of 20%
1 Refer to Section 9.2 – Credit ratings of the Q3-2015 MD&A for additional commentary.
Low sensitivity to capitalmarkets volatility
4 pts4 pts 2 pts2 pts
of MCT per 1% change in rates
of MCT per 5% change in preferred
share prices
2 pts2 pts
of MCT per 10% change in equity
markets
17.3%
Intact Financial Corporation 8
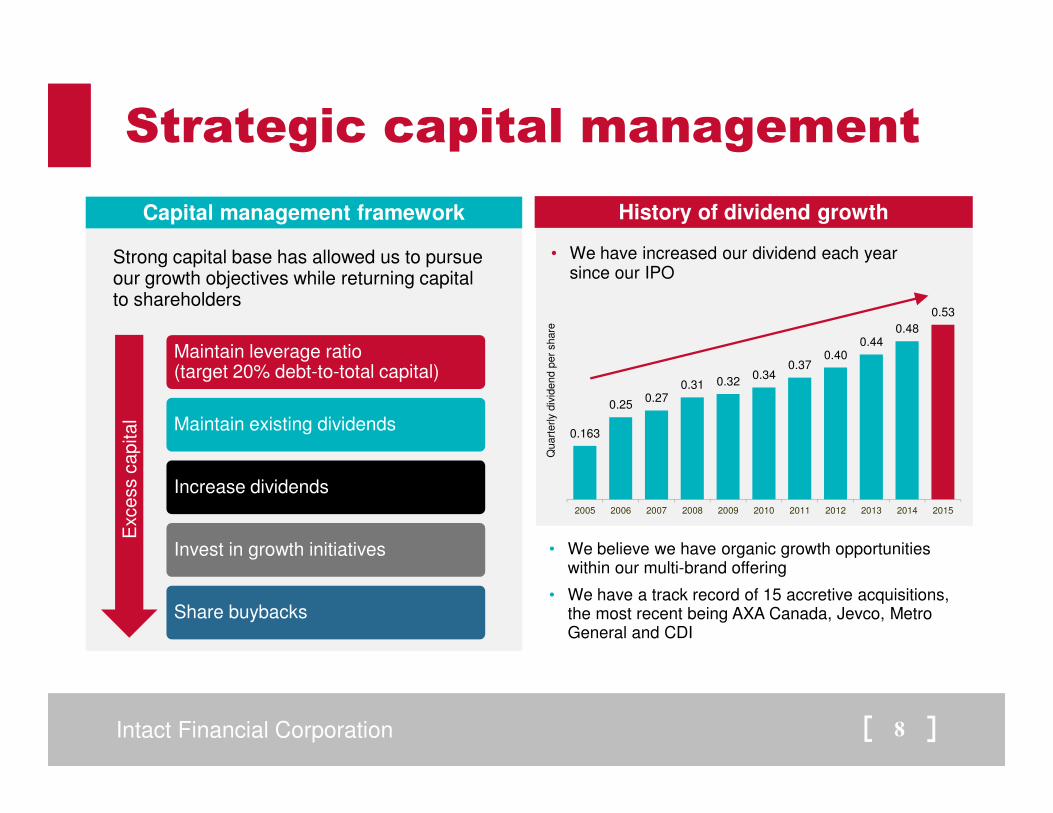
Strategic capital management
Capital management framework
Maintain leverage ratio (target 20% debt-to-total capital)
Maintain existing dividends
Increase dividends
Invest in growth initiatives
Share buybacks
• We have increased our dividend each year since our IPO
History of dividend growth
0.163
0.250.27
0.31 0.320.34
0.370.40
0.440.48
0.53
2005 2006 2007 2008 2009 2010 2011 2012 2013 2014 2015
Quart
erly
div
idend p
er
share
• We believe we have organic growth opportunities within our multi-brand offering
• We have a track record of 15 accretive acquisitions, the most recent being AXA Canada, Jevco, Metro General and CDI
Strong capital base has allowed us to pursue our growth objectives while returning capital to shareholders
Exc
ess c
apital
Intact Financial Corporation 9
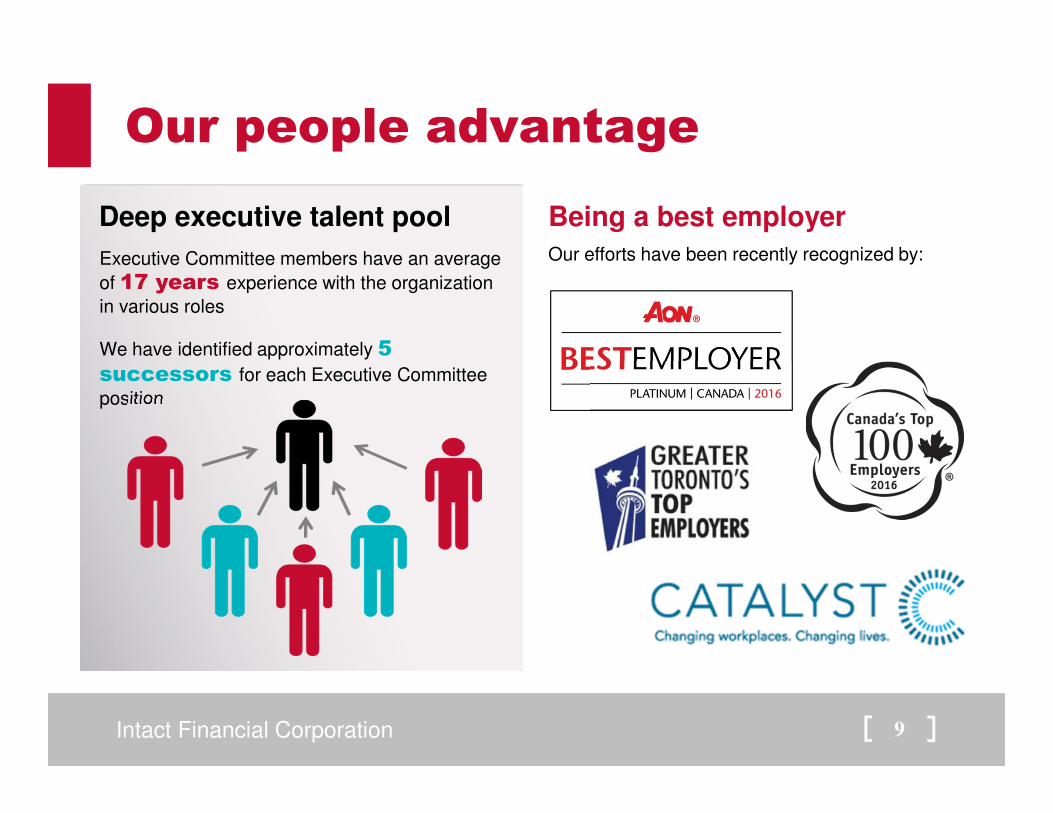
Our people advantage
Deep executive talent pool
Executive Committee members have an average
of 17 years experience with the organization
in various roles
We have identified approximately 5 successors for each Executive Committee
position
Being a best employer
Our efforts have been recently recognized by:
Intact Financial Corporation 10
Key takeaways
� We have a sustainable competitive edge due to our disciplined approach and scale advantage
� Our broad distribution platform positions us well for organic growth
� We have a strong financial position and a proven track record of consolidation
� Deep bench in place to ensure the sustainability of our performance
Intact Financial Corporation
Appendices
Intact Financial Corporation 12
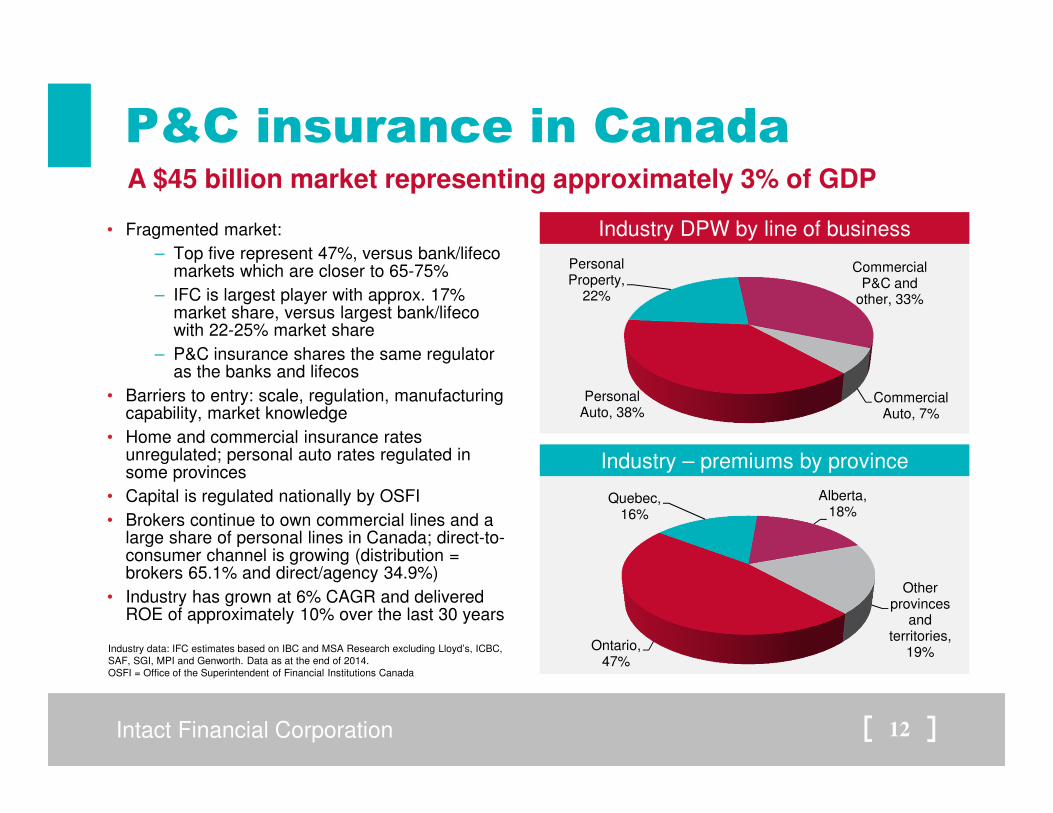
P&C insurance in CanadaA $45 billion market representing approximately 3% of GDP
Industry DPW by line of business
Industry – premiums by province
• Fragmented market:
– Top five represent 47%, versus bank/lifecomarkets which are closer to 65-75%
– IFC is largest player with approx. 17% market share, versus largest bank/lifecowith 22-25% market share
– P&C insurance shares the same regulator as the banks and lifecos
• Barriers to entry: scale, regulation, manufacturing capability, market knowledge
• Home and commercial insurance rates unregulated; personal auto rates regulated in some provinces
• Capital is regulated nationally by OSFI
• Brokers continue to own commercial lines and a large share of personal lines in Canada; direct-to-consumer channel is growing (distribution = brokers 65.1% and direct/agency 34.9%)
• Industry has grown at 6% CAGR and delivered ROE of approximately 10% over the last 30 years
Industry data: IFC estimates based on IBC and MSA Research excluding Lloyd’s, ICBC, SAF, SGI, MPI and Genworth. Data as at the end of 2014.OSFI = Office of the Superintendent of Financial Institutions Canada
Personal Auto, 38%
Personal Property,
22%
Commercial P&C and
other, 33%
Commercial Auto, 7%
Ontario, 47%
Quebec, 16%
Alberta, 18%
Other provinces
and territories,
19%
Intact Financial Corporation 13
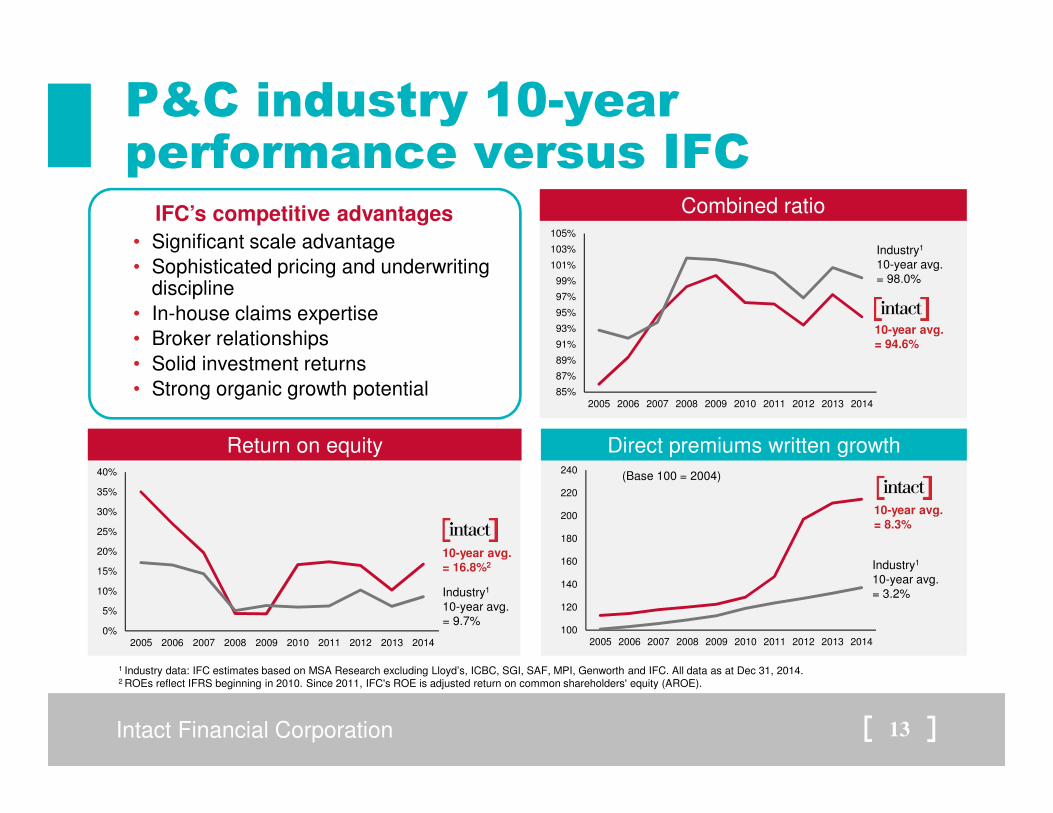
P&C industry 10-year performance versus IFC
Return on equity Direct premiums written growth
Combined ratioIFC’s competitive advantages
• Significant scale advantage
• Sophisticated pricing and underwriting discipline
• In-house claims expertise
• Broker relationships
• Solid investment returns
• Strong organic growth potential
1 Industry data: IFC estimates based on MSA Research excluding Lloyd’s, ICBC, SGI, SAF, MPI, Genworth and IFC. All data as at Dec 31, 2014. 2 ROEs reflect IFRS beginning in 2010. Since 2011, IFC's ROE is adjusted return on common shareholders' equity (AROE).
Industry1
10-year avg.= 9.7%
10-year avg.= 16.8%2
Industry1
10-year avg. = 98.0%
10-year avg.= 94.6%
10-year avg.= 8.3%
Industry1
10-year avg.= 3.2%
(Base 100 = 2004)
0%
5%
10%
15%
20%
25%
30%
35%
40%
2005 2006 2007 2008 2009 2010 2011 2012 2013 2014
85%
87%
89%
91%
93%
95%
97%
99%
101%
103%
105%
2005 2006 2007 2008 2009 2010 2011 2012 2013 2014
100
120
140
160
180
200
220
240
2005 2006 2007 2008 2009 2010 2011 2012 2013 2014
Intact Financial Corporation 14
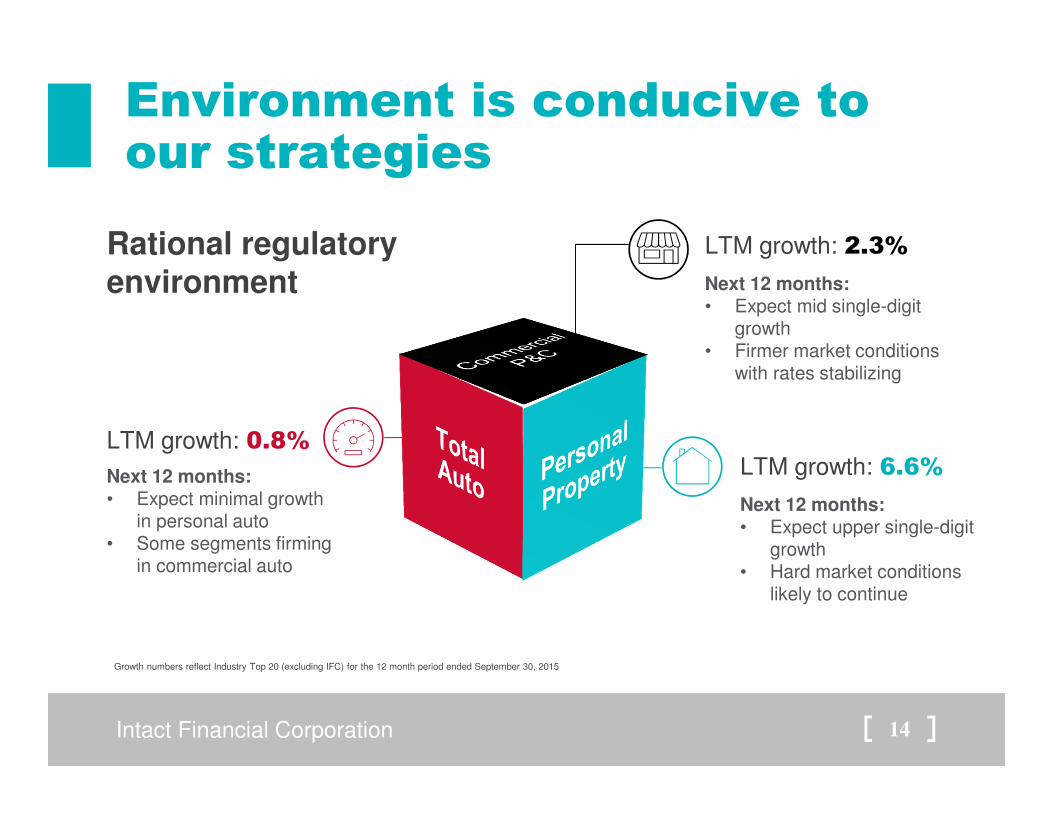
Environment is conducive to our strategies
Growth numbers reflect Industry Top 20 (excluding IFC) for the 12 month period ended September 30, 2015
LTM growth: 0.8%
Next 12 months:• Expect minimal growth
in personal auto • Some segments firming
in commercial auto
Next 12 months:• Expect upper single-digit
growth• Hard market conditions
likely to continue
LTM growth: 6.6%
Rational regulatory environment Next 12 months:
• Expect mid single-digit growth
• Firmer market conditions with rates stabilizing
LTM growth: 2.3%
Intact Financial Corporation 15
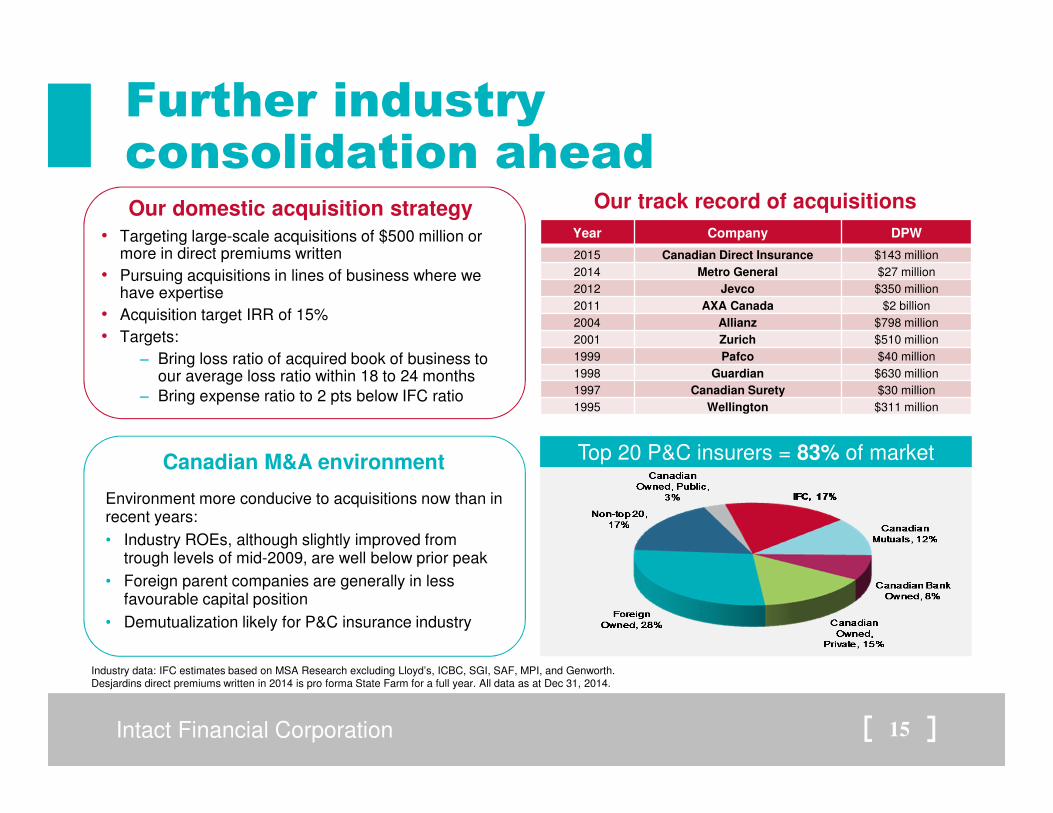
Further industry consolidation aheadOur domestic acquisition strategy
• Targeting large-scale acquisitions of $500 million or more in direct premiums written
• Pursuing acquisitions in lines of business where we have expertise
• Acquisition target IRR of 15%
• Targets:
− Bring loss ratio of acquired book of business to our average loss ratio within 18 to 24 months
− Bring expense ratio to 2 pts below IFC ratio
Our track record of acquisitions
Canadian M&A environment
Environment more conducive to acquisitions now than in recent years:
• Industry ROEs, although slightly improved from trough levels of mid-2009, are well below prior peak
• Foreign parent companies are generally in less favourable capital position
• Demutualization likely for P&C insurance industry
Top 20 P&C insurers = 83% of market
Industry data: IFC estimates based on MSA Research excluding Lloyd’s, ICBC, SGI, SAF, MPI, and Genworth. Desjardins direct premiums written in 2014 is pro forma State Farm for a full year. All data as at Dec 31, 2014.
Year Company DPW
2015 Canadian Direct Insurance $143 million
2014 Metro General $27 million
2012 Jevco $350 million
2011 AXA Canada $2 billion
2004 Allianz $798 million
2001 Zurich $510 million
1999 Pafco $40 million
1998 Guardian $630 million
1997 Canadian Surety $30 million
1995 Wellington $311 million
Intact Financial Corporation 16
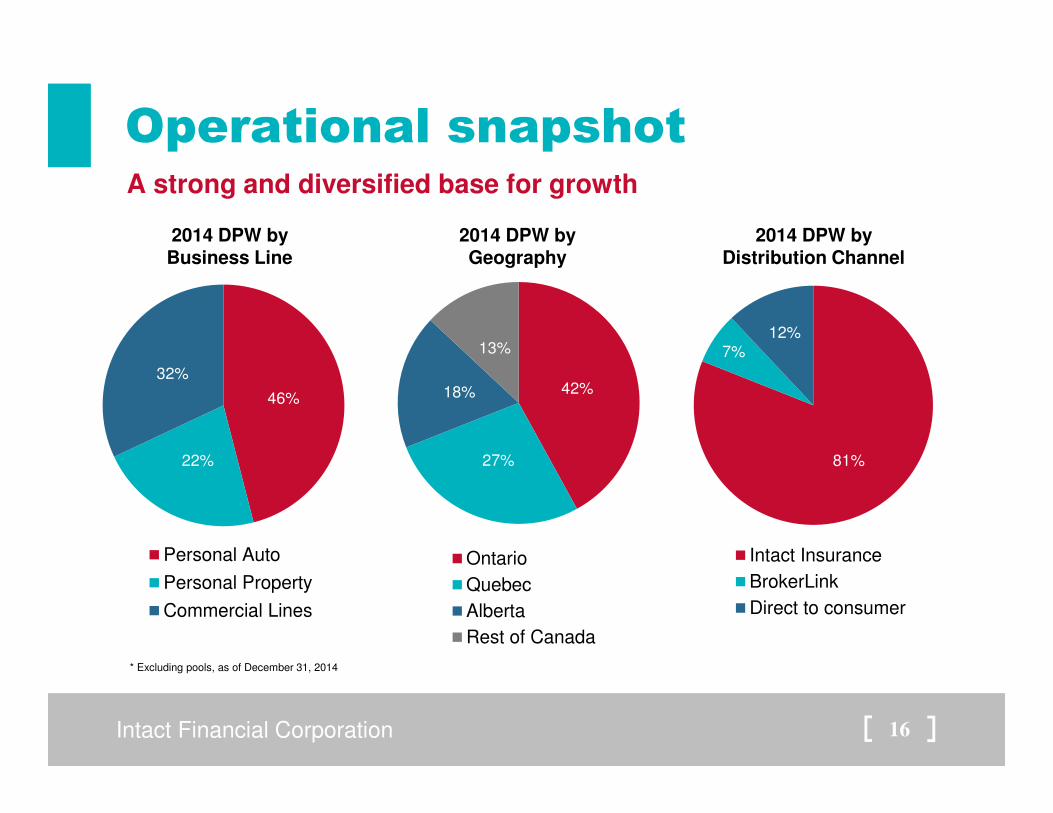
Operational snapshot
46%
22%
32%
Personal Auto
Personal Property
Commercial Lines
42%
27%
18%
13%
Ontario
Quebec
Alberta
Rest of Canada
81%
7%12%
Intact Insurance
BrokerLink
Direct to consumer
2014 DPW by Business Line
2014 DPW by Geography
2014 DPW by Distribution Channel
A strong and diversified base for growth
* Excluding pools, as of December 31, 2014
Intact Financial Corporation 17
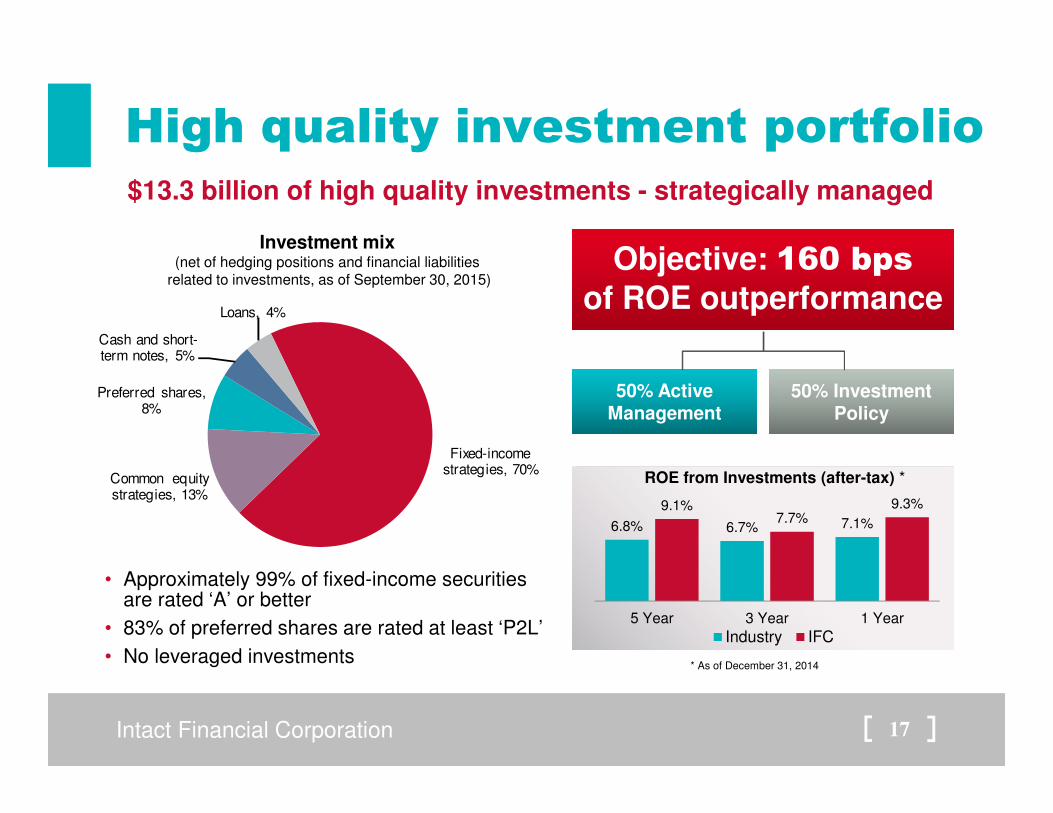
High quality investment portfolio$13.3 billion of high quality investments - strategically managed
6.8% 6.7% 7.1%
9.1%7.7%
9.3%
5 Year 3 Year 1 Year
ROE from Investments (after-tax) *
Industry IFC
* As of December 31, 2014
• Approximately 99% of fixed-income securities are rated ‘A’ or better
• 83% of preferred shares are rated at least ‘P2L’
• No leveraged investments
Fixed-income strategies, 70%
Common equity strategies, 13%
Preferred shares, 8%
Cash and short-term notes, 5%
Loans, 4%
Investment mix (net of hedging positions and financial liabilities
related to investments, as of September 30, 2015)Objective: 160 bps
of ROE outperformance
50% Active Management
50% Investment Policy
Intact Financial Corporation 18
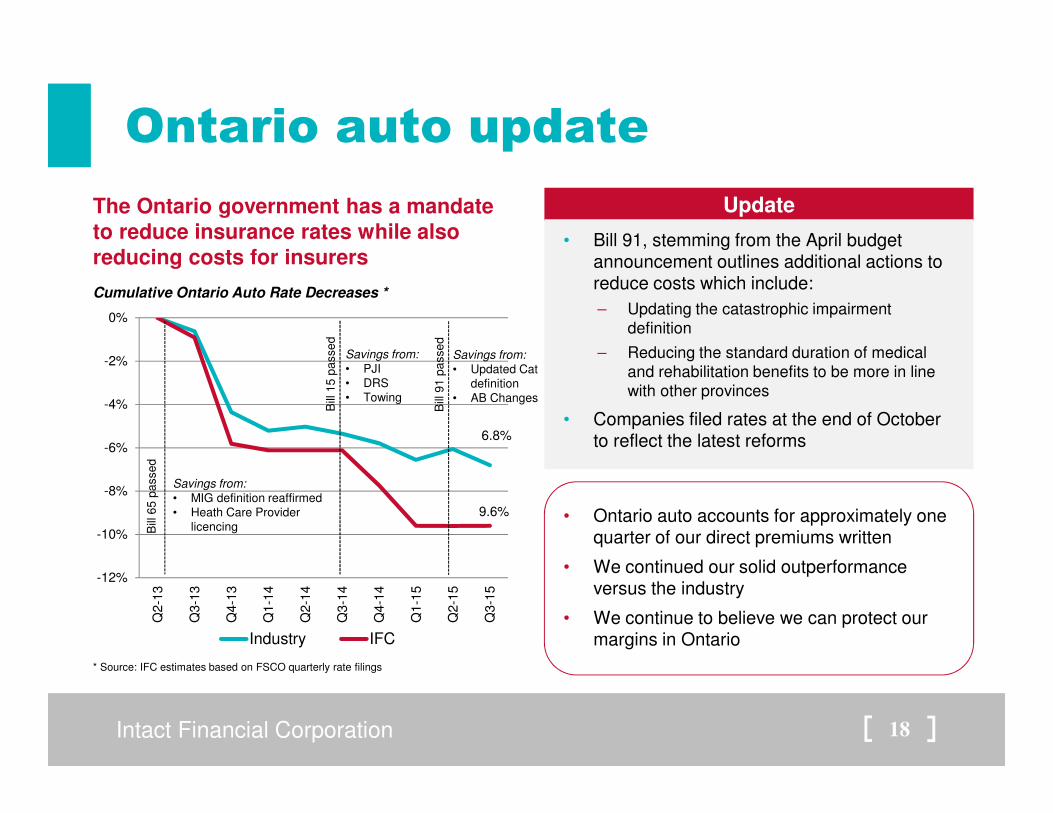
Ontario auto update
• Ontario auto accounts for approximately one quarter of our direct premiums written
• We continued our solid outperformance versus the industry
• We continue to believe we can protect our margins in Ontario
Update
• Bill 91, stemming from the April budget announcement outlines additional actions to reduce costs which include:
– Updating the catastrophic impairment definition
– Reducing the standard duration of medical and rehabilitation benefits to be more in line with other provinces
• Companies filed rates at the end of October to reflect the latest reforms
The Ontario government has a mandate to reduce insurance rates while also reducing costs for insurers
-12%
-10%
-8%
-6%
-4%
-2%
0%
Q2-1
3
Q3-1
3
Q4-1
3
Q1-1
4
Q2-1
4
Q3-1
4
Q4-1
4
Q1-1
5
Q2-1
5
Q3-1
5
Industry IFC
Cumulative Ontario Auto Rate Decreases *
* Source: IFC estimates based on FSCO quarterly rate filings
6.8%
9.6%
Bill
65
pa
sse
d
Savings from:
• MIG definition reaffirmed• Heath Care Provider
licencing
Bill
15
pa
sse
d
Savings from:
• PJI• DRS• Towing
Bill
91
pa
sse
d
Savings from:
• Updated Cat definition
• AB Changes
Intact Financial Corporation 19
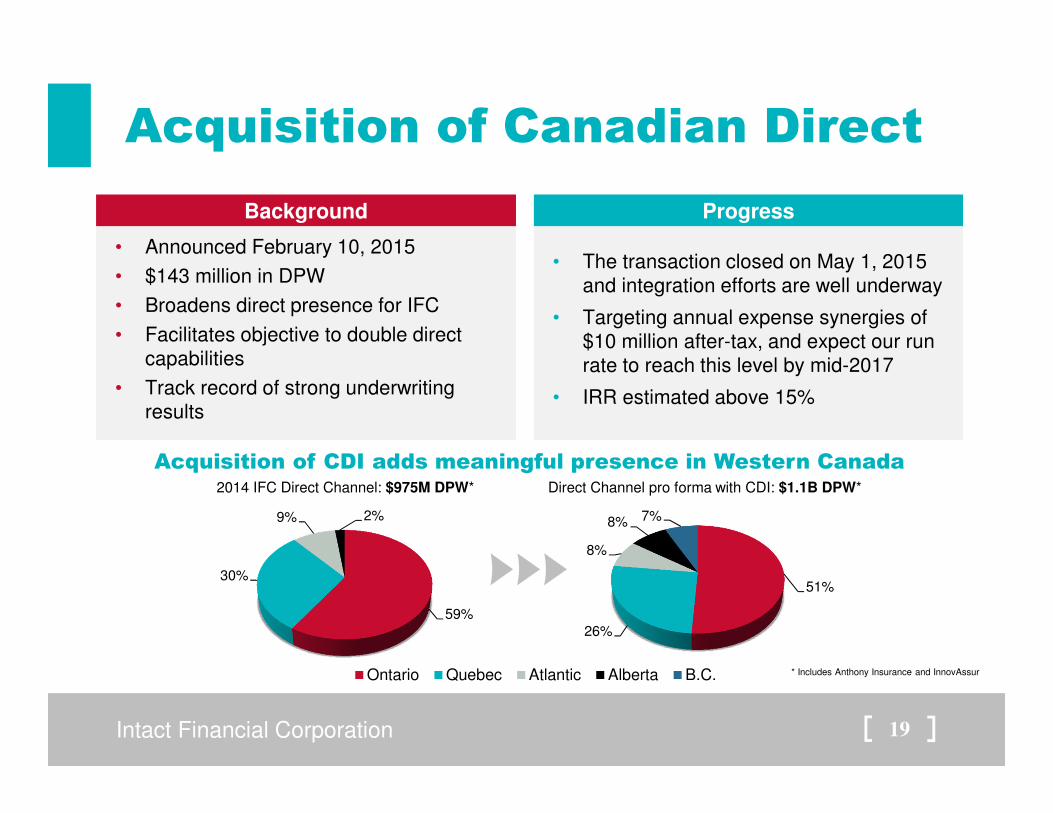
Acquisition of Canadian Direct
Background
• Announced February 10, 2015
• $143 million in DPW
• Broadens direct presence for IFC
• Facilitates objective to double direct capabilities
• Track record of strong underwriting results
Progress
• The transaction closed on May 1, 2015 and integration efforts are well underway
• Targeting annual expense synergies of $10 million after-tax, and expect our run rate to reach this level by mid-2017
• IRR estimated above 15%
51%
26%
8%
8% 7%
Ontario Quebec Atlantic Alberta B.C.
59%
30%
9% 2%
2014 IFC Direct Channel: $975M DPW* Direct Channel pro forma with CDI: $1.1B DPW*
* Includes Anthony Insurance and InnovAssur
Acquisition of CDI adds meaningful presence in Western Canada
Intact Financial Corporation 20
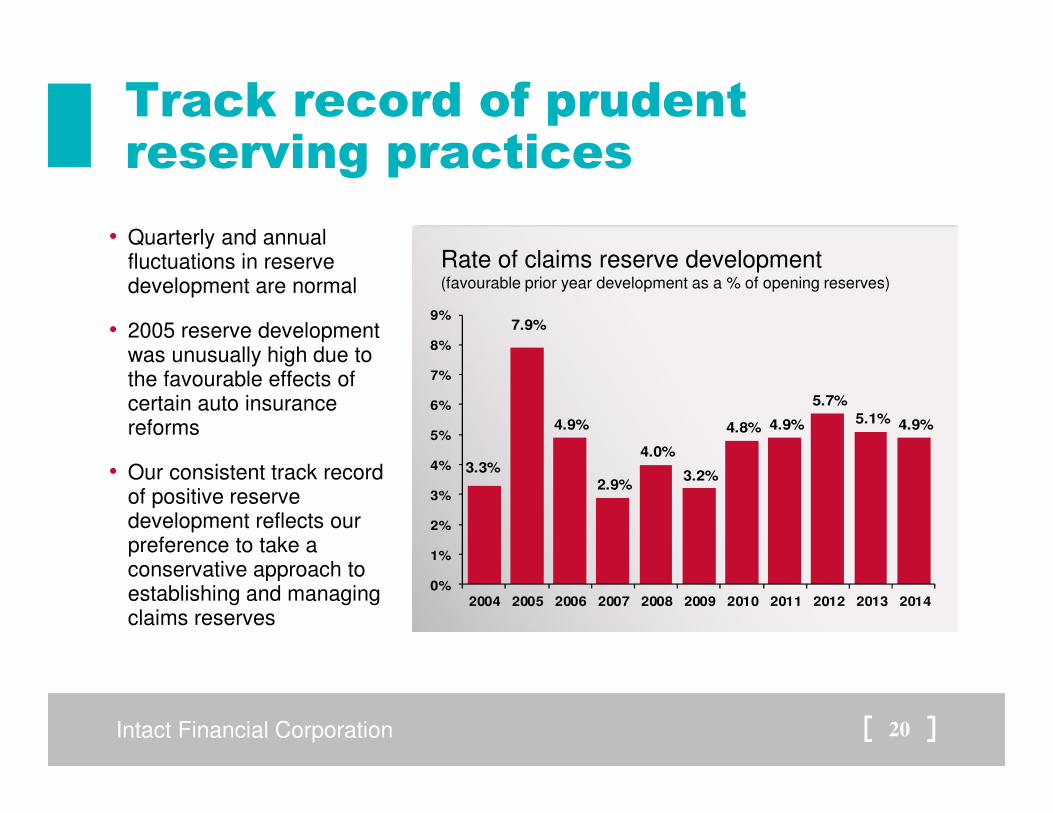
Track record of prudent reserving practices
3.3%
7.9%
4.9%
2.9%
4.0%
3.2%
4.8% 4.9%
5.7%
5.1% 4.9%
0%
1%
2%
3%
4%
5%
6%
7%
8%
9%
2004 2005 2006 2007 2008 2009 2010 2011 2012 2013 2014
• Quarterly and annual fluctuations in reserve development are normal
• 2005 reserve development was unusually high due to the favourable effects of certain auto insurance reforms
• Our consistent track record of positive reserve development reflects our preference to take a conservative approach to establishing and managing claims reserves
Rate of claims reserve development(favourable prior year development as a % of opening reserves)
Intact Financial Corporation 21
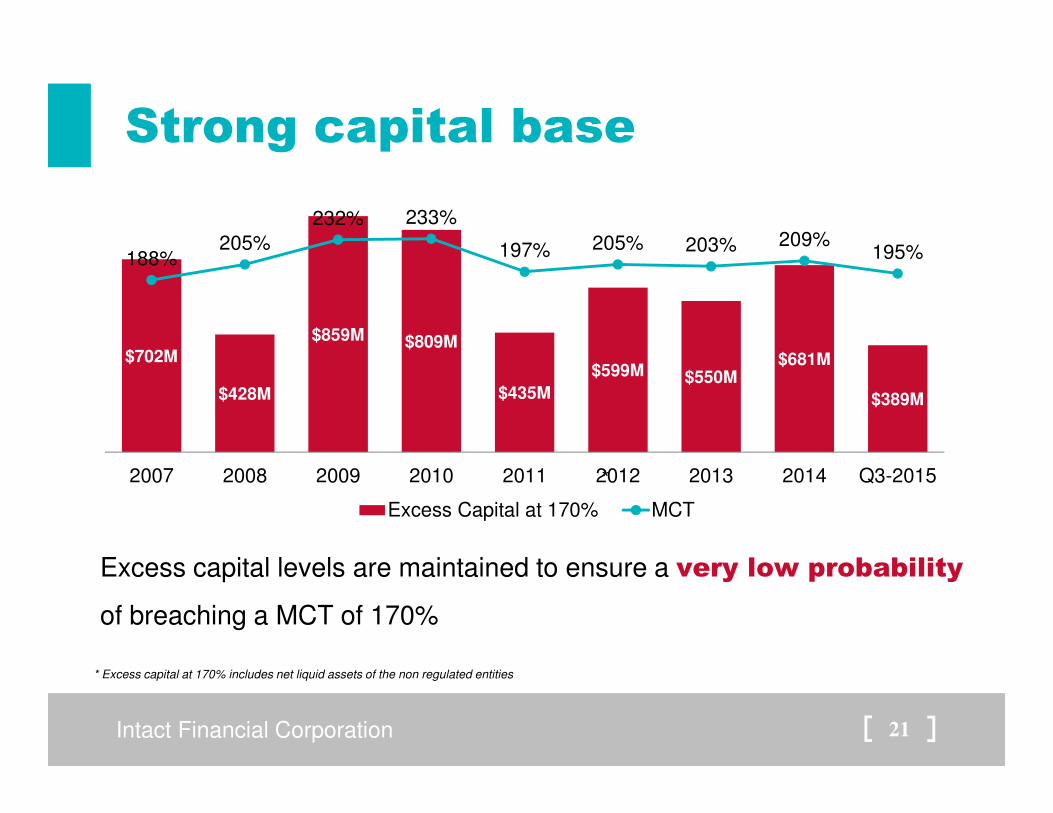
Strong capital base
Excess capital levels are maintained to ensure a very low probability
of breaching a MCT of 170%
$702M
$428M
$859M $809M
$435M
$599M $550M$681M
$389M
188%205%
232% 233%
197% 205% 203% 209%195%
2007 2008 2009 2010 2011 2012 2013 2014 Q3-2015
Excess Capital at 170% MCT
* Excess capital at 170% includes net liquid assets of the non regulated entities
*
Intact Financial Corporation 22
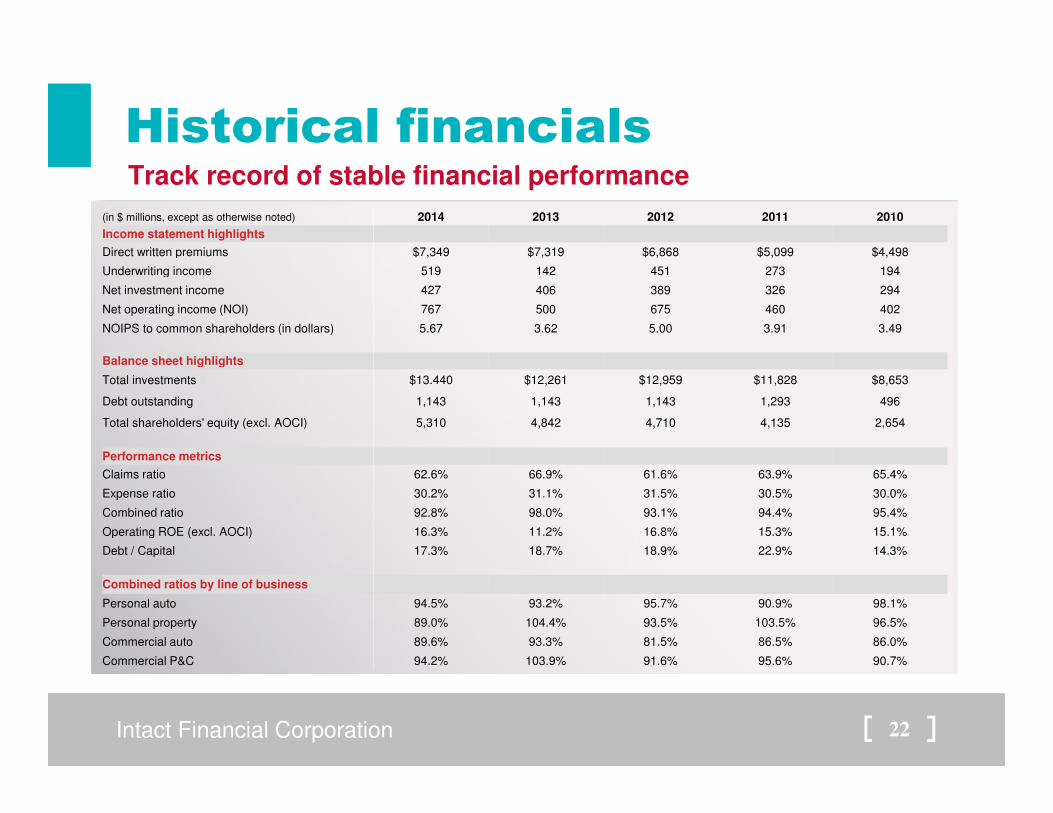
Historical financials
(in $ millions, except as otherwise noted) 2014 2013 2012 2011 2010
Income statement highlights
Direct written premiums $7,349 $7,319 $6,868 $5,099 $4,498
Underwriting income 519 142 451 273 194
Net investment income 427 406 389 326 294
Net operating income (NOI) 767 500 675 460 402
NOIPS to common shareholders (in dollars) 5.67 3.62 5.00 3.91 3.49
Balance sheet highlights
Total investments $13.440 $12,261 $12,959 $11,828 $8,653
Debt outstanding 1,143 1,143 1,143 1,293 496
Total shareholders' equity (excl. AOCI) 5,310 4,842 4,710 4,135 2,654
Performance metrics
Claims ratio 62.6% 66.9% 61.6% 63.9% 65.4%
Expense ratio 30.2% 31.1% 31.5% 30.5% 30.0%
Combined ratio 92.8% 98.0% 93.1% 94.4% 95.4%
Operating ROE (excl. AOCI) 16.3% 11.2% 16.8% 15.3% 15.1%
Debt / Capital 17.3% 18.7% 18.9% 22.9% 14.3%
Combined ratios by line of business
Personal auto 94.5% 93.2% 95.7% 90.9% 98.1%
Personal property 89.0% 104.4% 93.5% 103.5% 96.5%
Commercial auto 89.6% 93.3% 81.5% 86.5% 86.0%
Commercial P&C 94.2% 103.9% 91.6% 95.6% 90.7%
Track record of stable financial performance
Intact Financial Corporation 23
Contact Investor Relations
General Contact Info
Website:http://www.intactfc.comClick on “Investor Relations” tab
Email:[email protected]
Phone:416.941.53361.866.778.0774 (toll-free)
Samantha Cheung, MBA, M.Sc.Eng., P.Eng.
Vice President, Investor Relations
Phone: 416.344.8004
Email: [email protected]
Maida Sit, CFADirector, Investor Relations
Phone: 416.341.1464 ext 45153 Email: [email protected]
To access our 2014 online annual report featuring interactive photos, videos, dynamic charts, and additional media, please scan the QR code or visit reports.intactfc.com/2014.
Intact Financial Corporation 24
Forward-looking statements
Certain of the statements included in this presentation about the Company’s current and future plans, expectations and intentions, results, levels of activity, performance, goals or achievements or any other future events or developments constitute forward-looking statements. The words “may”, “will”, “would”, “should”, “could”, “expects”, “plans”, “intends”, “trends”, “indications”, “anticipates”, “believes”, “estimates”, “predicts”, “likely”, “potential” or the negative or other variations of these words or other similar or comparable words or phrases, are intended to identify forward-looking statements.
Forward-looking statements are based on estimates and assumptions made by management based on management’s experience and perception of historical trends, current conditions and expected future developments, as well as other factors that management believes are appropriate in the circumstances. Many factors could cause the Company’s actual results, performance or achievements or future events or developments to differ materially from those expressed or implied by the forward-looking statements, including, without limitation, the following factors: the Company’s ability to implement its strategy or operate its business as management currently expects; its ability to accurately assess the risks associated with the insurance policies that the Company writes; unfavourable capital market developments or other factors which may affect the Company’s investments and funding obligations under its pension plans; the cyclical nature of the P&C insurance industry; management’s ability to accurately predict future claims frequency; government regulations designed to protect policyholders and creditors rather than investors; litigation and regulatory actions; periodic negative publicity regarding the insurance industry; intense competition; the Company’s reliance on brokers and third parties to sell its products to clients; the Company’s ability to successfully pursue its acquisition strategy; the Company’s ability to execute its business strategy; the Company’s ability to achieve synergies arising from successful integration plans relating to acquisitions including its acquisition of Canadian Direct Insurance Inc. (“CDI”), as well as management's estimates and expectations in relation to resulting accretion, internal rate of return and debt-to-capital ratio; the Company’s participation in the Facility Association (a mandatory pooling arrangement among all industry participants) and similar mandated risk-sharing pools; terrorist attacks and ensuing events; the occurrence of catastrophic events; the Company’s ability to maintain its financial strength and issuer credit ratings; access to debt financing and the Company's ability to compete for large commercial business; the Company’s ability to alleviate risk through reinsurance; the Company’s ability to successfully manage credit risk (including credit risk related to the financial health of reinsurers); the Company’s reliance on information technology and telecommunications systems and potential disruption to those systems, including evolving cyber attack risk; the Company’s dependence on key employees; changes in laws or regulations; general economic, financial and political conditions; the Company’s dependence on the results of operations of its subsidiaries; the volatility of the stock market and other factors affecting the Company’s share price; and future sales of a substantial number of its common shares.
All of the forward-looking statements included in this presentation are qualified by these cautionary statements and those made in the Risk management section of our MD&A for the year ended December 31, 2014. These factors are not intended to represent a complete list of the factors that could affect the Company. These factors should, however, be considered carefully. Although the forward-looking statements are based upon what management believes to be reasonable assumptions, the Company cannot assure investors that actual results will be consistent with these forward-looking statements. When relying on forward-looking statements to make decisions, investors should ensure the preceding information is carefully considered. Undue reliance should not be placed on forward-looking statements made herein. The Company and management have no intention and undertake no obligation to update or revise any forward-looking statements, whether as a result of new information, future events or otherwise, except as required by law.
Intact Financial Corporation 25
Disclaimer
This Presentation does not constitute or form part of any offer for sale or solicitation of any offer to buy or subscribe for any securities nor shall it or any part of it form the basis of or be relied on in connection with, or act as any inducement to enter into, any contract or commitment whatsoever.
The information contained in this Presentation concerning the Company does not purport to be all-inclusive or to contain all the information that a prospective purchaser or investor may desire to have in evaluating whether or not to make an investment in the Company. The information is qualified entirely by reference to the Company’s publicly disclosed information.
No representation or warranty, express or implied, is made or given by or on behalf of the Company or any of its the directors, officers or employees as to the accuracy, completeness or fairness of the information or opinions contained in this Presentation and no responsibility or liability is accepted by any person for such information or opinions. In furnishing this Presentation, the Company does not undertake or agree to any obligation to provide the attendees with access to any additional information or to update this Presentation or to correct any inaccuracies in, or omissions from, this Presentation that may become apparent. The information and opinions contained in this Presentation are provided as at the date of this Presentation. The contents of this Presentation are not to be construed as legal, financial or tax advice. Each prospective purchaser should contact his, her or its own legal adviser, independent financial adviser or tax adviser for legal, financial or tax advice.
The Company uses both International Financial Reporting Standards (“IFRS”) and certain non-IFRS measures to assess performance. Non-IFRS measures do not have any standardized meaning prescribed by IFRS and are unlikely to be comparable to any similar measures presented by other companies. Management of the Company analyzes performance based on underwriting ratios such as combined, general expenses and claims ratios as well as other performance measures such as return on equity (“ROE”) and operating return on equity. These measures and other insurance related terms are defined in the Company’s glossary available on the Intact Financial Corporation web site at www.intactfc.com in the “Investor Relations” section. Additional information about the Company, including the Annual Information Form, may be found online on SEDAR at www.sedar.com.