Embed Size (px)
Citation preview

Investor Presentation –AT1
AIB Group plc

Disclaimer
2
NOT FOR DISTRIBUTION TO ANY U.S. PERSON OR TO ANY PERSON OR ADDRESS IN THE U.S.IMPORTANT: You must read the following before continuing. The following applies to the presentation materials contained in this document, and you are therefore advised to read this carefully before reading, accessing or making any other use of the presentation materials. In accessing the presentation, you agree to be bound by the following terms and conditions, including any modifications to them any time you receive any information from us as a result of such access.This presentation is not a prospectus, listing particulars or offering memorandum and investors should not subscribe for or purchase any Securities (the “Securities”) referred to in this presentation except on the basis of the information in the listing particulars to be prepared and published by the Issuer in relation to the Securities (the “Listing Particulars”).This investor presentation has been prepared by AIB Group plc (the “Issuer”). This presentation is for informational purposes only and does not constitute or form part of, and should not be construed as, an offer, invitation or inducement to purchase or subscribe for any Securities nor shall it or any part of it form the basis of, or be relied upon in connection with, any contract or commitment whatsoever.No person shall have any right of action (except in case of fraud) against the Issuer or any other person in relation to the accuracy or completeness of the information contained herein or in any other document made available in connection with the transaction described in this presentation (the “Transaction”) or the Securities.The information contained in this presentation has not been independently verified. None of Morgan Stanley & Co. International plc, Barclays Bank PLC, Goldman Sachs International, Goodbody Stockbrokers UC, J.P. Morgan Securities plc and Merrill Lynch International (together, the “Managers”) or their respective affiliates, agents, directors, partners and employees accepts any responsibility whatsoever for, or any liability for any loss howsoever arising, directly or indirectly, from this presentation or its contents, or makes any representation or warranty, express or implied, as to the contents of this presentation or for any other statement made or purported to be made by it, or on its behalf, including (without limitation) information regarding the Issuer or the Securities and no reliance should be placed on such information. To the fullest extent permitted by applicable law, the Managers accordingly disclaim any and all responsibility and/or liability, whether arising in tort, contract or otherwise, which they might otherwise have in respect of this presentation or any such statement.This presentation should not be considered as a recommendation that any investor should subscribe for or purchase Securities, and must be read together with the Listing Particulars. Any person who subsequently acquires Securities is advised to read the Listing Particulars carefully and must not rely on any information contained in this presentation, which is subject to amendment, revision and updating. In particular, investors should pay special attention to any sections of the Listing Particulars describing the relevant risk factors. The merits or suitability of the Transaction and the Securities described in this presentation to any investor’s particular situation should be independently determined by such investor. Any such determination should involve, inter alia, an assessment of the legal, tax, accounting, regulatory, financial, credit and other related aspects of the Transaction or the Securities. No person is authorised to give any information or to make any representation not contained in and not consistent with this presentation and the Listing Particulars and, if given or made, such information or representation must not be relied upon as having been authorised by or on behalf of the Issuer.This presentation contains or incorporates by reference certain statements that constitute forward-looking statements. Some statements in this presentation may be deemed to be forward looking statements. Forward looking statements include statements concerning the Issuer’s plans, objectives, goals, strategies, future operations and performance and the assumptions underlying these forward looking statements. When used in this presentation, the words “anticipates”, “estimates”, “expects”, “believes”, “intends”, “plans”, “aims”, “seeks”, “may”, “will”, “should” and any similar expressions generally identify forward looking statements. The Issuer has based these forward looking statements on the current view of its management with respect to future events and financial performance. Although the Issuer believes that the expectations, estimates and projections reflected in its forward looking statements are reasonable as of the date of this presentation, if one or more of the risks or uncertainties materialise, including those identified below or which the Issuer has otherwise identified in this presentation, or if any of the Issuer’s underlying assumptions prove to be incomplete or inaccurate, the Issuer’s actual results of operation may vary from those expected, estimated or predicted.
Disclaimer
3
The risks and uncertainties referred to above include: (i) the performance of the markets in Ireland and the wider region in which the Issuer operates; (ii) changes in political, social, legal or economic conditions in the markets in which the Issuer and its customers operate; (iii) the Issuer’s ability to achieve and manage the growth of its business; (iv) the Issuer’s ability to obtain external financing or maintain sufficient capital to fund its existing and future investments and projects; (v) the Issuer’s ability to realise the benefits it expects from existing and future projects and investments it is undertaking or plans to or may undertake; and (vi) actions taken by the Issuer’s joint venture partners that may not be in accordance with its policies and objectives.Any forward looking statements contained in this presentation speak only as at the date of this presentation. Without prejudice to any requirements under applicable laws and regulations, the Issuer expressly disclaims any obligation or undertaking to disseminate, after the date of this presentation, any updates or revisions to any forward looking statements contained herein to reflect any change in expectations thereof or any change in events, conditions or circumstances on which any such forward looking statement is based.This presentation is confidential and is being submitted to selected recipients only. If handed out at a physical roadshow meeting or presentation, it should be returned promptly at the end of such meeting/presentation. It may not be reproduced (in whole or in part), distributed or transmitted to any other person without the prior written consent of the Issuer. The information contained in this presentation has not been subject to any independent audit or review.This presentation is not directed or intended for distribution to, or use by, any person or entity that is a citizen or resident located in any locality, state, country or other jurisdiction where such distribution, publication, availability or use would be contrary to the law or regulation of that jurisdiction or which would require any registration or licensing within such jurisdiction. In particular these materials are not intended for distribution in the United States or to U.S. persons (as defined in Regulation S) under the United States Securities Act of 1933, as amended. Persons who come into possession of any document or other information referred to herein should inform themselves about and observe any such restrictions. Any failure to comply with these restrictions may constitute a violation of the securities laws of such jurisdictions.In the United Kingdom, the presentation is being distributed only to, and is directed only at, persons (i) who have professional experience in matters relating to investments falling within Article 19(5) of the Financial Services and Markets Act 2000 (Financial Promotion) Order 2005, as amended (the “Order”), and persons falling within Article 49 of the Order, and (ii) to whom it may otherwise lawfully be communicated (all such persons together being referred to as “relevant persons”). The presentation must not be acted on or relied on in the UK by persons who are not relevant persons. Any investment or investment activity to which the presentation relates is available only to relevant persons in the UK and will be engaged in only with such persons.Restrictions on marketing and sales to retail investorsThe Securities are complex financial instruments and are not a suitable or appropriate investment for all investors. In some jurisdictions regulatory authorities have adopted or published laws, regulations or guidance with respect to the offer or sale of securities such as the Securities to retail investors. In particular, in June 2015, the United Kingdom Financial Conduct Authority (the “FCA”) published the Product Intervention (Contingent Convertible Instruments and Mutual Society Shares) Instrument 2015, which took effect from 1 October 2015 (the “PI Instrument”). In addition, (i) on 1 January 2018, the provisions of Regulation (EU) No. 1286/2014 on key information documents for packaged and retail and insurance-based investment products (“PRIIPs”) became directly applicable in all European Economic Area (“EEA”) member states and (ii) the Markets in Financial Instruments Directive 2014/65/EU (as amended) (“MiFID II”) was required to be implemented in EEA member states by 3 January 2018. Together, the PI Instrument, PRIIPs and MiFID II are referred to as the “Regulations”.The Regulations set out various obligations in relation to (i) the manufacture and distribution of financial instruments and (ii) the offering, sale and distribution of packaged retail and insurance-based investment products and certain contingent write down or convertible securities, such as the Securities.Potential investors in the Securities should inform themselves of, and comply with, any applicable laws, regulations or regulatory guidance with respect to any resale of the Securities (or any beneficial interests therein), including the Regulations.
Disclaimer
4
By purchasing, or making or accepting an offer to purchase, any Securities (or a beneficial interest in such Securities) from the Issuer and/or any of the Managers, each prospective investor will thereby represent, warrant, agree with and undertake to the Issuer and each of the Managers that:
it is not a retail client (as defined in MiFID II);whether or not it is subject to the Regulations, it will not:
sell or offer the Securities (or any beneficial interest therein) to retail clients (as defined in MiFID II); orcommunicate (including the distribution of the Listing Particulars) or approve an invitation or inducement to participate in, acquire or underwrite the Securities (or any beneficial interests therein) where that invitation or inducement is addressed to, or disseminated in such a way that it is likely to be received by, a retail client (as defined in MiFID II)
and in selling or offering Securities or making or approving communications relating to the Securities, it may not rely on the limited exemptions set out in the PI Instrument; andit will at all times comply with all applicable laws, regulations and regulatory guidance (whether inside or outside the EEA) relating to the promotion, offering, distribution and/or sale of the Securities (or any beneficial interests therein), including (without limitation) MiFID II and any other applicable laws, regulations and regulatory guidance relating to determining the appropriateness and/or suitability of an investment in the Securities (or any beneficial interests therein) by investors in any relevant jurisdiction.
Each prospective investor further acknowledges that:the identified target market for the Securities (for the purposes of the product governance obligations in MiFID II) is eligible counterparties and professional clients; andno key information document (KID) under PRIIPs has been prepared and therefore offering or selling the Securities or otherwise making them available to any retail investor in the EEA may be unlawful under PRIIPs.
Prohibition of Sales to EEA Retail Investors – The Securities are not intended to be offered, sold or otherwise made available to and should not be offered, sold or otherwise made available to any retail investor in the EEA. For these purposes, a retail investor means a person who is one (or more) of: (i) a retail client as defined in point (11) of Article 4(1) of MiFID II; or (ii) a customer within the meaning of Directive (EU) 2016/97 (the “Insurance Distribution Directive”), where that customer would not qualify as a professional client as defined in point (10) of Article 4(1) of MiFID II. Consequently no key information document required by PRIIPs for offering or selling the Securities or otherwise making them available to retail investors in the EEA has been prepared and therefore offering or selling the Securities or otherwise making them available to any retail investor in the EEA may be unlawful under PRIIPs.MiFID II product governance / Professional investors and ECPs only target market – Solely for the purposes of each manufacturer’s product approval process, the target market assessment in respect of the Securities has led to the conclusion that: (i) the target market for the Securities is eligible counterparties and professional clients only, each as defined in MiFID II; and (ii) all channels for distribution of the Securities to eligible counterparties and professional clients are appropriate. Any person subsequently offering, selling or recommending the Securities (a “distributor”) should take into consideration the manufacturers’ target market assessment; however, a distributor subject to MiFID II is responsible for undertaking its own target market assessment in respect of the Securities (by either adopting or refining the manufacturers’ target market assessment) and determining appropriate distribution channels. Where you act as agent on behalf of a disclosed or undisclosed client when purchasing, or making or accepting an offer to purchase any Securities (or any beneficial interests therein) from the Issuer and/or any of the Managers, the foregoing representations, warranties, agreements and undertakings will be given by and be binding on both you and your client(s).
Contents
5
AT1 - Transaction overview 6
Key Financials - H1 2019: 12
Overview – macro and new lending 14
P&L 16
Balance Sheet & NPEs 20
Funding & capital 24
Appendix 28

AT1 – Transaction overview
AIB Group plc
Executive summary
7
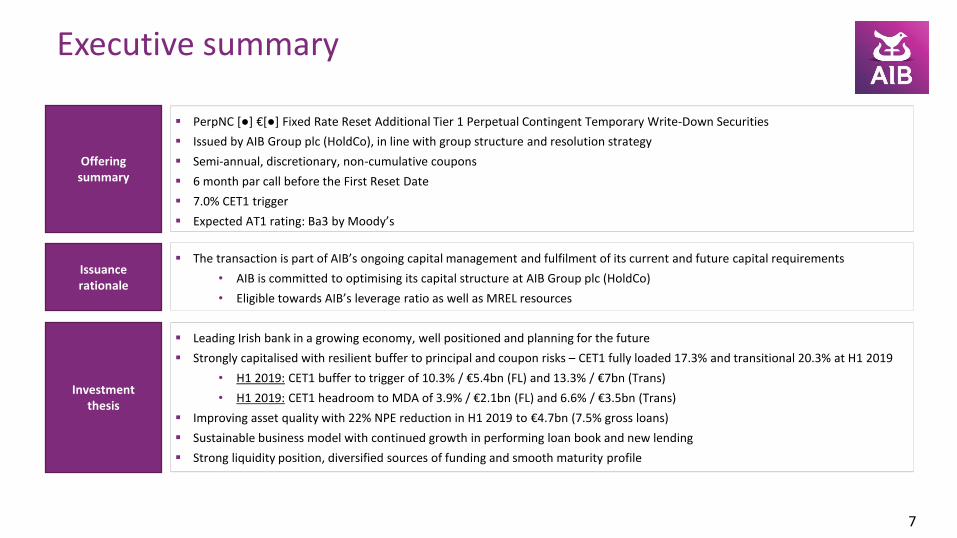
Offering summary
Issuance rationale
Investment thesis
PerpNC [●] €[●] Fixed Rate Reset Additional Tier 1 Perpetual Contingent Temporary Write-Down Securities
Issued by AIB Group plc (HoldCo), in line with group structure and resolution strategy
Semi-annual, discretionary, non-cumulative coupons
6 month par call before the First Reset Date
7.0% CET1 trigger
Expected AT1 rating: Ba3 by Moody’s
The transaction is part of AIB’s ongoing capital management and fulfilment of its current and future capital requirements
• AIB is committed to optimising its capital structure at AIB Group plc (HoldCo)
• Eligible towards AIB’s leverage ratio as well as MREL resources
Leading Irish bank in a growing economy, well positioned and planning for the future
Strongly capitalised with resilient buffer to principal and coupon risks – CET1 fully loaded 17.3% and transitional 20.3% at H1 2019
• H1 2019: CET1 buffer to trigger of 10.3% / €5.4bn (FL) and 13.3% / €7bn (Trans)
• H1 2019: CET1 headroom to MDA of 3.9% / €2.1bn (FL) and 6.6% / €3.5bn (Trans)
Improving asset quality with 22% NPE reduction in H1 2019 to €4.7bn (7.5% gross loans)
Sustainable business model with continued growth in performing loan book and new lending
Strong liquidity position, diversified sources of funding and smooth maturity profile
Robust buffer to trigger
Mitigating principal write-down risk
8
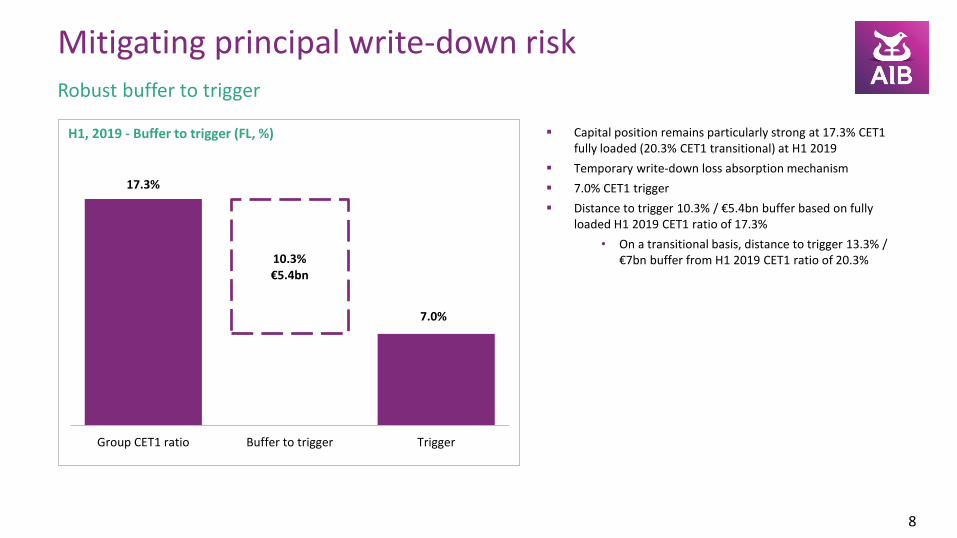
H1, 2019 - Buffer to trigger (FL, %) Capital position remains particularly strong at 17.3% CET1 fully loaded (20.3% CET1 transitional) at H1 2019
Temporary write-down loss absorption mechanism
7.0% CET1 trigger
Distance to trigger 10.3% / €5.4bn buffer based on fully loaded H1 2019 CET1 ratio of 17.3%
• On a transitional basis, distance to trigger 13.3% / €7bn buffer from H1 2019 CET1 ratio of 20.3%
17.3%
7.0%
10.3%€5.4bn
Group CET1 ratio Buffer to trigger Trigger
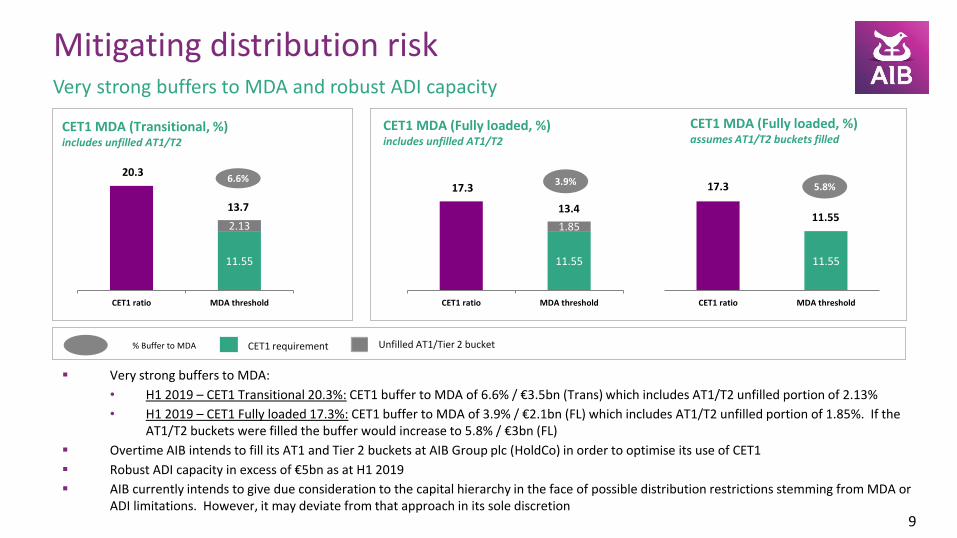
17.3
11.55
CET1 ratio MDA threshold
Very strong buffers to MDA:
• H1 2019 – CET1 Transitional 20.3%: CET1 buffer to MDA of 6.6% / €3.5bn (Trans) which includes AT1/T2 unfilled portion of 2.13%
• H1 2019 – CET1 Fully loaded 17.3%: CET1 buffer to MDA of 3.9% / €2.1bn (FL) which includes AT1/T2 unfilled portion of 1.85%. If the AT1/T2 buckets were filled the buffer would increase to 5.8% / €3bn (FL)
Overtime AIB intends to fill its AT1 and Tier 2 buckets at AIB Group plc (HoldCo) in order to optimise its use of CET1
Robust ADI capacity in excess of €5bn as at H1 2019
AIB currently intends to give due consideration to the capital hierarchy in the face of possible distribution restrictions stemming from MDA or ADI limitations. However, it may deviate from that approach in its sole discretion
Mitigating distribution risk
9
Very strong buffers to MDA and robust ADI capacity
CET1 MDA (Transitional, %)includes unfilled AT1/T2
% Buffer to MDA
3.9%6.6%
CET1 MDA (Fully loaded, %) includes unfilled AT1/T2
CET1 MDA (Fully loaded, %) assumes AT1/T2 buckets filled
5.8%
CET1 requirement Unfilled AT1/Tier 2 bucket
20.3
11.55
2.13
CET1 ratio MDA threshold
13.7
17.3
11.55
1.85
CET1 ratio MDA threshold
13.411.55
SREP – minimum CET1 requirement
10
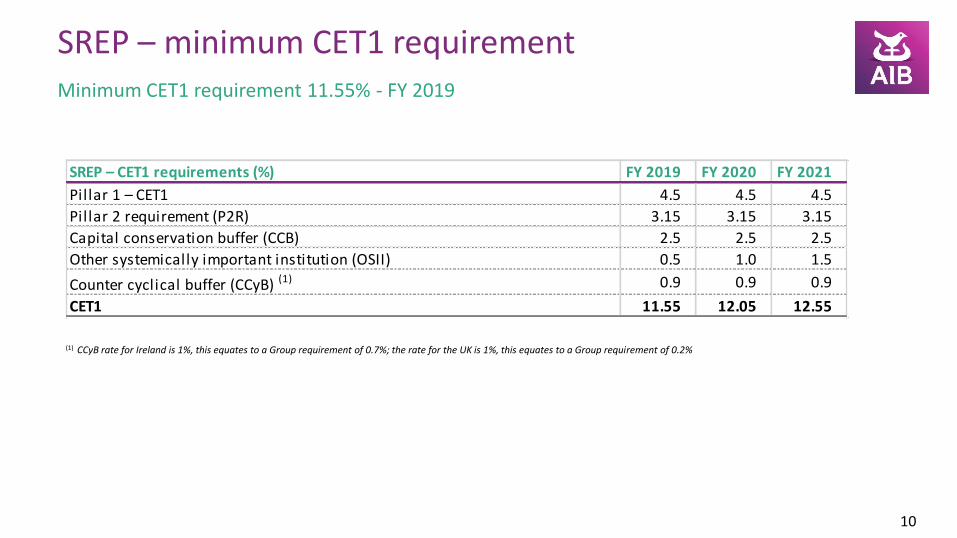
(1) CCyB rate for Ireland is 1%, this equates to a Group requirement of 0.7%; the rate for the UK is 1%, this equates to a Group requirement of 0.2%
Minimum CET1 requirement 11.55% - FY 2019
SREP – CET1 requirements (%) FY 2019 FY 2020 FY 2021
Pillar 1 – CET1 4.5 4.5 4.5
Pillar 2 requirement (P2R) 3.15 3.15 3.15
Capital conservation buffer (CCB) 2.5 2.5 2.5
Other systemically important institution (OSII) 0.5 1.0 1.5
Counter cyclical buffer (CCyB) (1) 0.9 0.9 0.9
CET1 11.55 12.05 12.55
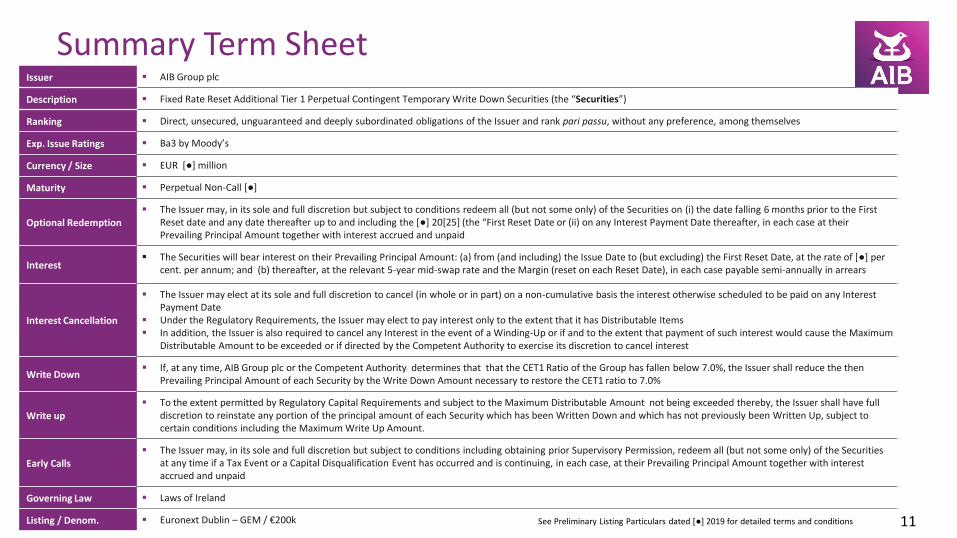
Issuer AIB Group plc
Description Fixed Rate Reset Additional Tier 1 Perpetual Contingent Temporary Write Down Securities (the “Securities”)
Ranking Direct, unsecured, unguaranteed and deeply subordinated obligations of the Issuer and rank pari passu, without any preference, among themselves
Exp. Issue Ratings Ba3 by Moody’s
Currency / Size EUR [●] million
Maturity Perpetual Non-Call [●]
Optional Redemption The Issuer may, in its sole and full discretion but subject to conditions redeem all (but not some only) of the Securities on (i) the date falling 6 months prior to the First
Reset date and any date thereafter up to and including the [●] 20[25] (the “First Reset Date or (ii) on any Interest Payment Date thereafter, in each case at their Prevailing Principal Amount together with interest accrued and unpaid
Interest The Securities will bear interest on their Prevailing Principal Amount: (a) from (and including) the Issue Date to (but excluding) the First Reset Date, at the rate of [●] per
cent. per annum; and (b) thereafter, at the relevant 5-year mid-swap rate and the Margin (reset on each Reset Date), in each case payable semi-annually in arrears
Interest Cancellation
The Issuer may elect at its sole and full discretion to cancel (in whole or in part) on a non-cumulative basis the interest otherwise scheduled to be paid on any Interest Payment Date
Under the Regulatory Requirements, the Issuer may elect to pay interest only to the extent that it has Distributable Items In addition, the Issuer is also required to cancel any Interest in the event of a Winding-Up or if and to the extent that payment of such interest would cause the Maximum
Distributable Amount to be exceeded or if directed by the Competent Authority to exercise its discretion to cancel interest
Write Down If, at any time, AIB Group plc or the Competent Authority determines that that the CET1 Ratio of the Group has fallen below 7.0%, the Issuer shall reduce the then
Prevailing Principal Amount of each Security by the Write Down Amount necessary to restore the CET1 ratio to 7.0%
Write up To the extent permitted by Regulatory Capital Requirements and subject to the Maximum Distributable Amount not being exceeded thereby, the Issuer shall have full
discretion to reinstate any portion of the principal amount of each Security which has been Written Down and which has not previously been Written Up, subject to certain conditions including the Maximum Write Up Amount.
Early Calls The Issuer may, in its sole and full discretion but subject to conditions including obtaining prior Supervisory Permission, redeem all (but not some only) of the Securities
at any time if a Tax Event or a Capital Disqualification Event has occurred and is continuing, in each case, at their Prevailing Principal Amount together with interest accrued and unpaid
Governing Law Laws of Ireland
Listing / Denom. Euronext Dublin – GEM / €200k
Summary Term Sheet
11See Preliminary Listing Particulars dated [●] 2019 for detailed terms and conditions

Key Financials – H1 2019
AIB Group plc

Solid operational and financial performance
Financial highlights H1 2019
13
Pre-exceptional PBT €567m
NIM 2.46%; widening spread between customer loans and deposits
Costs €744m, up 6% year on year; renewed focus on cost discipline
New lending €6bn up 8%; mortgage lending up 8%
NPE(1) €4.7bn (7.5% of gross loans), reduced by €1.4bn (22%) in H1 2019
CET1 (FL) 17.3%; solid underlying profit generation supporting growth and capital return
• Indicative TRIM impact for AIB mortgage model estimated c. 90bps
MREL issuance €3.3bn to date; well-positioned to meet expected MREL requirement
(1) NPE exclude c.€0.2bn of off-balance sheet commitments
45
50
55
60
65
Jan-13 Jan-14 Jan-15 Jan-16 Jan-17 Jan-18 Jan-19
Irish Services Irish Manufacturing Eurozone Composite
Source: Markit via Thomson Datastream
0
50
100
150
0
10,000
20,000
30,000
2013 2014 2015 2016 2017 2018
Normalised demand
Completions Commencements Registrations RHS:HPI
Source: CSO, Department of Housing, AIB ERU, National House price index Jan 05=100
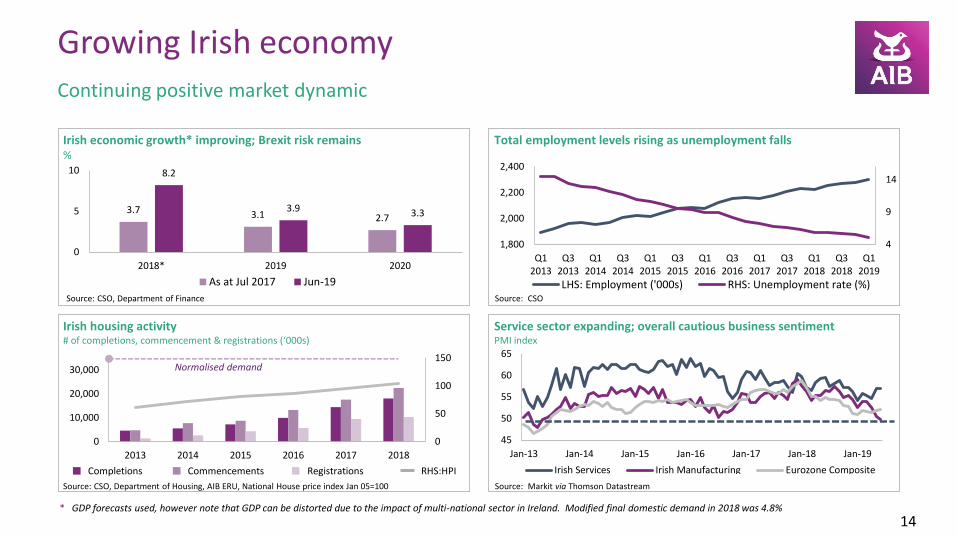
Continuing positive market dynamic
Growing Irish economy
14
Irish housing activity # of completions, commencement & registrations (‘000s)
* GDP forecasts used, however note that GDP can be distorted due to the impact of multi-national sector in Ireland. Modified final domestic demand in 2018 was 4.8%
Service sector expanding; overall cautious business sentimentPMI index
Source: CSOSource: CSO, Department of Finance
Irish economic growth* improving; Brexit risk remains%
Total employment levels rising as unemployment falls
4
9
14
1,800
2,000
2,200
2,400
Q12013
Q32013
Q12014
Q32014
Q12015
Q32015
Q12016
Q32016
Q12017
Q32017
Q12018
Q32018
Q12019
LHS: Employment ('000s) RHS: Unemployment rate (%)
3.7 3.1 2.7
8.2
3.9 3.3
0
5
10
2018* 2019 2020
As at Jul 2017 Jun-19
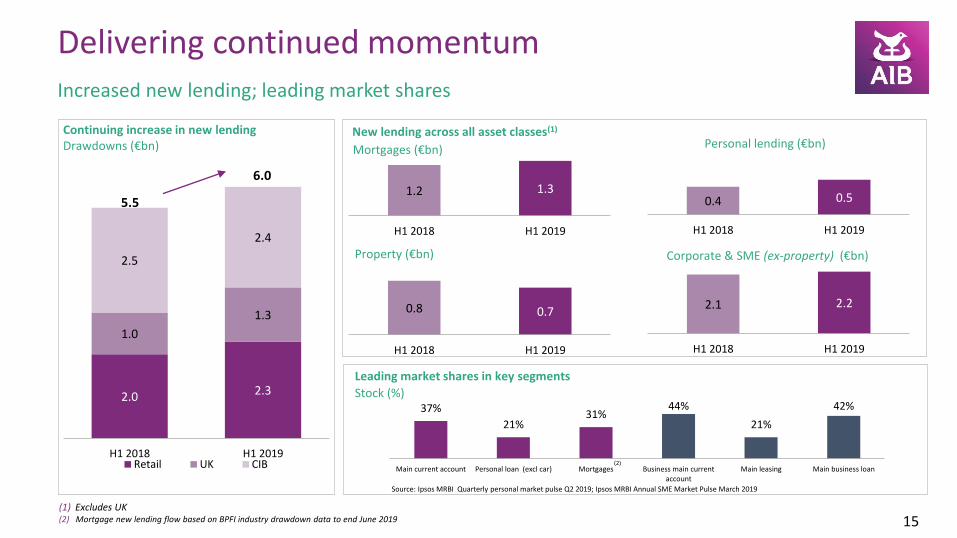
Increased new lending; leading market shares
Delivering continued momentum
15
Continuing increase in new lendingDrawdowns (€bn)
Leading market shares in key segments
2.0 2.3
1.0
1.3
2.5
2.4
H1 2018 H1 2019Retail UK CIB
37%
21%31%
44%
21%
42%
Main current account Personal loan (excl car) Mortgages Business main currentaccount
Main leasing Main business loan
Source: Ipsos MRBI Quarterly personal market pulse Q2 2019; Ipsos MRBI Annual SME Market Pulse March 2019
(2)
6.0
5.5
(1) Excludes UK(2) Mortgage new lending flow based on BPFI industry drawdown data to end June 2019
Mortgages (€bn)
1.2 1.3
H1 2018 H1 2019
0.4 0.5
H1 2018 H1 2019
Property (€bn)
Personal lending (€bn)New lending across all asset classes(1)
0.8 0.7
H1 2018 H1 2019
2.1 2.2
H1 2018 H1 2019
Corporate & SME (ex-property) (€bn)
Stock (%)
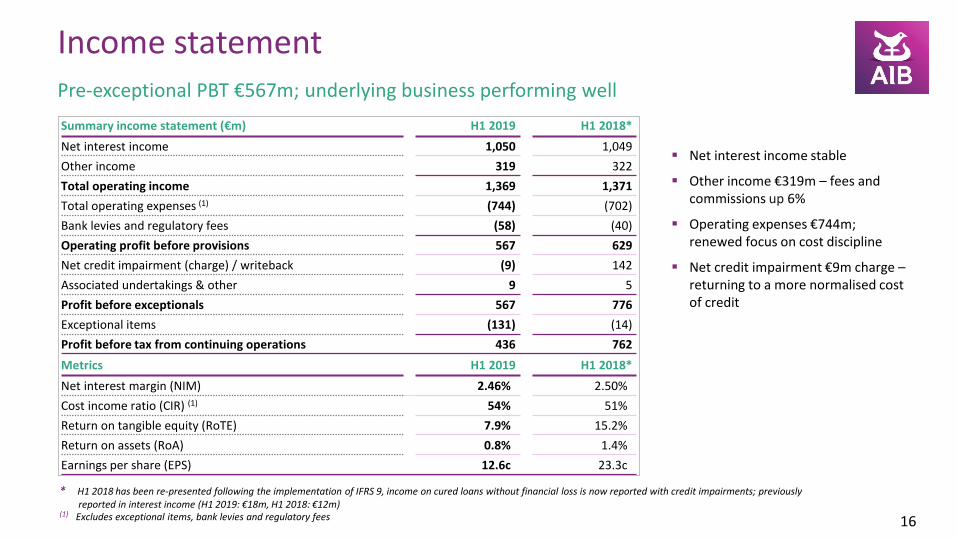
Summary income statement (€m) H1 2019 H1 2018*
Net interest income 1,050 1,049
Other income 319 322
Total operating income 1,369 1,371
Total operating expenses (1) (744) (702)
Bank levies and regulatory fees (58) (40)
Operating profit before provisions 567 629
Net credit impairment (charge) / writeback (9) 142
Associated undertakings & other 9 5
Profit before exceptionals 567 776
Exceptional items (131) (14)
Profit before tax from continuing operations 436 762
Metrics H1 2019 H1 2018*
Net interest margin (NIM) 2.46% 2.50%
Cost income ratio (CIR) (1) 54% 51%
Return on tangible equity (RoTE) 7.9% 15.2%
Return on assets (RoA) 0.8% 1.4%
Earnings per share (EPS) 12.6c 23.3c
Pre-exceptional PBT €567m; underlying business performing well
Income statement
16
Net interest income stable
Other income €319m – fees and commissions up 6%
Operating expenses €744m; renewed focus on cost discipline
Net credit impairment €9m charge –returning to a more normalised cost of credit
* H1 2018 has been re-presented following the implementation of IFRS 9, income on cured loans without financial loss is now reported with credit impairments; previously reported in interest income (H1 2019: €18m, H1 2018: €12m)
(1) Excludes exceptional items, bank levies and regulatory fees
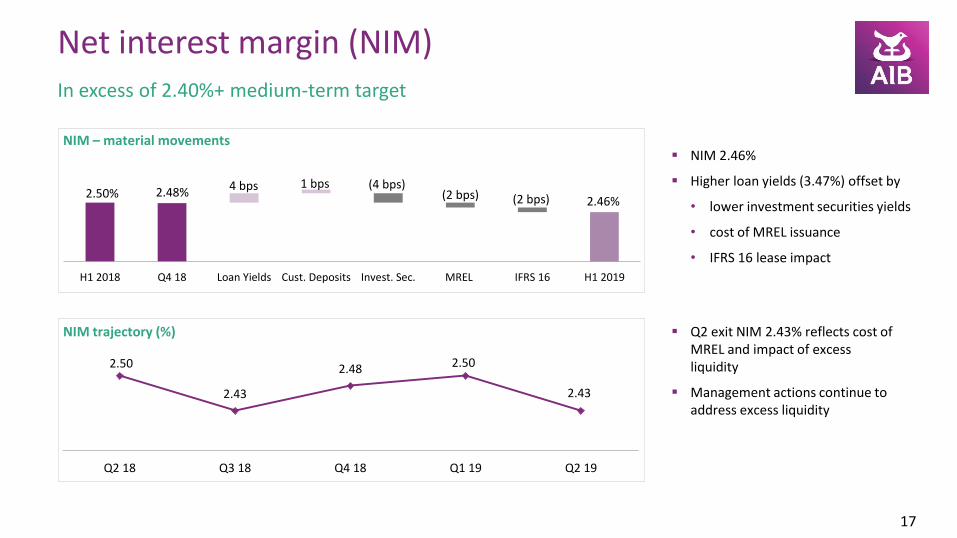
In excess of 2.40%+ medium-term target
Net interest margin (NIM)
NIM – material movements
17
NIM trajectory (%)
H1 2018 Q4 18 Loan Yields Cust. Deposits Invest. Sec. MREL IFRS 16 H1 2019
4 bps (4 bps)(2 bps) 2.46%
2.48% (2 bps)
NIM 2.46%
Higher loan yields (3.47%) offset by
• lower investment securities yields
• cost of MREL issuance
• IFRS 16 lease impact
Q2 exit NIM 2.43% reflects cost of MREL and impact of excess liquidity
Management actions continue to address excess liquidity
2.50
2.43
2.48 2.50
2.43
Q2 18 Q3 18 Q4 18 Q1 19 Q2 19
2.50%1 bps
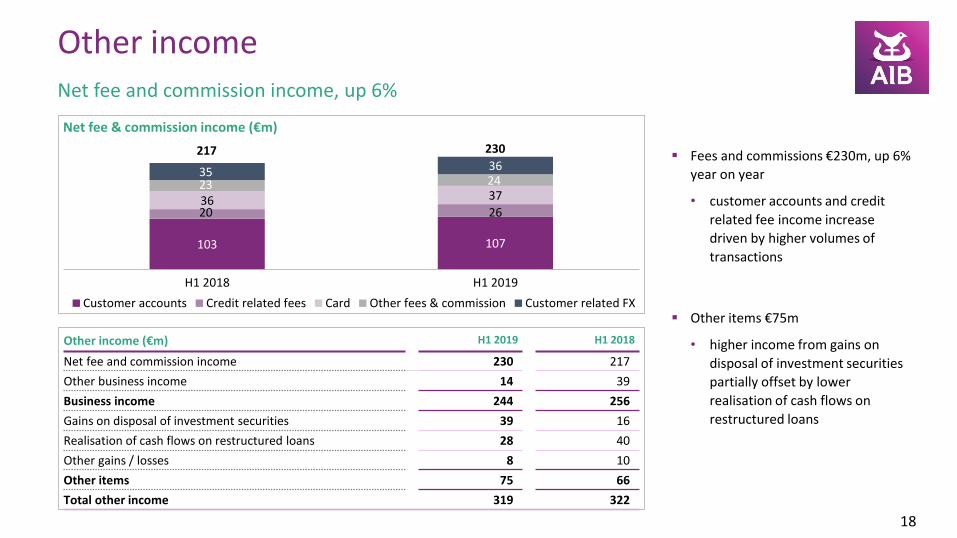
Other income (€m) H1 2019 H1 2018
Net fee and commission income 230 217
Other business income 14 39
Business income 244 256
Gains on disposal of investment securities 39 16
Realisation of cash flows on restructured loans 28 40
Other gains / losses 8 10
Other items 75 66
Total other income 319 322
Net fee and commission income, up 6%
Other income
Net fee & commission income (€m)
18
Fees and commissions €230m, up 6%
year on year
• customer accounts and credit
related fee income increase
driven by higher volumes of
transactions
Other items €75m
• higher income from gains on
disposal of investment securities
partially offset by lower
realisation of cash flows on
restructured loans
103 107
20 2636 3723 2435 36
H1 2018 H1 2019
Customer accounts Credit related fees Card Other fees & commission Customer related FX
230217
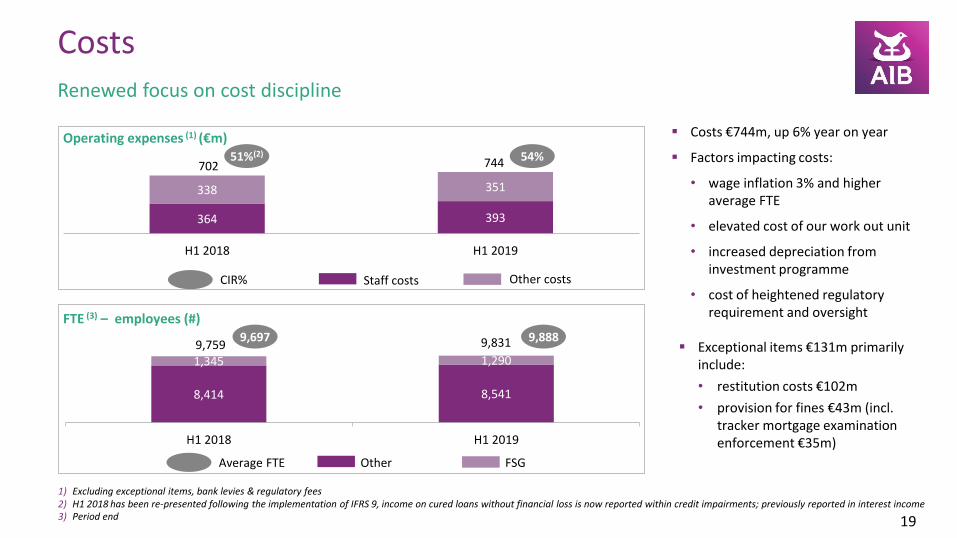
Renewed focus on cost discipline
Costs
Operating expenses (1) (€m)
19
FTE (3) – employees (#)
Costs €744m, up 6% year on year
Factors impacting costs:
• wage inflation 3% and higher average FTE
• elevated cost of our work out unit
• increased depreciation from investment programme
• cost of heightened regulatory requirement and oversight
Exceptional items €131m primarily include:
• restitution costs €102m
• provision for fines €43m (incl. tracker mortgage examination enforcement €35m)
1) Excluding exceptional items, bank levies & regulatory fees2) H1 2018 has been re-presented following the implementation of IFRS 9, income on cured loans without financial loss is now reported within credit impairments; previously reported in interest income3) Period end
364 393
338 351
H1 2018 H1 2019
8,414 8,541
1,345 1,290
H1 2018 H1 2019
702 744
9,8319,759
51%(2) 54%
9,697 9,888
Average FTE Other FSG
CIR% Other costsStaff costs

Key capital metrics Jun 2019 Dec 2018
CET1 ratio (FL) 17.3% 17.5%
Leverage ratio (FL) 9.8% 10.1%
Balance sheet (€bn) Jun 2019 Dec 2018
Performing loans 58.0 56.8
Non-performing loans 4.7 6.1
Gross loans to customers 62.7 62.9
Expected credit loss allowance (1.6) (2.0)
Net loans to customers 61.1 60.9
Investment securities 17.1 16.9
Loans to banks 10.6 8.0
Other assets 6.8 5.7
Total assets 95.6 91.5
Customer accounts 69.5 67.7
Deposits by central banks / banks 1.0 0.8
Debt securities in issue 6.9 5.7
Other liabilities 4.2 3.4
Total liabilities 81.6 77.6
Equity 14.0 13.9
Total liabilities & equity 95.6 91.5
New lending growth supported by strong liquidity and capital ratios
Balance sheet
20
Performing loans increased €1.2bn
Sustainable new lending exceeding redemptions
Loans to banks increased €2.6bn impacted by excess liquidity due to increase in customer accounts and MREL issuance
Customer accounts up €1.8bn
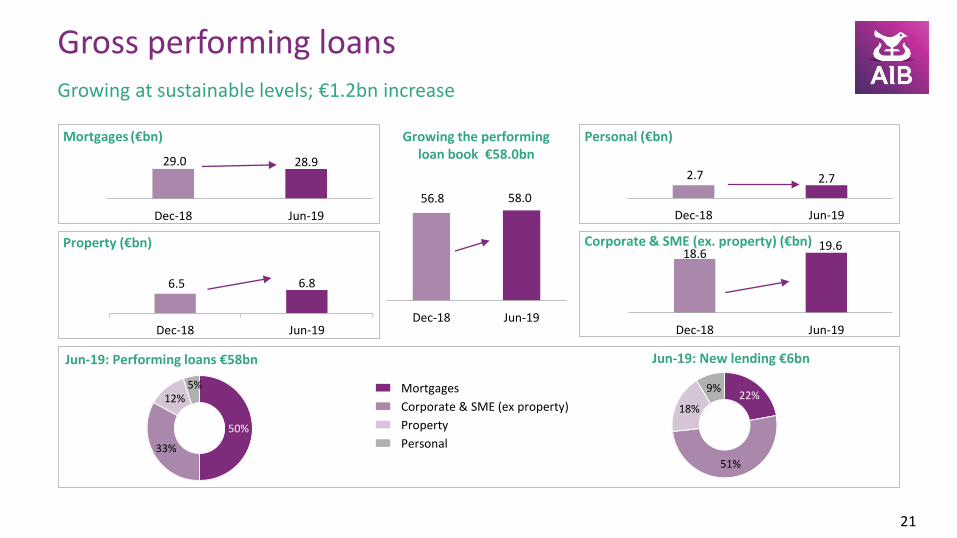
Growing at sustainable levels; €1.2bn increase
Gross performing loans
21
6.5 6.8
Dec-18 Jun-19
22%
51%
18%
9%
50%
33%
12%5%
Jun-19: Performing loans €58bn Jun-19: New lending €6bn
Personal
Property
Corporate & SME (ex property)
Mortgages
Growing the performing loan book €58.0bn
56.8 58.0
Dec-18 Jun-19
Mortgages (€bn)
Property (€bn)
Personal (€bn)
Corporate & SME (ex. property) (€bn)
29.0 28.9
Dec-18 Jun-19
18.619.6
Dec-18 Jun-19
2.7 2.7
Dec-18 Jun-19
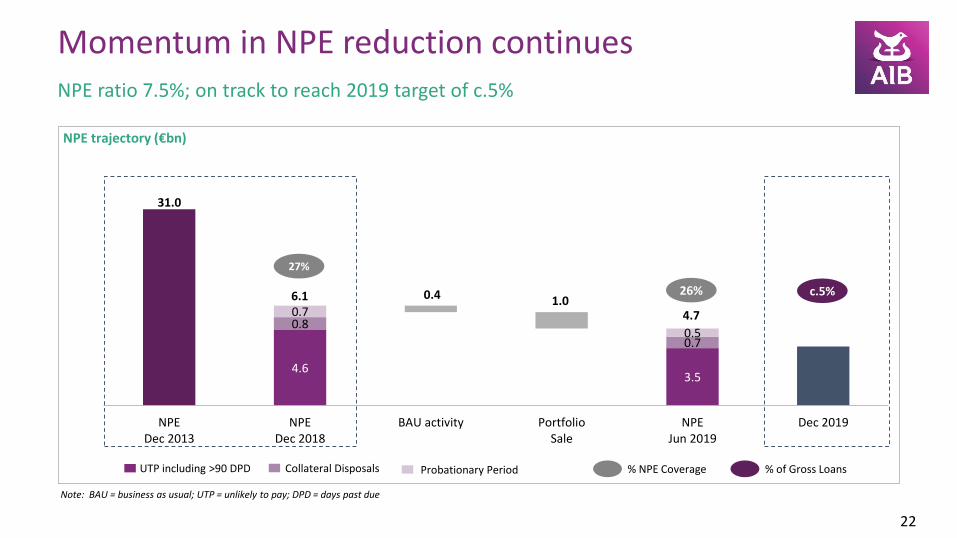
NPE ratio 7.5%; on track to reach 2019 target of c.5%
Momentum in NPE reduction continues
22
NPE trajectory (€bn)
4.63.5
0.8
0.4 1.0
0.7
0.7
0.5
NPEDec 2013
NPEDec 2018
BAU activity PortfolioSale
NPEJun 2019
Dec 2019
4.7
31.0
6.1
UTP including >90 DPD Collateral Disposals Probationary Period
27%
26% c.5%
% NPE Coverage % of Gross Loans
Note: BAU = business as usual; UTP = unlikely to pay; DPD = days past due
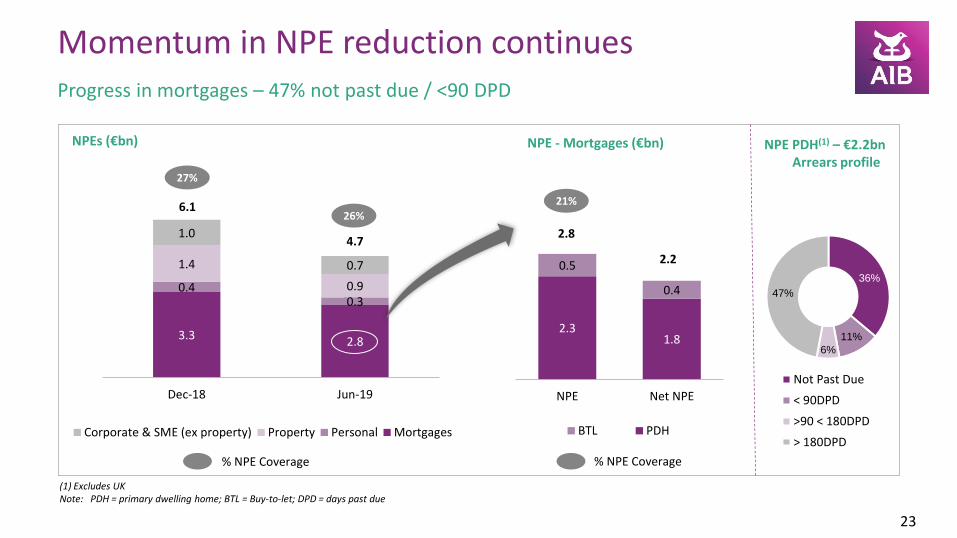
Progress in mortgages – 47% not past due / <90 DPD
Momentum in NPE reduction continues
23
6.1
4.7
3.3 2.8
0.40.3
1.4
0.9
1.0
0.7
Dec-18 Jun-19
Corporate & SME (ex property) Property Personal Mortgages
6.1
4.7
% NPE Coverage
26%
27%
2.31.8
0.5
0.4
NPE Net NPE
BTL PDH
21%
NPE - Mortgages (€bn)
% NPE Coverage
NPE PDH(1) – €2.2bn Arrears profile
36%
11%
6%
47%
Not Past Due
< 90DPD
>90 < 180DPD
> 180DPD
(1) Excludes UKNote: PDH = primary dwelling home; BTL = Buy-to-let; DPD = days past due
2.8
2.2
NPEs (€bn)
3.3
Jun-19
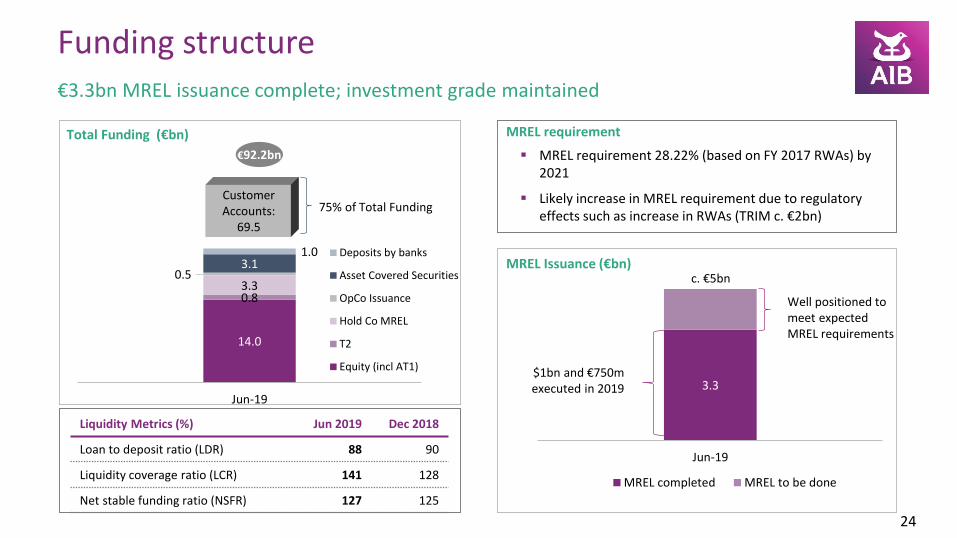
MREL completed MREL to be done
Liquidity Metrics (%) Jun 2019 Dec 2018
Loan to deposit ratio (LDR) 88 90
Liquidity coverage ratio (LCR) 141 128
Net stable funding ratio (NSFR) 127 125
€3.3bn MREL issuance complete; investment grade maintained
Funding structure
24
Total Funding (€bn)
14.0
0.83.3
0.53.1
1.0
Jun-19
Deposits by banks
Asset Covered Securities
OpCo Issuance
Hold Co MREL
T2
Equity (incl AT1)
75% of Total Funding
€92.2bn
Customer Accounts:
69.5
MREL Issuance (€bn)
$1bn and €750m executed in 2019
Well positioned to meet expected MREL requirements
c. €5bn
MREL requirement 28.22% (based on FY 2017 RWAs) by 2021
Likely increase in MREL requirement due to regulatory effects such as increase in RWAs (TRIM c. €2bn)
MREL requirement
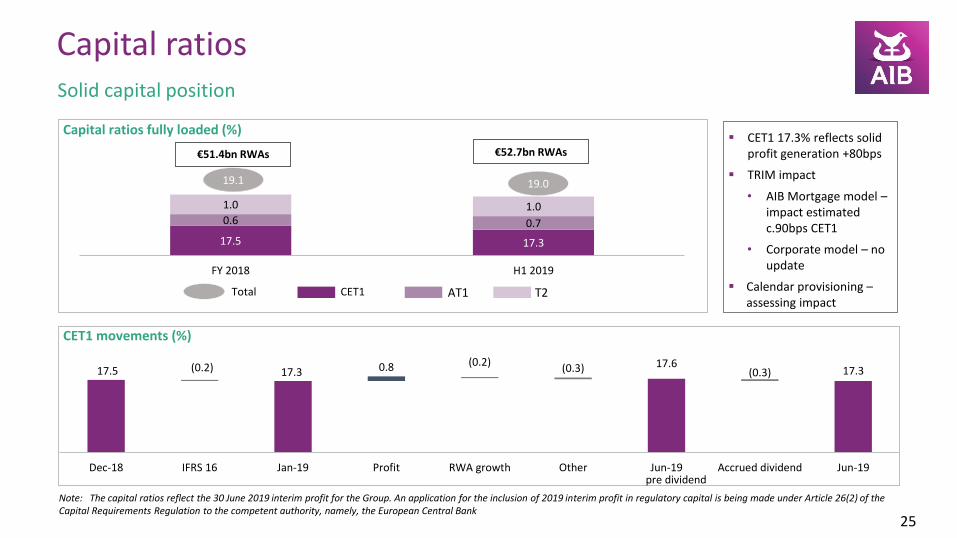
17.5 17.317.6
17.3(0.2) 0.8 (0.2)(0.3) (0.3)
Dec-18 IFRS 16 Jan-19 Profit RWA growth Other Jun-19 Accrued dividend Jun-19
Capital ratios
25
Solid capital position
17.5 17.3
0.6 0.7
1.0 1.0
FY 2018 H1 2019
19.1 19.0
T2AT1CET1Total
pre dividend
CET1 17.3% reflects solid profit generation +80bps
TRIM impact
• AIB Mortgage model –impact estimated c.90bps CET1
• Corporate model – no update
Calendar provisioning –assessing impact
Capital ratios fully loaded (%)
CET1 movements (%)
€51.4bn RWAs €52.7bn RWAs
Note: The capital ratios reflect the 30 June 2019 interim profit for the Group. An application for the inclusion of 2019 interim profit in regulatory capital is being made under Article 26(2) of the Capital Requirements Regulation to the competent authority, namely, the European Central Bank
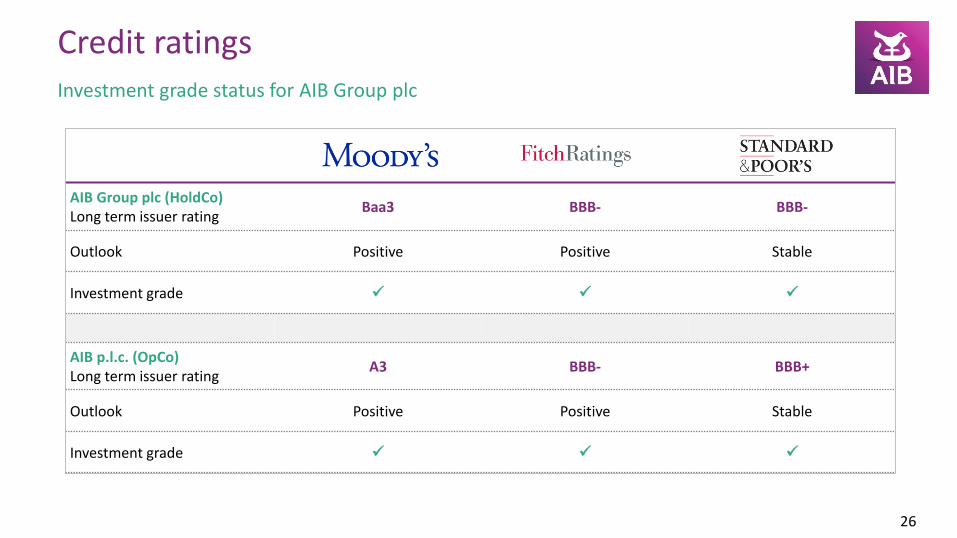
AIB Group plc (HoldCo) Long term issuer rating
Baa3 BBB- BBB-
Outlook Positive Positive Stable
Investment grade
AIB p.l.c. (OpCo) Long term issuer rating
A3 BBB- BBB+
Outlook Positive Positive Stable
Investment grade
Investment grade status for AIB Group plc
Credit ratings
26
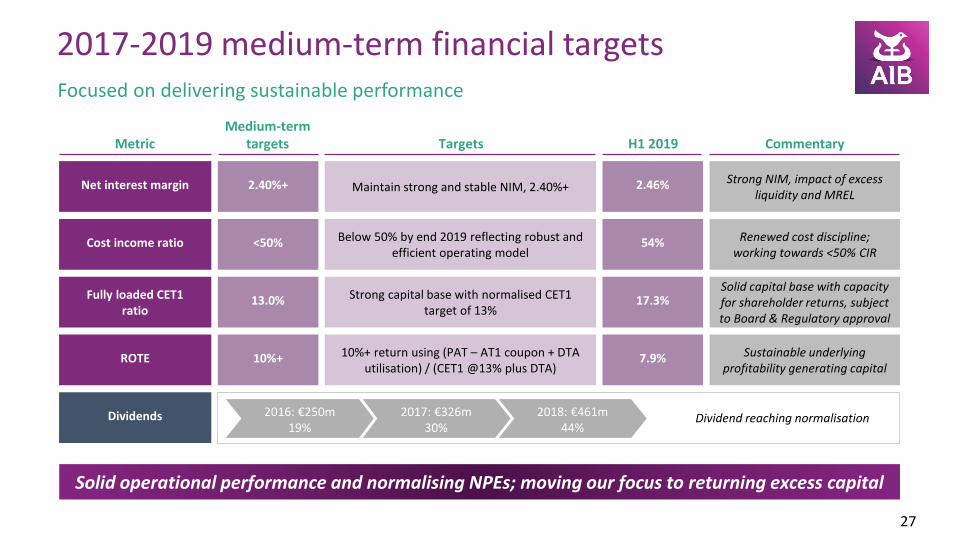
2017-2019 medium-term financial targets
27
Focused on delivering sustainable performance
Dividends
Targets H1 2019Medium-term
targetsMetric Commentary
Maintain strong and stable NIM, 2.40%+ 2.46%2.40%+Net interest margin Strong NIM, impact of excess liquidity and MREL
Cost income ratio Below 50% by end 2019 reflecting robust and efficient operating model
54%<50% Renewed cost discipline; working towards <50% CIR
Fully loaded CET1ratio
Strong capital base with normalised CET1 target of 13%
17.3%13.0%Solid capital base with capacity for shareholder returns, subject to Board & Regulatory approval
ROTE 10%+ return using (PAT – AT1 coupon + DTA utilisation) / (CET1 @13% plus DTA)
7.9%10%+ Sustainable underlying profitability generating capital
Dividend reaching normalisation2016: €250m19%
2017: €326m30%
2018: €461m44%
Solid operational performance and normalising NPEs; moving our focus to returning excess capital

Appendix
AIB Group plc
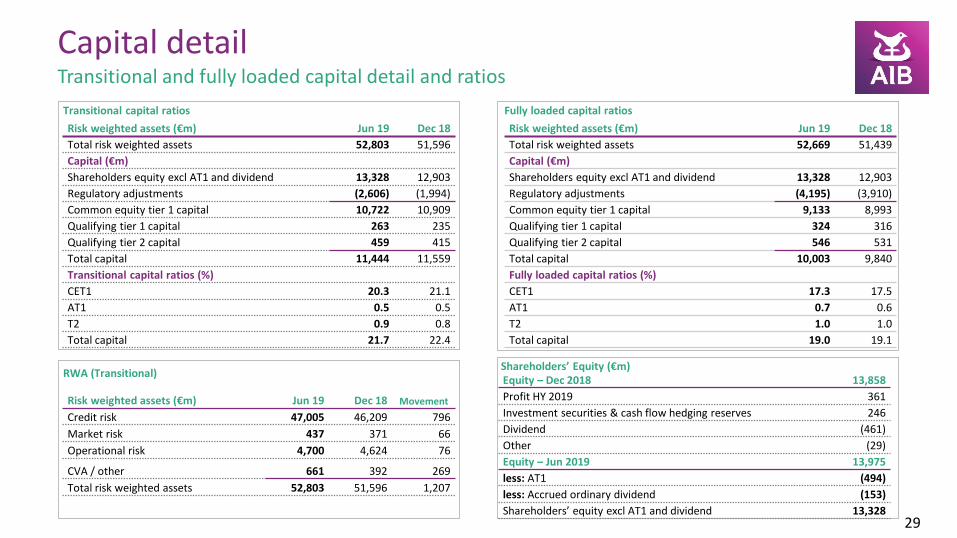
Risk weighted assets (€m) Jun 19 Dec 18
Total risk weighted assets 52,669 51,439
Capital (€m)
Shareholders equity excl AT1 and dividend 13,328 12,903
Regulatory adjustments (4,195) (3,910)
Common equity tier 1 capital 9,133 8,993
Qualifying tier 1 capital 324 316
Qualifying tier 2 capital 546 531
Total capital 10,003 9,840
Fully loaded capital ratios (%)
CET1 17.3 17.5
AT1 0.7 0.6
T2 1.0 1.0
Total capital 19.0 19.1
Transitional and fully loaded capital detail and ratios
Capital detail
29
Transitional capital ratios Fully loaded capital ratios
Risk weighted assets (€m) Jun 19 Dec 18
Total risk weighted assets 52,803 51,596
Capital (€m)
Shareholders equity excl AT1 and dividend 13,328 12,903
Regulatory adjustments (2,606) (1,994)
Common equity tier 1 capital 10,722 10,909
Qualifying tier 1 capital 263 235
Qualifying tier 2 capital 459 415
Total capital 11,444 11,559
Transitional capital ratios (%)
CET1 20.3 21.1
AT1 0.5 0.5
T2 0.9 0.8
Total capital 21.7 22.4
RWA (Transitional)Shareholders’ Equity (€m)Equity – Dec 2018 13,858
Profit HY 2019 361
Investment securities & cash flow hedging reserves 246
Dividend (461)
Other (29)
Equity – Jun 2019 13,975
less: AT1 (494)
less: Accrued ordinary dividend (153)
Shareholders’ equity excl AT1 and dividend 13,328
Risk weighted assets (€m) Jun 19 Dec 18 Movement
Credit risk 47,005 46,209 796
Market risk 437 371 66
Operational risk 4,700 4,624 76
CVA / other 661 392 269
Total risk weighted assets 52,803 51,596 1,207
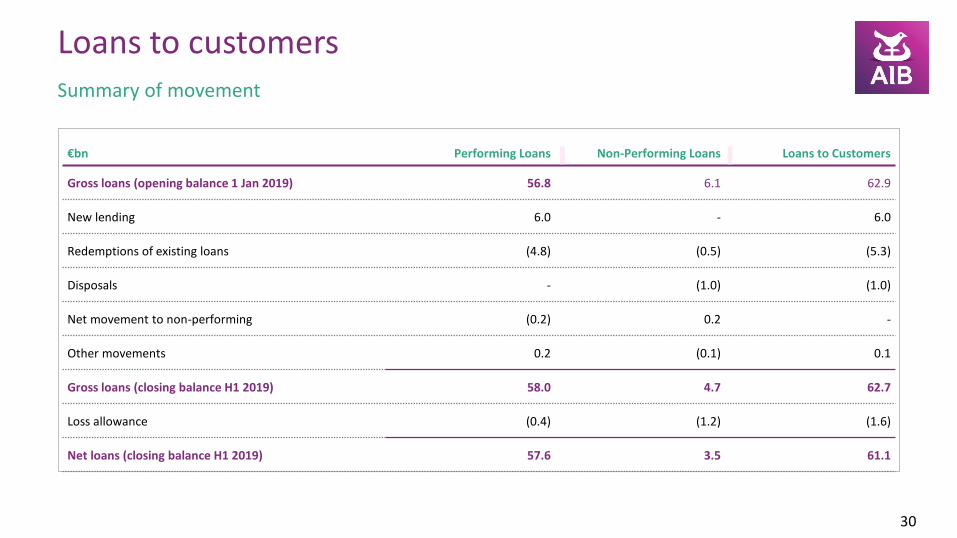
Summary of movement
Loans to customers
30
€bn Performing Loans Non-Performing Loans Loans to Customers
Gross loans (opening balance 1 Jan 2019) 56.8 6.1 62.9
New lending 6.0 - 6.0
Redemptions of existing loans (4.8) (0.5) (5.3)
Disposals - (1.0) (1.0)
Net movement to non-performing (0.2) 0.2 -
Other movements 0.2 (0.1) 0.1
Gross loans (closing balance H1 2019) 58.0 4.7 62.7
Loss allowance (0.4) (1.2) (1.6)
Net loans (closing balance H1 2019) 57.6 3.5 61.1

€bn Mortgages PDH BTL Personal PropertyCorporate & SME
(ex Property) Total
H1 2019
Customer loans 31.7 28.9 2.8 3.0 7.8 20.2 62.7
of which NPEs 2.8 2.3 0.5 0.3 0.9 0.7 4.7
ECL on NPE 0.6 0.5 0.1 0.1 0.3 0.2 1.2
ECL / NPE coverage % 21 21 22 52 31 31 26
FY 2018
Customer loans 32.3 29.0 3.3 3.1 7.9 19.6 62.9
of which NPEs 3.3 2.5 0.8 0.4 1.4 1.0 6.1
ECL on NPE 0.6 0.5 0.1 0.2 0.4 0.4 1.6
ECL / NPE coverage % 20 20 20 50 29 36 27
Continued progress in NPE reduction across all asset classes
Asset quality by portfolio
31
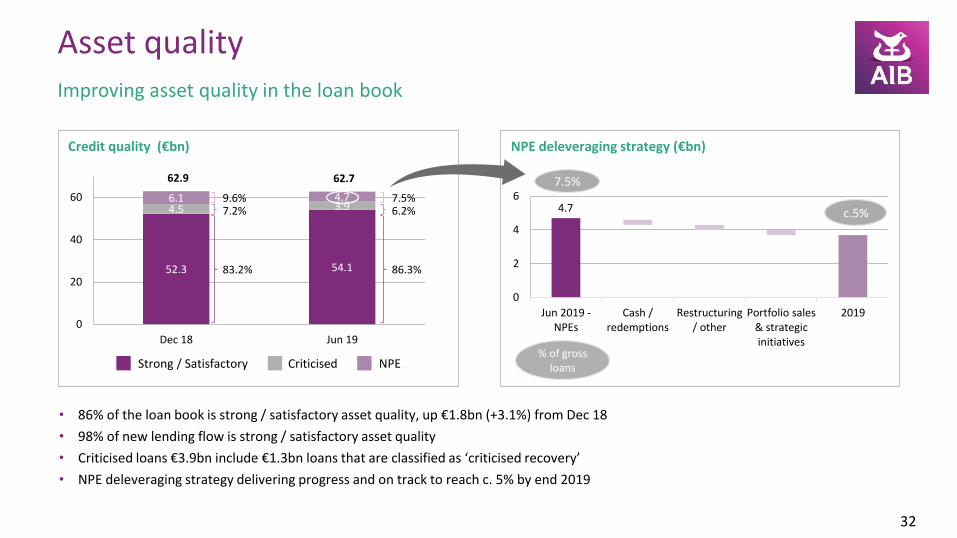
Improving asset quality in the loan book
Asset quality
Credit quality (€bn)
32
• 86% of the loan book is strong / satisfactory asset quality, up €1.8bn (+3.1%) from Dec 18
• 98% of new lending flow is strong / satisfactory asset quality
• Criticised loans €3.9bn include €1.3bn loans that are classified as ‘criticised recovery’
• NPE deleveraging strategy delivering progress and on track to reach c. 5% by end 2019
NPE deleveraging strategy (€bn)
52.3 54.1
4.5 3.96.1 4.7
0
20
40
60
Dec 18 Jun 19
Strong / Satisfactory Criticised NPE
4.7
0
2
4
6
Jun 2019 -NPEs
Cash /redemptions
Restructuring/ other
Portfolio sales& strategicinitiatives
2019
% of gross loans
7.5%
c.5%
62.762.9
9.6%7.2%
83.2%
7.5%6.2%
86.3%
30%
56%
14%
Dec-18
26.6 26.8
2.4 2.13.3 2.8
0
10
20
30
Dec 18 Jun 19
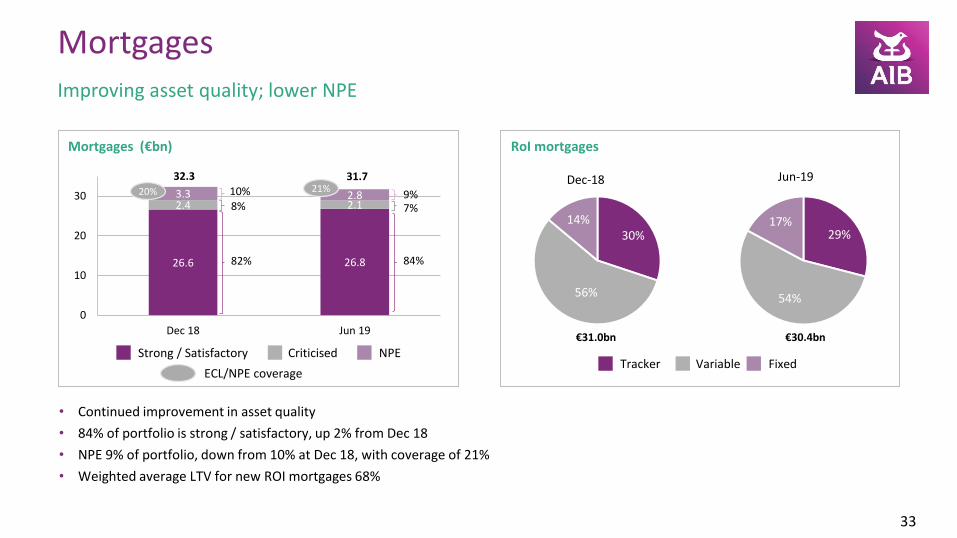
Improving asset quality; lower NPE
Mortgages
Mortgages (€bn)
33
• Continued improvement in asset quality
• 84% of portfolio is strong / satisfactory, up 2% from Dec 18
• NPE 9% of portfolio, down from 10% at Dec 18, with coverage of 21%
• Weighted average LTV for new ROI mortgages 68%
Strong / Satisfactory Criticised NPE
32.3
10%8%
82%
RoI mortgages
ECL/NPE coverage
20%
29%
54%
17%
Jun-19
Tracker Variable Fixed
€31.0bn €30.4bn
9%7%
84%
31.721%

2.4 2.4
0.3 0.3
0.4 0.3
0
1
2
3
Dec 18 Jun 19
Lower NPE
Personal
Personal (€bn)
34
Portfolio €3.0bn comprises €2.3bn loans and €0.7bn credit
card facilities
Demand remains strong, increased online approval
through internet and mobile credit application activity
NPE 9% of portfolio down from 11% at Dec 18 with
coverage of 52%
3.1
Strong / Satisfactory Criticised NPE
ECL/NPE coverage
50% 11%
80%
9%
3.0
9%
82%
9%52%
5.9 6.4
0.60.5
1.4 0.9
0
2
4
6
8
Dec 18 Jun 19
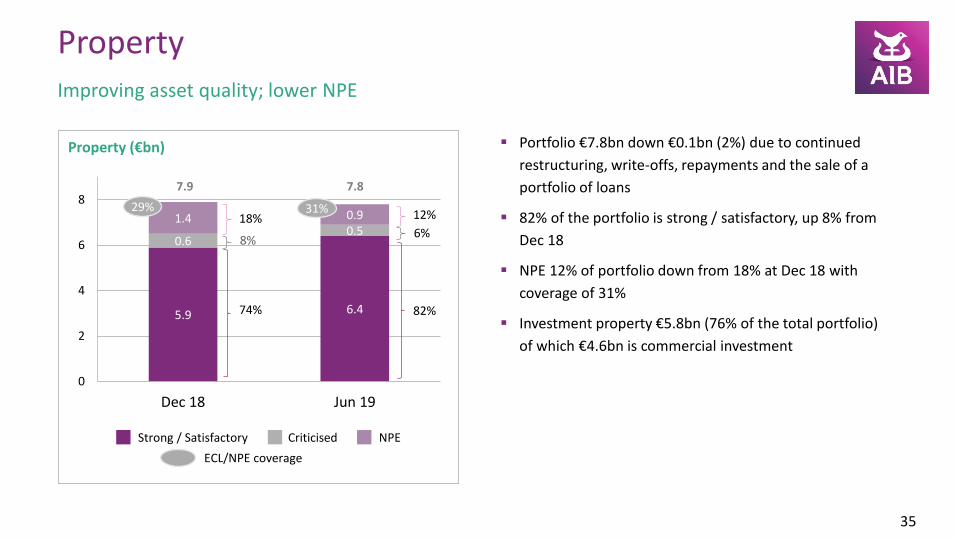
Improving asset quality; lower NPE
Property
Property (€bn)
35
Portfolio €7.8bn down €0.1bn (2%) due to continued
restructuring, write-offs, repayments and the sale of a
portfolio of loans
82% of the portfolio is strong / satisfactory, up 8% from
Dec 18
NPE 12% of portfolio down from 18% at Dec 18 with
coverage of 31%
Investment property €5.8bn (76% of the total portfolio)
of which €4.6bn is commercial investment
7.9
Strong / Satisfactory Criticised NPE
ECL/NPE coverage
29%18%
8%
74%
12%
6%
82%
31%
7.8
17.4 18.5
1.2 1.11.00.7
0
5
10
15
20
Dec 18 Jun 19
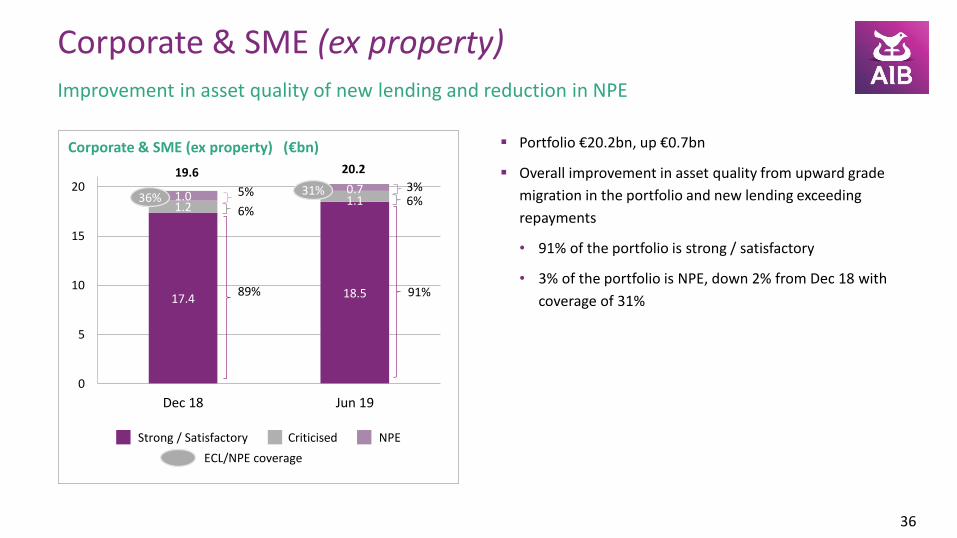
Improvement in asset quality of new lending and reduction in NPE
Corporate & SME (ex property)
Corporate & SME (ex property) (€bn)
36
Portfolio €20.2bn, up €0.7bn
Overall improvement in asset quality from upward grade
migration in the portfolio and new lending exceeding
repayments
• 91% of the portfolio is strong / satisfactory
• 3% of the portfolio is NPE, down 2% from Dec 18 with
coverage of 31%
19.6
Strong / Satisfactory Criticised NPE
ECL/NPE coverage
36% 5%
6%
89%
3%6%
91%
20.2
31%
H1 2019 Dec 2018
€m Stage 1 Stage 2 Stage 3 POCI Total Stage 1 Stage 2 Stage 3 POCI Total
Strong 40,563 950 - 12 41,525 39,148 923 - 3 40,074
Satisfactory 11,173 1,332 - 2 12,507 10,923 1,262 - - 12,185
Total strong / satisfactory 51,736 2,282 - 14 54,032 50,071 2,185 - 3 52,259
Criticised watch 1,059 1,491 - - 2,550 1,226 1,596 - 1 2,823
Criticised recovery 105 1,236 - 6 1,347 184 1,509 - 5 1,698
Total criticised 1,164 2,727 - 6 3,897 1,410 3,105 - 6 4,521
NPE 122 - 4,317 207 4,646 212 - 5,541 227 5,980
Total customer loans 53,022 5,009 4,317 227 62,575 51,693 5,290 5,541 236 62,760
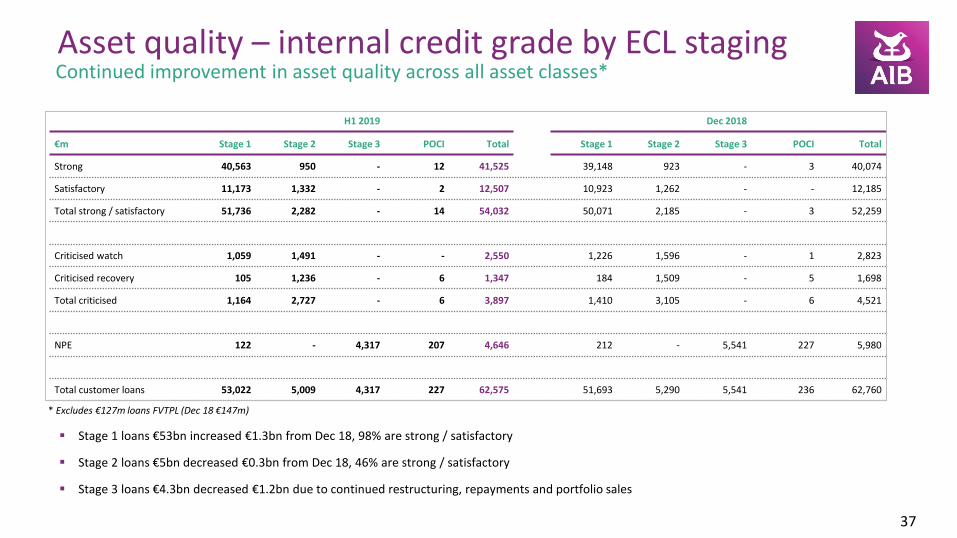
Continued improvement in asset quality across all asset classes*Asset quality – internal credit grade by ECL staging
37
Stage 1 loans €53bn increased €1.3bn from Dec 18, 98% are strong / satisfactory
Stage 2 loans €5bn decreased €0.3bn from Dec 18, 46% are strong / satisfactory
Stage 3 loans €4.3bn decreased €1.2bn due to continued restructuring, repayments and portfolio sales
* Excludes €127m loans FVTPL (Dec 18 €147m)
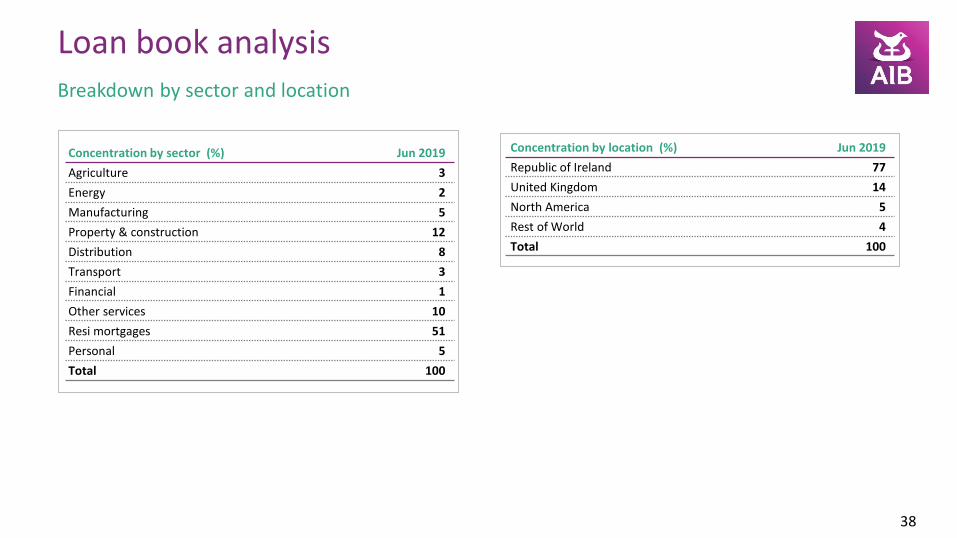
Concentration by location (%) Jun 2019
Republic of Ireland 77
United Kingdom 14
North America 5
Rest of World 4
Total 100
Breakdown by sector and location
Loan book analysis
38
Concentration by sector (%) Jun 2019
Agriculture 3
Energy 2
Manufacturing 5
Property & construction 12
Distribution 8
Transport 3
Financial 1
Other services 10
Resi mortgages 51
Personal 5
Total 100

€16.3bn portfolio of debt securities
Investment securities
39
Key components €bn Analysis of government securities €bn
8.4
1.1
5.0
0.8
7.9
0.9
5.2
1.1
0.0
5.0
10.0
Governmentsecurities
Supernational banksand gov agencies
Euro bank securities Non Euro banksecurities
FY 2018 H1 2019
€16.3bn up from €16.1bn
€39m net gains from disposal of investment debt securities in H1 2019
Average yield of 1.28%, down from 1.50% from HY 18
• yield reducing as higher yielding assets mature
• c. 70% of book maturing <5year
6.3
0.1 0.51.1
0.4
6.2
0.1 0.5 0.7 0.4
0.0
2.0
4.0
6.0
8.0
Ireland Netherlands Italy Spain Rest of world
FY 2018 H1 2019
Maturity & yield profile of debt investment securities
2.9
8.3
3.21.9
0.0
5.0
10.0
< 1 year 1-5 year 5-10 year 10+ year
Volumes Yield without swaps
3.7% 1.5% 0.9% 1.8%
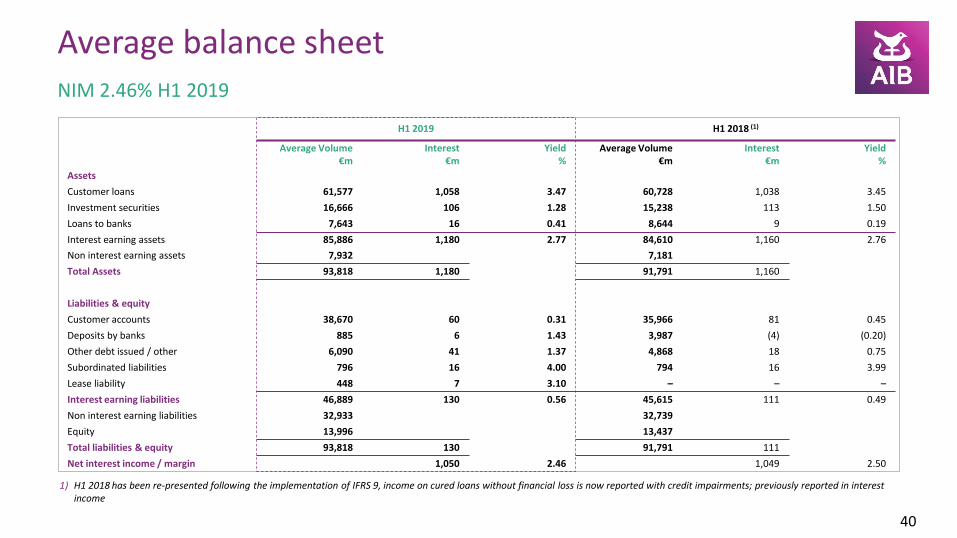
H1 2019 H1 2018 (1)
Average Volume €m
Interest €m
Yield%
Average Volume€m
Interest €m
Yield%
Assets
Customer loans 61,577 1,058 3.47 60,728 1,038 3.45
Investment securities 16,666 106 1.28 15,238 113 1.50
Loans to banks 7,643 16 0.41 8,644 9 0.19
Interest earning assets 85,886 1,180 2.77 84,610 1,160 2.76
Non interest earning assets 7,932 7,181
Total Assets 93,818 1,180 91,791 1,160
Liabilities & equity
Customer accounts 38,670 60 0.31 35,966 81 0.45
Deposits by banks 885 6 1.43 3,987 (4) (0.20)
Other debt issued / other 6,090 41 1.37 4,868 18 0.75
Subordinated liabilities 796 16 4.00 794 16 3.99
Lease liability 448 7 3.10 – – –
Interest earning liabilities 46,889 130 0.56 45,615 111 0.49
Non interest earning liabilities 32,933 32,739
Equity 13,996 13,437
Total liabilities & equity 93,818 130 91,791 111
Net interest income / margin 1,050 2.46 1,049 2.50
NIM 2.46% H1 2019
Average balance sheet
40
1) H1 2018 has been re-presented following the implementation of IFRS 9, income on cured loans without financial loss is now reported with credit impairments; previously reported in interest income
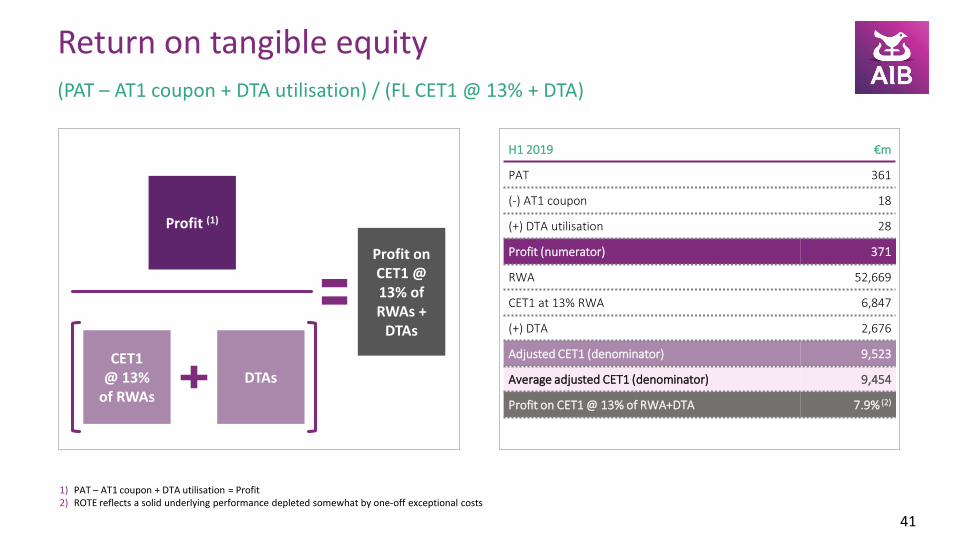
H1 2019 €m
PAT 361
(-) AT1 coupon 18
(+) DTA utilisation 28
Profit (numerator) 371
RWA 52,669
CET1 at 13% RWA 6,847
(+) DTA 2,676
Adjusted CET1 (denominator) 9,523
Average adjusted CET1 (denominator) 9,454
Profit on CET1 @ 13% of RWA+DTA 7.9% (2)
(PAT – AT1 coupon + DTA utilisation) / (FL CET1 @ 13% + DTA)
Return on tangible equity
41
1) PAT – AT1 coupon + DTA utilisation = Profit2) ROTE reflects a solid underlying performance depleted somewhat by one-off exceptional costs
Profit (1)
CET1 @ 13%
of RWAsDTAs
Profit on CET1 @ 13% of RWAs +
DTAs
Name Email Telephone
Niamh Hore Head of IR
[email protected] +353 1 6411817
Janet McConkeyHead of Debt IR
[email protected] +353 1 6418974
Siobhain WalshInvestor Relations
[email protected] +353 1 6411901
Mark Whelan Head of Term Funding
[email protected] +353 1 6417164
Eoin MooreTerm Funding
[email protected] +353 1 6417803
Please contact Investor Relations or Treasury Funding Team for any further information
Contacts
42
Visit our website at aib.ie/investorrelations