Embed Size (px)
Citation preview

INVESTOR PRESENTATION:
26 FEBRUARY 2018
RESULTS FOR THE SIX MONTHS ENDED DECEMBER 2017
MILES DALLY
CHIEF EXECUTIVE
OFFICER

Salient features | Strategic overview | Financial review | Operational reviews | Prospects
PERFORMANCE HEADLINES
Strong earnings growth
Chicken recovery ahead of expectation following restructure, adverse impact on Logistics and Animal Feed in line with expectation
Sugar margins compromised by significant imports despite strong operational performance and volume recovery post drought
Grocery brands continue to perform well in a market showing muted growth
Interim dividend up 50.0%
FINANCIAL HIGHLIGHTS
REVENUE EBITDA
HEADLINEEARNINGS
R12.8bn R1.2bn
R644.7m 74.5c
2.4%
56.9% 56.5%
33.4%
HEPS
HEADLINES – RESULTS FOR THE SIX MONTHS ENDED DECEMBER 2017
3

19%
2015
24%
2017
-4%
2016
31%
2016
18%
2017
15%
2015
15%
2015
14%
2016
12%
2017
Salient features | Strategic overview | Financial review | Operational reviews | Prospects
MOVING TOWARDS A MORE BALANCED PORTFOLIOChicken recovery moderates contribution of other categories
RELATIVE SHARE OF EBITDA 6 MONTHS TO DECEMBER (pre-IAS 39)
16%
15%
2016
Groceries*
Diversified earnings base geared for growth Cyclical Crisis recovery
* The Groceries category cluster includes the Grocery, Speciality, Beverages and Pies business units.
4
Logistics Animal Feed Chicken
26%
28%
25%
2015 2016 2017
12%
2015
15%
2016
9%
2017
13%
2015
16%
2016
12%
2017
SugarMillBake

Salient features | Strategic overview | Financial review | Operational reviews | Prospects
Chicken: Recovering well driven by the revised business model and lower feed prices
Groceries*: Volume growth, lower commodity costs and good cost management yielded solid performance
Animal Feed: Lower commodity costs and better mix
offset the reduced volume impact from Chicken business
unit
MillBake: Industrial action and increased competitor activity adversely impacted Baking while Milling volumes improved
Sugar: Despite strong recovery in volumes post drought, margins declined driven by imports displacing local market sales
Logistics: Reduced volumes from Chicken business unit were partly offset by mitigation strategies
6 MONTHS TO DECEMBER 2017 RESULTS
5
26.6% pre-IAS 39 EBITDA growthEBITDA MARGIN
(pre-IAS 39)
2017
9.3%7.2%
2016
EBITDA GROWTH PER CATEGORY CLUSTER (pre-IAS 39)
EBITDA GROWTH(pre-IAS 39)
2017
26.6%
-15.6%
2016
867.4%
12.4%
8.7%
Chicken Groceries* AnimalFeed
-11.8%
MillBake
-27.0%
Sugar
-27.3%
Logistics
* The Groceries category cluster includes the Grocery, Speciality, Beverages and Pies business units.
Salient features | Strategic overview | Financial review | Operational reviews | Prospects
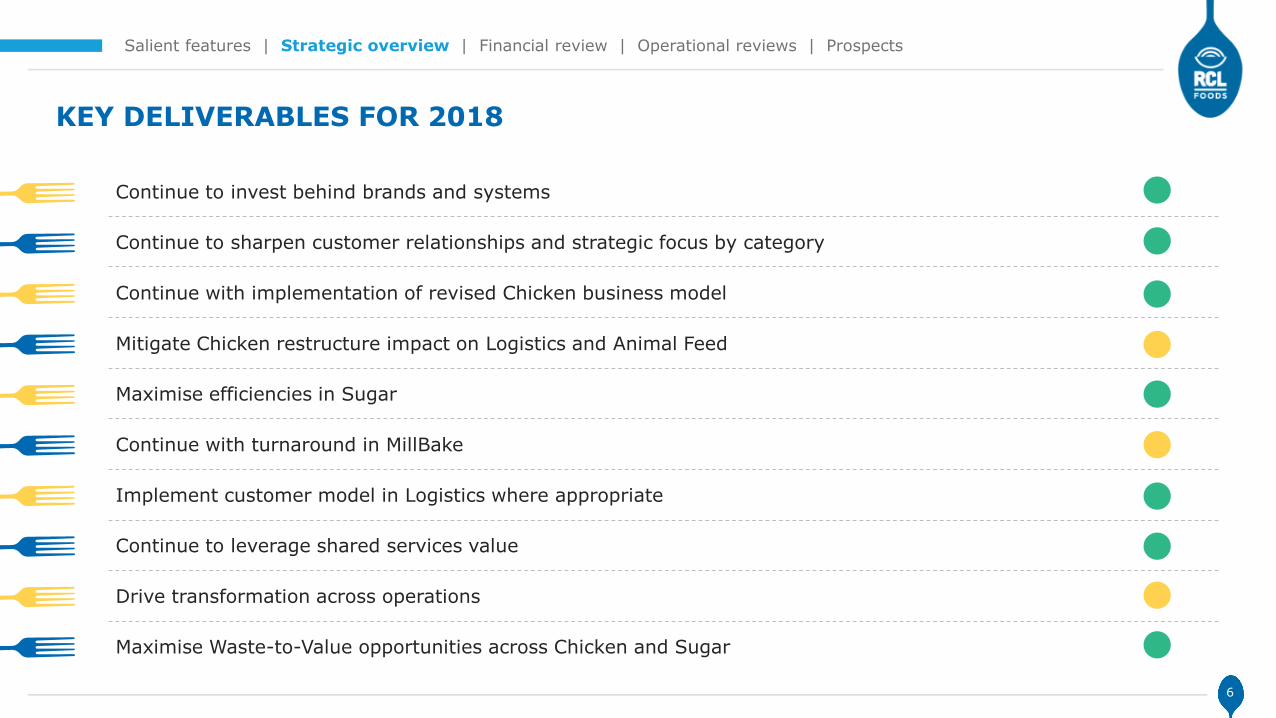
KEY DELIVERABLES FOR 2018
Continue to invest behind brands and systems
Continue to sharpen customer relationships and strategic focus by category
Continue with implementation of revised Chicken business model
Mitigate Chicken restructure impact on Logistics and Animal Feed
Maximise efficiencies in Sugar
Continue with turnaround in MillBake
Implement customer model in Logistics where appropriate
Continue to leverage shared services value
Drive transformation across operations
Maximise Waste-to-Value opportunities across Chicken and Sugar
6

ROB FIELD
CHIEF FINANCIAL
OFFICER
Salient features | Strategic overview | Financial review | Operational reviews | Prospects
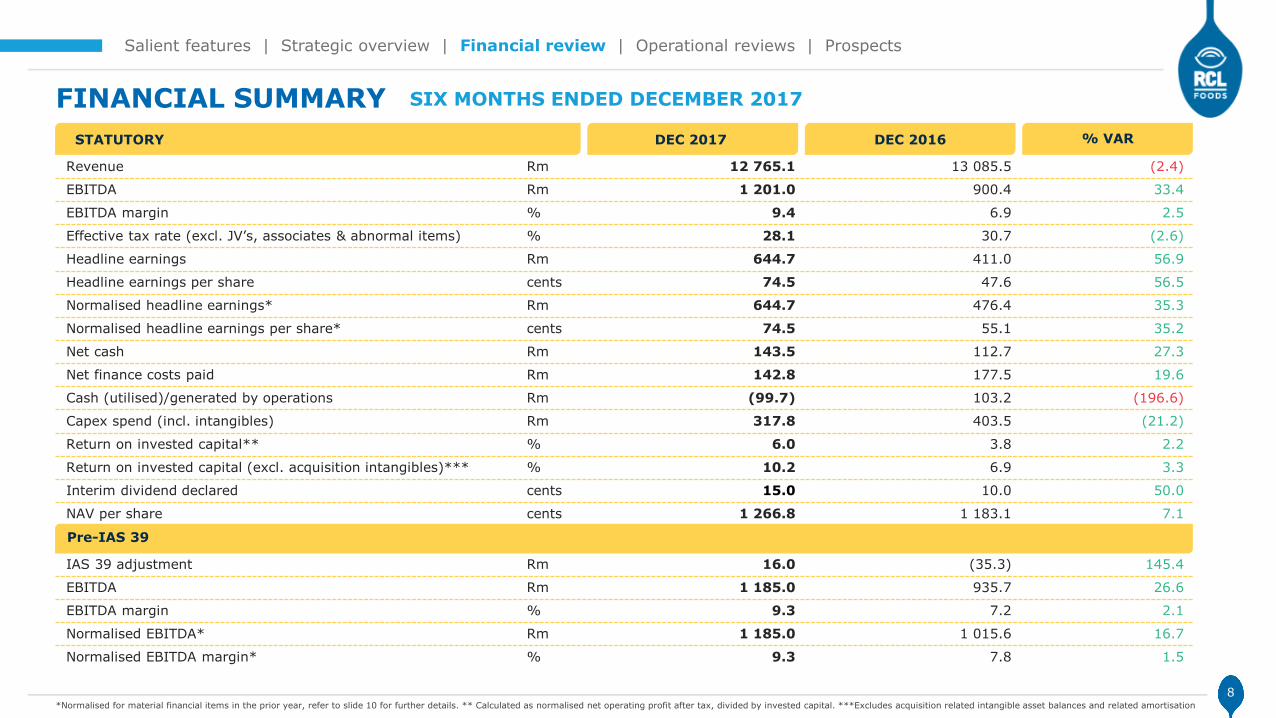
FINANCIAL SUMMARY SIX MONTHS ENDED DECEMBER 2017
8
Revenue Rm 12 765.1 13 085.5 (2.4)
EBITDA Rm 1 201.0 900.4 33.4
EBITDA margin % 9.4 6.9 2.5
Effective tax rate (excl. JV’s, associates & abnormal items) % 28.1 30.7 (2.6)
Headline earnings Rm 644.7 411.0 56.9
Headline earnings per share cents 74.5 47.6 56.5
Normalised headline earnings* Rm 644.7 476.4 35.3
Normalised headline earnings per share* cents 74.5 55.1 35.2
Net cash Rm 143.5 112.7 27.3
Net finance costs paid Rm 142.8 177.5 19.6
Cash (utilised)/generated by operations Rm (99.7) 103.2 (196.6)
Capex spend (incl. intangibles) Rm 317.8 403.5 (21.2)
Return on invested capital** % 6.0 3.8 2.2
Return on invested capital (excl. acquisition intangibles)*** % 10.2 6.9 3.3
Interim dividend declared cents 15.0 10.0 50.0
NAV per share cents 1 266.8 1 183.1 7.1
IAS 39 adjustment Rm 16.0 (35.3) 145.4
EBITDA Rm 1 185.0 935.7 26.6
EBITDA margin % 9.3 7.2 2.1
Normalised EBITDA* Rm 1 185.0 1 015.6 16.7
Normalised EBITDA margin* % 9.3 7.8 1.5
STATUTORY DEC 2017 DEC 2016 % VAR
Pre-IAS 39
*Normalised for material financial items in the prior year, refer to slide 10 for further details. ** Calculated as normalised net operating profit after tax, divided by invested capital. ***Excludes acquisition related intangible asset balances and related amortisation
Salient features | Strategic overview | Financial review | Operational reviews | Prospects
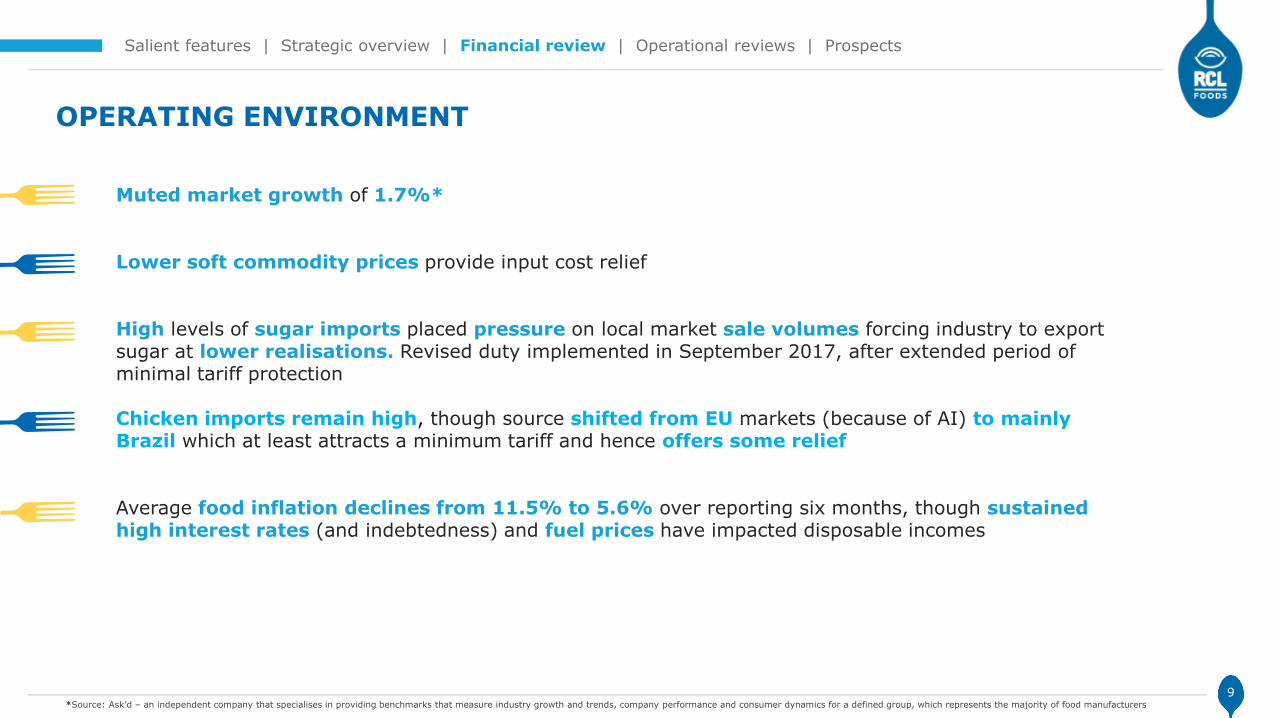
OPERATING ENVIRONMENT
Muted market growth of 1.7%*
Lower soft commodity prices provide input cost relief
High levels of sugar imports placed pressure on local market sale volumes forcing industry to export sugar at lower realisations. Revised duty implemented in September 2017, after extended period of minimal tariff protection
Chicken imports remain high, though source shifted from EU markets (because of AI) to mainly Brazil which at least attracts a minimum tariff and hence offers some relief
Average food inflation declines from 11.5% to 5.6% over reporting six months, though sustained high interest rates (and indebtedness) and fuel prices have impacted disposable incomes
9*Source: Ask’d – an independent company that specialises in providing benchmarks that measure industry growth and trends, company performance and consumer dynamics for a defined group, which represents the majority of food manufacturers

Salient features | Strategic overview | Financial review | Operational reviews | Prospects
MATERIAL FINANCIAL IMPACTS
IAS 39 IMPACTS
10
PRIOR PERIOD
Downsizing of Chicken business unit resulted in the following financial impacts:• R142.2 million impairment of assets;• R42.9 million provision for restructuring costs; and• R9.0 million in biological assets write-downs, directly related to the reduction in the size of flocks and bird
numbers in KZN
Foreign exchange loss of R27.9 million relating to the settlement of the Zambian put options
Positive IAS 39 adjustment associated with the Group's commodity raw material procurement strategy, which increased EBITDA by R16.0 million for the current period (H1 2017: R35.3 million negative adjustment)
The R51.3 million gain over the prior period is largely attributable to the unwinding of unfavourable maize positions held in the prior period
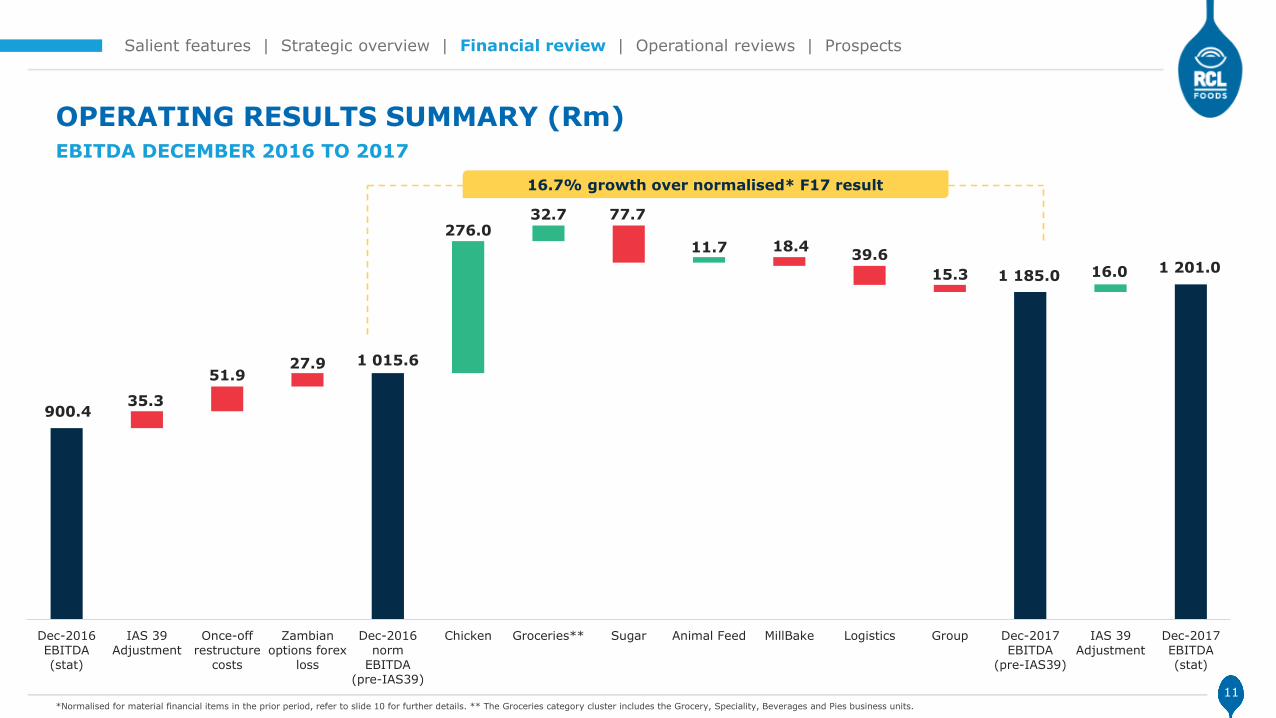
900.4
1 015.6
1 185.01 201.0
35.3
51.927.9
276.032.7 77.7
11.7 18.439.6
15.3 16.0
Dec-2016
EBITDA
(stat)
IAS 39
Adjustment
Once-off
restructure
costs
Zambian
options forex
loss
Dec-2016
norm
EBITDA
(pre-IAS39)
Chicken Groceries** Sugar Animal Feed MillBake Logistics Group Dec-2017
EBITDA
(pre-IAS39)
IAS 39
Adjustment
Dec-2017
EBITDA
(stat)
11
Salient features | Strategic overview | Financial review | Operational reviews | Prospects
OPERATING RESULTS SUMMARY (Rm)EBITDA DECEMBER 2016 TO 2017
*Normalised for material financial items in the prior period, refer to slide 10 for further details. ** The Groceries category cluster includes the Grocery, Speciality, Beverages and Pies business units.
16.7% growth over normalised* F17 result

1 201.0
644.7 644.7
390.7
143.1199.7 142.4 53.4 6.2 24.8
EBITDA(Statutory)
Depreciation,amortisation
andimpairments
Net financecosts
Taxation Share of profitsfrom jv's and
assoc
Minorityinterests
Headline adj -Impairments
(post tax)
Other Headlineadj (post tax)
Headlineearnings (HE)
Normalised HE
900.4
411.0476.4
545.0
181.2
70.4
163.754.1
102.7 13.3 37.4 27.9
EBITDA(Statutory)
Depreciation,amortisation
andimpairments
Net financecosts
Taxation Share of profitsfrom jv's and
assoc
Minorityinterests
Headline adj -Impairments
(post tax)
Other Headlineadj (post tax)
Headlineearnings (HE)
Once-offrestructure
costs
Zam optionsforex loss
Normalised HE
Salient features | Strategic overview | Financial review | Operational reviews | Prospects
HEADLINE EARNINGS WATERFALL (Rm)
12
56.9% 35.3%
DEC 2017
DEC 2016
Normalised* result up 35.3%8.6Impairment
142.7Impairment
*Normalised for material financial items in the prior period, refer to slide 10 for further details

DEC 2017 DEC 2016 % VAR
Consumer 8.8 3.2 5.6
Sugar & Milling 7.0 7.6 (0.6)
Logistics 10.5 13.7 (3.2)
Total 9.3 7.2 2.1
Salient features | Strategic overview | Financial review | Operational reviews | Prospects
OPERATING RESULTS SUMMARYSEGMENTAL ANALYSIS – REVENUE AND EBITDA
13
Consumer 585.5 224.9 160.4
Sugar & Milling 493.8 578.2 (14.6)
Logistics 105.6 145.2 (27.3)
Unallocated group costs 0.1 (12.6) 100.8
Total 1 185.0 935.7 26.6
EBITDA (Rm) – pre-IAS 39
Consumer 6 687.6 7 072.8 (5.4)
Sugar & Milling 7 010.0 7 613.0 (7.9)
Logistics 1 006.5 1 056.3 (4.7)
Sales between segments
Consumer to Sugar & Milling (57.7) (133.2) (56.7)
Sugar & Milling to Consumer (1 369.8) (1 981.3) (30.9)
Logistics to Consumer (496.7) (528.0) (5.9)
Logistics to Sugar & Milling (14.8) (14.1) 5.0
Total 12 765.1 13 085.5 (2.4)
REVENUE (Rm) DEC 2017 DEC 2016 % VAR
DEC 2017 DEC 2016 % VAREBITDA MARGIN (%)– pre-IAS 39

Salient features | Strategic overview | Financial review | Operational reviews | Prospects
OPERATING RESULTS SUMMARYSEGMENTAL ANALYSIS – NORMALISED EBITDA
Consumer 585.5 276.8 111.5
Sugar & Milling 493.8 578.2 (14.6)
Logistics 105.6 145.2 (27.3)
Unallocated group costs 0.1 15.4 (99.4)
Normalised total 1 185.0 1 015.6 16.7
Consumer 8.8 3.9 4.9
Sugar & Milling 7.0 7.6 (0.6)
Logistics 10.5 13.7 (3.2)
Normalised total 9.3 7.8 1.5
EBITDA (Rm) – pre-IAS 39 DEC 2017 DEC 2016 % VAR
EBITDA MARGIN (%) – pre-IAS 39
Normalised for material financial items in the prior period, refer to slide 10 for further details
14
Salient features | Strategic overview | Financial review | Operational reviews | Prospects
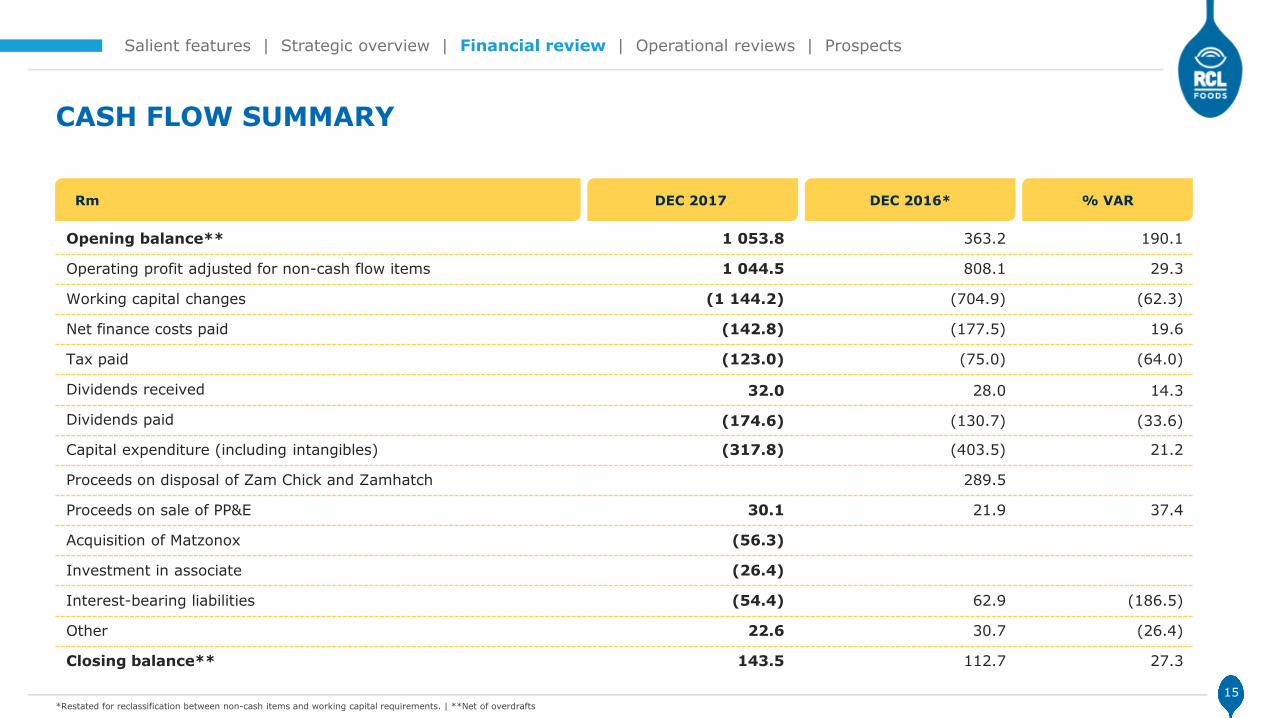
CASH FLOW SUMMARY
Rm DEC 2017 % VARDEC 2016*
*Restated for reclassification between non-cash items and working capital requirements. | **Net of overdrafts
15
Opening balance** 1 053.8 363.2 190.1
Operating profit adjusted for non-cash flow items 1 044.5 808.1 29.3
Working capital changes (1 144.2) (704.9) (62.3)
Net finance costs paid (142.8) (177.5) 19.6
Tax paid (123.0) (75.0) (64.0)
Dividends received 32.0 28.0 14.3
Dividends paid (174.6) (130.7) (33.6)
Capital expenditure (including intangibles) (317.8) (403.5) 21.2
Proceeds on disposal of Zam Chick and Zamhatch 289.5
Proceeds on sale of PP&E 30.1 21.9 37.4
Acquisition of Matzonox (56.3)
Investment in associate (26.4)
Interest-bearing liabilities (54.4) 62.9 (186.5)
Other 22.6 30.7 (26.4)
Closing balance** 143.5 112.7 27.3
Salient features | Strategic overview | Financial review | Operational reviews | Prospects
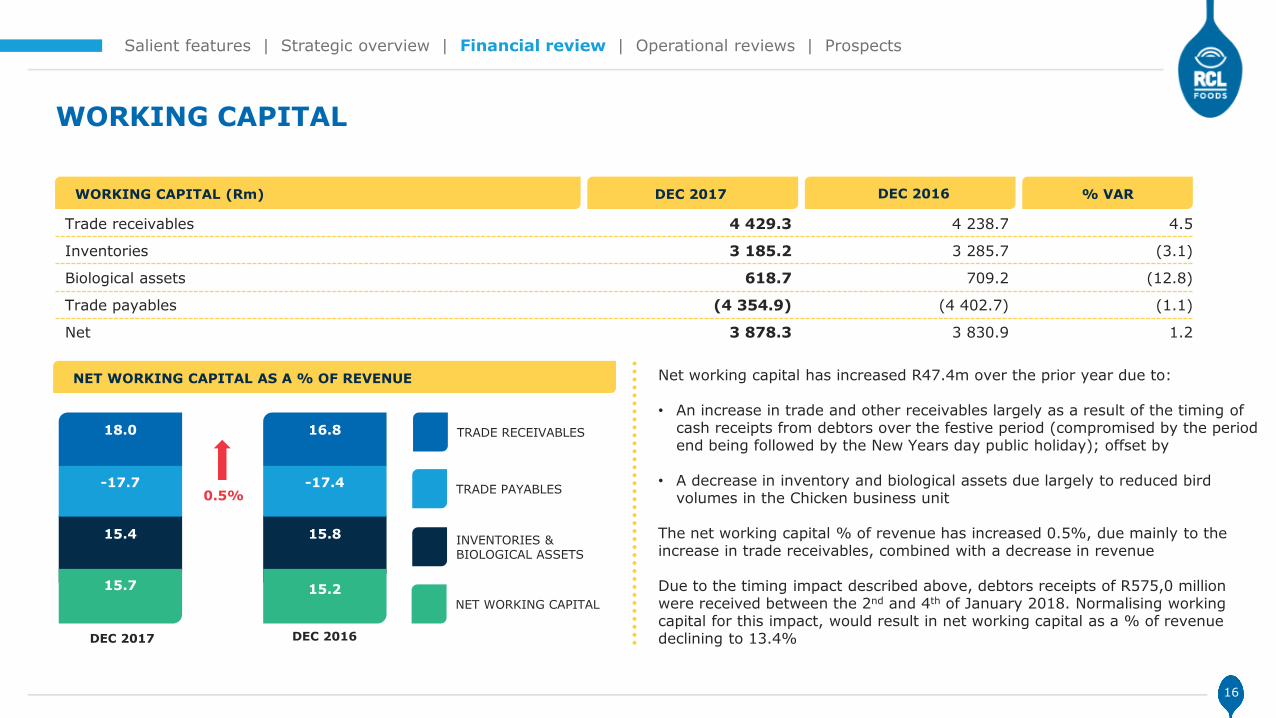
WORKING CAPITAL
16
Net working capital has increased R47.4m over the prior year due to:
• An increase in trade and other receivables largely as a result of the timing of cash receipts from debtors over the festive period (compromised by the period end being followed by the New Years day public holiday); offset by
• A decrease in inventory and biological assets due largely to reduced bird volumes in the Chicken business unit
The net working capital % of revenue has increased 0.5%, due mainly to the increase in trade receivables, combined with a decrease in revenue
Due to the timing impact described above, debtors receipts of R575,0 million were received between the 2nd and 4th of January 2018. Normalising working capital for this impact, would result in net working capital as a % of revenue declining to 13.4%
NET WORKING CAPITAL AS A % OF REVENUE
DEC 2017 DEC 2016
TRADE PAYABLES
TRADE RECEIVABLES
INVENTORIES &BIOLOGICAL ASSETS
NET WORKING CAPITAL
18.0
-17.7
15.4
15.7
16.8
-17.4
15.8
15.2
WORKING CAPITAL (Rm) DEC 2017 % VARDEC 2016
Trade receivables 4 429.3 4 238.7 4.5
Inventories 3 185.2 3 285.7 (3.1)
Biological assets 618.7 709.2 (12.8)
Trade payables (4 354.9) (4 402.7) (1.1)
Net 3 878.3 3 830.9 1.2
0.5%

122.8
171.1
15.8
8.1189.1
357.6
124.8
5.5
Salient features | Strategic overview | Financial review | Operational reviews | Prospects
CAPITAL EXPENDITURE
Capital expenditure (including intangibles) was R317.8m (H1 2017: R403.5m)
Major spend items in the current period include amounts to restore the damaged Pongola silo and the replacement of irrigation equipment in the Sugar business unit, as well as replacements of key infrastructure across the rest of the Group
Capital commitments are R677.0m (H1 2017: R602.1m). Major items included in these amounts relate to further spend required to restore the Pongola silo, investments in the ERP systems across the Group, replacements within the Logistics fleet, as well as cane replant and irrigation equipment replacements in the Sugar business unit
149.7 250.2
DEC 2017 DEC 2016
REPLACEMENT (Rm)EXPANSION (Rm)
Sugar & MillingConsumer LogisticsGroup
317.8 677.0
CAPITAL COMMITMENTS BY DIVISION (Rm)
CAPITAL EXPENDITURE BY DIVISION (Rm)
17
168.1 153.3
DEC 2017 DEC 2016

Salient features | Strategic overview | Financial review | Operational reviews | Prospects
DEBT PACKAGE
5 year1 355
400
4 year847
250
3 year – RCF 498
Total 3 350
Hedged % 77% 77% 53% 53%
YEAR 4 (FEB 19)YEAR 3 (FEB 18)YEAR 2YEAR 1VALUE (Rm)TERM
Dec 2017
Dec 2016
NET FINANCE COSTS (Rm)
*Repaid in January 2017 and undrawn since
Hedged (fixed rate)
Unhedged
Partial hedge (collar) to the extent of R1.5bn
Revolving credit facility(RCF) not hedged*
142.8 177.5
3.70.3
143.1 181.2
18
Net finance costs paid Fair value adjustments on interest rate collar option
Net finance costs expensed

Salient features | Strategic overview | Financial review | Operational reviews | Prospects
DEBT COVENANTS
Senior leverage ratio (Net senior debt*/pre-IAS 39 HEBITDA) <2.75 1.7 1.4 2.2
Repricing (a step-up margin of 0.25% is triggered if the senior leverage ratio breaches 2.7)
<2.7 1.7 1.4 2.2
Senior interest cover ratio (pre-IAS 39 HEBITDA/senior net finance charges**)
>3.5 6.4 5.0 4.6
REQUIRED DEC 2017 JUNE 2017 DEC 2016COVENANT
*Net senior debt: Total unsubordinated debt less cash and cash equivalents | **Senior net finance charges: Finance charges on unsubordinated debt less interest income
Covenant met
Covenant breached
19

SCOTT PITMAN
MANAGING DIRECTOR
CONSUMER DIVISION

0.8
0%
-5.6
%
7.1
%
-4.4
%
-5.8
%
2.4
%
11
.5%
1.4
%
14
.1%
12
.9%
7.7
%
-1.9
0%
-5.8
%
1.7
%
-6.2
%
-5.4
% -0.6
%
3.9
%
-3.7
%
4.6
%
5.3
%
1.6
%
-10%
-5%
0%
5%
10%
15%
20%
12MMDec-17
6MM Jun-17
6MM Dec-17
3MM Mar-17
3MM Jun-17
3MM Sep-17
3MM Dec-17
17-Sep 17-Oct 17-Nov 17-Dec
RCL FOODS Groceries Total Ask'd Basket
DEC 2016*
Consumer 6 687.6 7 072.8 (5.4)
Sugar & Milling 7 010.0 7 613.0 (7.9)
Logistics 1 006.5 1 056.3 (4.7)
Sales between segments (1 939.0) (2 656.6) (27.0)
Total 12 765.1 13 085.5 (2.4)
Consumer 585.5 276.8 111.5
Sugar & Milling 493.8 578.2 (14.6)
Logistics 105.6 145.2 (27.3)
Unallocated group costs 0.1 15.4 (99.4)
Total 1 185.0 1 015.6 16.7
Salient features | Strategic overview | Financial review | Operational reviews | Prospects
OPERATIONAL REVIEW: CONSUMER
EBITDA (Rm) pre-IAS 39
REVENUE (Rm) % VARDEC 2017HEADLINES
• Against the backdrop of a very tough grocery market, Consumer has seen strong profit growth, in both Chicken and Groceries**
• Market shares across most categories are firm, with increased margins, indicating that strategies are delivering to expectations
• The grocery market has seen some return to volume growth in the last three months, after a long run of severe volume declines
21*Normalised for material financial items in the prior period, refer to slide 10 for further details | ** The Groceries category cluster includes the Grocery, Speciality, Beverages and Pies business units
Volume Growth vs Total Ask’d Basket - Food
12MMDec-17
6MMJun-17
6MMDec-17
3MMMar-17
3MMJun-17
3MMSep-17
3MMDec-17
Sep-17 Oct-17 Nov-17 Dec-17
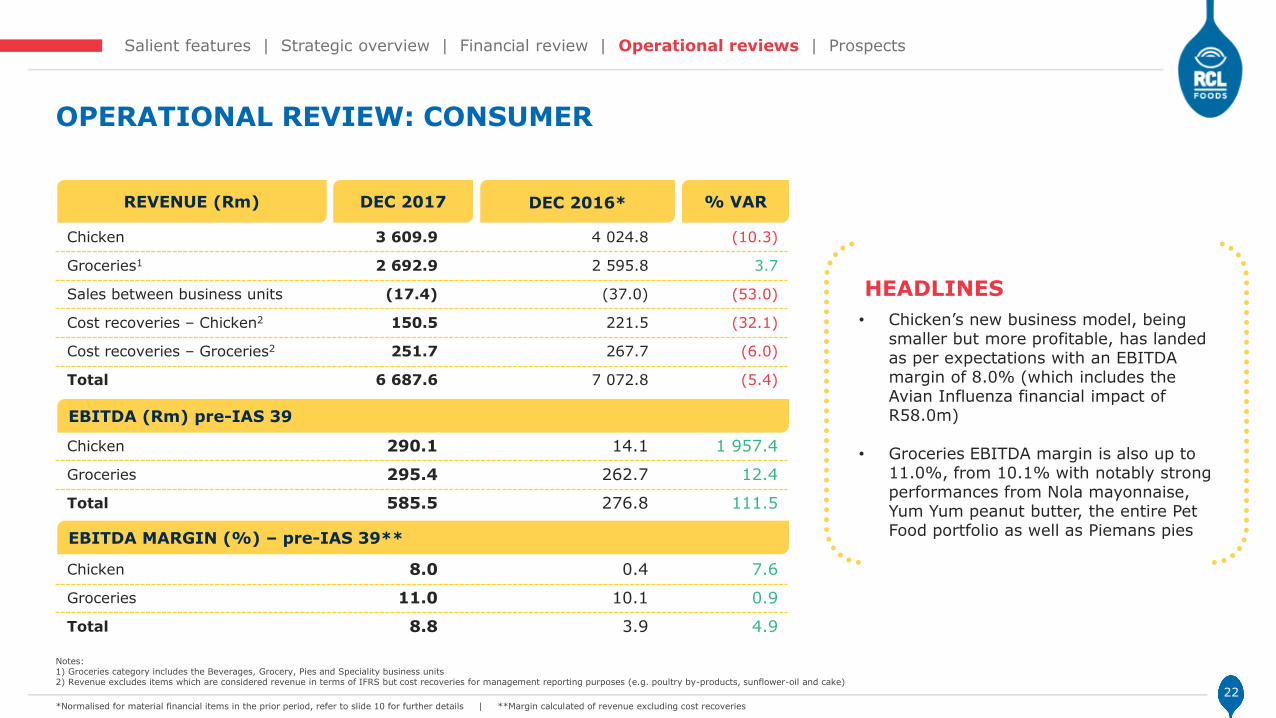
Chicken 3 609.9 4 024.8 (10.3)
Groceries1 2 692.9 2 595.8 3.7
Sales between business units (17.4) (37.0) (53.0)
Cost recoveries – Chicken2 150.5 221.5 (32.1)
Cost recoveries – Groceries2 251.7 267.7 (6.0)
Total 6 687.6 7 072.8 (5.4)
Chicken 290.1 14.1 1 957.4
Groceries 295.4 262.7 12.4
Total 585.5 276.8 111.5
Chicken 8.0 0.4 7.6
Groceries 11.0 10.1 0.9
Total 8.8 3.9 4.9
Salient features | Strategic overview | Financial review | Operational reviews | Prospects
OPERATIONAL REVIEW: CONSUMER
EBITDA (Rm) pre-IAS 39
% VARDEC 2016*
HEADLINES
• Chicken’s new business model, being smaller but more profitable, has landed as per expectations with an EBITDA margin of 8.0% (which includes the Avian Influenza financial impact of R58.0m)
• Groceries EBITDA margin is also up to 11.0%, from 10.1% with notably strong performances from Nola mayonnaise, Yum Yum peanut butter, the entire Pet Food portfolio as well as Piemans pies
REVENUE (Rm) DEC 2017
EBITDA MARGIN (%) – pre-IAS 39**
Notes:1) Groceries category includes the Beverages, Grocery, Pies and Speciality business units 2) Revenue excludes items which are considered revenue in terms of IFRS but cost recoveries for management reporting purposes (e.g. poultry by-products, sunflower-oil and cake)
22*Normalised for material financial items in the prior period, refer to slide 10 for further details | **Margin calculated of revenue excluding cost recoveries
61%
39% 38%
62%
Salient features | Strategic overview | Financial review | Operational reviews | Prospects
OPERATIONAL REVIEW: CHICKEN
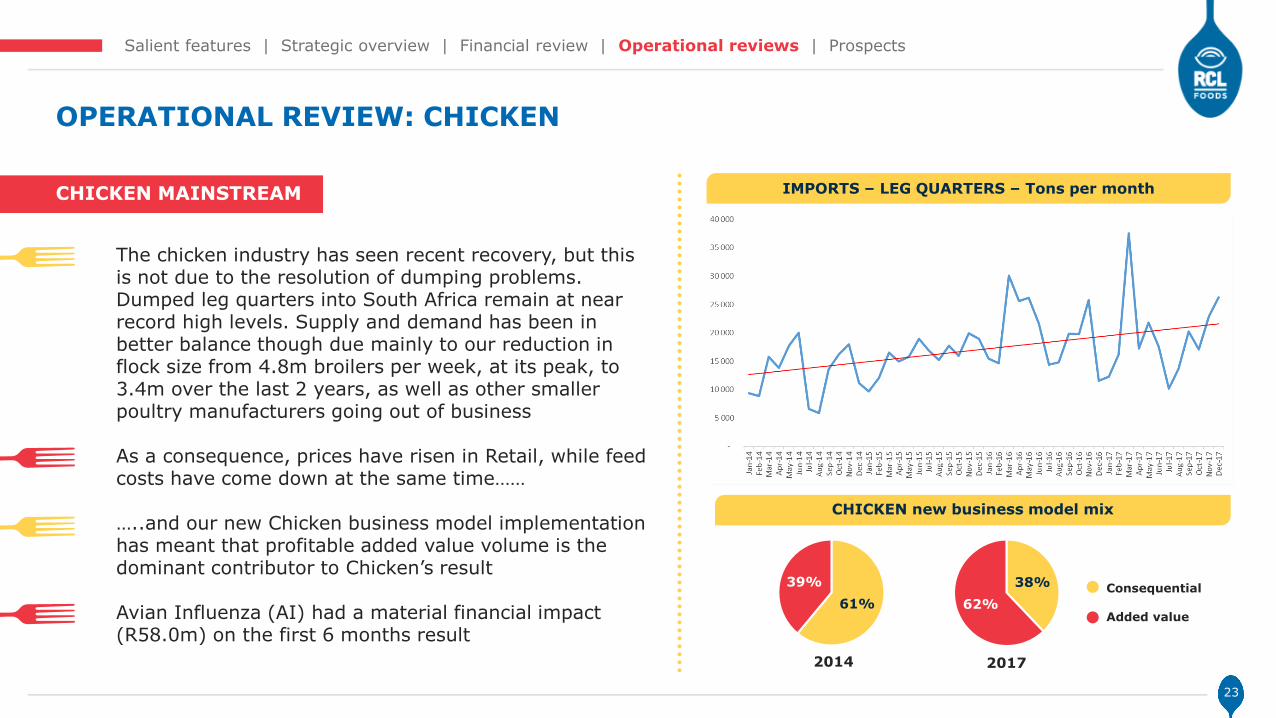
The chicken industry has seen recent recovery, but this is not due to the resolution of dumping problems. Dumped leg quarters into South Africa remain at near record high levels. Supply and demand has been in better balance though due mainly to our reduction in flock size from 4.8m broilers per week, at its peak, to 3.4m over the last 2 years, as well as other smaller poultry manufacturers going out of business
As a consequence, prices have risen in Retail, while feed costs have come down at the same time……
…..and our new Chicken business model implementation has meant that profitable added value volume is the dominant contributor to Chicken’s result
Avian Influenza (AI) had a material financial impact (R58.0m) on the first 6 months result
CHICKEN MAINSTREAM
23
CHICKEN new business model mix
Consequential
Added value
2014 2017
IMPORTS – LEG QUARTERS – Tons per month
12MMA DEC 16
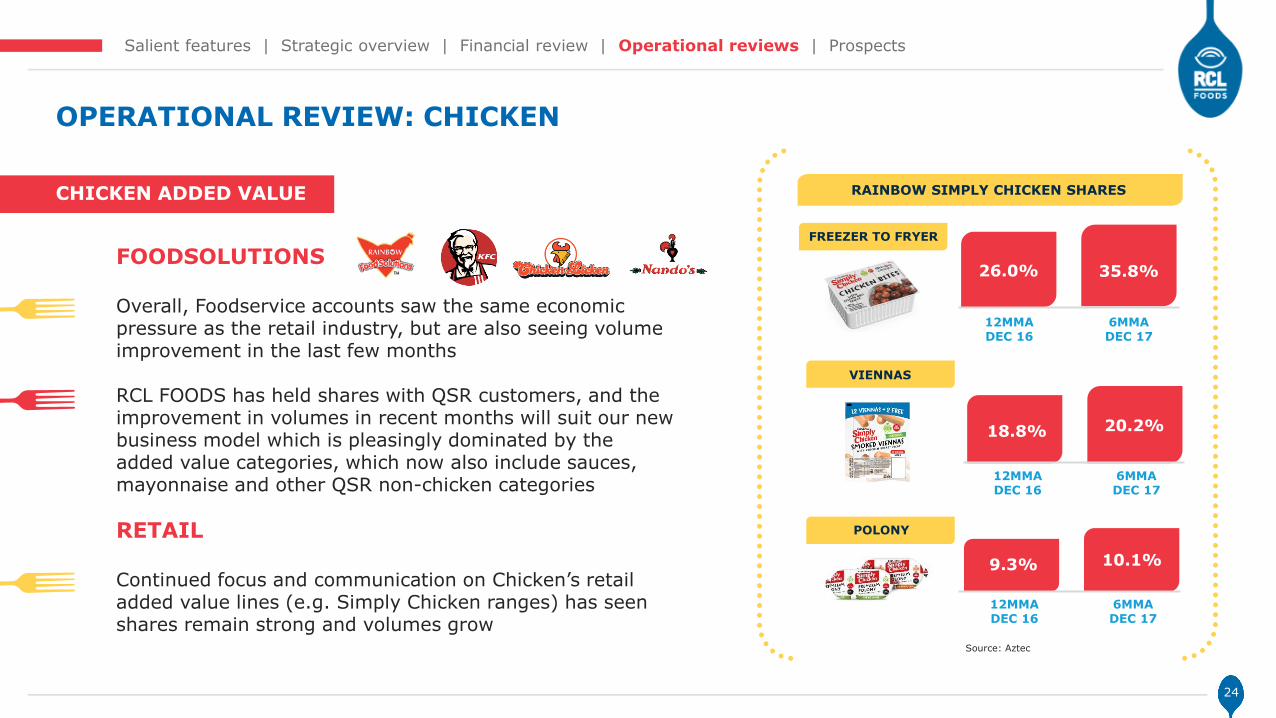
18.8% 20.2%
6MMA DEC 17
Salient features | Strategic overview | Financial review | Operational reviews | Prospects
OPERATIONAL REVIEW: CHICKEN
FOODSOLUTIONS
Overall, Foodservice accounts saw the same economic pressure as the retail industry, but are also seeing volume improvement in the last few months
RCL FOODS has held shares with QSR customers, and the improvement in volumes in recent months will suit our new business model which is pleasingly dominated by the added value categories, which now also include sauces, mayonnaise and other QSR non-chicken categories
CHICKEN ADDED VALUE
RETAIL
Continued focus and communication on Chicken’s retail added value lines (e.g. Simply Chicken ranges) has seen shares remain strong and volumes grow
RAINBOW SIMPLY CHICKEN SHARES
Source: Aztec
24
12MMA DEC 16
6MMA DEC 17
26.0% 35.8%
FREEZER TO FRYER
12MMA DEC 16
9.3% 10.1%
6MMA DEC 17
VIENNAS
POLONY

Salient features | Strategic overview | Financial review | Operational reviews | Prospects
OPERATIONAL REVIEW: GROCERIES
Grocery had another exceptional six months, with strong volume growth and market shares, and benefitted from lower soft commodity prices. Average EBITDA growth has been 12.0% over the past 3 years
Nola mayonnaise and Yum Yum peanut butter have maintained their frequent market leadership positions, while at the same time growing margin
Pet food has performed excellently. In a category with overall volume decline, RCL FOODS pet food volumes and margins are up. This is across the portfolio, from the premium end with Canine Cuisine reaching an all time high market leading share, to Bobtail and Ultradog continuing strongly, and Catmorshowing powerful growth into market leadership
RCL FOODS launched extensively into the pet treats category with good early sales
The new pet food factory is complete and a raft of differentiated, SA first innovations are being launched
GROCERY
TOTAL DOG FOOD RCL VOL SHARE
25
12MMA DEC 16
26.9%
6MMA DEC 17
28.3%
TOTAL CAT FOODRCL VOL SHARE
12MMA DEC 16
18.8%
6MMA DEC 17
25.4%
CANINE CUISINERCL VOL SHARE
12MMA DEC 16
12.4%
6MMA DEC 17
24.0%
CATMOR*RCL VOL SHARE
12MMA DEC 16
27.4%
6MMA DEC 17
35.0%
Source: Aztec
*Share of dry cat food market

Salient features | Strategic overview | Financial review | Operational reviews | Prospects
OPERATIONAL REVIEW: GROCERIES
The combination of innovation, cost take out and quality improvement coming together in a co-ordinated strategy has seen Piemans have a fantastic 6 months with 7.7% volume growth, and strong margin growth
Focused work with key accounts, big hit innovation and appropriate pricing strategy has meant that Piemans has grown volume share and relevance in South Africa
PIES
26
BEVERAGES
Number 1 and Mnandi Mageu brands have had a tough 6 months. A cooler year in SA pushed most beverage categories into volume decline, while strong competitor activity in adjacent categories also impacted volumes
RCL FOODS has put an active innovation plan in place, covering off vulnerable areas of the portfolio and targeting growth
Recent volume trends are encouraging

Salient features | Strategic overview | Financial review | Operational reviews | Prospects
OPERATIONAL REVIEW: GROCERIES
Like most grocery categories in SA, the Woolworths dominated Speciality category was under pressure, but produced an acceptable result
This innovation dominated category had a good December and trends look in line with the volume recovery seen in the last few months of retail in general
SPECIALITY
27

JOHN DU PLESSIS
MANAGING DIRECTOR
SUGAR & MILLING DIVISION

Consumer 6 687.6 7 072.8 (5.4)
Sugar & Milling 7 010.0 7 613.0 (7.9)
Logistics 1 006.5 1 056.3 (4.7)
Sales between segments (1 939.0) (2 656.6) (27.0)
Total 12 765.1 13 085.5 (2.4)
Consumer 585.5 276.8 (111.5)
Sugar & Milling 493.8 578.2 (14.6)
Logistics 105.6 145.2 (27.3)
Unallocated group costs 0.1 15.4 (99.4)
Total 1 185.0 1 015.6 (16.7)
Salient features | Strategic overview | Financial review | Operational reviews | Prospects
OPERATIONAL REVIEW: SUGAR & MILLING
REVENUE (Rm) DEC 2017 DEC 2016* % VAR
EBITDA (Rm) pre-IAS 39
*Normalised for material financial items in the prior period, refer to slide 10 for further details
29

Animal Feed 2 242.1 3 057.8 (26.7)
MillBake 1 849.6 1 982.5 (6.7)
Sugar 2 966.9 2 627.3 12.9
Sales between business units (48.6) (54.6) (11.0)
Total 7 010.0 7 613.0 (7.9)
Animal Feed 146.1 134.4 8.7
MillBake 137.0 155.4 (11.8)
Sugar 210.7 288.4 (27.0)
Total 493.8 578.2 (14.6)
Animal Feed 6.5 4.4 2.1
MillBake 7.4 7.8 (0.4)
Sugar 7.1 11.0 (3.9)
Total 7.0 7.6 (0.6)
OPERATIONAL REVIEW: SUGAR & MILLING
REVENUE (Rm) DEC 2017 % VAR
EBITDA (Rm) pre-IAS 39
• Improved commodity positions and cost saving initiatives to offset the impact of the revised Chicken business model resulted in an improved performance for Animal Feed
• Pleasing volume gains in Milling were offset by operational pressure and competitor activity in Baking which resulted in MillBake lagging behind the prior period
• Imported sugar negatively impacted local market sales resulting in a significant increase in raw sugar exports
HEADLINES
Salient features | Strategic overview | Financial review | Operational reviews | Prospects
EBITDA MARGIN (%) – pre-IAS 39
30
DEC 2016
Despite increased volumes, lower margins stemming from raw sugar exports had a material adverse impact on Sugar’s performance for the period

10.0
11.0
12.0
13.0
14.0
15.0
16.0
17.0
Jan
-16
Feb
-16
Mar
-16
Ap
r-1
6
May
-16
Jun
-16
Jul-
16
Au
g-1
6
Sep
-16
Oct
-16
No
v-1
6
Dec
-16
Jan
-17
Feb
-17
Mar
-17
Ap
r-1
7
May
-17
Jun
-17
Jul-
17
Au
g-1
7
Sep
-17
Oct
-17
No
v-1
7
Dec
-17
1 500.0
2 000.0
2 500.0
3 000.0
3 500.0
4 000.0
4 500.0
Jan
-16
Feb
-16
Mar
-16
Ap
r-1
6
May
-16
Jun
-16
Jul-
16
Au
g-1
6
Sep
-16
Oct
-16
No
v-1
6
Dec
-16
Jan
-17
Feb
-17
Mar
-17
Ap
r-1
7
May
-17
Jun
-17
Jul-
17
Au
g-1
7
Sep
-17
Oct
-17
No
v-1
7
Dec
-17
OPERATIONAL REVIEW: ANIMAL FEED
Salient features | Strategic overview | Financial review | Operational reviews | Prospects
EBITDA increased by R11.7m (8.7%) to R146.1m primarily as a result of improved commodity positions relative to the market, cost saving initiatives in Pietermaritzburg and volume gains for Molatek
Volume remained under pressure in Epol due to reduced internal demand as a consequence of the new business model for Chicken, reduced herd sizes that have not yet recovered from the drought and the AI outbreak that impacted the external broiler business
Supply of both bagasse and molasses for Molatek was significantly higher than the prior year which created capacity to drive volume ahead of last year
Costs were well controlled with below inflation increases
Source: Reuters
BROILERS
25.5%
LAYERS
4.0%
GAME
36.0%
DAIRY
1.4%
HORSE
66.4%
RUMINANTS
33.8%
OSTRICH
5.8%
PIGS
8.8%
ANIMAL FEED MARKET SHARES
31
YELLOW MAIZE PRICE (R/ton)
H1 F17AVG Price
(6m)R3 198.4
H1 F18AVG Price
(6m)R1 981.2
RAND/USD
H1 F17AVG Price
(6m)R13.98
H1 F18AVG Price
(6m)R13.40
4.1%
Source: Internal estimate (share of AFMA – December 2017)
38.1%

OPERATIONAL REVIEW: MILLBAKE
Salient features | Strategic overview | Financial review | Operational reviews | Prospects
EBITDA decreased by R18.4m (11.8%) to R137.0m stemming from challenges in Baking
The strategic drive to increase volume in Milling is starting to gain traction, with volumes up 8.7% year-on-year
Lower maize prices coupled with favourable commodity positions enabled Milling to price competitively in the market whilst optimising the sales mix to positively impact margins
Baking volumes experienced pressure in certain regions. Targeted plans are being implemented to regain market share
Although bread prices have remained static, focused cost control and beneficial raw material pricing enabled the business unit to improve margins
Damages resulting from operational challenges at certain bakeries and the labour strike at the Rustenburg bakery hampered performance
32
3 500.0
3 700.0
3 900.0
4 100.0
4 300.0
4 500.0
4 700.0
4 900.0
5 100.0
5 300.0
Jan
-16
Feb
-16
Mar
-16
Ap
r-1
6
May
-16
Jun
-16
Jul-
16
Au
g-1
6
Sep
-16
Oct
-16
No
v-1
6
Dec
-16
Jan
-17
Feb
-17
Mar
-17
Ap
r-1
7
May
-17
Jun
-17
Jul-
17
Au
g-1
7
Sep
-17
Oct
-17
No
v-1
7
Dec
-17
Source: Reuters
SAFEX WHEAT PRICE (R/ton)
H1 F17AVG Price
(6m)R4 135.9
H1 F18AVG Price
(6m)R4 231.9
2.3%
OPERATIONAL REVIEW: SUGAR
Salient features | Strategic overview | Financial review | Operational reviews | Prospects
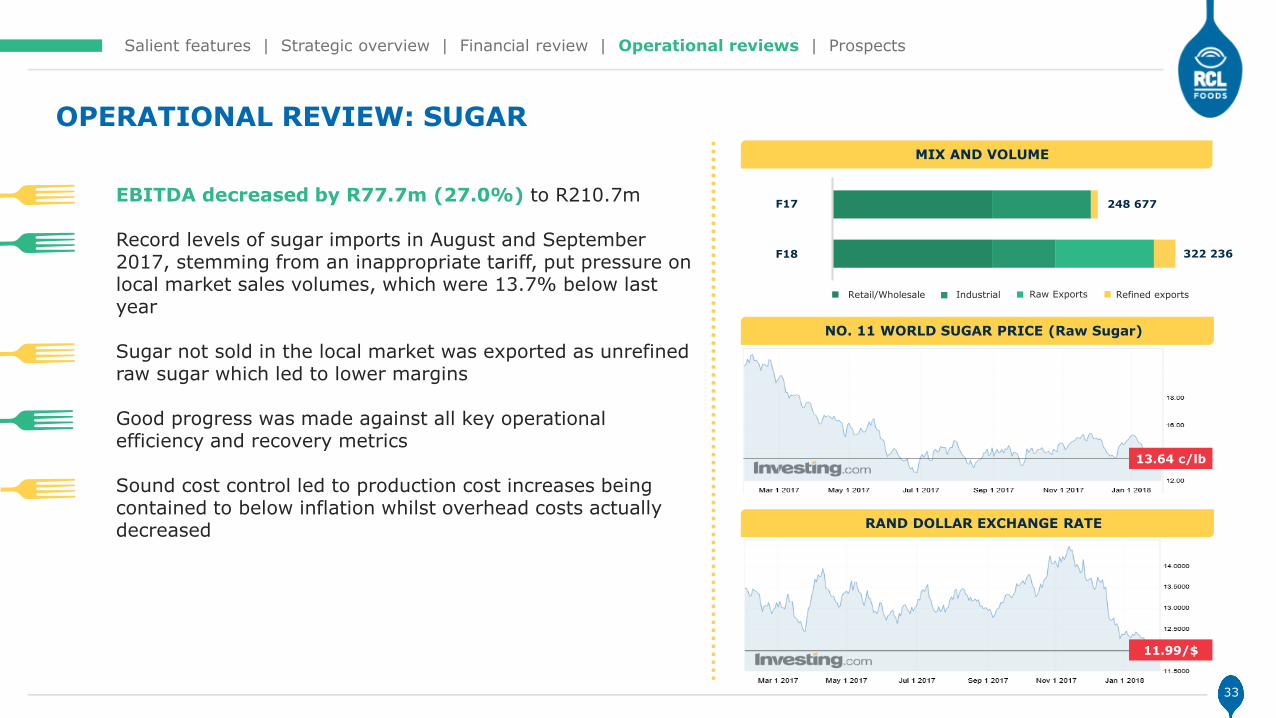
EBITDA decreased by R77.7m (27.0%) to R210.7m
Record levels of sugar imports in August and September 2017, stemming from an inappropriate tariff, put pressure on local market sales volumes, which were 13.7% below last year
Sugar not sold in the local market was exported as unrefined raw sugar which led to lower margins
Good progress was made against all key operational efficiency and recovery metrics
Sound cost control led to production cost increases being contained to below inflation whilst overhead costs actually decreased
MIX AND VOLUME
33
248 677
322 236
F17
F18
Raw ExportsRetail/Wholesale Industrial Refined exports
NO. 11 WORLD SUGAR PRICE (Raw Sugar)
13.64 c/lb
RAND DOLLAR EXCHANGE RATE
11.99/$

CHRIS CREED
MANAGING DIRECTOR
LOGISTICS DIVISION

Consumer 6 687.6 7 072.8 (5.4)
Sugar & Milling 7 010.0 7 613.0 (7.9)
Logistics 1 006.5 1 056.3 (4.7)
Sales between segments (1 939.0) (2 656.6) (27.0)
Total 12 765.1 13 085.5 (2.4)
Consumer 585.5 276.8 111.5
Sugar & Milling 493.8 578.2 (14.6)
Logistics 105.6 145.2 (27.3)
Unallocated group costs 0.1 15.4 (99.4)
Total 1 185.0 1 015.6 16.7
Salient features | Strategic overview | Financial review | Operational reviews | Prospects
OPERATIONAL REVIEW: LOGISTICS
REVENUE (Rm) DEC 2017
EBITDA (Rm) pre-IAS 39
HEADLINES
• Revenue and EBITDA contraction driven largely by significant impact of Chicken restructure which is in line with expectations for the period
• Good progress made on the mitigation strategy to offset the Chicken restructure, driven by new revenue and cost rationalisation, despite inflation in a largely fixed cost business
• Planned take-on of the full Pick n Pay cold chain including the ice cream category is on track, laying the foundation for a sound future partnership
*Normalised for material financial items in the prior period, refer to slide 10 for further details
35
DEC 2016* % VAR

Salient features | Strategic overview | Financial review | Operational reviews | Prospects
LOGISTICS IMPACTED BY CHICKEN RESTRUCTURE AND WEAK ECONOMY
The Chicken restructure (not in the six months to December 2016 base) has had a material impact on the Logistics division
Weak economy mutes growth in Retail and Foodservice volumes
Unutilised capacity in the bulk cold storage network remains a challenge
36
CHICKEN CRISIS HAS A MATERIAL IMPACT ON LOGISTICSECONOMIC PRESSURE CONTINUES TO SUBDUE GROWTH
IN RETAIL AND FOODSERVICE VOLUMES
FoodserviceRetail

Salient features | Strategic overview | Financial review | Operational reviews | Prospects
GOOD PROGRESS MADE IN MITIGATION STRATEGY
FOUR HUB CUSTOMER ALIGNED NETWORK STRATEGICALLY POSITIONS LOGISTICS FOR THE FUTURE
37
SUCCESSFUL INITIATION OF CONSOLIDATED SUPPLY CHAIN CONTROL TOWER CONCEPT
Logistics makes good progress on the mitigation strategy to offset the Chicken restructure, with focus on winning new business and network and transport cost optimisation to suit revised business requirements
Cost optimisation initiatives focused on the retail network impacted by the loss of Chicken volumes. This included the conversion of various stock holding depots to cross-docking facilities and the successful implementation of a four hub customer aligned network. These initiatives enabled a sound platform for manpower, transport and warehouse cost efficiencies
Logistics successfully initiates supply chain control tower/centre of excellence concept to reaffirm customer centric mind-set

Salient features | Strategic overview | Financial review | Operational reviews | Prospects
WINNING NEW BUSINESS
Planned take-on of the full Pick n Pay cold chain on track laying the foundation for a sound future partnership, a Pick n Pay first of integrating the full frozen and super-frozen (ice cream) basket with a single supply chain partner
Take-on includes new retail principals in the frozen foods business as well as the ice cream category, which contributes meaningfully to offset lost volumes from the Chicken restructure
The dual mitigation strategy of new business take-on, including group opportunities, and strategic cost rationalisation lays a good platform for an improved second half of the year, with H2 2017 including the impact of Chicken restructure
38
PICK N PAY COLDCHAIN PARTNERSHIP ON TRACK WITH NEW RETAIL PRINCIPALS
ICE-CREAM TAKE ON VIA INTEGRATED FROZEN AND SUPER-FROZEN DISTRIBUTION A FIRST FOR PICK N PAY
PROSPECTS

Salient features | Strategic overview | Financial review | Operational reviews | Prospects
Recent political developments have been positive, however concrete plans and economic policies to revitalise our economy have yet to be enacted and their timeline remain as uncertainties. We therefore expect the next six months to remain challenging
The poultry market continues to stabilise and Chicken is expected to continue its recovery, however appropriate safeguards from government are still required to prevent dumping
Groceries is ready to capitalise on an improved environment with a good pipeline of innovations to be rolled out over the next few months
Sugar imports remain a threat due to global surpluses and a strengthening rand
MillBake will continue to place focus on restoring volumes
Animal Feed to continue to benefit from lower commodity input prices and improved volumes as AI impact diminishes
Logistics will continue to focus on cost rationalisation, which coupled with new business opportunities, will deliver a more positive outlook for the remainder of the year
PROSPECTS
40