Embed Size (px)
Citation preview

INVESTOR UPDATE
March 2020

Western Alliance Bank Overview
1) Market data as of March 6, 2020; stock price of $39.61
Serving a diverse range of commercial clients, from
corporate and small business to public and non-profit
borrowers, across numerous industries nationwide
5 regional banking divisions with a branch-light
footprint serving attractive markets in Arizona,
Nevada, and California
10+ specialized National Business Lines
2
$26B+
21%
19.6%
19%
in assets
tangible book
value 5-Year
CAGR
2019 loan
growth
2019
ROATCE
NYSE: WAL
Headquarters: Phoenix, AZ
IPO: 2005
Market Cap1: $4.1B
Shares Outstanding: 102.5MInstitutional Ownership: 88%
Insider Ownership: 7.6%
Dividend Yield1: 2.5%
Forward P/E1: 7.8x
Employees: 1,800+
Locations: 47
S&P GLOBAL MARKET INTELLIGENCE
BANK DIRECTOR MAGAZINE
FORBES
#1 Regional Bank, 2018
#1 Regional Bank, 2019
Bank Performance Scorecard
Top 10 “Best Banks in
America” list 2016 - 2020
Regional Footprint
National Presence
Top Performing Commercial Client Focused Bank

WAL’s Value Proposition
3
Diversified business model allows flexibility to sustain growth across market cycles
Robust risk-adjusted loan and deposit growth
Industry-leading profitability
Conservative credit culture
Top-decile efficiency produces strong operating leverage
Shareholder-focused capital management
Seasoned and invested leadership team
1
2
6
5
4
3
7
A highly adaptable and efficient model coupled with a conservative credit culture enables
thoughtful growth and industry-leading profitability across market environments

Diversified Business Model Allows Flexibility to Sustain Growth
4
Capital Call
Lines
WAL can actively adapt business and capital allocation in response to changing
external environment
Geographic
DiversificationGrowth
Trajectory
Risk-
Adjusted
Yields
Operating
LeverageRisk
Management
Capital
Allocation
Residential
Mortgage Initiative
C&D
Hotel
Franchise
Finance
HOA
Corporate
Finance
Mortgage
Warehouse
NBLs
Regional
Banking
Divisions
Organic
Growth
Dividends
M&A
Share
Repurchases
Ample growth
potential
Deep segment &
product expertise
supports cyclical
business lines
Highly efficient
lending & deposit
platforms
Pristine asset
quality
Superior total
shareholder
returns without
curtailing growth
Growth trajectory
maintained with
prudent credit risk
management
1
Illustrative as business objectives are not mutually exclusive and image does not represent full suite of WAL divisions, products and services.

5
Diversified by product, client-type and geography emphasizing underwriting discipline
Robust Risk-Adjusted Loan and Deposit Growth
Loan and Loan Yields
• Diverse mix of regionally-focused
commercial banking divisions & nationally-
oriented specialized businesses
• Leverages deep segment expertise to
provide specialized banking services to niche
markets across the country
• National reach enables selective
relationships with highest asset quality and
profitability
$6.8$8.4
$11.1
$13.2 $15.1
$17.7
$21.1
5.43%5.23% 5.18% 5.40%
5.62% 5.82% 5.83%
$0.0
$5.0
$10.0
$15.0
$20.0
0.00%
1.00%
2.00%
3.00%
4.00%
5.00%
6.00%
2013 2014 2015 2016 2017 2018 2019
20.8%
CAGR
Diversified Business Mix
Dollars in billions
C&I45%
CRE, OO11%
CRE, NOO25%
Const. & Land9%
Resi. & Consumer10%
Loans by Product Type Loans by Rate Type
LIBOR Based42%
Prime Based18%
Term Adjustable
8%
Fixed Rate32%
2

6
National Business Lines Targeting Attractive Industries
Segment-focused model supports superior client value and company risk management
• NBLs provide dedicated lending and deposit banking
services to niche markets
• Industry and nationwide geographic diversification
with centralized, sophisticated management
• Unique client types and specialized banking
requirements are supported by WAL’s value-added
offerings
• Strong returns with conservative underwriting and
structuring
Hotel Franchise
17%
Resi. Mortgage
18%
Mtg. Warehouse
17%
Public & NonProfit
14%
Tech & Innov.14%
Corp. Fin.10%
Other10%
National Business
Lines54%Arizona
18%
So Cal11%
Nevada11%
No Cal6%
WAL Loans by Segment
$3.6
$5.7$6.7
$8.6
$11.5
32%
43%44%
49%
54%
$0.0
$2.0
$4.0
$6.0
$8.0
$10.0
$12.0
20%
25%
30%
35%
40%
45%
50%
55%
2015 2016 2017 2018 2019
NBL Loans and NBLs as a Percentage of Total WAL Loans
33.2%
CAGR
Dollars in billions
NBL Composition
7
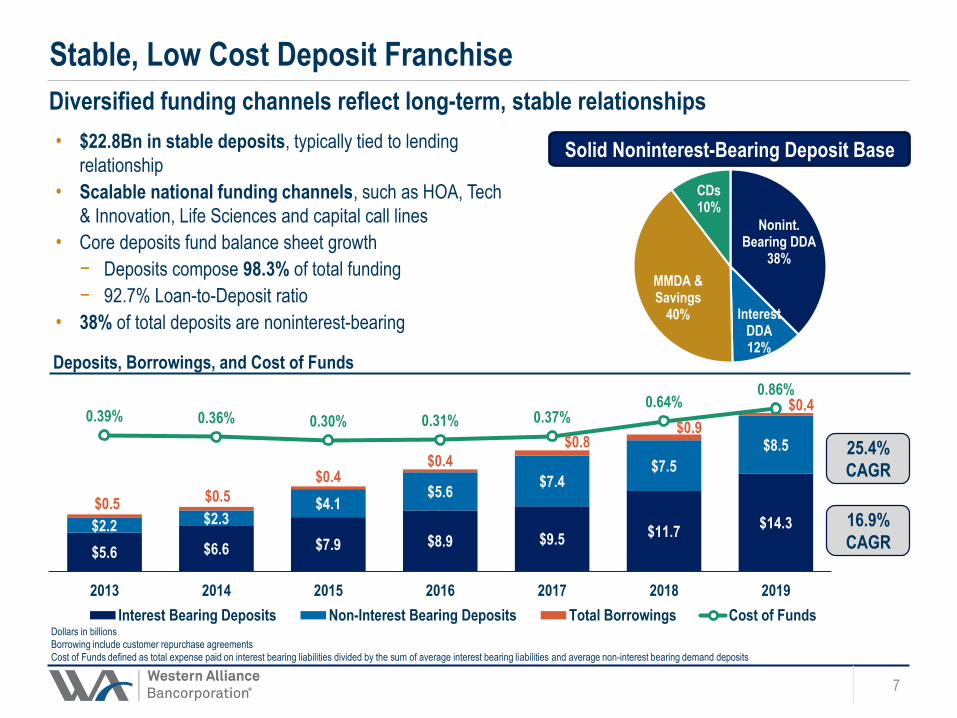
Stable, Low Cost Deposit Franchise
Diversified funding channels reflect long-term, stable relationships
• $22.8Bn in stable deposits, typically tied to lending
relationship
• Scalable national funding channels, such as HOA, Tech
& Innovation, Life Sciences and capital call lines
• Core deposits fund balance sheet growth
− Deposits compose 98.3% of total funding
− 92.7% Loan-to-Deposit ratio
• 38% of total deposits are noninterest-bearing
Nonint. Bearing DDA
38%
Interest DDA12%
MMDA & Savings
40%
CDs10%
Deposits, Borrowings, and Cost of Funds
Dollars in billions
Borrowing include customer repurchase agreements
Cost of Funds defined as total expense paid on interest bearing liabilities divided by the sum of average interest bearing liabilities and average non-interest bearing demand deposits
Solid Noninterest-Bearing Deposit Base
$5.6 $6.6 $7.9 $8.9 $9.5$11.7
$14.3$2.2 $2.3$4.1
$5.6$7.4
$7.5
$8.5
$0.5$0.5
$0.4$0.4
$0.8$0.9
$0.40.39% 0.36% 0.30% 0.31% 0.37%
0.64%0.86%
-2.00%
-1.20%
-0.40%
0.40%
$0.0
$5.0
$10.0
$15.0
$20.0
$25.0
2013 2014 2015 2016 2017 2018 2019
Interest Bearing Deposits Non-Interest Bearing Deposits Total Borrowings Cost of Funds
25.4%
CAGR
16.9%
CAGR

ROAA
ROATCE Net Interest Margin
Industry-Leading Profitability
8Note: Peers consist of 55 publicly traded banks with total assets between $15B and $150B, excluding target banks of pending acquisitions,
as of December 31, 2019; S&P Global Market Intelligence
• Outstanding performance compared to peers with
ROAA and ROATCE among highest in industry
• Leading earning asset yield of 5.30%
• Liquid securities portfolio mainly consists of MBS
(79%) and Tax Exempt (17%) investments
• Net Interest Income continues to rise through strong
earning asset growth despite Fed rate actions
4.39% 4.42%4.51%
4.58% 4.65% 4.68%4.52%
3.50%3.39%
3.29% 3.26%3.44%
3.56%3.49%
2013 2014 2015 2016 2017 2018 2019
WAL Peers
18.3% 18.5%17.8% 17.7% 18.3%
20.6%19.6%
11.7% 11.1% 10.8% 11.1% 11.4%
15.0% 14.6%
2013 2014 2015 2016 2017 2018 2019
WAL Peers
1.35%1.50% 1.56% 1.61% 1.72%
2.05% 2.00%
1.02% 1.00% 0.96% 0.96% 0.97%
1.29%1.20%
2013 2014 2015 2016 2017 2018 2019
WAL Peers
3

Reduced Asset Sensitivity with Asymmetric Return Profile
9
• Nearly 68% of loans are variable rate (approx. $14.4Bn)
− 68% ($9.7Bn) of variable rate loans have interest rate
floors
− 35% ($3.4Bn) of variable rate loans with floors were
at their floors
Down 100bps Scenario
Up 100bps Scenario
Note: NII Sensitivity assumes WAL balance sheet as of January 31, 2020, but incorporates Fed’s
50bps rate reduction on March 3, 2020
1) Assumes a gradual monthly parallel shift of -8.3bps over a 12-month period
2) Assumes a gradual monthly parallel shift of +8.3bps over a 12-month period
Percentage Increase/(Decrease) to Net
Interest Income
Shock Ramp1
Shock Ramp2
As of 12/31/2019
Post-Fed Rate Reduction
• After the 50bps Fed rate reduction on March 3, 2020, an
additional $2.9Bn of variable rate loans hit floors
• 64% ($6.4Bn) of variable rate loans with floors are at
their floors
− Any further 25bps rate reduction will result in an
additional approx. $1.0Bn of variable rate loans
reaching floors
• 62% ($13.1Bn) of loan portfolio is acting as fixed rate
• Reduced IRR in 100bps parallel shock scenario to 3.0%
from 6.6% at June 30, 2019
− Floors of variable rate loans increasingly in-the-
money
− Mix shift to fixed rate residential loans
(3.0)%
(1.1)%
3.4%
4.8%

Conservative Credit Culture
10
4
Credit quality is placed before profitability
• Strong risk management culture and framework
established throughout organization
− Model focused on process-driven early elevation
and speed to resolution
− Leverage Segment Specialists to apply best
practices to industry- or product-specific risks
• Balance sheet diversified since last credit cycle
1) Nonperforming assets excluding Troubled Debt Restructured Loans, as of the most recently reported period
Peers consist of 55 publicly traded banks with total assets between $15B and $150B, excluding target banks of pending acquisitions,
as of December 31, 2019
Source: S&P Global Market Intelligence
0.14%
-0.07% -0.06%
0.02% 0.01%0.06%
0.02%
0.28%
0.14% 0.13%0.18% 0.16% 0.14% 0.15%
-0.25%
0.00%
0.25%
0.50%
2013 2014 2015 2016 2017 2018 2019
WAL Peers1.53%
1.18%
0.65%0.51%
0.36%0.20% 0.26%
0.73%0.59% 0.56%
0.50%
0.43% 0.38%0.36%
2013 2014 2015 2016 2017 2018 2019
WAL Peers
Non-Performing Assets1 / Total Assets
1.47%
1.31%
1.07%
0.95%
0.93%
0.86%
0.80%
1.31%
1.09% 1.07%
1.02%
0.92%
0.87%
0.76%
2013 2014 2015 2016 2017 2018 2019
WAL Peers
Net Charge-Offs / Average Loans
Reserve / Total Loans

While loans have historically seen double digit growth, adversely graded loans and non-
performance assets have been consistent
11
Asset Quality Stable Relative to Overall Balance Sheet Growth
Dollars in millions
Accruing TDRs total $28.4mm; Amounts are net of total PCI credit and interest rate discounts of $4.4 million as of December 31, 2019
0.7%
0.1%
0.8%
0.2%
1.4%
0.3%
1.4%
0.7%
2013 2014 2015 2016 2017 2018 2019
OREO NPLs Classified Accruing Loans Special Mention Loans
Non-Performing Assets and Adversely Graded Assets as a Percentage of Total Assets
4.3%
3.1%
2.5%
2.1%
1.9%
1.4% 1.3%
$400
$312
$353
$343
$355
$316$341
Over last 5 years, less than 1% of Special
Mention loans have migrated to loss

Financial flexibility is maximized through deep industry expertise, strong operating
partners, and conservative underwriting structure
12
Hotel Franchise Finance Structured for Superior Through-Cycle Performance
• As of 12/31/2019, Hotel Franchise Finance portfolio
was 9.1% ($1.93bn) of loan portfolio
• Focused on “select-service” sub-segment, which
demonstrates superior through-cycle performance
− Minimal restaurant and conference facilities
− Mid-30% margins allow financial flexibility
• Acquired GE Capital’s $1.4Bn US select-service
Hotel Franchise Finance business in Apr-16
From 2007-2Q15, GE experienced avg. loss rate
of 0.6% ($52MM cum. losses)
Partner with experienced hotel operators with top
franchisor flags
• 72% of commitments to Select Service and Extended
Stay hotels
• Avg. balance per hotel of $10.6MM
• 86% with top three franchisors (Marriott, Hilton, IHG)
• Healthy average RevPAR Index of 115% over the
last 15 quarters1
Conservative underwriting provides meaningful
cash flow cushion; focused on Loan-to-Cost
• WA LTV: 60.7%
• WA Debt Service Coverage: 1.9x
• WA Debt Yield: 11.3%
• Structure provides for re-margining based on
declining cash flow covenant
• Do not finance convention centers
Sophisticated sponsors with significant
invested equity and resources to support
operations1
2
3
4 Geographically diversified in top national
markets assessed on economic stability
• 52% of commitments in the top 25 MSAs and 68%
in the top 50 MSAs
• Commitments in 36 states and 77.1% outside of
WAL’s existing state footprint (AZ, CA, NV)
1) Measured on a TTM basis

Primarily focused on established growth companies with successful products and strong
investor support, which provides greater operating and financial flexibility
13
Technology & Innovation Segment Serves Emerging Technology-Focused
Ventures & Investors
• As of 12/31/2019, Tech. & Innovation portfolio was
14% ($1.6bn) of loan portfolio
• Bridge Bank (acquired in Aug-15) has a long-
standing, successful track-record in national
technology lending dated back to 2001
• Holistic banking relationship (TM, WC / AR lines,
etc.) provides line-of-sight into business operations,
performance against plan, and financial health
Finances established growth tech firms with
strong risk profile
• Validated Product: 97% with revenue > $5MM
− Minimal pre-revenue or mezzanine lending
• Strong Institutional Backing: 86% backed by one or
more quality VC / PE
• Granular Portfolio: Avg. loan size $4.7MM
• Low Cost Deposit Franchise: Liquid borrowers
with > 2:1 deposit coverage
1
2
Technology64%Life
Sciences10%
Legacy Solar6%
Equity Fund Resources
20%
Tech. & Innov. Loans by Segment
Asset quality remains strong
• EFR lending has never experienced a loss
• Net Recoveries of $312k for Tech. & Innov. in 2019
• 87% of companies1 with >6 months of liquidity
Since 2007, total warrant income >2x
cumulative NCOs
3
1) Includes Technology and Life Sciences borrowers

Track record of simultaneously driving industry-leading growth and efficiency
14
Top Decile Efficiency Produces Strong Operating Leverage5
52.1%
47.4%
45.2%
43.2%
41.5%
43.0% 43.2%
63.2%
60.9% 60.9%
59.2%
57.2%
55.5% 55.2%
40.0%
45.0%
50.0%
55.0%
60.0%
65.0%
2013 2014 2015 2016 2017 2018 2019
WAL Peers
• Continued focus on expense management, while investing in growth initiatives and scalable infrastructure
to be a leading nationwide banking platform
Efficiency ratio for WAL and Peers as calculated and reported by SNL Financial / S&P Global Market Intelligence
Peers consist of 55 publicly traded banks with total assets between $15B and $150B, excluding target banks of pending acquisitions, as of December 31, 2019; Source: S&P Global Market Intelligence

237%
243%
69%
94%
Q4 2013 Q4 2014 Q4 2015 Q4 2016 Q4 2017 Q4 2018 Q4 2019
WAL
WAL with Dividends Added Back
Peer Avg
Peer Avg with Dividends Added Back
WAL consistently generates more capital than needed to support organic growth
15
Shareholder-Focused Capital Management6
Note: CET1 for 2013 and 2014 represents Tier 1 Common Equity Basel I
Peers consist of 55 major exchange traded banks with total assets between $15B and $150B as of December 31, 2019, excluding
target banks of pending acquisitions; S&P Global Market Intelligence
8.8%
10.6%
7.4%
10.3%
8.5%
9.0%
2013 2014 2015 2016 2017 2018 2019
CET1 TCE Peer TCE
Growth in TBV per Share
Robust Capital Levels
• Endeavor to provide superior total shareholder return without
curtailing growth
• Strong returns bolster capital above peers
• Under a share repurchase plan announced in Q4’18, WAL
opportunistically repurchased 3.7mm shares or 3.5% of
outstanding shares
• The Board has authorized a share repurchase plan for 2020
of up to $250 million
• Initiated $0.25 quarterly dividend in 3Q19
• Disciplined M&A appetite

Strategic positioning supports ongoing versatility of business model
16
Sound Balance Sheet Well-Positioned for the Future
Note: Peers consist of 55 major exchange traded banks with total assets between $15B and $150B as of December 31, 2019,
excluding target banks of pending acquisitions; S&P Global Market Intelligence
• Loan growth funded through
core deposits
• $6.8Bn in unused borrowing
capacity (correspondent
banks, FHLB & FRB)
• $2.5Bn unpledged
marketable securities
• Leading ROA and
Operating PPNR ROA
• Top decile ROATCE
• High operating leverage
• TCE / TA 110 bps higher
than peer median
• TBV per share grown 3x
peer group
• Strong regulatory capital
• Total RBC: 12.8%
• CET1: 10.6%
• Net charge-offs bottom
quartile versus peers
• Strategic balance sheet
reallocation towards low
LTV residential real
estate
High-Quality Assets
Strong Liquidity Access
Robust Cash
Generation
Significant Capital Levels
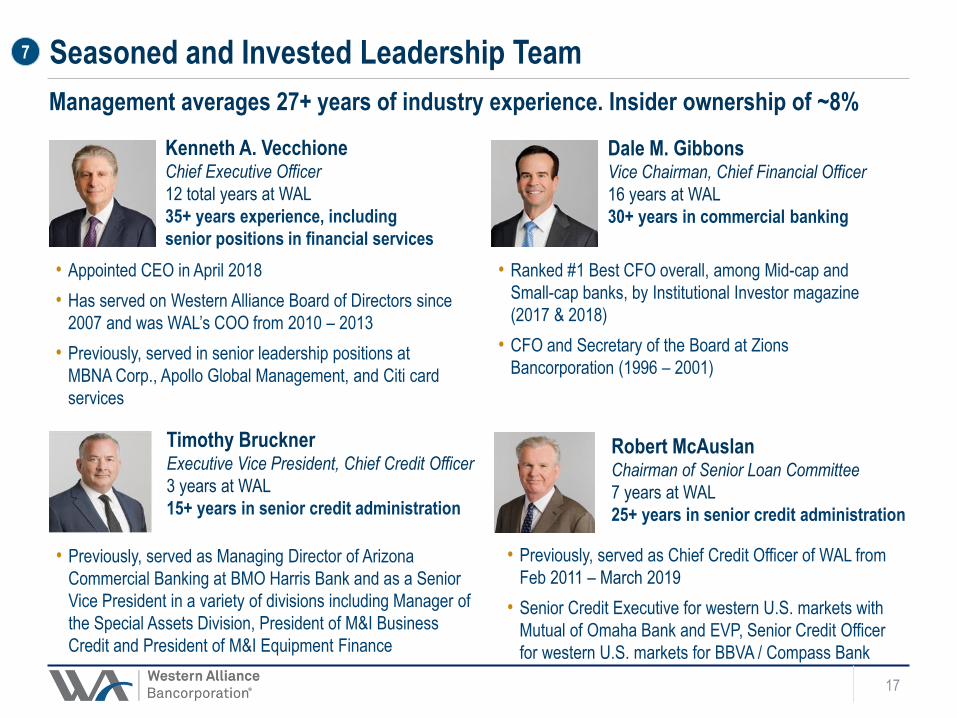
Kenneth A. VecchioneChief Executive Officer
12 total years at WAL
35+ years experience, including
senior positions in financial services
Timothy BrucknerExecutive Vice President, Chief Credit Officer
3 years at WAL
15+ years in senior credit administration
Dale M. GibbonsVice Chairman, Chief Financial Officer
16 years at WAL
30+ years in commercial banking
• Appointed CEO in April 2018
• Has served on Western Alliance Board of Directors since
2007 and was WAL’s COO from 2010 – 2013
• Previously, served in senior leadership positions at
MBNA Corp., Apollo Global Management, and Citi card
services
• Ranked #1 Best CFO overall, among Mid-cap and
Small-cap banks, by Institutional Investor magazine
(2017 & 2018)
• CFO and Secretary of the Board at Zions
Bancorporation (1996 – 2001)
• Previously, served as Managing Director of Arizona
Commercial Banking at BMO Harris Bank and as a Senior
Vice President in a variety of divisions including Manager of
the Special Assets Division, President of M&I Business
Credit and President of M&I Equipment Finance
Management averages 27+ years of industry experience. Insider ownership of ~8%
17
Seasoned and Invested Leadership Team7
Robert McAuslan Chairman of Senior Loan Committee
7 years at WAL
25+ years in senior credit administration
• Previously, served as Chief Credit Officer of WAL from
Feb 2011 – March 2019
• Senior Credit Executive for western U.S. markets with
Mutual of Omaha Bank and EVP, Senior Credit Officer
for western U.S. markets for BBVA / Compass Bank

-0.5x
0.0x
0.5x
1.0x
1.5x
2.0x
2.5x
3.0x
12/13 12/14 12/15 12/16 12/17 12/18 12/19
WAL Stock Price
Quarterly EPS
Top Performing Bank with a Discounted Multiple
18
WAL has experienced 17 consecutive quarters of EPS stability and growth
1) Top 50 Banks headquartered in the US by assets as of December 31, 2019, assets pro forma for pending acquisitions
Market data as of March 6, 2020
Source: Median consensus estimates, S&P Global
Quarterly EPS & Stock Price
• In addition to industry-leading growth, WAL produces top decile profitability amongst the Top 50 Banks1
WAL Rank Metric
Total Assets 45th $26.8Bn
Net Income 27th $499mm
5 Year EPS CAGR 7th 23.7%
ROAA 1st 2.0%
ROAE 2nd 17.5%
Net Interest Margin 3rd 4.52%
Efficiency Ratio 6th 43.2%
Tangible Common Equity /
Tangible Assets5th 10.3%
Net Charge-Offs / Avg. Loans 4th 0.02%
ALLL / Gross Loans 28th 0.80%
Price / 2020 Est EPS 38th 7.8x
$23.86
0.7x
$39.61
$0.33
$1.25
125%
150%
175%
200%
225%
250%
275%
300%
325%
350%
375%
12/31/13 6/30/14 12/31/14 6/30/15 12/31/15 6/30/16 12/31/16 6/30/17 12/31/17 6/30/18 12/31/18 6/30/19 12/31/19
WAL Peers
7.0x
9.0x
11.0x
13.0x
15.0x
17.0x
19.0x
21.0x
23.0x
12/31/13 6/30/14 12/31/14 6/30/15 12/31/15 6/30/16 12/31/16 6/30/17 12/31/17 6/30/18 12/31/18 6/30/19 12/31/19
WAL Peers
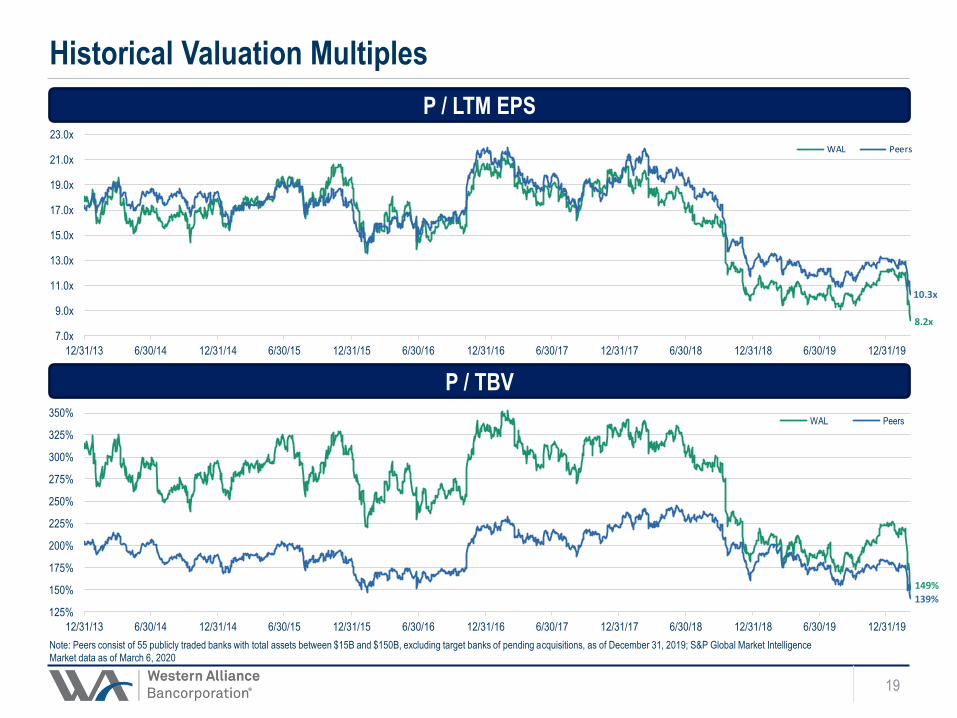
Historical Valuation Multiples
19
P / LTM EPS
Note: Peers consist of 55 publicly traded banks with total assets between $15B and $150B, excluding target banks of pending acquisitions, as of December 31, 2019; S&P Global Market Intelligence
Market data as of March 6, 2020
P / TBV
139%
10.3x
8.2x
149%

Forward-looking Statements
This presentation contains forward-looking statements that relate to expectations, beliefs, projections, future plans and strategies, anticipated
events or trends, and similar expressions concerning matters that are not historical facts. Examples of forward-looking statements include, among
others, statements we make regarding our expectations with regard to our business, financial and operating results, and future economic
performance. The forward-looking statements contained herein reflect our current views about future events and financial performance and are
subject to risks, uncertainties, assumptions, and changes in circumstances that may cause our actual results to differ significantly from historical
results and those expressed in any forward-looking statement. Some factors that could cause actual results to differ materially from historical or
expected results include, among others: the risk factors discussed in the Company’s Annual Report on Form 10-K for the year ended
December 31, 2018 as filed with the Securities and Exchange Commission; changes in general economic conditions, either nationally or locally in
the areas in which we conduct or will conduct our business; inflation, interest rate, market and monetary fluctuations; increases in competitive
pressures among financial institutions and businesses offering similar products and services; higher defaults on our loan portfolio than we expect;
changes in management’s estimate of the adequacy of the allowance for credit losses; legislative or regulatory changes or changes in accounting
principles, policies, or guidelines; supervisory actions by regulatory agencies which may limit our ability to pursue certain growth opportunities,
including expansion through acquisitions; additional regulatory requirements resulting from our continued growth; management’s estimates and
projections of interest rates and interest rate policy; the execution of our business plan; and other factors affecting the financial services industry
generally or the banking industry in particular.
Any forward-looking statement made by us in this presentation is based only on information currently available to us and speaks only as of the
date on which it is made. We do not intend to have and disclaim any duty or obligation to update or revise any industry information or forward-
looking statements, whether written or oral, that may be made from time to time, set forth in this presentation to reflect new information, future
events or otherwise.
Non-GAAP Financial Measures
This presentation contains both financial measures based on accounting principles generally accepted in the United States (“GAAP”) and non-
GAAP based financial measures, which are used where management believes them to be helpful in understanding the Company’s results of
operations or financial position. Reconciliations of these non-GAAP financial measures to the most comparable GAAP measures are included in
the Company’s earnings release available in the Investor Relations portion of the Company’s website at
http://investors.westernalliancebancorporation.com. These disclosures should not be viewed as a substitute for operating results determined in
accordance with GAAP, nor are they necessarily comparable to non-GAAP performance measures that may be presented by other companies.
20