Embed Size (px)
Citation preview

Investor DayLondon, 16th May 2019

1© National Bank of Greece
Investor Presentation – May 2019
Disclaimer
This corporate presentation has been prepared by National Bank of Greece S.A. (the Bank) for the Investor Day held by the Bank on 16/05/2019, in order to present the strategic objectives of the Bank for the period 2019 – 2022. It
is not and should not be construed as a disclosure of regulated information as defined in Directive 2004/109.
Not an Offer to Sale
The information contained herein is not and must not be construed to be an offer to sale or to purchase or an invitation or any type of solicitation or a recommendation or an advice to invest in any way on the shares or any other
security issued or to be issued by the Bank. It has not been prepared to assist prospective investors in making their own evaluation of the Bank and does not purport to be all-inclusive or complete or to contain all of the information
a prospective or existing investor may need or want to have. As such, the information contained in this presentation cannot and should not be relied upon as advice to buy or sell or hold such securities or as an offer to sell such
securities. This presentation does not take into account nor does it provide any tax, legal or investment advice or opinion regarding the specific investment objectives or financial situation of any person. In all cases, any interested
person should conduct his or her own investigation and analysis of the Bank and the data set forth in this presentation. The Bank makes no representation or warranty as to the accuracy or completeness of the information contained
in this presentation and shall not have any liability for any statements or representations (expressed or implied) made herein and information contained herein, or for any omissions from, this information. Neither the Bank nor any of
our representatives shall have any liability whatsoever, under contract, tort, or otherwise, to any person resulting from the use of the information in this presentation.
The Bank does not assume any liability to update any of the information included or statement made herein. The Bank reserves the right to amend or replace the information contained herein, in part or entirely, at any time, without
undertaking the obligation to formally inform investors that such amendment or replacement has been made. Additionally, the Bank undertakes no obligation to comment on the expectations of, or statements made by, third parties
in respect of the matters discussed in this presentation. In any case all readers of this presentation are invited to read it in the future in combination with all future announcements made by the Bank on material events and inside
information, in general, pursuant to applicable legislation.
Strategic objectives and Financial Targets included in the Presentation
This presentation does not contain any projections or forecasts for the period 2019 – 2022. It outlines the most important strategic objectives and financial targets of the Bank’s management as of the date of the presentation. Such
strategic objectives and targets, as well as other statements made herein regarding the Bank’s business and operations, results of operation, financial condition and capital adequacy and risk management practices are based on the
opinions, estimates and reasonable assumptions of the Bank’s management regarding, inter alia, the relevant macroeconomic conditions, at the date the statements are made and as reasonably anticipated based on available data at
that date. Such opinions, estimates and assumptions are inherently subjective and uncertain, and the relevant target and future statements contained in the presentation are subject to a variety of risks and uncertainties and other
factors, most of which are outside the control of the Bank, that could cause actual events or results to differ materially from the targeted performance of the Bank as expressed or implied in this presentation. Although we believe
that such targets are reasonable, there can be no assurance that such targets will materialize in the future as described in this presentation in all material respect. We cannot guarantee future results, level of activity, performance or
achievements and there is no representation that the actual results will be the same, in whole or in part, as those set out in the presentation. It is also noted that past performance of similar actions undertaken does not guarantee
future results. Important factors that could cause actual results to differ materially from the targets set and future statements included in this presentation, are, inter alia:
– the heavily regulated industry in which the Bank pursues its business activity, including capital adequacy rules and the relevant loan portfolio, capital and liquidity tests and reviews as well conducted by national and
supranational regulatory authorities;
– the relevant market conditions, including the macroeconomic environment in Greece and the European Union;
– our ability to manage risks inherent in the Bank’s operations;
– the restrictions to which the Bank’s operational autonomy is subject as a recipient of state aid and shareholder expectations and special rights of the HFSF, a 40% shareholder.
Readers are cautioned that this list of factors should not be construed as exhaustive. All targets and future statements contained in this presentation are expressly qualified by this cautionary statement. Except as and to the extent
required by law, the Bank undertakes no obligation to update or revise publicly any such statement, whether as a result of new information, future events or otherwise, after the date on which the statements are made or to reflect
the occurrence of unanticipated events.

2© National Bank of Greece
Investor Presentation – May 2019
AGENDA
Introduction Costas Michaelides | Chairman
Strategic objectives 2019–2022Pavlos Mylonas | Chief Executive Officer
Financial targets
Clean-up the balance sheet Fotini Ioannou | Head of Troubled Assets Group
Boost revenue generationChristina Theofilidi | Head of Retail Banking
Vassilis Karamouzis | AGM Corporate & Investment Banking
Enablers: people, technology, processesEvi Hatzioannou | Head of Human Resources
Stratos Molyviatis | Chief Information Officer
Ethniki180: Transformation Program Ernestos Panayiotou | Chief Transformation Officer
Q&A

3© National Bank of Greece
Investor Presentation – May 2019
AGENDA
Introduction Costas Michaelides | Chairman
Strategic objectives 2019–2022Pavlos Mylonas | Chief Executive Officer
Financial targets
Clean-up the balance sheet Fotini Ioannou | Head of Troubled Assets Group
Boost revenue generationChristina Theofilidi | Head of Retail Banking
Vassilis Karamouzis | AGM Corporate & Investment Banking
Enablers: people, technology, processesEvi Hatzioannou | Head of Human Resources
Stratos Molyviatis | Chief Information Officer
Ethniki180: Transformation Program Ernestos Panayiotou | Chief Transformation Officer
Q&A

4© National Bank of Greece
Investor Presentation – May 2019
Key remarks
Our team: a new management team, fully aligned to the strategy, with clear roles and responsibilities3
Our starting point: large client base, trusted brand and the strongest asset quality and liquidity in the
Greek market2
Our strategic priorities: broad alignment on the challenges and a transformation plan developed
bottom-up to address them4
Our NBG in 2022: a clean and profitable bank - the Greek bank of choice6
Our operating environment: macroeconomic tailwinds and recovery of the banking fundamentals1
Our delivery engine: a unique, bank-wide transformation program with clear accountabilities and strong
execution discipline5

5© National Bank of Greece
Investor Presentation – May 2019
Macroeconomic tailwinds and recovery of banking fundamentals
2020
19.3
2018
17.7
20212019
16.515.5 14.8
2022
2.01.9
2018 2021
1.8
20202019
1.8 1.7
2022
2022
106109
2018
100103
20202019 2021
112
373296 293 301 311
20202018 20212019 2022
20222018 2019 2020 2021
3.6
1.9
3.9 3.5 3.2
20212018 20193 2020 2022 2023
-13.5
11.55.9 6.2 6.4 6.6
1. Operating environment
Greek 10yr
sovereign bond
spread over G.
Bund2
(bps)
Unemployment
rate (%)1
GDP growth (%)1
Gross fixed
capital formation
excl. residential
(nominal,
yoy growth)
Private sector
disposable
income
(nominal,
yoy growth)
Sources: ELSTAT, Focus Economics Consensus, NBG - Economic Analysis Division estimates
Sources: Bank of Greece, NBG - Economic Analysis Division estimates
Sources: Focus Economics, NBG - Economic Analysis Division estimates
House Price Index
(rebased to 2018)
Sources: ELSTAT, Focus Economics Consensus, NBG - Economic Analysis Division estimates
Sources: ELSTAT, Focus Economics Consensus, NBG - Economic Analysis Division estimates
Sources: ELSTAT, Focus Economics Consensus, NBG - Economic Analysis Division estimates
1. Average annual | 2. Average of quarterly spreads | 3. 2019 Fixed capital formation based on NBG economic analysis estimates, accounting for a positive base effect and transfer of public investments from 2018 to 2019
6© National Bank of Greece
Investor Presentation – May 2019
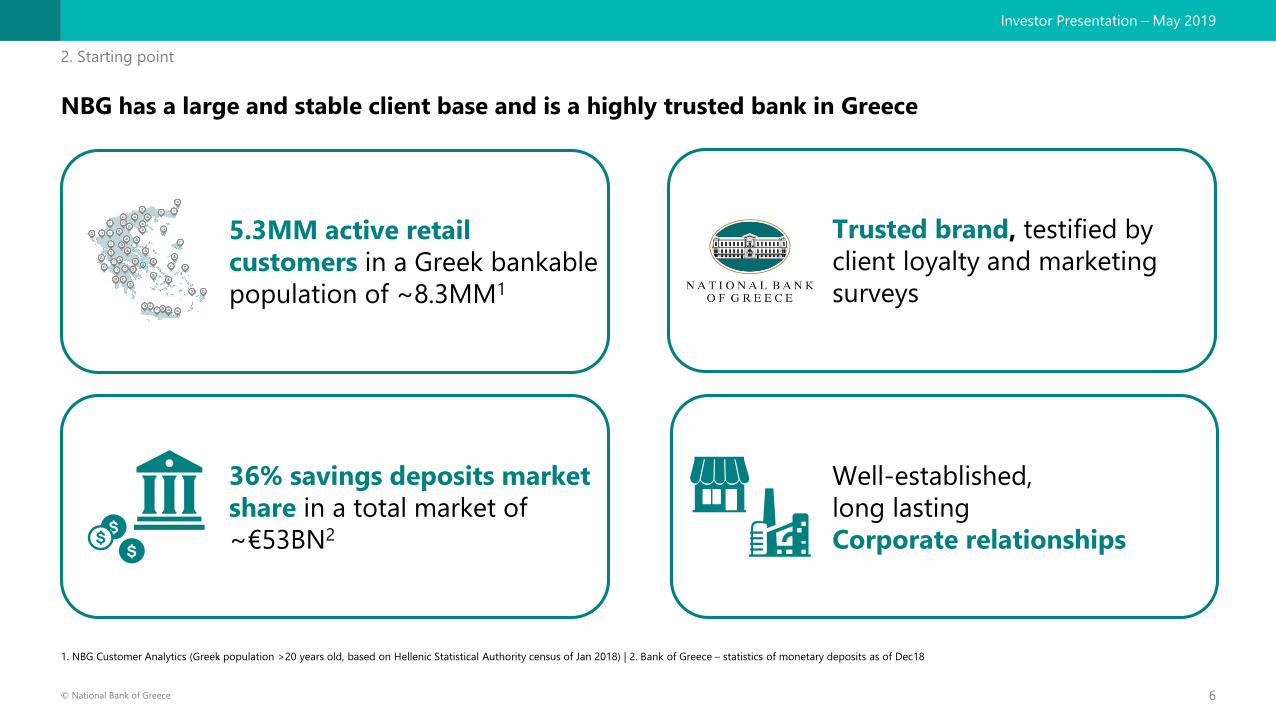
NBG has a large and stable client base and is a highly trusted bank in Greece
2. Starting point
36% savings deposits market
share in a total market of
~€53BN2
Well-established,
long lasting
Corporate relationships
5.3MM active retail
customers in a Greek bankable
population of ~8.3MM1
Trusted brand, testified by
client loyalty and marketing
surveys
1. NBG Customer Analytics (Greek population >20 years old, based on Hellenic Statistical Authority census of Jan 2018) | 2. Bank of Greece – statistics of monetary deposits as of Dec18

7© National Bank of Greece
Investor Presentation – May 2019
Cash coverage and low cost liquidity are our key strengths
Highest NPE coverage in the market Strongest liquidity position
Savings deposits2
€BN
11.4
Greek peers averageNBG
19.3
Loan to deposit ratio
%
70
100
Greek peers averageNBG
Gross NPE
Group, €BN
6.8
12.7
9.5
10.516.3
NBG Greek peers average
23.2
Unprovided
Provided
45%59%Total provision
coverage
1
Yield3 3bps
Market
share36%
LCR
NSFR
144%
108%
2. Starting point
Note: Group level 2018YE figures, except for saving deposits
1. Average of NPE stock for Greek systemic banks (excluding NBG group). Source: 2018YE financial reports | 2. Bank of Greece – statistics of monetary deposits as of Dec18 | 3. Average funding cost on savings deposits

8© National Bank of Greece
Investor Presentation – May 2019
A new management team committed to effect change
Kostas
Adamopoulos
Head of
Strategic
Transactions
Fotini
Ioannou
Head of
Troubled
Assets Group
Christina
Theofilidi
Head of Retail
Banking
Ioannis
Vagionitis
Chief Risk
Officer
Pavlos
Mylonas
Chief Executive
Officer
Chara
Dalekou
Head of
Marketing &
Communi-
cations
Panos
Dasmanoglou
Chief
Governance &
Compliance
Officer
Beate Randulf
Head of
Internal
Controls
Evi
Hatzioannou
Head of Human
Resources
Aris
Divaris
Head of
Operations
Stratos
Molyviatis
Chief
Information
Officer
Christos
Christodoulou
Chief Financial
Officer
Vassilis
Kavalos
Group
Treasurer
Ernestos
Panayiotou
Chief
Transformation
Officer
3. The team
George
Koutsoudakis
AGM Corporate
Banking
Vassilis
Karamouzis
AGM Corporate
& Investment
Banking

9© National Bank of Greece
Investor Presentation – May 2019
Our key challenges The opportunity
Elevated NPE levels Highest coverage in the market and a realistic plan to tackle the issue in place
High legacy cost base Areas of improvement identified and actions to capture efficiency gains planned
Low cross-selling Opportunities to increase fees and NII identified, strong brand and large client
base already in place
Outdated HR managementNew employee value proposition and performance management system expected
to boost productivity
Limited MIS visibility and staff
accountabilityUpgrades to planning and value-based-management infrastructure well under way
Limited digital penetrationInvestments to improve customer experience across channels, modernise
processes and support cost reduction
A
B
C
D
E
F
Our challenges are clear and require rapid and effective action
4. Strategic priorities

10© National Bank of Greece
Investor Presentation – May 2019
Our six strategic priorities for 2019-2022
CLEAN-UP
THE BALANCE
SHEET
MOBILISE OUR
PEOPLE
Front-load NPE clean-up delivering a
~5% NPE ratio
Reward performance and motivate our
people aligning individual objectives to
strategic goalsA D
IMPROVE
VISIBILITY &
CONTROL
ENHANCE
EFFICIENCY
& AGILITY
Complete FTE reductions and G&A
rationalisation supporting C:I drop to
~45%
Enhance client planning and steering tools
enabling value and risk-based decisionsB E
UPGRADE
TECHNOLOGY
INFRASTRUCTURE
BOOST
REVENUE
GENERATION
Improve sales and service orientation
growing non-risk income and shifting
transactions to digital channels
Invest to modernize the technology
infrastructure improving efficiency and
service levels
C F
4. Strategic priorities

11© National Bank of Greece
Investor Presentation – May 2019
NPE stock and coverage
2018YE, Group, €BN
A clean bank with an NPE ratio of ~5% in 2022
Strategic directions
• Material NPE reduction by 2020, driven by
sales in the consumer, SBL and corporate
portfolios
• More concessionary restructurings and
friendlier legal framework to increase
recoverable value in the mortgages portfolio
• Large mortgage securitisations in 2021–22,
when market conditions have further
improved and restructuring efforts have been
explored
• Internal REO platform to cover the entire
value chain from onboarding to
commercialisation, supporting liquidation
targets
NPE evolution targets
Group, €BN
~1.7
~4.7
~2.3
2018
~2.9
~4.4
2019 2020 2021 2022 2022YE
~16.3
~5%
>50%
NPE Ratio
S3 Coverage
FNPEs <90dpd ~€1BN
4. Strategic priorities | A. Clean-up the balance sheet
~50% inorganic reduction 2019-2022
78%
Mortgages
42%89%
Corporate, SME & ShippingConsumer
66%
SBL
60%
Subsidiaries
Total Provisions
~7.0
~1.4~1.9
~4.9
~0.9
12© National Bank of Greece
Investor Presentation – May 2019
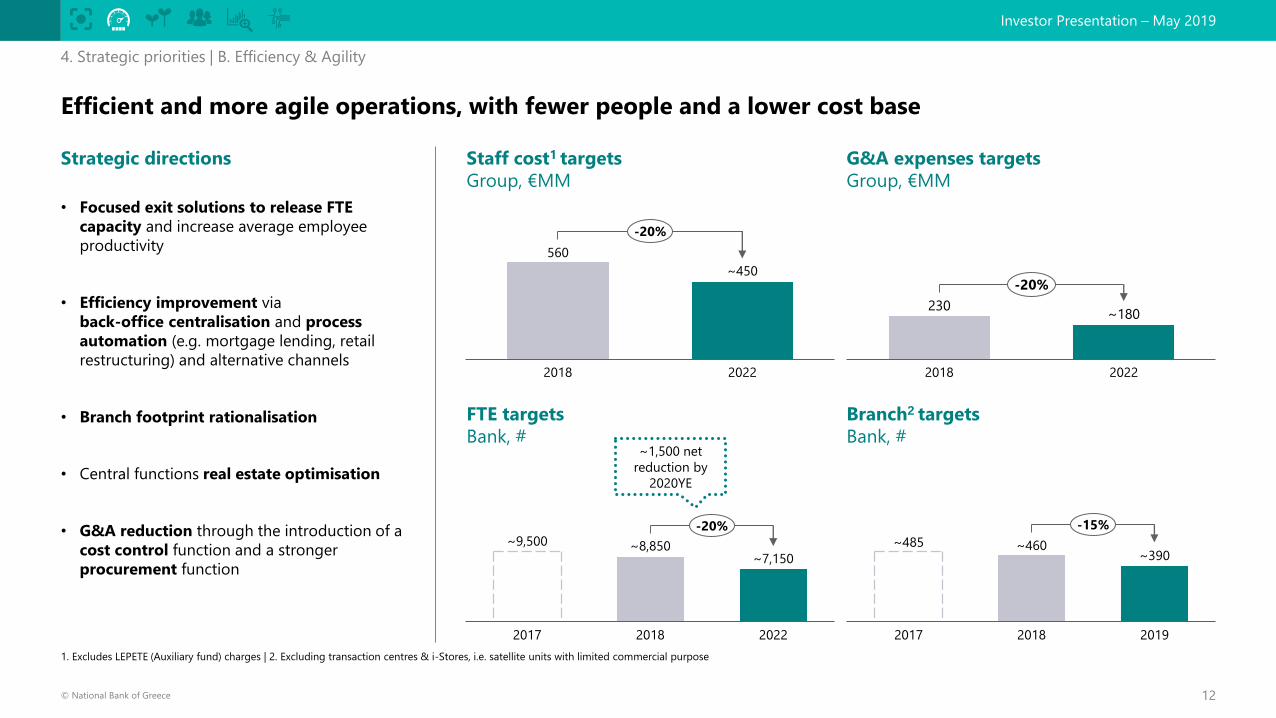
Efficient and more agile operations, with fewer people and a lower cost base
Strategic directions
• Focused exit solutions to release FTE
capacity and increase average employee
productivity
• Efficiency improvement via
back-office centralisation and process
automation (e.g. mortgage lending, retail
restructuring) and alternative channels
• Branch footprint rationalisation
• Central functions real estate optimisation
• G&A reduction through the introduction of a
cost control function and a stronger
procurement function
4. Strategic priorities | B. Efficiency & Agility
Staff cost1 targets
Group, €MM
FTE targets
Bank, #
Branch2 targets
Bank, #
20222017 2018
~9,500 ~8,850~7,150
-20%
~1,500 net
reduction by
2020YE
~485 ~460~390
20192017 2018
-15%
560
2018 2022
~450
-20%
230~180
2018 2022
-20%
G&A expenses targets
Group, €MM
1. Excludes LEPETE (Auxiliary fund) charges | 2. Excluding transaction centres & i-Stores, i.e. satellite units with limited commercial purpose

13© National Bank of Greece
Investor Presentation – May 2019
A retail bank more focused on cross-sell and fee generation
Strategic directions
• Segment-focused RMs for affluent and small
business
• Accelerated migration of transactions
to digital channels to increase time spent
on sales
• Push of fee-generating products and
services, introduction of product bundles
and revamped credit card loyalty scheme
• Stronger performance management and
data analytics
• Simple and engaging digital proposition to
increase usage and onboard new clients
4. Strategic priorities | C. Boost revenue generation
Gross interest income targets
Retail performing loans, €MM
119
20222018
~190
~60%
Consumer3
2022
Mortgages
2018
SB
~0.4
~1.3
~X3.5
Loan origination targets
Retail, €BN
394
20222018
~520
>30%
Fee income targets
Retail, €MM
Key indicators
Δ 2018-2022
Note: Bank level figures
1. Monthly mobile active users | 2. Cross-sell ratio: number of products per retail client | 3. Includes credit cards
Mobile active users1
Cross-sell ratio2
Payment fees
8% ~25%
3 ~3.7
+~50%

14© National Bank of Greece
Investor Presentation – May 2019
A corporate bank with deeper large client relationships and a broader SME base
Strategic directions
• Enhanced service levels through corporate
branches, new RMs, faster processes and
digital offerings
• Further refocusing of relationship
managers’ time, from credit underwriting
activities to sales
• Push on ancillary products and fees (e.g.
treasury, trade finance, insurance)
• Deployment of EVA and account planning
tools to improve client understanding and
sales focus
Gross interest income targets
Corporate performing loans, €MM
80
~120
2018 2022
~50%
20222018
Shipping
SMEs
Corporate1
~2.6~3.0
~15%
Loan origination targets
Corporate, €BN
421
2018 2022
~670
~60%
Fee income targets
Corporate, €MM
Key indicators
Δ 2018-2022
Of which
~50% in
2018Q4
4. Strategic priorities | C. Boost revenue generation
Note: Bank level figures.
1. Includes large corporate, midcaps and structured finance | 2. Cross-sell ratio: number of products per corporate client | 3. Target achieved by 2019
RM client facing time x 2
Cross-sell ratio2
Branches with
Corporate personnel3
x2
3 ~5
5 ~30

15© National Bank of Greece
Investor Presentation – May 2019
MOBILISE OUR
PEOPLED
IMPROVE
VISIBILITY &
CONTROLE
UPGRADE
TECHNOLOGY
INFRASTRUCTURE
F
Our people, accountability and upgraded technology as key enablers
4. Strategic priorities | People, visibility, technology (D, E, F)
• New people strategy: performance management, transparent career path and development programs for our
core talent
• Redesigned organisation: leaner structure and higher mobility
• Reporting tools to measure performance
• Steering tools to enhance value-based decision making
• Improved data quality and availability to the business
• Investment on the evolution of digital channels
• Reduction of cost through simplification, consolidation of IT infrastructure and process automation
• Upgrade of core systems to improve IT capacity, flexibility and time to market
16© National Bank of Greece
Investor Presentation – May 2019
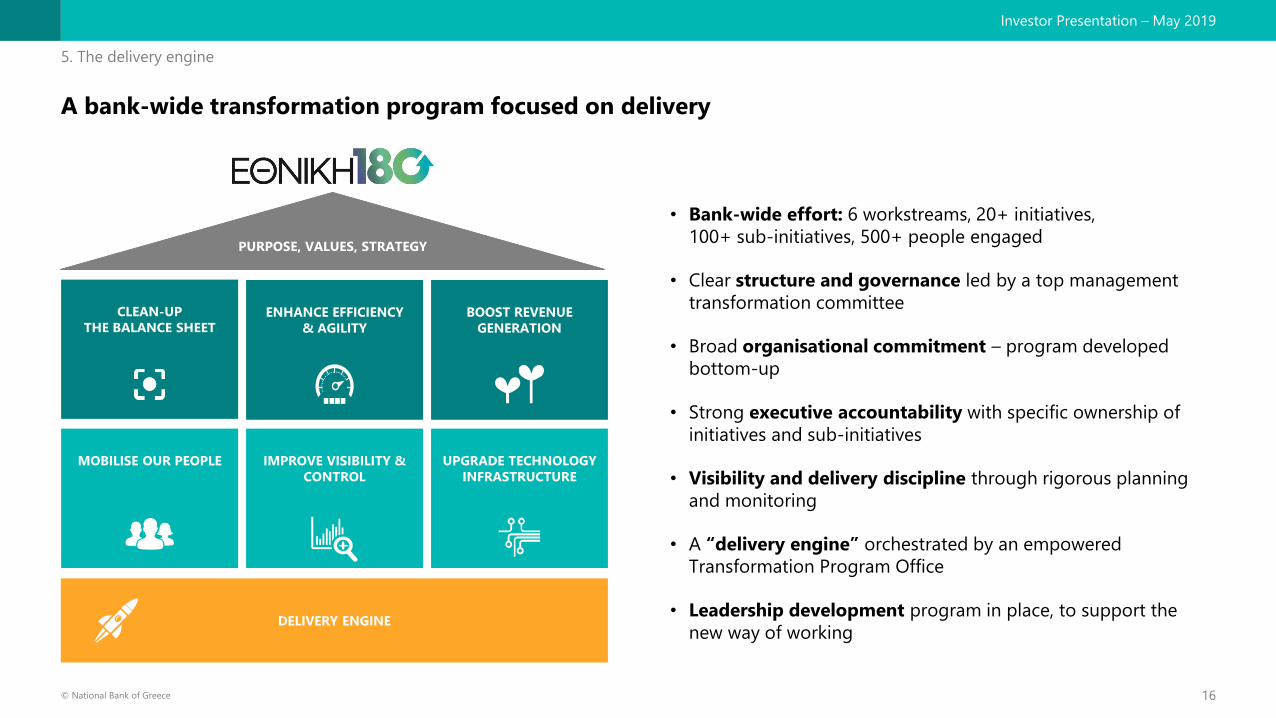
PURPOSE, VALUES, STRATEGY
CLEAN-UP
THE BALANCE SHEETENHANCE EFFICIENCY
& AGILITY
BOOST REVENUE
GENERATION
MOBILISE OUR PEOPLE IMPROVE VISIBILITY &
CONTROL
UPGRADE TECHNOLOGY
INFRASTRUCTURE
DELIVERY ENGINE
A bank-wide transformation program focused on delivery
• Bank-wide effort: 6 workstreams, 20+ initiatives,
100+ sub-initiatives, 500+ people engaged
• Clear structure and governance led by a top management
transformation committee
• Broad organisational commitment – program developed
bottom-up
• Strong executive accountability with specific ownership of
initiatives and sub-initiatives
• Visibility and delivery discipline through rigorous planning
and monitoring
• A “delivery engine” orchestrated by an empowered
Transformation Program Office
• Leadership development program in place, to support the
new way of working
5. The delivery engine

17© National Bank of Greece
Investor Presentation – May 2019
A clean and profitable bank in 2022 – the Greek bank of choice
6. NBG in 2022
2018 2022 targets
CET1
Cost : Income1
NPE ratio
ROE <0% ~11%
41% ~5%
75% ~45%
16.1% ~15%
Note: Group level figures
1. Excluding restructuring costs

18© National Bank of Greece
Investor Presentation – May 2019
AGENDA
Introduction Costas Michaelides | Chairman
Strategic objectives 2019–2022Pavlos Mylonas | Chief Executive Officer
Financial targets
Clean-up the balance sheet Fotini Ioannou | Head of Troubled Assets Group
Boost revenue generationChristina Theofilidi | Head of Retail Banking
Vassilis Karamouzis | AGM Corporate & Investment Banking
Enablers: people, technology, processesEvi Hatzioannou | Head of Human Resources
Stratos Molyviatis | Chief Information Officer
Ethniki180: Transformation Program Ernestos Panayiotou | Chief Transformation Officer
Q&A

19© National Bank of Greece
Investor Presentation – May 2019
Notes: Group level figures
1. Includes Greek T-Bills, GGBs and Greek sovereign swap | 2. Includes savings and sight deposits
76%
3%
97%
2018
24%
2022
Net PE
Net NPE
30.1 ~30.0
5%
76%
2022
~13.5
19% 12%
2018
64%
24%
8.8
100%
2022
33%
2018
67%0.9
~3.0
Targeting a balance sheet geared towards profit generation
~6.2
2018 2022
~5.0
2022
33% 33%
67%
2018
67%
Time
Core2
43.0
~47.5
Greek sovereign risk1 EU sovereign bonds (non-Greek) Other
Assets
€BN
Deposits Long term debt
Net loans Securities
Accounting equity
Liabilities
and equity
€BN
Senior Debt/Tier 2Covered Bonds

20© National Bank of Greece
Investor Presentation – May 2019
∆ 2018 vs. 2022 target
ROE drivers: top-line growth, cost reduction and CoR normalisation
2018
~ 1,710
2022
1,312
926~ 800
2018 2022
340~ 235
2018 2022
Core
Income
growth
€MM
Cost
reduction
€MM
Normalised
cost of risk
€MM
~ €400MM1
~ €125MM
Core income targets
Opex targets
Impairment targets
Total
~ €105MM
~ €630MM
=
+
+
Note: Group level figure
1. Core income growth excludes trading and other income

21© National Bank of Greece
Investor Presentation – May 2019
Asset class 2018 2022
Corporate 4.2% ~4.3%
SBL 6.6% ~6.8%
Consumer1 8.0% ~10.2%
Mortgage 2.2% ~2.9%
Total 3.8% ~4.4%
Yield assumptions on performing loans
1.3%
• Corporate & SME PE book growth of ~€5.5BN
in 2022 vs. 2018
• GGBs exposure as a result of Titlos transaction
• Deployment of excess liquidity into European sovereign bonds
• Reduced average bond tenor in anticipation of higher interest
rates and to reduce mismatch (IRRBB) risk
2.6%
3.7%
Yields 2022
NII improvement due to portfolio rebalancing to higher yielding assets
Core Income Growth
5%
60%
16%
24%19%
2018
7%
57%
12%
2022
8.8
~13.5
EU sovereign bonds (non Greek)Tbills GGBs Other
Securities targets
Domestic, €BN
Performing loans targets
Domestic, €BN
39%29%
49%58%
6%8%5%
2018
7%
2022
22.3 ~29
MortgagesConsumer1SBLCorporate & SME
1. Includes credit cards

22© National Bank of Greece
Investor Presentation – May 2019
NII growth and quality improvement
NII evolution targets
Domestic, €MM
2018
~380
NPEs
~110
PEs
~220
Swap
arrangement
with Greek state
~120
Securities
~90
Deposits
~70
Non deposit
funding
~30
Other1 2022
1,007
~1,270
Deployment
of excess
liquidity
Includes funding costs
related to issuance of Tier
II and Senior notes to
comply with regulatory
requirements
Assets Liabilities
Core Income Growth
Due to ~€4BN
increase in deposits
and ~20bps increase
in average deposit
yields
1. Includes subsidiaries
PE loans growth driven by
cumulative disbursement of
~€4BN in Retail, ~€12BN in
Corporate and ~€2BN of net curing

23© National Bank of Greece
Investor Presentation – May 2019
Fee income targets driven by new origination, cross-sell and pricing actions
Fee income targets
Domestic, €MM
~25
~40
2018 Lending
related
Digital channels
& payments
Pricing &
bundle offers
Bancassurance
& investments
Non-lending
corporate fees
2022
228
~25
~20
~15 ~350
Core Income Growth
New origination & digital
+ ~€65MM
Cross-sell & pricing
+ ~€60MM

24© National Bank of Greece
Investor Presentation – May 2019
Targeted cost reduction mainly driven by staff cost improvements
Opex evolution targets
Group, €MM
Cost reduction
~35
2022
926
20182
~110
Staff
costs
LEPETE -
Auxiliary fund
~50
G&A
~1
D&A
~800
Cost: Income1
Total reduction3
-17%
75% ~45%
~460
~100
2018 Cumulative
2019-2022
>40%
Capex
Group, €MM
1. Excluding restructuring costs | 2. 2018 Pro forma (Pangaea deconsolidated and adjusted for IFRS 16 implementation) | 3. Excluding LEPETE
Capex related to
transformation

25© National Bank of Greece
Investor Presentation – May 2019
Substantial efficiencies across the bank, combined with a targeted renewal of the workforce
Key actions
• New hires: focused hiring plan until 2022 to
support revenue growth and transformation
needs
• Excess capacity due to network and HQ
restructuring: downsizing of branch network
footprint, discontinuation of discretionary
activities at the Head Office and potential
outsourcing
• Transaction migration to digital: migration
of transactions to digital, reducing capacity
requirements
• Process redesign & organisational
simplification: cross-functional processes
(e.g. optimisation of retail/corporate lending
and retail restructuring), de-layering and
simplification of the organisational structure
Headcount evolution targets
~7,150
350-450
2018 New hires
800-900
Excess capacity
due to network
and HQ
restructuring
800-1,000
Transaction
migration
to digital
Process redesign
& organisational
simplification
Target
headcount
~8,850
300-450
Cost reduction

26© National Bank of Greece
Investor Presentation – May 2019
• Incentives based on age
and tenure
• Cash add-ons and top-ups to
provide “bridge-to-pension” for
older employees
• Children support bonus
• Provision of health insurance
(for 15 years after exit)
• Coverage extended to all
family members
• Maintenance of mortgage terms
• Financial management and family
business development support
towards retirement
Monetary compensation Health insurance Additional support
Cost reduction
Attractive and socially responsible new VES to incentivize exits
Main pillars of the new VES
VES payback period: ~2.1 years

27© National Bank of Greece
Investor Presentation – May 2019
Sustainable savings through tight cost control and stronger procurement processes
Key priority areas
(Non exhaustive)
• Legal, and other professional
services: review major contracts and
manage demand
• Real estate: optimise space utilization,
rents and maintenance costs
• Insourced personnel: review large
insourced personnel contracts
• Information Technology (IT):
Renegotiate IT support with selected
providers
• Personnel related costs: review
benefit policies
Actions
• Enhance spending monitoring and enforce controls
• Challenge demand and spending from BUs
• Identify saving opportunities through cost-benefit analyses
• Centralise sourcing for >80% of spending
• Standardise sourcing strategy, increase use of competitive tenders
on large contracts
• Install strict purchasing policies
Set-up
Cost Control
Unit
Reinforce
Procurement
Unit
Cost reduction

28© National Bank of Greece
Investor Presentation – May 2019
Relatively low cost of risk throughout the clean-up due to high cash coverage
Cost of risk evolution targets1
Group, bps
113
2018 Avg. 2019-2022 Run rate post 2022
~110
50 – 60
Normalized cost of risk
• High loss budget
until 2022 due to
NPE clean-up
• Run rate cost of
risk of 50-60bps
expected after 2022
~9.0
2018 existing
~1.3
~10.3
2019 - 2022
cumulative impairments
2018-2022
Cumulative provisions1
Group, €BN
1. Including loss budget

29© National Bank of Greece
Investor Presentation – May 2019
~15.0
Cumulative PAT2018
~3.2
Basel IV
~2.1
RWAs expansion1 DTC amortisationSubsidiaries
disposals
~2.2 ~2.1
IFRS9 transitional
adjustment
~0.8
~1.4
2022
16.1
Total capital
Capital evolution targets
Group, %
Planned divestments
of Romania, Cyprus,
Egypt in 2019 and
Ethniki Insurance by
2020
Aiming for robust capital generation throughout the transformation period
16.2 ~17.0
CET1
Including ~€0.8BN TIER II outstanding
Of which non-
recurring losses
with -180-
190bps impact
Organic One-off Regulatory / Accounting
CET1
min
11.0%
OCR
min
14.5%
1. Standardised adoption impact is expected to be fully offset as net NPEs are eliminated

30© National Bank of Greece
Investor Presentation – May 2019
Cost of Risk
CET1 ratio / Total
capital ratio
NPEs GrossCost : Income1
NPE Ratio
2018 2022 targets
ROE
Fees / Total
Assets
Net Interest
MarginNPE Coverage4
2018 2022 targets
PE Loans
290bps ~ 300bps
43bps ~ 60bps
75% ~ 45%
113bps2 ~ 80bps3
<0% ~11%
55.1% >50%
41.0% ~ 5%
€16.3BN ~ €1.7BN
€23.3BN ~€30BN
16.1% / ~15.0% /
16.2% ~17.0%
Profitability Asset Quality, Capital & Liquidity
5% ROE5 in
2020
15.5% CET1
in 2020
Note: Group figures
1. Excluding restructuring costs | 2. Excludes recoveries related to the unsecured portfolio sale in 2018 | 3. Run-rate cost of risk post 2022 at 50-60bps | 4. Stage3 provision coverage | 5. Excluding VES, restructuring costs and sale of Ethniki Insurance
Delivering value for shareholders

31© National Bank of Greece
Investor Presentation – May 2019
AGENDA
Introduction Costas Michaelides | Chairman
Strategic objectives 2019–2022Pavlos Mylonas | Chief Executive Officer
Financial targets
Clean-up the balance sheet Fotini Ioannou | Head of Troubled Assets Group
Boost revenue generationChristina Theofilidi | Head of Retail Banking
Vassilis Karamouzis | AGM Corporate & Investment Banking
Enablers: people, technology, processesEvi Hatzioannou | Head of Human Resources
Stratos Molyviatis | Chief Information Officer
Ethniki180: Transformation Program Ernestos Panayiotou | Chief Transformation Officer
Q&A

32© National Bank of Greece
Investor Presentation – May 2019
Subsidiaries2018
Group
15.4
~3.3
0.9
2018
Bank
~2.5
Liquidations
~0.5
Other
write-offs
Sales
~3.3
Securitisations 2022Debt
forgiveness
~2.0
16.3
New
defaults
~1.6
~1.0
~3.3
Net
curings &
recoveries
Organic and inorganic actions driving NPE targets below €2BN
NPE evolution targets1
Bank, €BN
Inorganic
Organic • Frontloaded sales of highly covered
portfolios
• Accelerated restructurings
capitalising on high cash coverage
and a friendlier legal environment
• Liquidations as a signalling tool for
non-cooperative and non-viable clients
• Large securitisation after
restructuring attempts and front-
loaded sales to address the most
critical part of the NPE portfolio,
balancing value and timing
considerations
CLEAN-UP THE BALANCE SHEET
Outperformance of
SSM targets by
~€1BN in 2016-2018
1. Gross NPEs

33© National Bank of Greece
Investor Presentation – May 2019
A powerful NPE management platform in place to deliver the NPE reduction
NPE management operations
Internal
~700
External2 Total
~500
~1,200
~220
External2Internal3
~50
Total
~270
~240~160
External2Internal
~80
Total
Headcount1
#
• Control over the entire NPE
management lifecycle
• Well-staffed operations, with
experienced and trained personnel
• Flexibility ensured by outsourcing of
non-core activities
• Task force teams to perform large
transactions and resolve complex
restructuring / denouncement cases
Front-office Operations
(Large Corp, SMEs, SBL, Shipping)
Task Force (Investment Bank team,
Denounced Task Force)
Middle & Back Office Operations
Retail
Collections
Special Assets
Unit
(SAU)
Group Real
Estate
REO & Property Management
Asset Valuation
Special Projects & RE advisory
Retail Collections Operations
Delinquent Retail underwriting
Retail Collections Strategy &
Support
Retail NPEs
Corporate NPEs
RE assets
Technical Services
Highlights
1. Does not include supporting shared services | 2. Includes insourced personnel | 3. Does not include internal lawyers and technical experts working on SAU NPE cases
CLEAN-UP THE BALANCE SHEET

34© National Bank of Greece
Investor Presentation – May 2019
NPE reduction strategy designed to maximise portfolio value
NPE targets, Bank solo, €BNSuccessful
restructuring1,2 Liquidations1 Sales /
Securitisations1
Mortgages ~3.2 ~0.9 ~2.6
Consumer ~0.3 - ~1.1
SBL ~0.4 ~0.3 ~1.2
SME ~0.4 ~0.5 ~1.1
Large
Corporates &
Shipping
~1.1 ~0.8 ~0.5
20222018
~1.0
7.0
2018
~0.1
2022
1.4
~0.11.9
20222018
2.8
2018 2022
~0.3
~0.1
2018
2.1
2022
A
B
C D • Restructuring of retail exposures
involving deep debt forgiveness
supported by provision stock and new
legal framework
• Long term restructurings as core
reduction lever for Large Corporates
and Shipping clients
• Cooperation with other banks on
multi-bank exposures via NPL forum
(Large Corporates) and Solar (SMEs)
• Liquidations used as a signalling
tool for non-cooperative / non-viable
debtors
• Front-loaded sales as core reduction
lever for Consumer, SBL & SME
• Large mortgage securitisation in
2021-22
A
B
C
D
CLEAN-UP THE BALANCE SHEET
Note : Bank level figures
1. Excludes other write-offs (not linked to actions): €0.1BN in SBL, €0.1BN in SME, €0.3BN in Large Corp. & Shipping | 2. Includes net recoveries, net curings and debt forgiveness
35© National Bank of Greece
Investor Presentation – May 2019
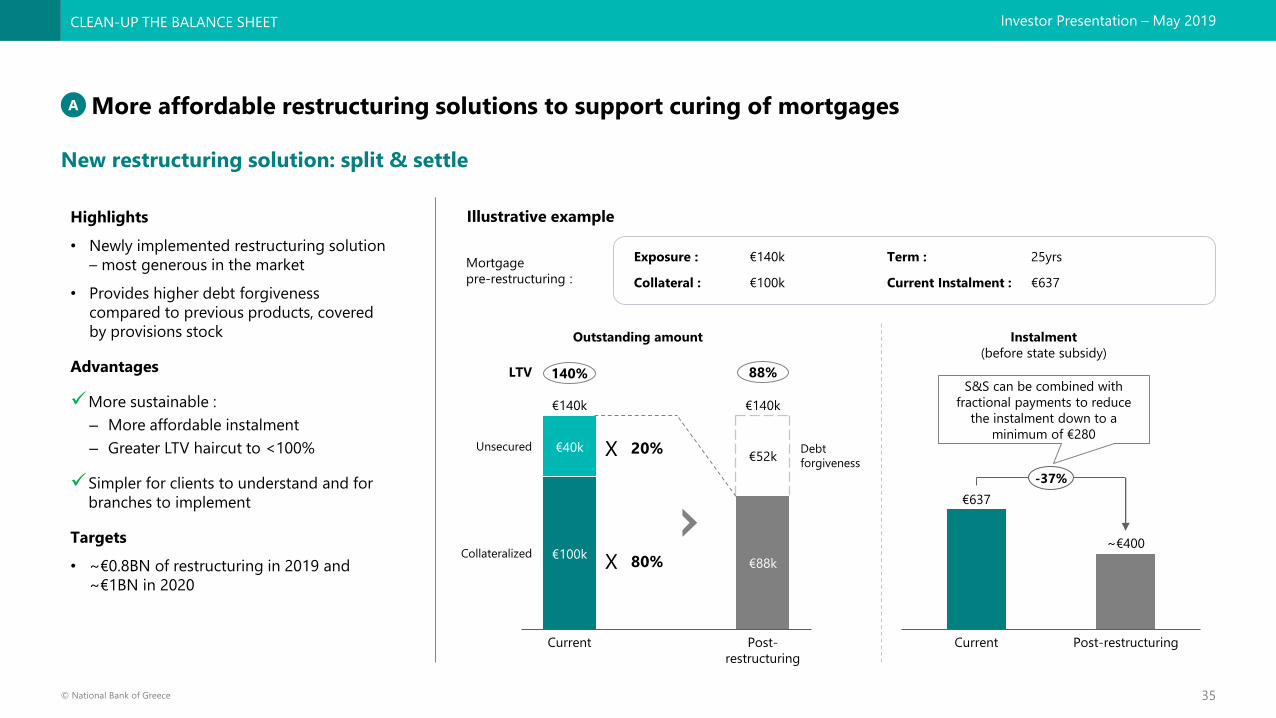
Highlights
• Newly implemented restructuring solution
– most generous in the market
• Provides higher debt forgiveness
compared to previous products, covered
by provisions stock
Advantages
More sustainable :
– More affordable instalment
– Greater LTV haircut to <100%
Simpler for clients to understand and for
branches to implement
Targets
• ~€0.8BN of restructuring in 2019 and
~€1BN in 2020
More affordable restructuring solutions to support curing of mortgages
New restructuring solution: split & settle
A
Illustrative example
€100k€88k
€40k€52k
Current
Collateralized
Unsecured
Post-
restructuring
Debt
forgiveness
€140k €140k
Exposure : €140k Term : 25yrs
Collateral : €100k Current Instalment : €637
20%
80%X
X
€637
Post-restructuringCurrent
~€400
-37%
Outstanding amount Instalment
(before state subsidy)
Mortgage
pre-restructuring :
140% 88%LTVS&S can be combined with
fractional payments to reduce
the instalment down to a
minimum of €280
CLEAN-UP THE BALANCE SHEET
36© National Bank of Greece
Investor Presentation – May 2019
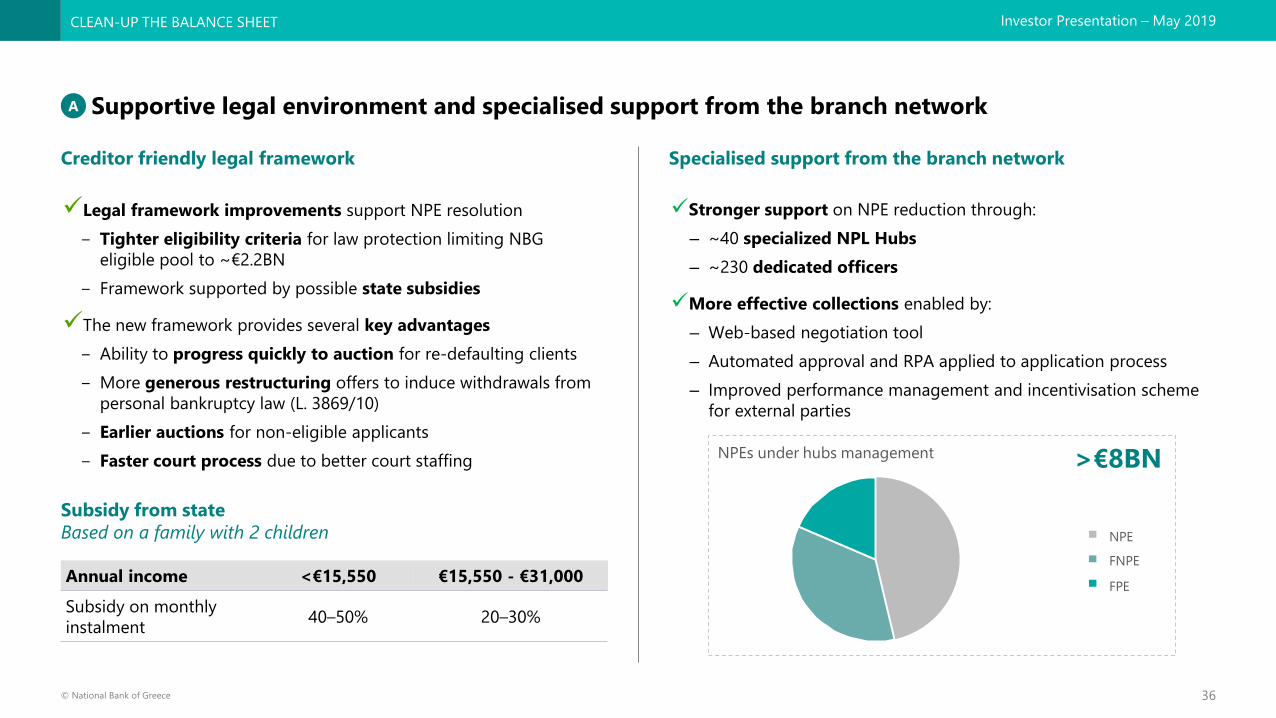
Legal framework improvements support NPE resolution
‒ Tighter eligibility criteria for law protection limiting NBG
eligible pool to ~€2.2BN
‒ Framework supported by possible state subsidies
The new framework provides several key advantages
‒ Ability to progress quickly to auction for re-defaulting clients
‒ More generous restructuring offers to induce withdrawals from
personal bankruptcy law (L. 3869/10)
‒ Earlier auctions for non-eligible applicants
‒ Faster court process due to better court staffing
Stronger support on NPE reduction through:
– ~40 specialized NPL Hubs
– ~230 dedicated officers
More effective collections enabled by:
– Web-based negotiation tool
– Automated approval and RPA applied to application process
– Improved performance management and incentivisation scheme
for external parties
Supportive legal environment and specialised support from the branch network
Creditor friendly legal framework Specialised support from the branch network
Annual income <€15,550 €15,550 - €31,000
Subsidy on monthly
instalment40–50% 20–30%
Subsidy from state
Based on a family with 2 children
A
NPEs under hubs management >€8BN
NPE
FNPE
FPE
CLEAN-UP THE BALANCE SHEET
37© National Bank of Greece
Investor Presentation – May 2019
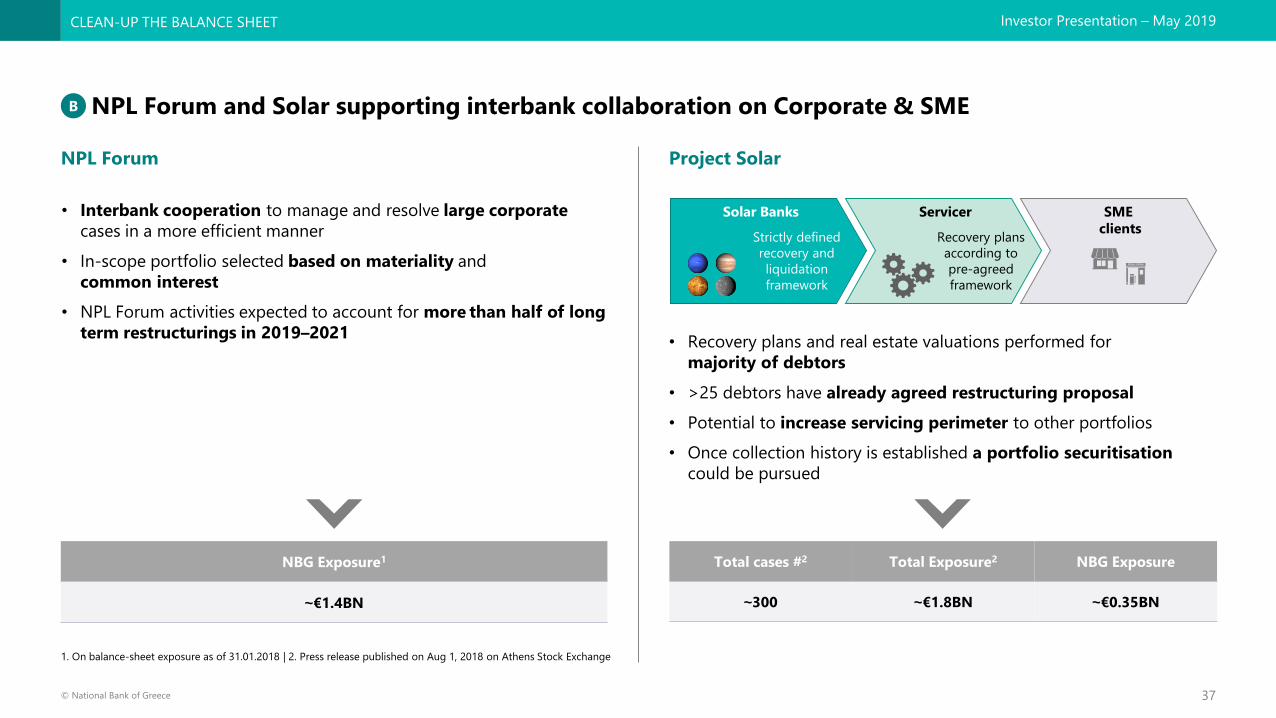
NPL Forum and Solar supporting interbank collaboration on Corporate & SME
NPL Forum Project Solar
NBG Exposure1
~€1.4BN
B
Total cases #2 Total Exposure2 NBG Exposure
~300 ~€1.8BN ~€0.35BN
CLEAN-UP THE BALANCE SHEET
1. On balance-sheet exposure as of 31.01.2018 | 2. Press release published on Aug 1, 2018 on Athens Stock Exchange
• Interbank cooperation to manage and resolve large corporate
cases in a more efficient manner
• In-scope portfolio selected based on materiality and
common interest
• NPL Forum activities expected to account for more than half of long
term restructurings in 2019–2021• Recovery plans and real estate valuations performed for
majority of debtors
• >25 debtors have already agreed restructuring proposal
• Potential to increase servicing perimeter to other portfolios
• Once collection history is established a portfolio securitisation
could be pursued
SME
clients
Servicer
Recovery plans
according to
pre-agreed
framework
Solar Banks
Strictly defined
recovery and
liquidation
framework
38© National Bank of Greece
Investor Presentation – May 2019
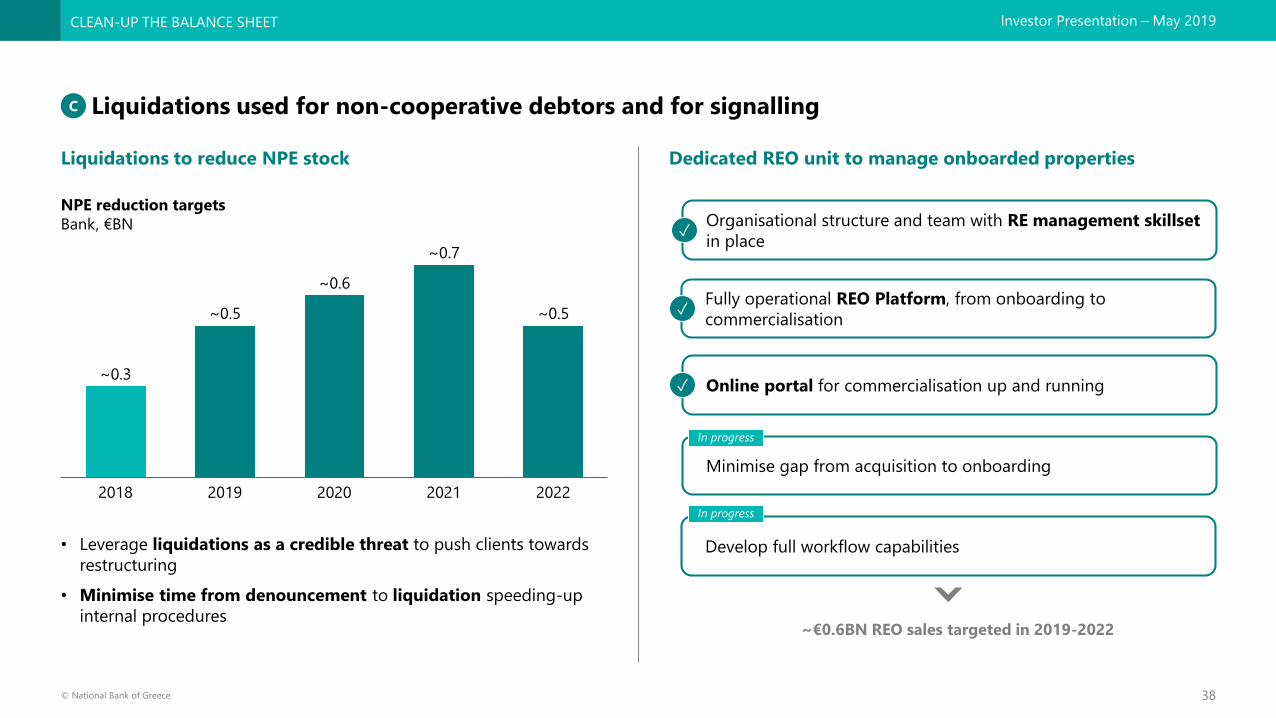
• Leverage liquidations as a credible threat to push clients towards
restructuring
• Minimise time from denouncement to liquidation speeding-up
internal procedures
Liquidations used for non-cooperative debtors and for signalling
Liquidations to reduce NPE stock Dedicated REO unit to manage onboarded properties
C
Online portal for commercialisation up and running
Organisational structure and team with RE management skillset
in place
Minimise gap from acquisition to onboarding
✓
Fully operational REO Platform, from onboarding to
commercialisation
NPE reduction targets
Bank, €BN
Develop full workflow capabilities
✓
✓
In progress
In progress
~€0.6BN REO sales targeted in 2019-2022
2019
~0.5
2018 2022
~0.6
2020 2021
~0.3
~0.5
~0.7
CLEAN-UP THE BALANCE SHEET

39© National Bank of Greece
Investor Presentation – May 2019
NPE sales in 2019 followed by securitisations in 2020-2022
€MM (on B/S)2 Symbol Mirror Secured Corporate
Consumer - ~750 -
SBL ~450 ~200 ~300
Large - - ~100
SME ~300 ~50 ~ 350
Total GBV ~750 ~1,000 ~750
D
NPE cash coverage1
2018YE, %
Mortgages Consumer
42%
89%
SBL Corporate
78%66%
45% 45%
66% 32%
NPE
ratio
NPE
ratio
Project Symbol
Sale of secured
SBL/SME portfolio
~€0.75BN
Project Mirror
Sale of a ~€1BN
unsecured retail,
SB and small SME
portfolio
2020 -22
Sale of a
~€0.75BN
Secured SBL /
Corporate &
SME portfolio
Project Solar
Securitisation of a
~€0.3BN SME
portfolio
Securitisation of
a ~€3BN
mortgages and
Consumer / SBL
portfolio
H1 2019 H2 2019
Sale of a
~€0.7BN
portfolio of
Consumer, SBL
and Corporate
Targeted sales and securitisations
Note : Bank level figures
1. Total provisions coverage | 2. Approximate figures based on current perimeter assessment
CLEAN-UP THE BALANCE SHEET

40© National Bank of Greece
Investor Presentation – May 2019
Targeted NPE reduction achieved without dilution for shareholders
NPE stock evolution targets
Group, €BN
NPE reduction coverage
Group, €BN
7.3Net NPEs
~1.8
9.0
2018
~0.8
2022
provisions1
~0.9
2022
Stage3
provisions
16.3
~1.7
-14.7
41% ~5%NPE ratio
%
Total coverage
~9.7
NPE reduction
target
9.0
~1.3
14.7
Related collateral3Provisions
10.3
~20.0
Total Capital
2020
16.1%
2018
~15.5%
2022
~15.0% CET1
16.2% ~16.5% ~17.0%
Capital evolution targets
Group, %
2018
New2
CLEAN-UP THE BALANCE SHEET
1. Total provisions | 2. Cumulative impairments 2019-2022 | 3. Total collateral coverage at current valuations

41© National Bank of Greece
Investor Presentation – May 2019
AGENDA
Introduction Costas Michaelides | Chairman
Strategic objectives 2019–2022Pavlos Mylonas | Chief Executive Officer
Financial targets
Clean-up the balance sheet Fotini Ioannou | Head of Troubled Assets Group
Boost revenue generationChristina Theofilidi | Head of Retail Banking
Vassilis Karamouzis | AGM Corporate & Investment Banking
Enablers: people, technology, processesEvi Hatzioannou | Head of Human Resources
Stratos Molyviatis | Chief Information Officer
Ethniki180: Transformation Program Ernestos Panayiotou | Chief Transformation Officer
Q&A

42© National Bank of Greece
Investor Presentation – May 2019
NBG is a reference bank for Greek households
Large customer base Strong deposit base
A brand trusted by Greek customers Solid multichannel proposition
BOOST REVENUE GENERATION – RETAIL
8.3 M
5.3 M
Greek bankable population
NBG active customers
NBG deposits
€BN
~440 branches2
~1,475 ATMs
~1,650 Pay spots3
3.9
3.3Greek peers avg.
#1 mobile app rating
19%
36%
~20 ~22
~19~19
2017
Other (sight and time)
2018
~38
Savings
~42
+9%Market share1
Extensive, nation-wide coverage Strong digital offering
NBG
Sources: NBG analysis. Greek population >20 years old, based on Hellenic Statistical Authority census of Jan 2018
Sources: Android ratings as of March 2019, GooglePlay
Trusted brand, testified by client loyalty and
marketing surveys
1. Bank of Greece – statistics of monetary deposits as of Dec18 | 2. 2019Q1 branches excluding transaction centres & i-Stores, i.e. satellite units with limited commercial purpose | 3. Payment facilities in collaboration with local businesses offering
payment services

43© National Bank of Greece
Investor Presentation – May 2019
Clear market opportunities and untapped growth potential
Market opportunities to capture Untapped potential
71%
25%
Greece
~40%
Southern
Europe3
4%
~35%
~25%
Investments
Insurance
Cash
35
912
18 19 20 20
201620152014 2017
EU
GR
1419
25 27
46 49 51 54
20182015 20172016
GR
EU
Private consumption
Greece, yoy % growth
Financial assets of households
%, 2016
Greece catching up in payments and digital penetration
30%
70%
Registered
Non
registered
Card payments value / GDP
%
Internet banking use
% population
Digital touchpoint increase a key objective
Majority of customers not yet
registered on digital
Transaction migration on
electronic channels
69% 75%
31% 25%
2016 2018
Physical
Electronic2
20162014 2018 20222020
0.1%-0.3%
2.1%
0.9%1.0%
1.6%1.8%
1.5%
Lending, investments and bancassurance expected to increase Low product penetration1, cross-selling can be improved
Sources: ELSTAT, AMECO & NBG estimates Sources: NBG Retail (countries involved include Italy and Germany)
Sources: ECB Payment Statistics (countries involved include all members of the European Union)
Sources: OECD National Account Statistics
BOOST REVENUE GENERATION – RETAIL
1. % of active customers holding at least one product of the indicated type | 2. Includes transactions at ATMs | 3. Including Italy, Portugal, Spain, France
European peersNBG
Credit cards
Bancassurance
5% 20 – 40%
5% 10 – 20%
Mortgages
Consumer loans
4% 15 – 25%
10% 10 – 30%
NBG customers registered on digital
channels,%
NBG transactions by channel,%

44© National Bank of Greece
Investor Presentation – May 2019
The transformation of our retail bank is based on three pillars
• Migrate transactions from branches to digital channels
• Drive engagement through attractive day-to-day services
• Sell basic products and onboard new customers
C. Leverage digital to
better serve our clients
• Leverage analytics to understand customer needs, predict and drive front-office activity
• Strengthen the service model through RMs, tailoring to segments that drive value leveraging ‘myNBG’
CRM platform
• Tailor product offering: new fee-generating and lending products, faster delivery and revamp of
loyalty scheme
A. Deploy a customer
centric model to drive
revenue generation
from our customer base
• Complete branch model transition: optimise footprint, standardise “look & feel” and tailor to
segment needs
• Redesign our branch processes to achieve simplicity and improved customer experience
• Redeploy workforce towards customer facing activities, upgrade CRM tools and actively manage
performance
B. Mobilise our network
to deliver results
BOOST REVENUE GENERATION – RETAIL

45© National Bank of Greece
Investor Presentation – May 2019
• Dedicated RMs to service value-generating customer segments in
the branches
• Mass segment needs addressed through systematic targeted
campaigns based on behavioural models
• myNBG platform to facilitate targeting, sales and service capability
• Network activation team for on-the-job training and support
A. Deploy a customer centric model to drive revenue generation from our customer base
• Automated credit application to support purpose-based lending from
partner merchants
• Redesigning customer journeys to enable faster time to money
• Revamp and modernization of Go4More loyalty program
• Introduction of product bundles to generate fees
Strengthen the service model
Leverage analytics to understand customer needs, predict and drive front-office activity
Tailor product offering
• Upgrade data and analytics used for modelling of customer needs and behaviours (e.g. segmentation, churn, propensity)
• Deployment of a Next Best Action engine to drive front-office activity
• “myNBG” in-house CRM platform available in all channels enabling delivery
Cross – sell ratio1Premium and business customers per RM
~200
2018 2022
~280
-28%
BOOST REVENUE GENERATION – RETAIL
~3.0~3.7
2018 2022
+20%
1. Number of products per Retail client

46© National Bank of Greece
Investor Presentation – May 2019
B. Mobilise our network to deliver results
• Optimise footprint to focus on areas with growth potential
• Re-design and modernise branch topology (size, layout, staffing)
• Branch layout to reflect strategy with self service areas for mass and RM service
for premium and business segments
• Introduce paperless processes and expand usage of digital signature
• Simplify and standardise all activities to minimise operations
• Transition from an inconsistent experience to predictable, branded
experience across all touchpoints
• Refocus effort of network on sales and advisory, supported by transaction
migration and elimination of back office tasks
• New CRM platform with management tools for optimising capacity and effort
i.e. client meeting scheduling module
• Network activation team to ensure alignment with targets and systematic
performance management framework
Reduction of time spent on low-value
activities in the branch
Proactive daily customer meetings per RM
Redesign in-
branch
processes
Complete
branch model
transition
Redeploy effort
and manage
performance
Branch network evolution targets
Teller transactions ~30%
Branch support ~35%
Administrative ~45%
2022
2018
4%
46%47%
49% 48%
2017
~3906%7%
52%
40%
2019
460
Corporate1
Full2
Retail
485
1. Branches with Corporate RMs | 2. Branches with premium and corporate RMs
BOOST REVENUE GENERATION – RETAIL
~1.3
2018 2022
~2.6
X2

47© National Bank of Greece
Investor Presentation – May 2019
C. Leverage digital to better serve our clients
• Wide set of basic services available in a single app
• Mobile first strategy
• Enhanced card management features
• ERP integration for SBs
• Personalised notifications
• Day-to-day spending support (PFM)
• Instant payments
• POS management for merchants
• Business Finance Management for SBs and Professionals
• Full digital onboarding
• Digital signature
• Digital sales of simple credit, investment and insurance products
Mobile monthly connections per active user
Products accessible on digital channels
Drive
engagement
Migrate
transaction
Sell basic
products
Mobile monthly active users
BOOST REVENUE GENERATION – RETAIL
8%
2018 2022
~25%
x3
17
2018 2022
~20
+18%
2018 2022
0
~10

48© National Bank of Greece
Investor Presentation – May 2019
Income growth targeted via cross-sell of lending and fee generating products
Retail loan disbursements targets
Bank, €MM
Retail fee income targets
Bank, €MM
New origination
spread avg.
2019 - 2022
Fees /
Net Loans
BOOST REVENUE GENERATION – RETAIL
72
177
117
~470~450
Consumer1Mortgages
~400
Small Business
2018
2022
~350bps ~1,200bps ~675bps
119
2018 2022
~190
+60%
• Overall loan disbursements to increase significantly as we
capture market growth
• Competitive position enhanced through improved lending
process and selective launch of new products
• New production at low risk levels as internal controls and risk
management capabilities are strengthened
• Core retail fees growth driven by payments, bancassurance and
investments related fees
• Gradually bridging fee-generation gap with Southern
European peers
~100bps ~170bps
1. Includes cards

49© National Bank of Greece
Investor Presentation – May 2019
AGENDA
Introduction Costas Michaelides | Chairman
Strategic objectives 2019–2022Pavlos Mylonas | Chief Executive Officer
Financial targets
Clean-up the balance sheet Fotini Ioannou | Head of Troubled Assets Group
Boost revenue generationChristina Theofilidi | Head of Retail Banking
Vassilis Karamouzis | AGM Corporate & Investment Banking
Enablers: people, technology, processesEvi Hatzioannou | Head of Human Resources
Stratos Molyviatis | Chief Information Officer
Ethniki180: Transformation Program Ernestos Panayiotou | Chief Transformation Officer
Q&A

50© National Bank of Greece
Investor Presentation – May 2019
Leveraging NBG’s unique position, we have embarked on a transformation journey towards becoming the best Corporate Bank in the market
BOOST REVENUE GENERATION – CORPORATE
Longest track-record in Greece
Loyal client base
Experienced personnel
Full spectrum of products and services
Strong brand name
Portfolio in growth trajectory
Young talent
New Corporate & Investment Banking platform

51© National Bank of Greece
Investor Presentation – May 2019
+12%
Initiatives launched in 2017-18 have already delivered significant results
Key initiatives FY2018 results
Corporate loan disbursements
yoy growth, %
SME loan book
yoy% growth
Corporate fees
Accounting
yoy% growth
New production rating
2018 production vs. stock
• Established a uniform Corporate & Investment Banking platform
• Reorganized the Large Groups structure, intensifying coverage
• Revamped our Structured Finance unit, covering the full spectrum of
services
• Created a mid-caps segment, offering premium coverage for mid-sized
companies
• Created a Business Development unit, enhancing business intelligence
capabilities
Corporate
Bank
reorganisation
• Led the majority of large structured finance transactions (>€100MM),
capturing sponsor-led investment activity
• Improved profitability by offering niche product / service capabilities in
large groups and mid-caps
• Increased penetration in SMEs for second consecutive year, targeting
export-oriented firms and domestic consolidators
• Expanded presence in traditional mid-sized Greek shipping companies
segment
Strategic focus
Improvement in
avg. risk rating
+4%
2 notches
+~70%
+7%
Corporate loan book
yoy% growth
Corporate fees
Cash basis
yoy% growth
+12%
BOOST REVENUE GENERATION – CORPORATE

52© National Bank of Greece
Investor Presentation – May 2019
Initiatives launched alongside favourable market conditions provide a solid foundation for growth
Market business loans growth1
yoy delta, gross loans, €BN
• Broader recovery expected for SMEs as domestic demand improves
• Growth in International Trade activities for businesses
• Significant sectoral growth potential in infrastructure, energy,
transportation & logistics, pharma and hospitality
Focus per segment
202020182017
-0.8
2019 2021 2022
0.3
3.44.4 4.7 4.8
Large
groups
• Maximise share of wallet and cross-sell focusing
on profitability
Structured
finance
• €2BN credit expansion pipeline identified for
2019-2022 with high degree of conversion
expected
Mid-caps• Selectively expand by offering tailor-made
solutions and premium coverage
SME • Tap into SME market growth
Shipping
• Grow in mid-sized shipping companies
segment, taking advantage of the void left by
international banks
Corporate market evolution drivers
Import-export growth
yoy growth, %
2017 20222018
6.9
2020
3.3
2019
7.4
2021
2.9
8.8
4.7 5.33.8 4.6 3.7 4.1
2.9
ExportsImports
Source : ELSTAT & Focus Economics Consensus forecasts
Source: Bank of Greece, NBG economic office analysis
Source: NBG Economic Research
1. Including Small Businesses (legal entities) and NPEs; excluding shipping and adjusting for write-offs
BOOST REVENUE GENERATION – CORPORATE

53© National Bank of Greece
Investor Presentation – May 2019
Through our transformation journey we will focus more on how to maximise value for our clients and our shareholders
• Refocus corporate coverage teams from credit underwriting to sales
• Grow business with our product partners’ support
• Leverage business intelligence capabilities to effectively manage portfolio
A. Value-driven
client coverage
• Reduce time-to-money through fast credit processes
• Offer premium services through corporate branches
• Enhance digital channels
B. Service
excellence
BOOST REVENUE GENERATION – CORPORATE

54© National Bank of Greece
Investor Presentation – May 2019
A. Strengthen value-driven client coverage
• Reduce RM administrative work load, simplifying credit process and
developing middle office capabilities
• Re-define frontline team roles, shifting focus from credit underwriting to
relationship management
• Provide advanced client planning tools to enhance RM productivity
• Strengthen dedicated product specialist teams to effectively support client
coverage
• Set common targets and incentives with RMs at product level per segment
• Launch targeted product campaigns
• Capitalize on business intelligence toolkit to effectively steer the business
• Enhance and expand the use of EVA and pricing models in commercial
strategy
• Embed advanced analytics capabilities to optimise SME portfolio management
Cross-sell ratio1
BI Toolkit
• New Corporate CRM
• Referral platform
• New EVA and pricing tools
• Commissions platform
• Next best product and churn prediction
models
Grow business
with our product
partners
Refocus
corporate
coverage teams
Redeploy effort
and manage
performance
RM time spent on client facing activities
1. Number of products per Corporate client
BOOST REVENUE GENERATION – CORPORATE
3
2018 2022
~5
<30%
>60%
2018 2022

55© National Bank of Greece
Investor Presentation – May 2019
B. Achieve service excellence
• Streamline credit approval process by reducing application burden, leveraging
on available technology options
• Centralise and automate middle and back office activities
• Corporate branch model offering local service in areas with significant business
presence
• Offer premium services through dedicated corporate teams across the
country
• Introduce new online “self-service” functionalities
• Migrate transaction volume from physical to digital channels
Corporate network
# of locations with dedicated personnel
New self-service functionalities
• e-factoring & invoicing
• e-trade
• Online legalisation
• Online revolving line usage
• API capabilities
Corporate
branches
Faster credit
processes
Enhanced
digital
channels
Fast track credit application
BOOST REVENUE GENERATION – CORPORATE
5
2018 2019
~30
35% of cases
Perimeter
Reduction in
process time
~30%

56© National Bank of Greece
Investor Presentation – May 2019
Interest income expansion and fee growth targeted over 4 years
Corporate loan disbursements1
Bank, €BN
Corporate fee income targets
Bank, €MM
~3.0
2017 2018
~1.5
2022
~2.6
+~70%+15%
• Structured Finance pipeline and large deals in large groups will
support credit expansion
• While significant contribution from higher margin/ recurring business
in 2020-22 (SMEs, Midcaps) as corporate banking platform is enhanced
• Core lending fee growth driven by new origination and large
structured finance deals
• Ancillary fees growth leveraging new coverage/ service model for
corporate & SMEs, account planning tools and target-setting at RM
level
59
85
21
35
2022
Core lending3
2018
Ancillary products
and services2
80
~120
+50%421 ~670PE gross interest
income, €MM
1. Excluding revolving line roll-overs | 2. Including Investment banking, Import/ export, trade finance, cash management etc. | 3. Core lending fees include loans, guarantees; exclude factoring
BOOST REVENUE GENERATION – CORPORATE

57© National Bank of Greece
Investor Presentation – May 2019
AGENDA
Introduction Costas Michaelides | Chairman
Strategic objectives 2019–2022Pavlos Mylonas | Chief Executive Officer
Financial targets
Clean-up the balance sheet Fotini Ioannou | Head of Troubled Assets Group
Boost revenue generationChristina Theofilidi | Head of Retail Banking
Vassilis Karamouzis | AGM Corporate & Investment Banking
Enablers: people, technology, processesEvi Hatzioannou | Head of Human Resources
Stratos Molyviatis | Chief Information Officer
Ethniki180: Transformation Program Ernestos Panayiotou | Chief Transformation Officer
Q&A
58© National Bank of Greece
Investor Presentation – May 2019
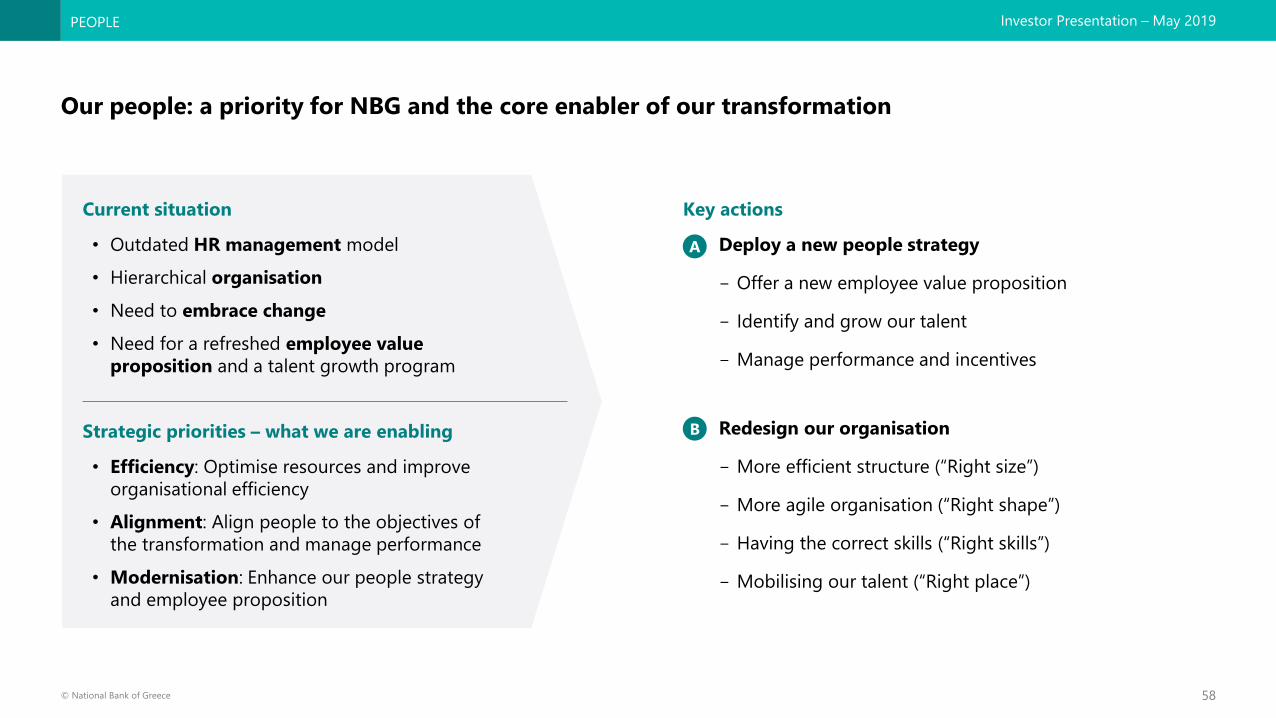
Our people: a priority for NBG and the core enabler of our transformation
Key actions
Deploy a new people strategy
- Offer a new employee value proposition
- Identify and grow our talent
- Manage performance and incentives
Redesign our organisation
- More efficient structure (“Right size”)
- More agile organisation (“Right shape”)
- Having the correct skills (“Right skills”)
- Mobilising our talent (“Right place”)
A
B
• Outdated HR management model
• Hierarchical organisation
• Need to embrace change
• Need for a refreshed employee value
proposition and a talent growth program
Current situation
• Efficiency: Optimise resources and improve
organisational efficiency
• Alignment: Align people to the objectives of
the transformation and manage performance
• Modernisation: Enhance our people strategy
and employee proposition
Strategic priorities – what we are enabling
PEOPLE

59© National Bank of Greece
Investor Presentation – May 2019
We are modernising and upgrading our people strategy
Manage performance and incentives
• Develop a strong performance management model based on:
- Balanced scorecards to measure specific targets
- Competency-based model to measure behaviours
• Link employee compensation model with performance
Identify and grow our talent
• Launch a talent management program to identify high
performers
• Deploy new career paths and training programs to
develop our talent
Modernise our employee value proposition
• A new employee proposition based on agreed key
attributes: trustworthy, meritocratic and fair
PEOPLE STRATEGY
Compensation
and benefits
Talent Development
Employee
value
proposition
Performance
management
A
PEOPLE
60© National Bank of Greece
Investor Presentation – May 2019
Right
shape
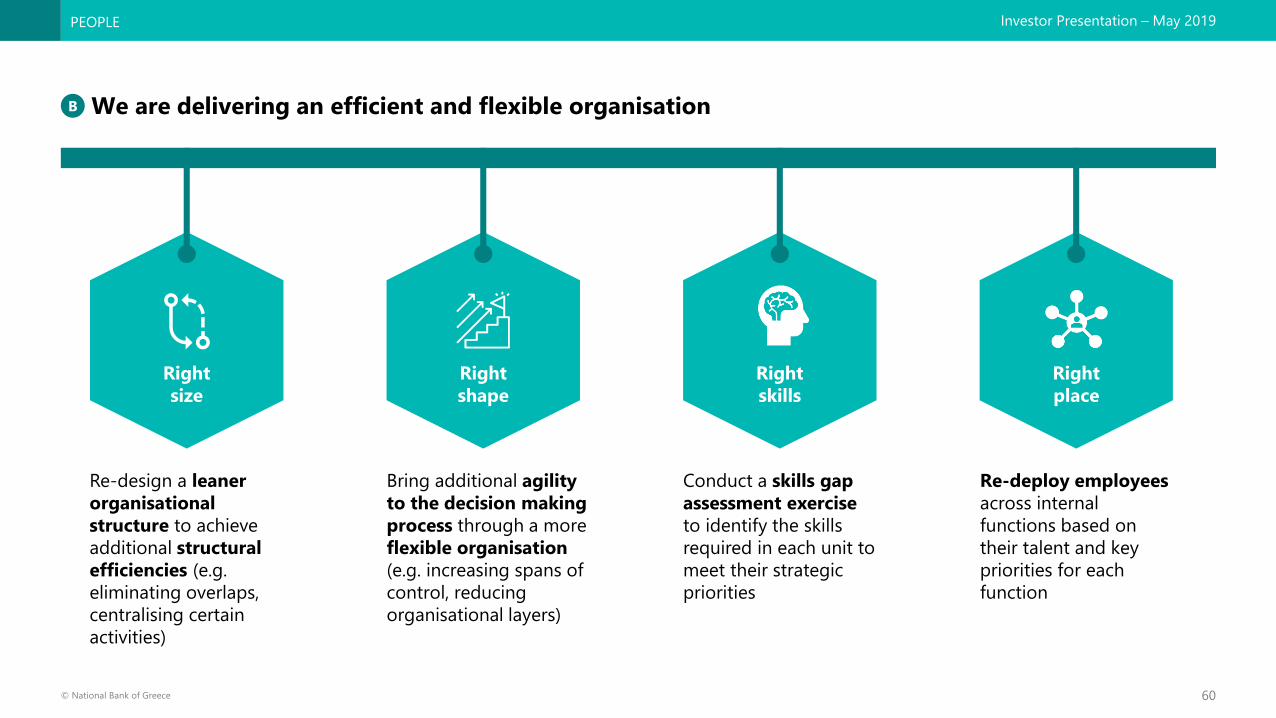
We are delivering an efficient and flexible organisation
Re-design a leaner
organisational
structure to achieve
additional structural
efficiencies (e.g.
eliminating overlaps,
centralising certain
activities)
Bring additional agility
to the decision making
process through a more
flexible organisation
(e.g. increasing spans of
control, reducing
organisational layers)
B
Conduct a skills gap
assessment exercise
to identify the skills
required in each unit to
meet their strategic
priorities
Right
size
Right
skills
Right
place
Re-deploy employees
across internal
functions based on
their talent and key
priorities for each
function
PEOPLE

61© National Bank of Greece
Investor Presentation – May 2019
AGENDA
Introduction Costas Michaelides | Chairman
Strategic objectives 2019–2022Pavlos Mylonas | Chief Executive Officer
Financial targets
Clean-up the balance sheet Fotini Ioannou | Head of Troubled Assets Group
Boost revenue generationChristina Theofilidi | Head of Retail Banking
Vassilis Karamouzis | AGM Corporate & Investment Banking
Enablers: people, technology, processesEvi Hatzioannou | Head of Human Resources
Stratos Molyviatis | Chief Information Officer
Ethniki180: Transformation Program Ernestos Panayiotou | Chief Transformation Officer
Q&A

62© National Bank of Greece
Investor Presentation – May 2019
Simplify, consolidate &
strengthen IT landscapeDigitise products and services
1
Focus on core
banking renewal
3
Introduce new technologies
and innovate
42
1 Focus on digital distribution
channels1 Streamline the back
end engine1 Extended deployment of RPAs
for back and front office1 Cost reduction through
consolidation of assets
2 Rich and simple
customer interaction2 Decrease Time-to-Market for
new products & services 2 Introduce AI &
machine learning
2 Revamped architecture
with smaller footprint
3 Integration with 3rd parties for
a new market place creation3 Lower future TCO 3 Self service management for
business intelligence and
analytics
3 Opportunities for outsourcing
and cloud deployments
4 Strengthened security
Enriched customer experience
Security and Regulatory Compliance
Data insightSimplification
IT strategy is built around four pillars serving transformation objectives
TECHNOLOGY & PROCESSES

63© National Bank of Greece
Investor Presentation – May 2019
IT evolution milestones
Total IT Capex related to transformation initiatives estimated at ~€170MM1, increasing Capex dedicated
to change from ~30% to ~50% of total
TECHNOLOGY & PROCESSES
Transformation journey Continuous evolution
2019
• Renewed mobile/internet banking
• New card management system
• Enterprise data warehouse full deployment
• Robotic process automation for back office
2020
• Enhanced branch and CRM platform
• Omni-channel architecture for digital
• Core banking renewal initiation
2023
• Fully deployed digital IT architecture
2021
• Data analytics and big data for business
• AI and machine learning deployment
• Hybrid cloud model
3
4
2 1
3
31
1. Capex up to 2023 including full Core Banking system renewal

64© National Bank of Greece
Investor Presentation – May 2019
Increased capacity
requirements from
transformation initiatives
Necessity to optimise
cost of IT platform
1
2
3yr targetCurrent state
Application development
Infrastructure operations
Operations in-house/outsourced
Flexible delivery model to optimise costs over a 3-year period
Requirements from business evolution Transition towards a flexible delivery model
10-15%
productivity gain
~€5MM annual saving1
40%
60%NBG
External
NBG
75%
External
25%
95%
NBG
Cloud
5%
75%
NBG
Cloud
25%
External
30%
70%
NBG90% NBG
10%
External
Flexible delivery model to deliver ~€20MM total annual savings from 2020, reallocated to Transformation
~€15MM annual saving1
TECHNOLOGY & PROCESSES
1. Targeted annual cost savings achieved from 2020 onwards

65© National Bank of Greece
Investor Presentation – May 2019
“Simplify the retail
restructuring
process”
• Centralised and automated loan administration (RPAs)
• New restructuring channels and tools
• Reduce process time by ~80%
• Achieve >50% FTE efficiency gain on back office
activities
• Increase applications from alternative channels
“Enable corporate
growth”
• Centralized loan administration
• Digital corporate lending capabilities
• Standardised credit approval documentation
• Credit process automations (incl. workflow system)
• Reduce process time by ~20% for loan admin
• Achieve ~45% FTE efficiency gain for loan
admin
“Improve customer
experience”
• Faster and simpler process from mortgage application
to disbursement
• Centralised and automated loan administration
• Digital lending capabilities
• Reduce process time by ~50%
• Achieve ~20% FTE efficiency gain
Retail NPL
restructuring
Corporate
lending
Retail
lending
Process optimization under way changing how we work and serve our clients
Process Targets
Target is to deliver 250+ FTE efficiency gains (equivalent to €13MM+ p.a.) by 2021
TECHNOLOGY & PROCESSES
Actions

66© National Bank of Greece
Investor Presentation – May 2019
AGENDA
Introduction Costas Michaelides | Chairman
Strategic objectives 2019–2022Pavlos Mylonas | Chief Executive Officer
Financial targets
Clean-up the balance sheet Fotini Ioannou | Head of Troubled Assets Group
Boost revenue generationChristina Theofilidi | Head of Retail Banking
Vassilis Karamouzis | AGM Corporate & Investment Banking
Enablers: people, technology, processesEvi Hatzioannou | Head of Human Resources
Stratos Molyviatis | Chief Information Officer
Ethniki180: Transformation Program Ernestos Panayiotou | Chief Transformation Officer
Q&A

67© National Bank of Greece
Investor Presentation – May 2019
We have launched a unique transformation program that is focused on delivery
Clear program structure and governance
• 6 workstreams led by ExCo members
• 20+ initiatives and 100+ sub-initiatives all led by line managers
• Transformation Program Office with 20+ specialist managers
Broad engagement and transparency
• Initiatives developed bottom-up, with full involvement of the
organisation
• 50+ managers going through leadership development program
• 500+ colleagues actively involved in delivery
Strong cadence and execution discipline
• Weekly CEO updates on priority topics
• Bi-weekly steering by Transformation Committee
• Monthly oversight by Board Strategy Committee
PURPOSE, VALUES, STRATEGY
CLEAN-UP
THE BALANCE SHEETENHANCE EFFICIENCY
& AGILITY
BOOST REVENUE
GENERATION
MOBILISE OUR PEOPLE IMPROVE VISIBILITY &
CONTROL
UPGRADE TECHNOLOGY
INFRASTRUCTURE
DELIVERY ENGINE

68© National Bank of Greece
Investor Presentation – May 2019
The program is on track to deliver impact in the first months; ~90% of objectives for Season 2 are expected
to be achieved
Our focus is on ensuring a disciplined and programmatic new way of working
Objectives
Objectives (KPIs and
milestones by initiative)
validated
bottom-up
Enablers
Full alignment with IT, HR
and communications; cross-
functional teams
Scoring
“Score” for each initiative;
transformation part of
executives’ scorecards
Seasons
6-month periods with
specific objectives;
“Ceremony” at the end of
each Season
1
5
9
2
6
10
3
7
11
4
8
12

69© National Bank of Greece
Investor Presentation – May 2019
AGENDA
Introduction Costas Michaelides | Chairman
Strategic objectives 2019–2022Pavlos Mylonas | Chief Executive Officer
Financial targets
Clean-up the balance sheet Fotini Ioannou | Head of Troubled Assets Group
Boost revenue generationChristina Theofilidi | Head of Retail Banking
Vassilis Karamouzis | AGM Corporate & Investment Banking
Enablers: people, technology, processesEvi Hatzioannou | Head of Human Resources
Stratos Molyviatis | Chief Information Officer
Ethniki180: Transformation Program Ernestos Panayiotou | Chief Transformation Officer
Q&A