Embed Size (px)
Citation preview

Investments in Auditing and the Quality of Financial Reporting
Jeff Coulton Australian School of Business
University of New South Wales
Gilad Livne University of Exeter Business School
Angela Pettinicchio Bocconi University
Stephen Taylor*
UTS Business School University of Technology-Sydney
February 2014
* Contact Author: School of Accounting University of Technology, Sydney Broadway NSW 2007 Australia [email protected]. This research was supported by the Accounting and Audit Quality Research Program funded by the Capital Markets Co-Operative Research Centre (Capital Markets CRC Ltd) established by the Federal Government of Australia. We appreciate the comments of Sasson Bar-Yosef, Dan Daliwahl, Neil Fargher, Jere Francis, Clive Lennox as well as suggestions from workshop participants at the 2012 Bocconi/EAA Audit Symposium, the 2012 Singapore Management University Symposium, the 2012 Australian National University Audit Symposium, the 2013 University of Technology-Sydney Summer Accounting Conference and the 2013 American Accounting Association Audit Section Conference.

Investments in Auditing and the Quality of Financial Reporting
Abstract
We provide evidence of how client firms’ investment in auditing (measured as excess audit
fees over an extended period) is associated with improved quality of financial reporting. In
contrast to prior research where the association between audit fees and accounting quality has
been measured year-by-year, we argue that the impact of investments in audit quality should
be evident where such investments are sustained. Our results strongly support this view.
Firms with sustained investment in auditing report more conservatively, and are less likely to
suffer outcomes which are inconsistent with higher quality financial reporting. In contrast,
firms where audit fees are unusually high in a single year are more likely to have lower
quality financial reporting. Our results are consistent with firms making an investment in the
audit process to maintain higher accounting quality (i.e., the investment in auditing and
financial reporting quality are compliments). The evidence we provide also gives weight to
the view that prior evidence linking audit fees with measures of accounting quality has
overlooked multi-period effects of either audit effort or auditor independence effects.
Key Words: Audit fees, accounting quality, multi-period

1
1. Introduction
We provide initial evidence on the extent to which sustained investments in auditing are
associated with higher quality financial reporting. Although auditing is a statutory
requirement and is subject to significant regulation, there is extensive evidence consistent
with auditing being a differentiated product, whereby clients are expected to choose varying
levels of investment in auditing. However, there is only limited evidence of direct
investments in auditing being associated with higher quality financial reporting. One reason
for this is the failure of prior research to identify instances of sustained investments in
auditing. While prior research treats each annual observation of audit fees as independent
from those of prior (and subsequent) years, we argue that investments in auditing are most
likely reflected in the extent to which client firms consistently pay higher than expected audit
fees. Hence, we expect that if investments in auditing result in higher quality financial
reporting, that this will be mostly reflected in firms which pa long-run excess fees.
Following Watts and Zimmerman (1986) we expect that firms commit to auditing to
varying extents. One such mechanism is by the choice of a high quality auditor (DeAngelo
1981). However, even among auditors who are high quality we observe significant variation
in audit fees, and this is consistent with varying levels of client firm commitment to the
quality of financial reporting. We expect that such variation is much more likely to be
reflected in multi-period, as distinct from single period audit fee behavior, and we therefore
focus on the association between a multi-period fee-based measure of audit quality
(“consistency of excess fees”) and measures of accounting quality. Although there is an
extensive literature examining the association between audit fee-based measures and
indicators of accounting quality (Francis 2011, Dechow et al. 2010), almost all such studies
typically treat measures of abnormal audit fees as being independent from one period to the
next. In contrast, we explicitly recognize the implications for fee-based measures of audit

2
quality that arise from the extent to which audit fees are not negotiated separately each year,
and hence are somewhat “sticky”.1 We argue that the extent to which fees are relatively high
or low in a single period masks clients’ underlying investment in audit quality. Moreover, we
show that the strength of the link between reporting quality and single period measures of
abnormal audit fees changes once long-term investment in audit is controlled for. Hence we
believe that researchers that are interested in investigating the implications of annual fee
measures for reporting quality need to control for long-term investment in audit quality to
enhance the reliability of their research design.
Although many factors might influence audit fee variation in a single year, consistent
firm-specific patterns of audit fees measured over longer periods likely reflect the extent to
which client firms make conscious investments in audit quality. We therefore predict that a
measure of “consistently excess” fees should reflect a client firm’s commitment to higher
verification standards (Ball et al. 2012) and hence, be positively related to the quality of the
client firm’s financial reporting (i.e., accounting quality). Our prediction directly contradicts
the view that relatively high fees paid to auditors are likely to constitute a bribe that results in
less independent audits and hence, lower quality financial reporting.
In contrast to prior studies which examine the link between audit fees and accounting
quality, we explicitly include both longer-term and single-year measures of audit fees. Our
results strongly support our prediction. Using a number of measures typical of studies which
examine links between fee-based measures and accounting quality (e.g., total accruals and
unexpected accruals) we show that single-year measures of excess fees are often negatively
associated with contemporaneous measures of accounting quality. However, when we extend
the analysis to recognize the extent to which excess fees are consistently high (or low), we
1 Evidence of audit fee stickiness is provided by Ferguson et al. (2011) for UK and Australian firms, and by de Villiers et al. (2012) for US firms).

3
observe consistent evidence of a positive association between this multi-period fee measure
and measures of accounting quality.
Because lower (i.e., more negative) measures of accruals can be indicative of more
conservative reporting, we also directly address the association between investments in
auditing and reporting conservatism by extending the approach in Basu (1997) to include the
impact of both yearly and long run measures of excess audit fees. We find evidence that
higher excess audit fees are associated with significantly less conservative reporting. In
contrast, when long run excess audit fees are included, we find that our measure of longer
term investment in auditing is associated with significantly more conservative reporting. This
result extends to an alternative measure of conservatism based on changes in accounting
income rather than the relations between earnings and returns.
As there is no single reliable measure of accounting quality, we further extend our
analysis to several ex-post (i.e., non-accrual) measures of accounting quality, including
restatements owing to accounting problems, restatements owing to frauds, disclosures of
material weaknesses in internal controls, and issuance of an SEC comment letter.
Consistently high unexpected fees are associated with a significantly lower probability of
events typically associated with lower quality financial reporting. In contrast, abnormally
high fees for a single period are associated with a higher probability of events that are
indicative of lower reporting quality. These tests provide substantial validation to tests that
rely on accrual-type measures of accounting quality (Francis 2011).
Our results are also robust to extensive additional analysis, including additional
measures of unexpected accruals and conservatism; the extension of the fee measure to
include fees paid to the auditor for other services; alternative definitions of unusually high
and low audit fees including procedures designed to reduce the extent of overlapping periods
for the measurement of investments in auditing; and the use of propensity-score matching

4
procedures designed to address the possible endogeneity of audit fees and accounting quality
measures.
Overall we characterize our results as strongly supportive of the view that consistently
high (low) fees are associated with higher (lower) accounting quality. This, in turn, supports
the view that persistent high fees reflect an investment in financial reporting verification,
client commitment to openness to scrutiny and hence, higher quality reporting. These results
directly contradict the argument that auditors who repeatedly receive high fees are likely to
have their independence compromised and, as a result, allow lower quality financial
reporting. Put simply, from the perspective of reporting quality, consistently high fees are
good, and consistently low fees are bad. Finally, our results confirm that, after controlling for
longer-run trends, an unusually high fee in a given year is likely to be associated with lower
quality reporting in that year, consistent with the notion that auditors react to new, but yet
unresolved, accounting problems by increasing audit effort (Hribar et al. 2010).
Our paper contributes to several strands of the accounting and audit literature. The
first explores whether fees paid to auditors constitute an economic bond between auditors and
their clients. Critics of the accounting profession argue that high fees, especially over
extended periods, result in impaired auditor independence, and hence lower quality auditing
and therefore, lower quality financial reporting (Becker et al. 1998). While such arguments
have often been specifically applied to certain types of fees, such as those for non-audit
services (see Frankel et al. 2002), there is also a more general argument which is also often
used to support calls for mandatory audit firm rotation (Myers et al. 2003). We highlight a
contrasting explanation, namely that sustained abnormally high audit fees reflect a conscious
investment in financial statement verification and in the external audit process. Our evidence
uniformly supports this view, and calls into question the validity of concerns suggesting high
fees likely reflect some form of “bribe” (Kinney and Libby 2002). The evidence we provide

5
shows that, rather than indicating a threat to audit quality (via reduced independence),
sustained higher fees are associated with higher quality accounting.
A second contribution reflects the fact that there is already an extensive literature
linking audit fees with measures of contemporaneous accounting quality.2 However, this
literature has yielded mixed results, with some studies finding evidence of a positive relation
between audit fees and measures of accounting quality while others finding the reverse. For
example, Choi et al. (2010), Gul et al. (2003), Asthana and Boone (2012) and Hribar et al.
(2010) all find that abnormal audit fees are negatively associated with accounting quality,
while Blankley et al. (2012), Ball et al. (2012) and Lobo and Zhao (2013) report evidence to
the contrary. However, these studies all follow the standard practice of treating audit fees as
an independent annual observation. Given the use of multi-year audit contracts and empirical
evidence of audit fee stickiness (Ferguson et al. 2011), we argue that empirical methods used
to examine the link between fees and accounting quality should more fully reflect the basis
on which the auditor-client relationship is contracted. An obvious implication is that annual
fee observations cannot be viewed in isolation from the “typical” abnormal fee for that client.
We show that there are direct implications for empirical tests of the audit fee – accounting
quality relationship and this can be extended to other fee-based tests of audit quality.3
Finally, our research contributes to the understanding of potential observable proxies
for accounting quality, which itself is ultimately a function of several unobservable attributes
(e.g., internal controls) and actions (e.g., managerial intervention in the reporting process).
Common proxies for audit quality include measures of audit firm size (e.g., Big N) as well as
industry specialization or market leadership.4 These proxies reflect the assumption that audit
quality is increasing in both the competence and independence of the auditor (DeAngelo,
2 Dechow et al. (2010) and Knechel et al. (2012) summarize many of these studies. Francis (2011) also makes a number of comments about limitations of this research. 3 One such example would be the relation between audit fees and audit qualifications (DeFond et al., 2002). 4 Knechel et al. (2012) provide a detailed summary of these measures.

6
1981). More generally, it is accepted that auditor effort or effectiveness should be associated
with improved financial reporting quality. However, direct measures of auditor effort such as
audit hours and their composition across seniority are not typically available, and the
incentives which auditors face to provide a high quality audit are likewise not directly
observable. With the introduction in 2000 of mandatory audit fee disclosures by US firms,
there is now a widely available potential proxy for auditor effort. Recently, Hribar et al
(2010) suggest that unexpected audit fees are a potential proxy for accounting quality.
However, they find only weak correlations between measures of unexpected audit fees and
the most popular measures of accounting quality. While some instances of abnormally high
fees will reflect client firms with consistently high audit fees, others will more likely reflect a
one-off instance of high fees, which in turn are most likely to reflect those instances of a
sudden, unexpected increase in auditor effort to address problems that have been uncovered.
We expect that the weak results reported by Hribar et al. (2010) reflect the failure to
distinguish between these two types of observations. Our empirical evidence supports this
contention.
The remainder of our paper proceeds as follows. In section 2 we review prior research
examining the relationship between fees paid to the auditor and accounting quality. We
contrast alternative explanations of abnormal audit fees, and provide a brief outline of why
tests examining the relation between audit fees and accounting quality must include both
single and multi-period measures of unusual audit fees. Section 3 explains the research
design, including our examination of accrual-linked properties typically used as proxies for
accounting quality as well as several events (such as restatements) which are also assumed to
reflect lower quality financial reporting. Section 4 outlines the data and sample construction
procedures. The results are outlined in section 5, along with robustness analysis. Section 6

7
concludes and identifies a number of potential research opportunities which arise from
recognition that the auditor-client firm relationship occurs over multiple periods.
2. Background and hypothesis
2.1 Prior literature
There are competing views about the way in which the magnitude of fees paid by a client is
associated with audit quality, and any resulting variation in accounting quality (i.e., the
quality of the audited financial report). For example, regulators (e.g., Levitt 2000) and
various commentators have raised the concern that large fees create an economic bond
between auditor and client and that this bond compromises auditor independence and results
in reduced financial reporting quality (the “bribe” hypothesis)5. Prior to the Sarbanes-Oxley
Act of 2002 (SOX), there was a particular focus on fees for non-audit services (NAS) due to
the increase in level of NAS fees relative to audit fees in the late 1990s and the higher
profitability of NAS work relative to audit. However, the literature furnishes only mixed
evidence. Ashbaugh et al. (2003) and Chung and Kallapur (2003) fail to find evidence of a
positive association between fees and abnormal accruals, while Larcker and Richardson
(2004) and Srinidhi and Gul (2007) find evidence suggesting a negative association. Antle et
al. (2006) simultaneously model the determinants of audit fees, NAS and abnormal accruals
and find that non-audit fees decrease abnormal accruals, which they attribute to the
productive effects of non-audit services. They also find evidence that audit fees increase
abnormal accruals, consistent with behavioral theories of unconscious influence or bias in the
auditor-client relation. Ruddock et al. (2006) do not find that high abnormal fees, and in
particular relatively high NAS fees, result in a reduction in the extent of timely loss
recognition in earnings.
5 See for example Zeff (2003)

8
Non-accrual measures such as earnings restatements and the likelihood of receiving a
going concern audit modification and disclosures of material weaknesses have also been used
to assess the extent of variation in audit quality. Kinney et al. (2004) do not find a positive
association between NAS fees and the incidence of restatements. Reynolds and Francis
(2001) use audit office-level analysis and find that larger clients are more likely to receive
going concern modifications, report more conservatively and have lower accruals. DeFond et
al. (2002) find no significant association between NAS fees and lower auditors' propensity to
issue going concern audit opinions. Chen et al. (2010) examine the effect of client importance
in China (as measured by the client’s relative size) and find that the likelihood of issuing
going concern modifications is negatively correlated with client importance. Audit fees have
been found to be unusually high for firms that disclose an internal control deficiency under
both section 302 and section 404 of SOX, indicating that auditors can increase testing to
reduce the impact of poor controls (Hogan and Wilkins 2008; Raghunandan and Rama 2006).
Apart from studies motivated by specific elements of audit fees (such as NAS fees)
there are also a number of studies which examine the broader link between audit fees and
reporting quality. Asthana and Boone (2012) find that accounting quality (measured as
absolute discretionary accruals or by meeting or beating analysts’ earnings forecasts) declines
as negative abnormal audit fees become larger (i.e., as unexpected audit fees become
increasingly low). In contrast, Blankley et al. (2012) find that abnormal audit fees are
negatively associated with the likelihood that financial statements are restated, a result which
suggests that higher audit fees are likely to result in higher quality reporting. Choi et al
(2010) find that the association between audit fees and the magnitude of absolute unexpected
accruals is asymmetric. When audit fees are unexpectedly low, they find no evidence of a
statistically significant relationship. However, when unexpected audit fees are positive, Choi
et al. find that higher audit fees are positively associated with absolute unexpected accruals,

9
consistent with lower quality accounting. Finally, Gul et al. (2003) examine a small sample of
Australian firms for a single year and find that the absolute value of discretionary accruals
increases with audit fees.
Ball et al. (2012) examine the link between unexpected audit fees and voluntary
disclosure, arguing that higher unexpected audit fees reflect a costly signaling mechanism
indicating higher investment in financial statement verification (i.e., higher audit quality).
They interpret the positive relation between unexpected audit fees and the probability of
issuing a management earnings forecast as evidence consistent with a “confirmation”
hypothesis. We expect that this should also be reflected in a positive relationship between
accounting quality and the (long-run) investment in financial statement verification (i.e.,
consistently high unexpected fees).
In an examination restricted to financial restatements (one of several proxies for the
realized effects of audit quality that we examine), Lobo and Zhang (2013) argue that the
results reported by Hribar et al. (2010) are subject to two sources of upward bias. First,
endogenous audit effort reflects the fact that misstatement risk increases both the audit effort
(reflected in higher fees) as well as the likelihood of misstatement. Second, the co-mingling
of quarterly restatements (which are from unaudited accounts) with annual restatements
(which reflect audited accounts) violates the assumption that financial reports are always
issued after the audit is completed. Using procedures designed to correct for these two
sources of identified bias, but notably still assuming that unexpected audit fees are
independent from year-to-year, Lobo and Zhao show that higher audit fees are associated
with a lower probability of annual report restatements.
In contrast to the argument that high audit fees reflect a deliberate investment in
verification, Kinney and Libby (2002, p. 109) argue that abnormal fees “may more accurately
be likened to attempted bribes” and can better capture economic rents associated with audit

10
services or an auditor’s economic bond to a client than normal fees or actual fees. In contrast,
Higgs and Skantz (2006) argue that abnormally high fees can represent higher audit effort
than expected, not a bribe. Consistent with this, they find evidence supporting that the
earnings response coefficient is higher for firms with positive abnormal fees than for those
with negative abnormal fees.
Importantly, all these studies use a single-year measure of both fees and outcomes
(accruals, restatements, audit opinions, investor perception of reporting quality). Yet there is
evidence that audit fees are strongly correlated over time. Ferguson et al. (2011) show that
audit fees are relatively sticky, suggesting that firms with a relatively high audit fee in period
t are likely to also be classified as having a high audit fee in period t+1.6 However, relative to
the large number of studies linking some measure of audit fees with attributes of financial
reporting, there are very few studies that attempt to extend the simple cross-sectional
approach whereby each year is treated as an independent observation. One exception is Hope
and Langli (2010) who use both levels and changes specifications in examining the impact of
fees on the propensity of auditors to issue going concern modifications. Other exceptions are
Chen et al. (2011) and Ettredge et al. (2011), both of which show a decline in accounting
quality following fee reductions during the global financial crisis.
The second relevant strand of the literature is concerned with the effects of long-term
relationships between auditors and clients on reporting quality. Prior research has found that
short auditor tenure is associated with poorer reporting quality (Johnson et al., 2002) and that
there are more audit reporting failures in the earlier years of the auditor-client relationships
(Geiger and Raghunandan, 2002), suggesting long-term relationships are beneficial. Myers et
al. (2003) report evidence that longer audit firm tenure results in greater restrictions of
extreme management decisions; however, Chen et al. (2010) fail to document qualitatively
6 Further evidence of audit fee stickiness is provided by de Villiers et al. (2012).

11
similar relations using a Taiwanese sample. Carey and Simnett (2006) examine the impact of
partner tenure on various measures of earnings quality using 1995 data. While they find that
long tenure observations are associated with a lower propensity to issue a going-concern
opinion they do not find evidence of a positive association between long tenure and abnormal
working capital accruals. Stanley and DeZoort (2007) find that restatements are more likely
in the early years of auditor tenure, suggesting that a lack of client-specific knowledge or
pressure to retain and profit from new clients could undermine audit quality. In summary, the
evidence on the effect of long-term relationships on reporting quality is mixed. Furthermore,
the literature to-date has largely not examined how accounting-based measures of reporting
quality triangulate with other (non-accounting) measures of reporting quality, and how both
are linked to long-term as well as short-term fee measures.
2.2 Hypothesis
Overall, it is evident that the relation between the magnitude of annual fees paid to the
auditor and various proxies for accounting quality (either measured concurrently such as
unexpected accruals or audit qualifications, or as evident in subsequent actions such as SEC
actions) is best described as mixed. Some studies argue that high audit fees are indicative of a
bribe, while others argue that a high fee is indicative of greater effort. In turn, there are
studies which argue that high audit effort should reflect contemporaneous higher accounting
quality (e.g., Caramanis and Lennox, 2011), while others report a negative contemporaneous
relationship and argue this is consistent with higher effort occurring concurrently with lower
quality accounting (Hribar et al., 2010).7
7 In contrast to other studies we have reviewed, Hribar et al. (2010) argue that excess audit fees are a measure of accounting (as distinct from audit) quality. However, they find only weak correlation with other measures of accounting quality, which we view as consistent with the potential mismeasurement of audit quality associated with treating each individual firm year as a relatively independent observation.

12
While the precise measure of fees and the measures of accounting quality vary across
the studies we have reviewed above, they reflect a common approach whereby each firm-year
is treated as an independent observation.8 However, as audit fees are not set independently
from year to year, then measures of high (or low) fees likewise cannot be viewed as
independent from year to year. The assumption that the quality of audited financial reporting
is a joint product of management representations and the audit process, where the impact of
the audit process reflects, in part, auditor effort, seems relatively uncontroversial. We also
assume auditor effort (measured consistently over several periods) to be positively correlated
with fees paid to the auditor. Where auditor effort is consistently high (low), we therefore
expect to observe higher (lower) accounting quality. Although high audit fees are sometimes
characterized as a bribe (Kinney and Libby 2002), we doubt that such behavior is sustainable
over several periods. This is because repeated combination of low accounting quality and
high fees would considerably amplify the likelihood of scrutiny, litigation loss of reputation.
Hence, we expect that a measure of unusual fees paid to the auditor which is based on
multiple period observations (i.e., fees that are consistently high or low) to yield different
results than single year fee measures in explaining variation in accounting quality.
Formally stated, we test the following research question:
RQ1: When the relative magnitude of fees paid to the auditor is measured over multiple
periods, is there a positive relation between the magnitude of the long-term fee and
accounting quality?
Once long-term investment in audit quality is controlled for, higher annual fees are
more likely to capture either a bribe or a year-specific audit problem. Similarly, lower annual 8 We acknowledge that it is common for studies to use econometric procedures which control for various forms of correlation in the data. However, we know of no study which explicitly recognizes the implications of evidence that audit fees are relatively sticky.

13
fees likely capture a simple(r) year to audit with both auditors and clients agreeing to report
conservatively. Hence our second research question is:
RQ2: Controlling for the level of long-term fees, is the association between annual fees and
accounting quality negative?
3. Research design
3.1 The fee model
Our primary measures of audit quality are based on abnormal, or unexpected audit fees. We
first estimate the following fee model:
1 2 3 4 5 6 7 8
9 10 11 12 13 14 15
16 17 18 19 20 21 22
_ +
LAF LTA FOREIGN ROA ARINV LOSS BIG DEC LEV
SWITCH SEG CFO CRAT MRET GROWTH MA
RISK LAG ACC FIL LIT DISC EMPL SPEC
(1)
This model is estimated annually at the Fama and French 12 industry classification level
(based on 4 digit code). The dependent variable, LAF, is the natural logarithm of audit fees.
This model is based on the notion that normal audit fee (as given by the regression line)
corresponds to normal audit effort. The regression residual, in turn, may represent the excess
fee that could reduce auditor independence, and therefore reduce audit quality. This has been
the convention in the literature to-date. However, it may also correspond to higher (or lower)
than normal investment in audit processes and technology, particularly over our multi-period
windows. With this in mind, persistent excess fees is viewed as indicative of heightened
investment in accounting quality, whereas constant fee deficiency suggests weaker audit
process involving, inter-alia, impaired client-specific knowledge and client evasiveness with
provision of information. Note the use of audit fees (as opposed to total fees), as the

14
dependent variable. We believe that, following strict limitations on the provision of non-audit
services set forth by the Sarbanes-Oxley Act, it is appropriate to focus on audit fees.9
Consistent with much of prior literature (e.g., Ashbaugh et al, 2003; Hay et al., 2006), the set
of explanatory variables proxy for audit-task complexity, client risk, and auditor-related
characteristics. The log of total assets, LTA, captures the relation between client size and fees
EMPL is the square root of the number of employees (from Compustat) and proxies for
complexity (Livne et al., 2013). Because the geographical spread of the client’s operations
indicates greater business complexity, we include FOREIGN which is an indicator variable
that is equal to one, if the firm pays tax overseas, zero otherwise. High levels of receivables
and inventory require more effort on part of the auditor. To capture this we use ARINV, which
is the sum of inventory and receivables deflated by beginning total assets. SEG is the number
of business segments reported by the client firm. Demand for additional audit work is proxied
by the presence of M&A activity. Specifically, MA is an indicator variable coded one, if there
has been a merger transaction during the year, and zero otherwise.
It has been demonstrated that client risk affects the fees paid to the auditor (Simunic
1980; Newton and Ashton 1989; Hay et al., 2006). We therefore include LOSS as an indicator
variable set equal to one if the firm reports a loss in the year and zero otherwise; ROA is
return on assets defined as earnings before extraordinary items deflated by beginning total
assets; LEV is defined as the sum of long term debt and current debt, deflated by total assets.
We also control for stock return volatility (RISK) (LaFond and Watts, 2008); MRET, the
firm’s fiscal year stock return (Burks, 2010); CFO, operating cash flows divided by total
assets; GROWTH, computed as the percentage change in revenues from year t-1 to year t;
LIT, a dummy variable equal to 1 if the firm is included in an industry identified by previous
literature as more exposed to litigation risks (Francis et al., 2004; Kim and Skinner, 2012.);
9 We repeat all of our analyses using total fees, and report results in our sensitivity tests (section 5.3).
15
and DISC, a dummy variable equal to 1 if extraordinary items exceed 1% of pre-tax income,
0 otherwise (Livne et al., 2013). We also take into consideration a set of auditor-related
variables. BIG is a dummy variable coded one if the auditor is one of the Big-4 audit firm and
zero otherwise, to take into consideration fee premia paid to the largest international audit
firms (Palmrose, 1986: Francis, 1984); SWITCH controls for any low-balling effect when the
auditor is new (Butterworth and Houghton, 1995) and is an indicator variable set equal to one
if there has been an auditor change during the year, zero otherwise SPEC. DEC is included in
the model to control, and proxy, for audit assignment congestion and it is an indicator
variable set equal to one if the company closes financial statement in December and zero
otherwise; LAG is the number of days between fiscal year end and earnings announcement
date and it is included as an indication of the efficiency of an audit: a longer delay is likely to
indicate problems during the audit process (Hay et al., 2006); finally, we include ACC_FIL, a
dummy variable set equal to one if the firm is an accelerated filer and zero otherwise, is
included because the requirement for auditor’s attestation of these clients’ internal controls
has considerably increased audit fees (Iliev, 2010).
3.2 Ranks of annual and long-term abnormal fees
The residual from equation (1) is a firm-year measure of abnormal fee. We then rank these
cross-sectional residuals by industry-year whereby the lowest 10% observations by abnormal
fees are classified as the lowest annual rank category (YRANK = 1) and the highest 10% are
classified as the highest annual rank category (YRANK = 10). That is, YRANK is our one year
firm-specific abnormal fee variable. For each client-auditor pair we calculate the average
annual abnormal fee rank over a rolling five-year window (WRANK). For example
WRANK2004 is the average of the five annual ranks from 2000 through 2004. Note that the
values for WRANK are not discrete as they can range continuously from 1 to 10. The use of

16
ranks mitigates the problem of measurement error in the fee model and also identifies more
clearly the relative magnitude of unexpected fees.
3.3 Accounting-based measures of reporting quality
Our first accounting-based measure of reporting quality is based on unexpected current
accruals and controls for firm performance, following Ashbaugh et al. (2003) and Kothari et
al. (2005). We first estimate the regression coefficients from the following model:
1 2 3 11
1t t t
t
CA Sales ROATA
(2)
where current accruals (CA), is net income before extraordinary items plus depreciation and
amortization less operating cash flows, scaled by beginning of year total assets (TA). We then
employ the coefficient estimates to measure expected current accruals (ECA), controlling for
performance:
1 2 3 11
1ˆ ˆ ˆ[ ]t tt
ECA Sales AR ROATA
(3)
where AR is accounts receivable. Our first measure of accounting quality, abnormal current
accruals, REDCA, is calculated as the difference between actual and expected current
accruals (i.e., CA less ECA). We employ signed (rather than absolute) values of REDCA, as
signed measures, to capture discretionary inflation or deflation in earnings.
The second measure follows from McNichols (2002), who adapts the model outlined
by Dechow and Dichev (2002) and is based on the relation between total accruals, TACC, and
past, present and future cash flows as well as change in revenues, ∆REV, scaled by beginning
total assets and the balance of property plant and equipment (PPE), also scaled by beginning
total assets. Total accruals is measured as earnings before extraordinary items less cash flow

17
from operations, CFO, scaled by beginning total assets.10 Specifically, we estimate the
following model:
1 1 2 3 1 4 5t t t t t t tTACC CFO CFO CFO REV PPE (4)
The residual from this regression is our second measure of abnormal accruals (RESCFO).
Again, we use the signed value in our subsequent tests. For completeness, we also use a third
measure for reporting quality which is the signed value of current accruals deflated by total
assets (CATA).
To summarize, we have a number of accrual-based measures of reporting quality
(RQ). To assess the association between measures of financial reporting quality and our
single and multi-period fee measures (YRANK and WRANK respectively) we employ this
regression model:
1 2 3 4 5
6 7 8 9 10 11 12 + +
RQ YRANK WRANK BIG LCA LNMVE
MA CFF LEV MB LIT LOSS CFO
(5)
where RQ = (REDCA, RESCFO or TACC).
In selecting control variables we follow prior literature (e.g., Ashbaugh et al., 2003;
Myers et al., 2003; Becker et al. 1998; Burgstahler and Dichev, 1997; Dechow et al., 1995),
while, at the same time attempting to keep these models relatively parsimonious. We include
auditor size (BIG), lagged current accruals (LCA), natural log of market value of equity
(LNMVE), an indicator for merger and acquisition activity (MA), the extent of external
financing, as captured by financing cash flows (CFF), leverage (LEV), a litigation variable
that is based on industry membership,11 a current-year loss indicator (LOSS) and operating
cash flows (CFO). Finally, to control for effect of growth on abnormal accruals, we include
the ratio of market to book value of equity (MB), consistent with McNichols (2000).12
10 TACC differs from CA in that it includes depreciation and amortization expense. 11 High-litigation industries are industries with SIC codes of 2833-2836, 3570-3577, 3600-3675, 5200-5961, and 7370. 12 Detailed variable definitions for all regression models are provided in Table 1.

18
Since we are interested in whether the use of a long-term abnormal fee measure has a
different association with financial reporting quality than a single year fee measure, our focus
in equation (5) is on the coefficients on both YRANK and WRANK.
3.4 Non-accrual measures of reporting quality
Although a large number of studies examine the link between accounting quality and audit
fees using regressions of accrual measures on fee measures (like our equation (5)), Francis
(2011) points out that such accounting-based measures may not reflect reporting quality. He
argues that cross-sectional variation in measures commonly used to capture earnings
management does not necessarily mean that earnings are in any way “misstated” if these
firms actually have expected values located in the extreme ends of the distribution. We
therefore extend our analysis by examining several potential measures of reporting quality
which are assessed independently from accrual-based measures.
Financial statements are subject to the scrutiny of auditors and regulators, such as the
SEC and PCAOB. To provide external validity as to the (possibly opposing) roles of our
short-term and long-term fee measures, we explore the association of YRANK and WRANK
with the incidence of external events that indicate poor accounting. These external indicators
of reporting quality (RQ_E) include: restatements due to accounting problems (RES_ACCT);
restatements due to frauds (RES-FRAUD), disclosures of material weaknesses in internal
control; issuance of a comment letter by the SEC (SEC_LET). Finally, we also use client
statements of material weakness of internal controls (MW), as a non-accrual based measure of
reporting quality.
We estimate a probit model with an indicator dependent variable that is equal to one if
there is an event indicating poor reporting quality and zero otherwise. Specifically, we use
RES_ACCT, RES-FRAUD, SEC_LET, and MW as indicator variables for restatements owing
19
to accounting problems, restatements owing to frauds, issuance of a comment letter by the
SEC, and disclosures of material weakness of the internal control respectively. The model
takes the following form:
1 2 3 4 5
6 7 8 9 10 11
12 13 14 15 16
( _ 1)Prob RQ E YRANK WRANK ARDECA SPRAT BIG
LNMVE MA CFO LEV ARINV LTA
LIT MB SALEVOL PROP NORAT
17 EPS
(6)
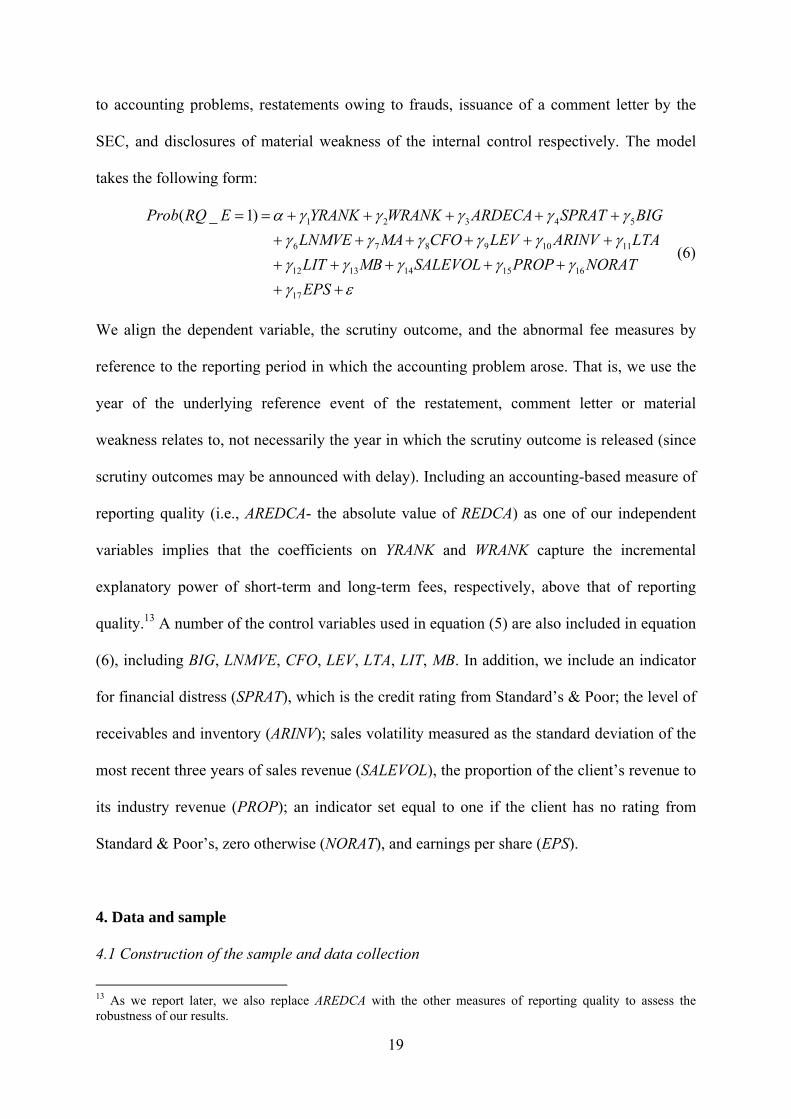
We align the dependent variable, the scrutiny outcome, and the abnormal fee measures by
reference to the reporting period in which the accounting problem arose. That is, we use the
year of the underlying reference event of the restatement, comment letter or material
weakness relates to, not necessarily the year in which the scrutiny outcome is released (since
scrutiny outcomes may be announced with delay). Including an accounting-based measure of
reporting quality (i.e., AREDCA- the absolute value of REDCA) as one of our independent
variables implies that the coefficients on YRANK and WRANK capture the incremental
explanatory power of short-term and long-term fees, respectively, above that of reporting
quality.13 A number of the control variables used in equation (5) are also included in equation
(6), including BIG, LNMVE, CFO, LEV, LTA, LIT, MB. In addition, we include an indicator
for financial distress (SPRAT), which is the credit rating from Standard’s & Poor; the level of
receivables and inventory (ARINV); sales volatility measured as the standard deviation of the
most recent three years of sales revenue (SALEVOL), the proportion of the client’s revenue to
its industry revenue (PROP); an indicator set equal to one if the client has no rating from
Standard & Poor’s, zero otherwise (NORAT), and earnings per share (EPS).
4. Data and sample
4.1 Construction of the sample and data collection
13 As we report later, we also replace AREDCA with the other measures of reporting quality to assess the robustness of our results.

20
We collect all data available from Audit Analytics (AA) from 2001-2012. We then match the
AA data with financial information on Compustat, resulting in an initial sample of 90,872
firm-year observations. We eliminate firm-year observations with total assets less than $1
million, leading to a sample of 78,813 firm-year observations. We also exclude all
observations that lack sufficient information to estimating the total fees model (leaving us
with 30,216 firm-year observations). The computation of our earnings quality and external
quality variables further reduces our sample from a minimum of 16,249 to a maximum of
19,563 firm-year observations (depending on the quality measure used).
To obtain our single-period and multi-period fee measures we estimate equation (1)
by industry-year. Descriptive statistics for the fee model variables are presented in Panel A of
Table 2. Mean (median) audit fee is $1,552,000 ($689,000), suggesting skewness in the fee
data (untabulated). However, the log-transformed figures are not skewed. Note that about
86% of observations used in the fee model are audited by a Big 4 auditor and that about 35%
of observations are loss years. Panel B of Table 2 presents the results of estimating our fee
models annually and for the pooled sample. Consistent with prior studies, most of the
explanatory variables are highly significant across all years. In particular, in the pooled
regression we find that audit fees are positively related to firm size (LTA, 0.43), foreign
activity (FOREIGN, 0.36), the level of task complexity as captured by accounts receivables
and inventory (ARINV, 0.37), number of business segments (SEG, 0.04) and number of
employees (EMPL, 0.03). In addition, we find that large and specialized auditors command
higher fees, as is seen from the coefficients on BIG (0.34) and SPEC (0.06). The R2 in the
pooled model is 80% and compares favorably to previous studies (e.g., Ashbaugh et al, 2003;
Ruddock et al. 2006; Amir et al; 2010). The R2 in the annual estimations varies from 76% to
88%.
21
4.2 Descriptive statistics
Panel A of Table 3 provides the descriptive statistics for variables used in our primary tests.
The number of observations varies with data availability for each dependent variable as we
utilize all available observations for a given measure of financial reporting quality. Recall
that we assign unexpected fees (i.e., the residuals from estimating the fee model) to deciles,
where YRANK = 1 if the unexpected annual fee falls in the bottom decile (i.e., the lowest
level of unexpected fees) and YRANK = 10 if the unexpected fee falls in the highest decile.
Our long-term fee measure, WRANK, is based on the average YRANK values over the most
recent five-year window. Note that while YRANK is a discrete measure (i.e., the integers from
1 to 10), WRANK is a continuous variable also ranging from 1 to 10. The requirement of
measuring WRANK over five years means that not all the observations for YRANK can be
used given that we require both YRANK and a matching WRANK in our tests. The earliest
WRANK is obtained for the five year window ending in 2004. The average of the single-
period fee rank is 5.5, equal to its theoretical level of 5.5 while the mean multi-period rank is
5.53.
Mean signed abnormal accrual measures are positive in all cases (REDCA, RESCFO
and CATA), though the median is negative in one case (RESCFO). This indicates that for our
pooled sample earnings are generally inflated (notwithstanding EPS is negative, on average).
Of our external measures of reporting quality, about two fifths of firm-years (6,613
observations) receive a comment letter from the SEC, about seven percent (1,303
observations) make an accounting-related restatement, but only 0.2% (33 observations) make
a fraud-related restatement. The incidence of material weakness reports is six percent (1,049
observations). More than half of the observations are involved with loss, which is consistent
with average EPS being negative.

22
Panel B of Table 3 reports the sample composition by industry membership, using the
Fama-French classification. The largest industry in the sample is the Business Equipment
with 5,021 observations. The smallest industry is Consumer Durables with 594 observations.
This reflects the relative industry size in the Compustat dataset.
Pairwise correlation coefficients for selected variables are shown in Panel C of Table
3. The accounting-based measures of reporting quality are positively and strongly correlated.
Though the coefficients are below one, this suggests that the three measures capture
phenomenon similar underlying construct. However, the correlation between the fee
measures and abnormal accruals measures are relatively small. YRANK and WRANK are
positively correlated, consistent with there being a considerable level of stickiness in total
unexpected fees.
5. Results
5.1 Main findings
Our first set of tests measures the impact of single-period and multi-period abnormal fee
rankings on earnings-based measures of accounting quality. Table 4 reports results of
estimating equation (5) using the three signed accrual measures as dependent variables. For
each dependent variable we first provide the results with only YRANK and then for both
YRANK and WRANK. The first specification is the traditional approach taken in the literature
which employs a single year fee measure. The second allows us to infer whether combining
the two fee measures leads to different inferences for each. For models using each of the
three dependent variables in the first specification, the coefficient on YRANK is positive and
highly significant, except for when CATA is the dependent variable. This indicates that higher

23
abnormal annual fees are associated with poorer accounting quality.14 However, since annual
fees are positively correlated with long-term fees, one might interpret this as evidence that
abnormally high fees generically lead to poorer reporting quality. This is ruled out once
WRANK is added. We find consistent evidence across all three dependent variables that the
coefficient on WRANK is negative and significant while the coefficient on YRANK is positive
and highly significant. In light of the high correlation between the two fee measures we also
verify using the VIF test procedure these results are not influenced by a high level of
multicolinearity. Hence, we conclude that consistent investment in audit is positively related
to accounting quality. Note also that, relative to the regressions featuring YRANK only, the
coefficient on YRANK retains its positive sign but is now larger and more highly significant
for all models. This suggests that the negative association between annual fees and
accounting quality is more evident once long-term fees are controlled for. Many of the
control variables are also statistically significant, which is consistent with the models being
well specified.
Overall, these results are consistent with the argument in Ball et al. (2012) that
relatively high fees represent an investment (i.e., a credible commitment) in high quality
reporting. However, this is evident only from a measure which best reflects such a conscious
investment decision, namely a multi-year measure of how consistently a client firm pays a
relatively high fee. Conversely, firms that have consistently lower fees relative to
expectations appear to have relatively poor reporting quality. On the other hand, a simple
single-year measure of excess fees yields quite a different result, which we interpret as being
consistent with audit firm increasing effort in instances where firms report more aggressively,
have lower quality financial reporting, or face an audit problem. The results highlight the
14 This is broadly in consistent with prior studies that conclude that annual fees paid to auditors are not associated with lower accounting quality (e.g., Ashbaugh et al., 2003; Chung and Kallapur, 2003; Larcker and Richardson 2004).

24
importance of considering multi-year fee behavior in attempting to devise tests of the extent
to which higher than expected fees reflect a deliberate investment in improved reporting
quality rather than a bribe to facilitate lower quality financial reporting via reduced auditor
independence.
5.2 Tests using external measures of accounting quality
To provide external validity to these inferences, we employ the probit model (i.e., equation
(6)) where the dependent variable is the occurrence of an external scrutiny event indicating
poor reporting quality. Recall we use four such indicators; namely the issuance of a comment
letter by the SEC (where SEC_LET = 1), restatements owing to accounting problems
(RES_ACC = 1), restatements owing to frauds (RES_FRAUD = 1), and disclosures of
material weakness of the internal control (MW = 1).
The results of this analysis are reported in Table 5. The structure of Table 5 is similar
to that of Table 4 in that for each event we first include only YRANK, and then add WRANK.
Inspecting all four models where YRANK is the only fee variable, we find that the coefficient
on YRANK is positive in all models and highly significant in all models but one (SEC_LET)
where the significance level is six percent. This corroborates the evidence presented in Table
4 that accounting quality is negatively related to abnormal annual fees. When WRANK is
added, the coefficient on YRANK remains positive, but increases in magnitude. Significance
levels are also higher, except for fraud-related restatements (probably owing to low number
of observations). In contrast to YRANK, WRANK is negatively related to the incidence of
accounting restatements and material weaknesses.
In summary, the results reported in Table 5 indicate that abnormal high annual fees
are positively associated with events indicating poor accounting quality, especially when
WRANK is included in the model. Importantly, we present evidence that consistently high

25
abnormal fees are not positively associated with events indicating poor reporting quality.
Crucially, the evidence reported in Table 5 is inconsistent with the view that high annual fees
represent greater audit effort that is sufficient to eliminate poor accounting quality. This table
thus reinforces the conclusion drawn from Table 4 that consistently high abnormal fees are
unlikely to represent a form of bribe and are more likely to correspond to the level of audit
effort.
5.3 Additional tests
We perform a number of additional analyses to ensure the robustness of our results. These
relate to the fee measure (i.e., using total fees instead of audit fees), the extent of overlapping
windows for measuring long-run abnormal fees, and alternative accounting-based measures
of reporting quality in tests of the relation between abnormal audit fees and the occurrence of
external events consistent with poor reporting quality (i.e., those events for results reported in
Table 5).15
Recall that for the calculation of WRANK we use rolling five-year windows.
Therefore, there is a substantial overlap between WRANKt and WRANKt+1, raising a concern
about auto-correlation. To mitigate this concern we re-measure WRANK using shorter
windows of four and three years. While doing so reduces the problem of independence,
shortening the measurement period also reduces the effectiveness of WRANK in capturing
long-term investment in auditing because WRANK shifts closer to YRANK. Nevertheless, we
find qualitatively similar results with shorter periods for WRANK.
Next, we use propensity score matching approach to mitigate against the possibility
that our “experiment” does not control sufficiently well for non-randomness in the sample
(Rosenbaum and Rubin, 1983). Consequently, we first match the top 25% of YRANK
15 For brevity we do not tabulate all of these analyses. Full details are available from the authors.

26
observations with the bottom 25%. The propensity score procedure used is the “nearest
neighbor” procedure conditioning on firm size, leverage, industry and year. We then run the
OLS regression models as in our main analyses on this matched sample, replicating Tables 4
and 5, where both YRANK and WRANK are included. The results of this analysis are largely
consistent with the previous findings for the full sample.
We then repeat the above procedure with the matching applied to WRANK,
controlling for size, leverage, industry membership and year. Again, our findings remain
qualitatively similar.
We also employ the timeliness of loss recognition as an alternative measure of
accounting quality (Basu, 1997). If repeated investment in audit quality allows auditors to
identify loss events in a more timely fashion, we would expect WRANK to be positively
associated with timely loss recognition. In contrast, if abnormal annual fees represent a form
of a bribe, or alternatively, an unresolved accounting issue concerning loss recognition, we
would expect YRANK to be negatively related to the speed of loss recognition. To test these
conjectures, we augment the Basu (1997) model as follows:
1 2 3
4 5 6 7
8 9 10 11
12 13 14 15 16
*
* * * *
* * * *
+
EPS RET DRET RET DRET
YRANK YRANK RET YRANK DRET YRANK RET DRET
WRANK WRANK RET WRANK DRET WRANK RET DRET
LCA LNMVE MA BIG LE
17 18V MB LIT (7)
Here, EPS is earnings per share, scaled by beginning stock price; RET is the annual stock
return, measured over the fiscal year and DRET is an indicator variable set equal 1 if RET <
0, zero otherwise. To control for other factors that may affect accounting conservatism we
include of a number of controls (LCA, LNMVE, MA, BIG, LEV, MB, and LIT), as previously
defined.16 The main coefficients of interest are β7 and β11, where a positive (negative)
16 For a similar approach see, for example, Roychowdhury and Watts (2007), Khan and Watts (2009), Hui et al. (2012) and Ramalingegowda and Yu (2012).

27
coefficient is interpreted as evidence consistent with stronger (weaker) association between
conservative accounting and YRANK and WRANK, respectively.
The results of this model are presented in Table 6. As before, we first estimate the
model with only YRANK. Here, the coefficient on YRANK*RET*DRET is negative and highly
significant, suggesting that high annual audit fee is associated with slower loss recognition. When
WRANK is added to the regression model, this association becomes more pronounced. Specifically,
the coefficient on YRANK*RET*DRET is now larger in magnitude (i.e., more negative), with a
higher statistical significance. Moreover, the coefficient on WRANK*RET*DRET is positive and
significant. This suggests that a commitment to investment in high quality auditing improves
conservative reporting.
As for the other variables, the coefficient on RET*DRET is positive and highly significant in
both models, consistent with the findings of Basu (1997) and supporting the presence of accounting
conservatism, as manifested in timely loss recognition. The coefficient on lagged current accruals
(LCA) is positive, consistent with the notion of larger reported earnings in firms with high levels of
opening current accruals. The coefficients on auditor size (BIG), leverage (LEV) and litigation risk
(LIT) are negative and highly significant, indicating that EPS is lower in client firms that are audited
by one of the Big-4 auditors, in highly leveraged firms and in firms more exposed to litigation risk.
In summary, the findings of Table 6, are consistent with and reinforce the previous
conclusions. Conservative reporting is negatively related to abnormal annual fees, but is positively
related to abnormal long-term fees. This suggests that annual fees and long-term fees represent two
distinct auditing phenomena, whereby long-term fees capturing the degree of commitment to audit
quality and verification process.
6. Summary and conclusions
We provide what we believe is the first documented evidence of an association between fees
paid to the auditor and measures of accounting quality which explicitly recognizes that client
firms’ investment in auditing is not independent from one period to the next. In contrast to
prior studies, we argue that evidence of audit fee “stickiness” suggests that any fee-based

28
measure of audit quality should also reflect a multi-period perspective. While studies based
on single-period fee has provided conflicting evidence on the extent to which higher fees are
associated with accounting quality, we argue that the measurement of unexpected fees over
multiple periods (i.e., are fees consistently high or consistently low) is more likely to reliably
identify those instances where there is a conscious investment in more (or less) auditing. We
also argue that the relation between measures of accounting quality and measures of
unexpected audit fees on a single period basis are best interpreted when such tests also
control for the longer-term pattern of fees.
Our results are consistent with our prediction. While single year measures of excess
fees are negatively associated with various measures for accounting quality, we observe the
opposite for our multi-period fee-based measure. This result extends beyond accrual-based
measures of accounting quality to include several non-accrual measures of accounting quality
including restatements, SEC actions, and disclosure of internal control weaknesses. These
results therefore strongly support the contention that consistently unusually high (low) fees
are associated with higher (lower) accounting quality. Our results are also incongruent with
the view that consistently high fees reflect some form of sustained (as distinct from
temporary) bribe that encourages the auditor to be less independent and therefore to provide
lower (rather than higher) audit quality.
Our evidence that sustained investments in auditing are positively associated with
accounting quality also suggests several research opportunities. For example, how do such
relationships adjust to reflect significant regulatory changes which increase (or decrease) the
statutory demand for auditing? What happens when firms change auditors? Does so-called
low balling on initial engagements significantly disrupt the relationship between fees and
accounting quality? Does extant single period evidence of the complementarity of auditing
and other (non-accounting) disclosure quality measures hold when auditing investment is

29
measured from a multi-period perspective? These are just some examples of how a multi-
period perspective on fees paid to auditors can potentially create new research opportunities.

30
References:
Amir, E., Y, Guan and G. Livne (2010). Auditor independence and the cost of capital before and after Sarbanes–Oxley: the case of newly issued public debt. European Accounting Review 19(4): 633-664.
Antle, R., E. Gordon, G. Narayanamoorthy and L. Zhou (2006). The joint determination of audit fees, non-audit fees, and abnormal accruals. Review of Quantitative Finance and Accounting 27: 235-266.
Ashbaugh H., R. LaFond, and B.W. Mayhew (2003). Do non-audit services compromise auditor independence? Further Evidence. The Accounting Review. 78(3): 611-693.
Asthana, S. and J. Boone. 2012. Abnormal audit fee and audit quality. Working paper, University of Texas at San Antonio.
Ball, R., S. Jayaraman and L. Shivakumar. 2012. Audited financial reporting and voluntary disclosure as complements: A test of the confirmation hypothesis. Journal of Accounting and Economics 53(1): 136-166.
Becker, C., M. DeFond, J.Jiambalvo, and K.R. Subramanyam (1998) The effect of audit quality on earnings management. Contemporary Accounting Research 15(1): 1-24.
Blankley, A., D. Hurtt and J. McGregor. 2012. Abnormal audit fees and restatements. Auditing: A Journal of Practice and Theory 31 (1): 79-96.
Butterworth, S. and K. Houghton (1995). Auditor switching: the pricing of audit services Journal of Business Finance and Accounting 22(3): 323-344.
Burgstahler D. and I. Dichev. 1997. Earnings management to avoid earnings decreases and losses. Journal of Accounting and Economics (24) 1:99–126.
Caramanis, C. and C. Lennox. 2011. Audit effort and earnings management. Journal of Accounting and Economics 45 (1): 116-138.
Carey, P., and R. Simnett (2006) Audit partner tenure and audit quality. The Accounting Review 81(3): 653-676.
Chen, L., G. Krishnan and W. Yu. 2011. Did audit fee cuts in the global financial crisis impair earnings quality? Working paper, George Mason University.
Chen, S., S. Sun and D. Wu (2010). Client importance, institutional improvements, and audit quality in China: an office and individual auditor level analysis. The Accounting Review 85(1): 127-158.
Choi, J. J. Kim and Y. Zang. 2010. Do abnormally high audit fees impair audit quality? Auditing: A Journal of Practice &Theory 29(2): 115-140.
Chung, H. S., and S. Kallapur. 2003. Client importance, nonaudit services, and abnormal accruals. The Accounting Review 78 (4): 931–955.

31
DeAngelo, L. 1981. Auditor size and auditor quality. Journal of Accounting and Economics 3(2): 183-199.
Dechow, P. and I. Dichev. 2002. The quality of accruals and earnings: The role of accrual estimation errors. The Accounting Review 77 (Supp.): 35-59.
Dechow, P., W. Ge and C. Schrand. 2010. Understanding earnings quality: A review of the proxies, their determinants and their consequences. Journal of Accounting and Economics 50 (2): 344-401.
Dechow, P., R. Sloan, and A. Sweeney. 1995. Detecting earnings management. The Accounting Review 70 (2): 193-225.
DeFond, M., K. Raghunandan, and K. Subramanyam. 2002. Do non-audit service fees impair auditor independence? Evidence from going-concern audit opinions. Journal of Accounting Research 40: 1247–74.
De Villiers, C. Hay, D., C. and J. Zhang (2012). Audit fee stickiness, Working Paper, University of Auckland.
Ettredge, M., C. Li and E. Emeigh. 2011. Fee pressure and audit quality. Working paper available at http://papers.ssrn.com/sol3/papers.cfm?abstract_id=1903860.
Ferguson, A., C. Lennox and S.L. Taylor. 2011. Are audit fees sticky? Evidence and implications. Working paper, University of Technology-Sydney.
Francis, J. 1984. The effect of audit firm size on audit prices: A study of the Australian market Journal of Accounting and Economics 6(2): 133–151.
Francis, J. 2011. A framework for understanding and researching audit quality. Auditing: A Journal of Practice and Theory 30 (2): 125-152.
Francis, J., and B. Ke. 2006. Disclosure of fees paid to auditors and the market valuation of earnings surprises. Review of Accounting Studies 11(4): 495-523.
Frankel, R., M. Johnson and K. Nelson. 2002. The relationship between auditors’ fees for nonaudit services and earnings management. The Accounting Review 77 (Supplement): 71-105.
Geiger, M., and K. Raghunandan. 2002. Auditor tenure and audit reporting failures. Auditing: A Journal of Practice and Theory 21(1): 67-78.
Ghosh, A., and D. Moon. 2005. Does audit tenure impair audit quality? The Accounting Review 80(2): 585-612.
Gul, F., C. Chen and J. Tsui. 2003. Discretionary accounting accruals, managers incentives and audit fees. Contemporary Accounting Research 20(3): 441-464.
Hay, D., R. Knechel and N. Wong. 2006. Audit fees: a meta-analysis of the effect of supply and demand attributes. Contemporary Accounting Research 23(1): 141-191.

32
Higgs, J. L., and T. R. Skantz. 2006. Audit and nonaudit fees and the market’s reaction to earnings announcements. Auditing: A Journal of Practice & Theory 25(1): 1–26.
Hogan, C., and M. Wilkins. 2008. Evidence on the audit risk model: Do auditors increase audit fees in the presence of internal control deficiencies? Contemporary Accounting Research 25(1): 219-242.
Hope, O. and J. Langli. 2010. Auditor independence in a private firm and low litigation risk setting. The Accounting Review 85(2): 573-605.
Hribar, P., T. Kravet, and R. Wilson. 2010. A new measure of accounting quality. Working paper, The University of Iowa, University of Texas at Dallas.
Hribar, P. and D Nichols. 2007. The use of unsigned earnings quality measures in tests of earnings management. Journal of Accounting Research 45(5) 1017-1053.
Hui, K. W., S. Klasa, and E. Yeung. 2012. Corporate suppliers and customers and accounting conservatism. Journal of Accounting and Economics 53: 115–135.
Johnson, V.E., I. K. Khurana and J. K Reynolds. 2002. Audit-firm tenure and the quality of financial reports. Contemporary Accounting Research 19(4): 637-660.
Kinney, W. R. and R. Libby. 2002. Discussion of the relation between auditors’ fees for non audit services and earnings management. The Accounting Review 77(Supplement): 107-114.
Kinney, W.R., Z.V.Palmrose and S.Scholz. 2004. Auditor independence, non-audit services, and restatements: Was the U.S. government right? Journal of Accounting Research 42(3):561-588
Khan, M., and R. Watts. 2009. Estimation and empirical properties of a firm-year measure of accounting conservatism. Journal of Accounting and Economics 48 (2-3): 321–339.
Knechel, W. R., G. V. Krsihnan, M. Pevzner, L. Shefchik and U. Velury. 2012. Audit quality indicators: insights from the academic literature. Working paper, available at http://papers.ssrn.com/abstract=2040754.
Kothari, S., A. Leone and C. Wasley. 2005. Performance matched discretionary accrual measures. Journal of Accounting and Economics 39(1): 163-197.
Krishnan, J, H. Sami and Y. Zhang. 2005. Does the provision of nonaudit services affect investor perceptions of auditor independence? Auditing: A Journal of Practice and Theory 24(2): 111-135.
Larcker, D.F., and S. A. Richardson. 2004. Fees paid to audit firms, accrual choices and corporate governance, Journal of Accounting Research 42 (3): 625-658.
Levitt, A. 2000. Renewing the covenant with investors. Speech at The New York University Center for Law and Business, New York, May 10, 2000.

33
Lobo, G., and Y. Zhao. 2013. Relation between audit effort and financial report misstatements: Evidence from quarterly and annual restatements. The Accounting Review 88 (4): 1385-1412. McNichols. M. 2000. Research design issues in earnings management studies. Journal of Accounting and Public Policy, 19, pp. 313-345. McNichols, M. 2002. Discussion of ‘The quality of accruals and earnings: The role of accrual estimation errors’. The Accounting Review 77 (Supp.): 61-69. Myers, J., L. Myers and T. Omer. 2003. Exploring the term of the auditor-client relationship and the quality of earnings: a case for mandatory auditor rotation? The Accounting Review 78(3): 779-799. Newton, J. D., and R. H. Ashton. 1989. The association between audit technology and audit delay. Auditing: A Journal of Practice & Theory 8 (Supplement): 22-37. Palmrose, Z-V. 1986. The effect of nonaudit services on the pricing of audit services: further evidence. Journal of Accounting Research 24(2): 405-411.
Raghunandan, K., and D. Rama. 2006. SOX Section 404 material weakness disclosures and audit fees. Auditing: A Journal of Practice & Theory 25(1): 99-114.
Ramalingegowda, S., and Y. Yu. 2012. Institutional ownership and conservatism. Journal of Accounting and Economics 53: 98–114.
Reynolds, J. K., and J. Francis. 2001. Does size matter? The influence of large clients on office level auditor reporting decisions" Journal of Accounting and Economics 30 (3): 375-400.
Rosenbaum, P. R. and D. B. Rubin. 1983. The central role of the propensity score in observational studies for causal effects. Biometrika 70(1): 41–55. Roychowdhury, S., and R.L. Watts. 2007. Asymmetric timeliness of earnings, market-to-book and conservatism in financial reporting. Journal of Accounting and Economics 44:2–31.
Ruddock, C., S.J. Taylor, and S.L. Taylor. 2006. Nonaudit services and earnings conservatism: is auditor independence impaired? Contemporary Accounting Research, 23, pp. 701–746.
Simunic, D. 1980. The pricing of audit services: theory and evidence. Journal of Accounting Research 18: 161-190.
Srinidhi B. N., and Gul F. A. 2007. The differential effects of auditors' nonaudit and audit fees on accrual quality. Contemporary Accounting Research 24: 595–629.
Stanley, J. D. and T. F. DeZoort. 2007. Audit firm tenure and financial restatements: An analysis of industry specialization and fee effects. Journal of Accounting and Public Policy 26 (2): 131-156.

34
Watts. R.L. and J. L. Zimmerman. 1986. Positive accounting theory. Prentice-Hall.
Zeff, S. A., 2003. How the U.S. accounting profession got where it is today: Part II, Accounting Horizons 17: 267-286

35
TABLE 1 Variable definitions
Panel A: Audit Fee model Variable Definition LAF Natural logarithm of audit fees (Audit Analytics (AA) mnemonic: audit
fees) in year t. (Winsorized at the 1% level) LTA Natural logarithm of total assets (Compustat mnemonic: at) in year t.
(Winsorized at the 1% level) FOREIGN Dummy variable coded “1” if company paid taxes abroad (txfo) in year
t, zero otherwise ROA Earnings before extraordinary items (ib)/start of year total assets (at) ARINV Sum of inventory and receivables (rectr+invt)/start of year total assets LOSS Dummy variable coded “1” if the company experienced a loss in year t,
zero otherwise BIG Dummy variable coded “1” if the auditor is a big 4/5/6 audit firm, zero
otherwise DEC Dummy variable coded “1” if the company closes financial statement in
December, zero otherwise LEV [Long term debt (dltt) + current debt (dlc)]/total assets SWITCH Dummy variable coded “1” if the company changed auditor during year
t, zero otherwise SEG Number of business segments (segments section in Compustat) CFO Cash flow from operation activities CRAT Current Ratio, as measured by Current Assets (act) divided by Current
Liabilities (lct) RET The return for the firm’s stock over the Fiscal Year, as reported by
CRSP (ret) GROWTH The percentage change in sales (sale) from year t-1 to year t. MA Dummy variable coded “1” if there has been an merger transaction in
year t, zero otherwise (compst) RISK The standard deviation of monthly return (as reported by CRSP, ret) for the
past 36 months LAG The number of days between fiscal year end and earnings announcement
date ACC_FILE Dummy variable coded “1” if the firm is an accelerated filer, 0
otherwise, as reported by Audit Analytics (is accelerated filer) LIT Dummy variable coded “1” if the firm operates in a high-litigation
industry, and zero otherwise. High-litigation industries are industries with SIC codes of 2833-2836, 3570-3577, 3600-3675, 5200-5961, and 7370
DISC An indicator variable equal to one if extraordinary items and discontinued Operations (xido) exceed 1% of pre-tax income (pi), and zero otherwise
EMPL The square root of number of employees, as reported by Compustat (emp)SPEC Dummy variable coded “1” if the auditor is an industry specialist, 0
otherwise; the auditor is considered a specialist when its audit fees are the largest among competitors within a specific industry-year
IND Fama/French industry classification

36
Panel B: Main regression variables Variable Definition Accounting-based measures of reporting quality REDCA REDCA is the measure taken from Ashbaugh et al. 2003. Specifically, we
first estimate the regression coefficients from the following model:
1 2 3 11
1t t t
t
CA Sales ROATA
where CA, current accruals, is net income before extraordinary items (ib) plus depreciation and amortization (Compustat mnemonic: dp) minus operating cash flows (Compustat mnemonic: oancf), scaled by beginning of year total assets (Compustat mnemonic: at). We then employ the coefficient estimates to measure expected current accruals (ECA), controlling for performance:
1 2 3 11
1ˆ ˆ ˆ[ ]t tt
ECA Sales AR ROATA
where AR is accounts receivable (rectr). REDCA is calculated as the difference between CA and ECA. AREDCA = absolute value of REDCA.
RESCFO For each industry we estimate the model:
1 1 2 3 1 4 5t t t t t t tTACC CFO CFO CFO REV PPE
where: TACC = total current accruals is net income before extraordinary items (ib) minus operating cash flows (Compustat mnemonic: oancf); CFO is cash flow from operation; PPE is property plant and equipment (ppegt); ∆REV is (Salest-Salest-1) (Compustat mnemonic: revt). All variables are scaled by beginning total assets (Compustat mnemonic: at). RESCFO is the residual from this regression.
CATA Current accruals, CA, (as defined above) scaled by total assets. External measures of reporting quality (variable source: AA) SEC_LET Dummy variable coded “1” if observation falls in year to which an SEC
comment letter referred and zero otherwise. RES_ACC Dummy variable coded “1” if Accounting rule (GAAP/FASB) application
failure noted in the period to which the Restatement is referring, and zero otherwise (res_accounting).
RES_FRAUD Dummy variable coded “1” if there was financial fraud, irregularities and misrepresentations noted in the period to which the Restatement is referring, and zero otherwise (res_fraud).
MW Dummy variable coded “1” if the company disclosed a material weakness, 0
otherwise (material_weakness) Independent variables YRANK Ranking based on deciles of residuals. Residuals derive from year/industry
regressions of logarithm of audit fees (Equation 1 in the text) WRANK Average of YRANK over the last five years LCA Lagged current accruals LNMVE Natural log of market value of equity FINDIST Dummy variable indicating if the client is financially distressed
(observations with negative cash flow from operation or negative net

37
income) CFF Cash flow from financing activities (fincf) MB Market to book value SALEVOL Standard deviation of company’s sales. PROP Firm level share of revenues compared to industry revenues. SPRAT Credit rating from Standard’s & Poor (splticrm).
NORAT Dummy = 1 if company has no rating from Standard’s & Poor, zero
otherwise EPS Earnings per share (epsfx), scaled by beginning stock price (prcc_c).
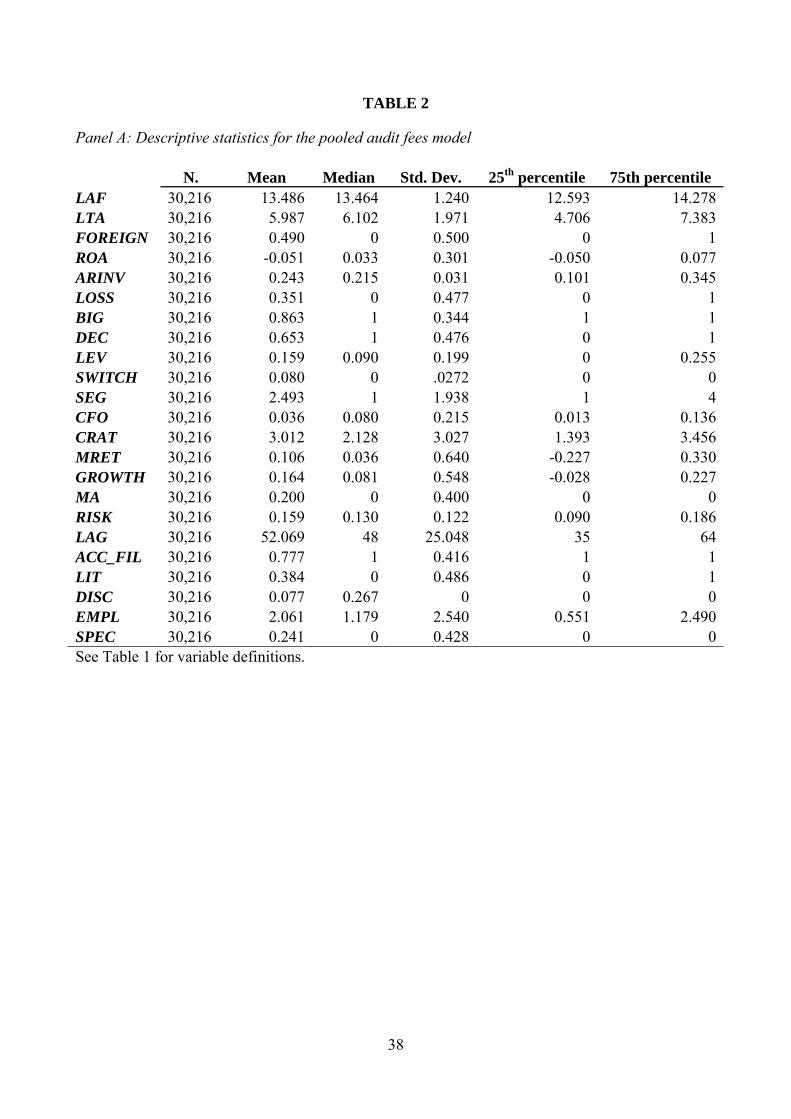
38
TABLE 2
Panel A: Descriptive statistics for the pooled audit fees model
N. Mean Median Std. Dev. 25th percentile 75th percentile LAF 30,216 13.486 13.464 1.240 12.593 14.278LTA 30,216 5.987 6.102 1.971 4.706 7.383FOREIGN 30,216 0.490 0 0.500 0 1ROA 30,216 -0.051 0.033 0.301 -0.050 0.077ARINV 30,216 0.243 0.215 0.031 0.101 0.345LOSS 30,216 0.351 0 0.477 0 1BIG 30,216 0.863 1 0.344 1 1DEC 30,216 0.653 1 0.476 0 1LEV 30,216 0.159 0.090 0.199 0 0.255SWITCH 30,216 0.080 0 .0272 0 0SEG 30,216 2.493 1 1.938 1 4CFO 30,216 0.036 0.080 0.215 0.013 0.136CRAT 30,216 3.012 2.128 3.027 1.393 3.456MRET 30,216 0.106 0.036 0.640 -0.227 0.330GROWTH 30,216 0.164 0.081 0.548 -0.028 0.227MA 30,216 0.200 0 0.400 0 0RISK 30,216 0.159 0.130 0.122 0.090 0.186LAG 30,216 52.069 48 25.048 35 64ACC_FIL 30,216 0.777 1 0.416 1 1LIT 30,216 0.384 0 0.486 0 1DISC 30,216 0.077 0.267 0 0 0EMPL 30,216 2.061 1.179 2.540 0.551 2.490SPEC 30,216 0.241 0 0.428 0 0See Table 1 for variable definitions.

39
TABLE 2 Panel B: Audit fees model (pooled sample and annual regressions) LAF
Independent Variable Pooled 2001 2002 2003 2004 2005 2006 2007 2008 2009 2010 2011 2012
LTA 0.43*** 0.44*** 0.43*** 0.44*** 0.45*** 0.43*** 0.45*** 0.44*** 0.42*** 0.40*** 0.41*** 0.40*** 0.50*** (0.00) (0.00) (0.00) (0.00) (0.00) (0.00) (0.00) (0.00) (0.00) (0.00) (0.00) (0.00) (0.00) FOREIGN 0.36*** 0.31*** 0.35*** 0.34*** 0.38*** 0.41*** 0.36*** 0.38*** 0.34*** 0.34*** 0.33*** 0.33*** 0.25*** (0.00) (0.00) (0.00) (0.00) (0.00) (0.00) (0.00) (0.00) (0.00) (0.00) (0.00) (0.00) (0.01) ROA -0.26*** -0.17*** -0.27*** -0.26*** -0.36*** -0.28*** -0.45*** -0.10 -0.29*** -0.19** -0.34*** -0.20*** -0.05 (0.00) (0.00) (0.00) (0.00) (0.00) (0.00) (0.00) (0.17) (0.00) (0.02) (0.00) (0.01) (0.88) ARINV 0.37*** 0.59*** 0.48*** 0.50*** 0.41*** 0.18** 0.35*** 0.27*** 0.41*** 0.44*** 0.42*** 0.36*** 0.17 (0.00) (0.00) (0.00) (0.00) (0.00) (0.02) (0.00) (0.00) (0.00) (0.00) (0.00) (0.00) (0.43) LOSS 0.12*** 0.08** 0.17*** 0.12*** 0.19*** 0.13*** 0.18*** 0.15*** 0.06** 0.08*** 0.09*** 0.05* 0.11 (0.00) (0.01) (0.00) (0.00) (0.00) (0.00) (0.00) (0.00) (0.02) (0.00) (0.00) (0.10) (0.26) BIG 0.34*** 0.05 0.13** 0.10** 0.36*** 0.36*** 0.33*** 0.33*** 0.37*** 0.41*** 0.44*** 0.42*** 0.35*** (0.00) (0.39) (0.02) (0.04) (0.00) (0.00) (0.00) (0.00) (0.00) (0.00) (0.00) (0.00) (0.00) DEC 0.09*** 0.01 0.20*** 0.14*** 0.47*** 0.03 0.06** 0.00 -0.01 -0.02 0.01 0.01 -0.08 (0.00) (0.90) (0.00) (0.00) (0.00) (0.21) (0.01) (0.97) (0.73) (0.48) (0.69) (0.70) (0.84) LEV -0.01 -0.07 -0.10 0.10 0.10 -0.04 -0.06 -0.06 -0.06 0.013 -0.03 -0.05 0.03 (0.71) (0.34) (0.13) (0.15) (0.17) (0.58) (0.31) (0.34) (0.22) (0.81) (0.63) (0.40) (0.91) SWITCH -0.03** -0.12* -0.09*** -0.10** 0.04 0.07 0.07 0.02 -0.07 -0.04 0.06 -0.07 0.11 (0.05) (0.05) (0.00) (0.01) (0.50) (0.16) (0.11) (0.73) (0.12) (0.29) (0.10) (0.16) (0.24) SEG 0.04*** 0.03*** 0.04*** 0.05*** 0.04*** 0.04*** 0.04*** 0.04*** 0.04*** 0.03*** 0.03*** 0.03*** 0.03* (0.00) (0.00) (0.00) (0.00) (0.00) (0.00) (0.00) (0.00) (0.00) (0.00) (0.00) (0.00) (0.10) CFO -0.13*** -0.34*** 0.01 -0.14 -0.06 -0.18* 0.12 -0.24*** 0.05 -0.23** -0.02 -0.23** -0.83 (0.00) (0.00) (0.93) (0.21) (0.62) (0.07) (0.22) (0.01) (0.44) (0.01) (0.90) (0.02) (0.11) CRAT -0.02*** -0.03*** -0.03*** -0.03*** -0.03*** -0.02*** -0.02*** -0.02*** -0.01*** -0.02*** -0.01*** -0.02*** -0.04*** (0.00) (0.00) (0.00) (0.00) (0.00) (0.00) (0.00) (0.00) (0.00) (0.00) (0.00) (0.00) (0.00) MRET 0.02*** 0.04** 0.02 0.08*** 0.00 -0.08 -0.00 -0.03 -0.02 -0.02 -0.02 0.01 -0.14 (0.00) (0.05) (0.41) (0.00) (0.91) (0.18) (0.93) (0.25) (0.37) (0.77) (0.52) (0.73) (0.12) GROWTH -0.04*** -0.00 -0.03** -0.06** -0.08*** -0.04** -0.03* -0.022 -0.04** -0.00 -0.08*** -0.02 0.05 (0.00) (0.95) (0.05) (0.01) (0.00) (0.04) (0.08) (0.23) (0.04) (0.83) (0.00) (0.27) (0.52) MA 0.06*** 0.08*** 0.07** 0.07** 0.08*** 0.031 0.07*** 0.03 0.04* 0.09*** 0.08*** 0.04 -0.01 (0.00) (0.01) (0.03) (0.02) (0.00) (0.26) (0.00) (0.18) (0.08) (0.00) (0.00) (0.13) (0.86) RISK 0.23*** 0.33*** 0.37*** 0.29** 0.07 0.41*** 0.21 0.62*** 0.53*** 0.10 0.23* 0.14 0.16 (0.00) (0.01) (0.00) (0.03) (0.68) (0.01) (0.13) (0.00) (0.00) (0.37) (0.07) (0.30) (0.69) LAG 0.00*** 0.01*** 0.01*** 0.00*** 0.00*** 0.00*** 0.00*** 0.00*** 0.00*** 0.00 0.00 0.00 0.01* (0.00) (0.00) (0.00) (0.01) (0.00) (0.00) (0.00) (0.00) (0.00) (0.64) (0.56) (0.37) (0.09) ACC_FIL 0.17*** -0.01 0.03 0.01 0.21*** 0.33*** 0.27*** 0.23*** 0.19*** 0.15*** 0.14*** 0.17*** 0.31*** (0.00) (0.71) (0.35) (0.80) (0.00) (0.00) (0.00) (0.00) (0.00) (0.00) (0.00) (0.00) (0.01) LIT -0.03 -0.04 -0.04 -0.03 -0.06** -0.06* -0.03 -0.01 -0.01 -0.02 -0.01 -0.02 -0.06

40
(0.12) (0.18) (0.17) (0.28) (0.05) (0.06) (0.35) (0.72) (0.61) (0.41) (0.68) (0.43) (0.41) DISC 0.14*** 0.06 0.13*** 0.10** 0.13*** 0.20*** 0.18*** 0.12*** 0.14*** 0.16*** 0.16*** 0.11*** 0.21 (0.00) (0.19) (0.00) (0.02) (0.00) (0.00) (0.00) (0.00) (0.00) (0.00) (0.00) (0.00) (0.12) EMPL 0.03*** 0.07*** 0.07*** 0.06*** 0.03*** 0.03*** 0.02*** 0.02*** 0.02*** 0.03*** 0.03*** 0.04*** -0.03 (0.00) (0.00) (0.00) (0.00) (0.00) (0.00) (0.01) (0.00) (0.00) (0.00) (0.00) (0.00) (0.18) SPEC 0.06*** 0.06** 0.03 0.05* 0.06** 0.10*** 0.09*** 0.03 0.03 0.02 0.05** 0.06*** 0.06 (0.00) (0.03) (0.17) (0.06) (0.02) (0.00) (0.00) (0.26) (0.28) (0.31) (0.04) (0.01) (0.44) Constant 9.89*** 9.32*** 9.20*** 9.50*** 9.39*** 9.89*** 9.90*** 10.09*** 10.08*** 10.36*** 10.21*** 10.25*** 9.63*** (0.00) (0.00) (0.00) (0.00) (0.00) (0.00) (0.00) (0.00) (0.00) (0.00) (0.00) (0.00) (0.00) Industry fixed effects Yes Yes Yes Yes Yes Yes Yes Yes Yes Yes Yes Yes Yes Year fixed effects Yes NA NA NA NA NA NA NA NA NA NA NA NA
N 30,216 1,781 2,540 2,767 2,983 3,027 3,002 2,959 2,865 2,733 2,669 2,652 225 Adj-R2 0.804 0.785 0.764 0.774 0.760 0.766 0.789 0.785 0.795 0.807 0.825 0.826 0.879
1. The table reports regression coefficients and p-values. These are calculated based on robust standards errors clustered at the firm level, including year and industry fixed effects.
2. The regression model is:
1 2 3 4 5 6 7 8 9 10 11
12 13 14 15 16 17 18 19 20 21 22 _
LAF LTA FOREIGN ROA ARINV LOSS BIG DEC LEV SWITCH SEG CFO
CRAT MRET GROWTH MA RISK LAG ACC FIL LIT DISC EMPL SPEC
See Table 1 for variable definitions.

41
TABLE 3
Panel A: Descriptive statistics and correlations for reporting quality analysis
Variable
N
Mean Median Std. Dev.
25th percentile
75th percentile
Fee rank variables WRANK 19,563 5.497 5.6 2.459 3.6 7.6 YRANK 19,563 5.531 6 2.841 3 8 Accounting-based measures of reporting quality REDCA 19,126 0.168 0.120 0.255 0.022 0.270 RESCFO 16,297 0.012 -0.018 0.215 -0.098 0.089 CATA 19,563 0.198 0.151 0.263 0.046 0.304 External measures of reporting qualitySEC_LET 16,249 0.407 0 0.491 0 1 RES_ACC 18,883 0.069 0 0.254 0 0 RES_FRAUD 16,651 0.002 0 0.045 0 0 MW 17,490 0.060 0 0.238 0 0 Control variables for accounting-based measures of reporting qualityBIG 19,563 0.873 1 0.333 1 1 LCA 19,563 0.189 0.145 0.258 0.042 0.293 LNMVE 19,563 6.442 6.354 1.917 5.123 7.678 MA 19,563 0.212 0 0.402 0 0 CFF 19,563 0.017 -0.007 0.180 -0.055 0.035 LEV 19,563 0.162 0.101 0.198 0 0.256 MB 19,563 2.878 2.096 5.122 1.299 3.524 LIT 19,563 0.290 0 0.454 0 1 LOSS 19,563 0.315 0 0.464 0 1 CFO 19,563 0.050 0.085 0.195 0.027 0.138 Control variables for external measures of reporting qualitySPRAT 18,883 3.169 0 5.433 0 6 AREDCA 18,883 0.212 0.142 0.221 0.060 0.288 ARINV 18,883 0.244 0.220 0.170 0.108 0.342 LTA 18,883 6.365 6.283 1.932 5.014 7.611 SALEVOL 18,883 0.153 0.104 0.169 0.054 0.190 PROP 18,883 0.002 0.000 0.009 0.000 0.001 NORAT 18,883 0.698 1 0.459 0 1 EPS 18,883 -0.093 0.034 0.625 -0.033 0.060
Descriptive Statistics are computed using the largest possible number of observations from the subsequent models.

42
Panel B: Sample composition by industry FF Industry N % FF1 Consumer Non-durables 1,068 5.46 FF2 Consumer Durables 594 3.04 FF3 Manufacturing 2,411 12.32 FF4 Oil, Gas and Coal Extraction and Products 986 5.04 FF5 Chemicals and Allied Products 601 3.07 FF6 Business Equipment 5,021 25.67 FF7 Telephone and Television Transmission 826 4.22 FF9 Wholesale, Retail and Some Services 2,281 11.66 FF10 Healthcare, Medical Equipment and Drugs 2,912 14.89 FF12 Other 2,863 14.63 Total 19,563 100% NB: Financial and utilities companies are excluded from the sample.

43
Panel C: Correlation matrix
CATA REDCA RESCFO YRANK WRANK BIG LCA LNMVE MA CFF LEV MB LIT LOSS
REDCA 0.956* 1
RESCFO 0.859* 0.870* 1
YRANK -0.029* -0.024* 0.027* 1
WRANK -0.047* -0.043* 0.008 0.846* 1
BIG 0.018* -0.001 -0.046* -0.024* -0.020* 1
LCA 0.704* 0.642* 0.569* -0.054* -0.049* 0.015 1
LNMVE 0.074* 0.008 -0.088* 0.005 0.006 0.369* 0.074* 1
MA -0.069* -0.098* -0.078* -0.006 0.020* 0.055* -0.031* 0.138* 1
CFF -0.080* -0.020* 0.071* 0.001 0.010 -0.112* -0.110* -0.201* 0.06* 1
LEV 0.098* 0.114* -0.017* -0.010 -0.004 0.089* 0.086* 0.112* 0.051* 0.055* 1
MB -0.038* -0.049* -0.021* 0.017* 0.028* 0.017* -0.040* 0.114* -0.013 0.043* -0.065* 1
LIT -0.089* -0.050* 0.004 -0.033* -0.044* 0.017* -0.099* -0.007 -0.061* 0.126* -0.083* 0.017* 1
LOSS -0.208* -0.108* -0.082* 0.006 0.031* -0.135* -0.160* -0.427* -0.086* 0.311* 0.057* -0.018* 0.132* 1
CFO 0.110* -0.003 -0.101* -0.022* -0.024* 0.145* 0.213* 0.371* 0.066* -0.599* -0.020* 0.008 -0.172* -0.505*
Pairwise Pearson correlations are presented below the diagonal, Spearman above the diagonal. * Denotes significance at 5%. Variables are defined in Table 1.

44
TABLE 4 Signed abnormal accruals and audit fee measures
Independent variables
REDCA REDCA RESCFO RESCFO CATA CATA
YRANK 0.001
(0.037) 0.006
(0.000) 0.004
(0.000) 0.006
(0.000) 0.000
(0.108) 0.005
(0.000)
WRANK -0.007 (0.000)
-0.003 (0.020)
-0.006 (0.000)
BIG 0.008
(0.143) 0.008
(0.147) 0.000
(0.953) 0.000
(0.953) 0.006
(0.220) 0.006
(0.230)
LCA 0.657
(0.000) 0.657
(0.000) 0.565
(0.000) 0.565
(0.000) 0.699
(0.000) 0.700
(0.000)
LNMVE -0.004 (0.000)
-0.004 (0.000)
-0.010 (0.000)
-0.010 (0.000)
-0.003 (0.000)
-0.003 (0.001)
MA -0.039 (0.000)
-0.038 (0.000)
-0.020 (0.000)
-0.020 (0.000)
-0.026 (0.000)
-0.026 (0.000)
CFF -0.038 (0.018)
-0.038 (0.019)
0.005 (0.747)
0.006 (0.736)
-0.037 (0.018)
-0.037 (0.019)
LEV 0.060
(0.000) 0.060
(0.000) -0.038 (0.001)
-0.038 (0.001)
0.040 (0.000)
0.040 (0.000)
MB -0.001 (0.226)
-0.001 (0.268)
0.000 (0.786)
-0.000 (0.819)
0.000 (0.977)
0.000 (0.942)
LIT 0.020
(0.000) 0.019
(0.000) 0.000
(0.896) -0.001 (0.814)
0.014 (0.000)
0.013 (0.000)
LOSS -0.059 (0.000)
-0.058 (0.000)
-0.077 (0.000)
-0.076 (0.000)
-0.087 (0.000)
-0.086 (0.000)
CFO -0.272 (0.000)
-0.272 (0.000)
-0.293 (0.000)
-0.293 (0.000)
-0.184 (0.000)
-0.184 (0.000)
Constant 0.125
(0.000) 0.133
(0.000) -0.006 (0.622)
-0.003 (0.829)
0.134 (0.000)
0.151 (0.000)
N 19,126 19,126 16,297 16,297 19,563 19,563 Adj-R2 0.482 0.483 0.441 0.441 0.562 0.563
Notes:
1. The table reports regression coefficients and p-values (in parentheses) below. These are calculated based on robust standards errors clustered at the firm level, including year and industry fixed effects.
2. The regression model is:
1 2 3 4 5
6 7 8 9 10 11 12 + +
RQ YRANK WRANK BIG LCA LNMVE
MA CFF LEV MB LIT LOSS CFO
where RQ = (REDCA, RESCFO, and CATA).
See Table 1 for variable definitions.
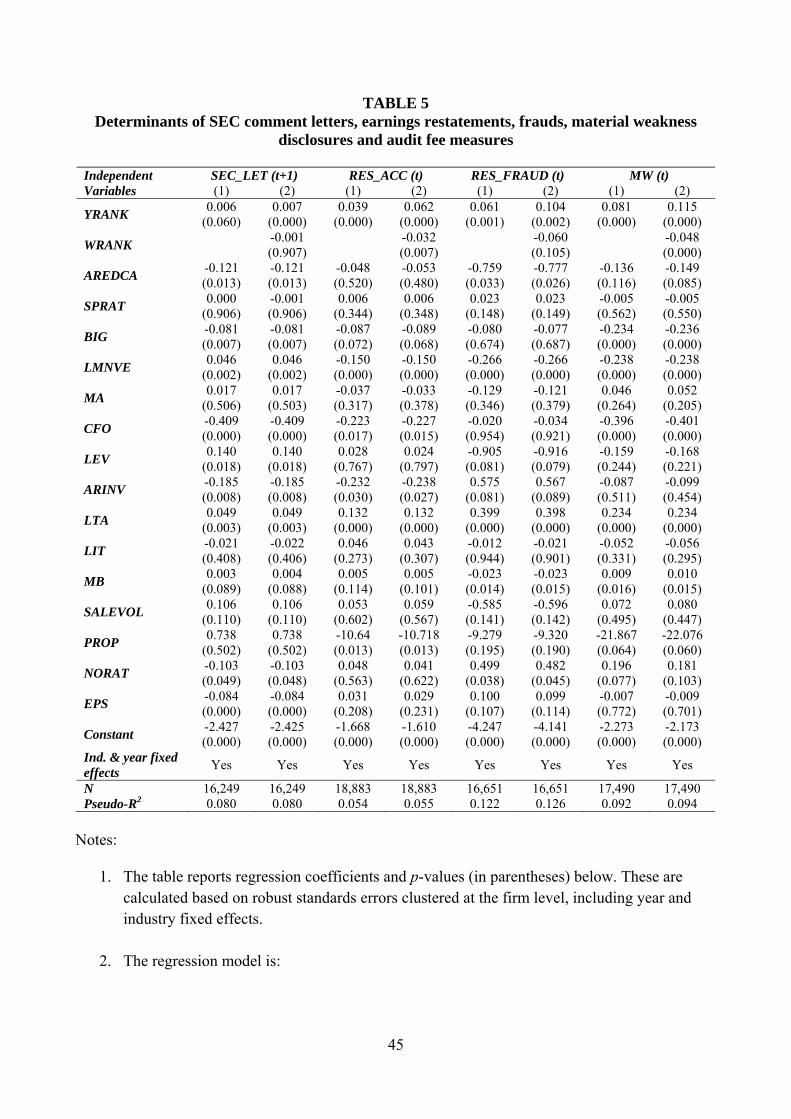
45
TABLE 5 Determinants of SEC comment letters, earnings restatements, frauds, material weakness
disclosures and audit fee measures
Independent Variables
SEC_LET (t+1) RES_ACC (t) RES_FRAUD (t) MW (t) (1) (2) (1) (2) (1) (2) (1) (2)
YRANK 0.006
(0.060) 0.007
(0.000) 0.039
(0.000) 0.062
(0.000) 0.061
(0.001) 0.104
(0.002) 0.081
(0.000) 0.115
(0.000)
WRANK -0.001 (0.907)
-0.032 (0.007)
-0.060 (0.105)
-0.048 (0.000)
AREDCA -0.121 (0.013)
-0.121 (0.013)
-0.048 (0.520)
-0.053 (0.480)
-0.759 (0.033)
-0.777 (0.026)
-0.136 (0.116)
-0.149 (0.085)
SPRAT 0.000
(0.906) -0.001 (0.906)
0.006 (0.344)
0.006 (0.348)
0.023 (0.148)
0.023 (0.149)
-0.005 (0.562)
-0.005 (0.550)
BIG -0.081 (0.007)
-0.081 (0.007)
-0.087 (0.072)
-0.089 (0.068)
-0.080 (0.674)
-0.077 (0.687)
-0.234 (0.000)
-0.236 (0.000)
LMNVE 0.046
(0.002) 0.046
(0.002) -0.150 (0.000)
-0.150 (0.000)
-0.266 (0.000)
-0.266 (0.000)
-0.238 (0.000)
-0.238 (0.000)
MA 0.017
(0.506) 0.017
(0.503) -0.037 (0.317)
-0.033 (0.378)
-0.129 (0.346)
-0.121 (0.379)
0.046 (0.264)
0.052 (0.205)
CFO -0.409 (0.000)
-0.409 (0.000)
-0.223 (0.017)
-0.227 (0.015)
-0.020 (0.954)
-0.034 (0.921)
-0.396 (0.000)
-0.401 (0.000)
LEV 0.140
(0.018) 0.140
(0.018) 0.028
(0.767) 0.024
(0.797) -0.905 (0.081)
-0.916 (0.079)
-0.159 (0.244)
-0.168 (0.221)
ARINV -0.185 (0.008)
-0.185 (0.008)
-0.232 (0.030)
-0.238 (0.027)
0.575 (0.081)
0.567 (0.089)
-0.087 (0.511)
-0.099 (0.454)
LTA 0.049
(0.003) 0.049
(0.003) 0.132
(0.000) 0.132
(0.000) 0.399
(0.000) 0.398
(0.000) 0.234
(0.000) 0.234
(0.000)
LIT -0.021 (0.408)
-0.022 (0.406)
0.046 (0.273)
0.043 (0.307)
-0.012 (0.944)
-0.021 (0.901)
-0.052 (0.331)
-0.056 (0.295)
MB 0.003
(0.089) 0.004
(0.088) 0.005
(0.114) 0.005
(0.101) -0.023 (0.014)
-0.023 (0.015)
0.009 (0.016)
0.010 (0.015)
SALEVOL 0.106
(0.110) 0.106
(0.110) 0.053
(0.602) 0.059
(0.567) -0.585 (0.141)
-0.596 (0.142)
0.072 (0.495)
0.080 (0.447)
PROP 0.738
(0.502) 0.738
(0.502) -10.64 (0.013)
-10.718 (0.013)
-9.279 (0.195)
-9.320 (0.190)
-21.867 (0.064)
-22.076 (0.060)
NORAT -0.103 (0.049)
-0.103 (0.048)
0.048 (0.563)
0.041 (0.622)
0.499 (0.038)
0.482 (0.045)
0.196 (0.077)
0.181 (0.103)
EPS -0.084 (0.000)
-0.084 (0.000)
0.031 (0.208)
0.029 (0.231)
0.100 (0.107)
0.099 (0.114)
-0.007 (0.772)
-0.009 (0.701)
Constant -2.427 (0.000)
-2.425 (0.000)
-1.668 (0.000)
-1.610 (0.000)
-4.247 (0.000)
-4.141 (0.000)
-2.273 (0.000)
-2.173 (0.000)
Ind. & year fixed effects
Yes Yes Yes Yes Yes Yes Yes Yes
N 16,249 16,249 18,883 18,883 16,651 16,651 17,490 17,490 Pseudo-R2 0.080 0.080 0.054 0.055 0.122 0.126 0.092 0.094
Notes:
1. The table reports regression coefficients and p-values (in parentheses) below. These are calculated based on robust standards errors clustered at the firm level, including year and industry fixed effects.
2. The regression model is:

46
1 2 3 4 5
6 7 8 9 10
11 12 13 14 15
16 17
( _ 1)Prob RQ E YRANK WRANK ARDECA SPRAT BIG
LNMVE MA CFO LEV ARINV
LTA LIT MB SALEVOL PROP
NORAT EPS
where RQ _ E = (SEC_LET, RES_ACC, RES_FRAUD, or MW). SEC_LET is a dummy equal to 1 if the firm received a letter in t+1, 0 otherwise (therefore, referring to financial statements in year t). RES_ACC is a dummy equal to 1 if the firm had to restate its financial statements for accounting reasons during the year, 0 otherwise; while RES_FRAUD is a dummy assuming the value of 1 if the firm had to restate its financial statements because of fraudulent activities during the year, 0 otherwise. Finally, MW is a dummy variable assuming the value of 1 if the firm reported severe material internal control weaknesses during the year, 0 otherwise. All regressions include year and industry controls. See Table 1 for variable definitions.

47
TABLE 6 Accounting Conservatism (Returns) and Audit Fee measures
Independent Variable
EPS EPS (1) (2)
RET -0.372*** -0.294*** (0.000) (0.000) DRET -0.097*** -0.065*** (0.000) (0.001) RET*DRET 0.514*** 0.442*** (0.000) (0.000)YRANK -0.006** -0.013*** (0.013) (0.008) YRANK*RET 0.018*** 0.045*** (0.008) (0.000) YRANK*DRET 0.004 0.016*** (0.143) (0.002) YRANK*RET*DRET -0.023*** -0.047*** (0.003) (0.001) WRANK 0.011* (0.064) WRANK*RET -0.040*** (0.008) WRANK*DRET -0.018*** (0.004) WRANK*RET*DRET 0.035** (0.037) LCA 0.107*** 0.107*** (0.000) (0.000) LNMVE 0.040*** 0.040*** (0.000) (0.000) MA 0.011** 0.012** (0.017) (0.010) BIG -0.019 -0.020* (0.102) (0.083) LEV -0.149*** -0.148*** (0.000) (0.000) MB 0.002*** 0.002*** (0.003) (0.003) LIT -0.048*** -0.049*** (0.000) (0.000) Constant -0.095*** -0.117*** (0.000) (0.000) Industry and Year Fixed Effects Yes Yes N 19,583 19,583 R-squared 0.216 0.222

48
Notes:
1. The table reports regression coefficients and p-values (in parentheses) below. These are
calculated based on robust standards errors clustered at the firm level, including year and industry fixed effects.
2. The regression model is:
1 2 3
4 5 6 7
8 9 10 11
12 13 14 15 16 17
*
+ * * * *
+ * * * *
+
EPS RET DRET RET DRET
YRANK YRANK RET YRANK DRET YRANK RET DRET
WRANK WRANK RET WRANK DRET WRANK RET DRET
LCA LMVE MA BIG LEV
18MB LIT
3. See Table 1 for variable definitions.


![audit-uii.yolasite.comaudit-uii.yolasite.com/resources/AUDITING/5 Investments and Cash... · CHAPTER 18 / AUDITING INVESTMENTS AND CASH BALANCES [867] the audit risk model might indicate](https://img.dokumen.tips/doc/110x75/5aa79cf97f8b9a294b8c56c1/audit-uii-investments-and-cashchapter-18-auditing-investments-and-cash-balances.jpg)