Embed Size (px)
Citation preview

Investment Behaviour ofGerman Equity Fund ManagersAn Exploratory Analysis of Survey Data
Torsten Arnswald
Discussion paper 08/01
Economic Research Centre
of the Deutsche Bundesbank
March 2001
The discussion papers published in this series representthe authors’ personal opinions and do not necessarily reflect the viewsof the Deutsche Bundesbank.

Deutsche Bundesbank, Wilhelm-Epstein-Strasse 14, 60431 Frankfurt am Main,P.O.B. 10 06 02, 60006 Frankfurt am Main, Federal Republic of Germany
Telephone (0 69) 95 66-1Telex within Germany 4 1 227, telex from abroad 4 14 431, fax (0 69) 5 60 10 71Internet: http://www.bundesbank.de
Please address all orders in writing to: Deutsche Bundesbank,Press and Public Relations Division, at the above address, or by fax No. (0 69) 95 66-30 77
Reproduction permitted only if source is stated.
ISBN 3–933747–71–6
Abstract
In order to shed light on the “black box” of institutional equity investing in a systematicmanner, I conducted a broadly based questionnaire which received a large response fromGerman mutual fund companies. The survey asked fund managers for their basic views andpractices and for insights into their company’s performance-measurement and compensa-tion incentives. It was possible to identify three core types of investors, labelledfundamentalists, tacticians and methodologists, in the data on investment behaviour.Common to all types is the primary aim of achieving above-average returns on investmentwith due allowance being made for sluggishness in the reaction of market prices to new in-formation. Another universal feature of institutional equity investing turns out to be aheavy reliance on information sources which offer a means of confirmation and throughwhich the contagions of fear and exuberance may be transmitted. In general fund managersexhibit a pronounced preference for “winner-type” and “spotlight” stocks as well. All in-vestor groups recognise, in the first instance, underlying economic information as a sourceof superior value. However, a potential for exaggerated market dynamics is suggested bythe fact that the mere arrival of news from corporations or analysts’ earnings revisions isgenerally thought to impart as strong a market impulse as the perceived mispricing ofstocks relative to the market or sector as such. Furthermore, those who appear to be bestsuited to conduct fundamental arbitrage are nevertheless likely to be constrained, to a sig-nificant extent, by time horizons and the fear of market movements. Besides investmentfocus and basic attitudes towards market efficiency, agency problems are shown to have abearing on equity fund managers’ investment behaviour.
JEL Classification: G10, G11, G23
Key Words: Institutional investors’ behaviour, mutual funds, equity markets, financial
system stability

Zusammenfassung
Dieser Studie liegt eine breit angelegte Umfrage zugrunde, an der sich die Mehrheit derAktienfondsmanager aus nahezu allen Investmentgesellschaften mit Sitz in Deutschlandbeteiligten. Die Fondsmanager sind zu ihren grundlegenden Ansichten sowie ihren Praktikenbefragt worden, um auf systematische Weise Investmentprozesse institutioneller Anleger zuergründen. In diesem Rahmen wurde auch um Angaben über die Leistungsbewertung derFondsmanager seitens ihrer Unternehmungsleitung und über die angewandtenLeistungsanreize gebeten. Aus den gewonnenen Daten über das Investitionsverhalten konntendrei Hauptgruppen von Anlegern festgestellt werden, die sogenannten Fundamentalisten,Taktiker und Methodiker. Allen Gruppen gemeinsam ist das vorrangige Ziel,überdurchschnittliche Anlagerenditen zu erzielen. Dabei dominiert zugleich eindeutig dieVorstellung, daß Marktpreise auf neue Informationen nur träge reagieren. Ihren eigenenAngaben zufolge greifen Fondsmanager auch sehr auf solche Informationsquellen zurück, dieletztlich für ihre Anlageentscheidungen bestätigend wirken und auf diese WeiseAnsteckungseffekte wie Befürchtungen und Euphorien übertragen können. Im allgemeinenbesitzen sie außerdem eine ausgeprägte Vorliebe für "Erfolgs"-Aktien und Aktien, denen dieAufmerksamkeit im Markte gilt. Alle Anlegergruppen erkennen zwar in erster Linie denSchlüssel für überdurchschnittliche Anlageresultate in der Analyse grundlegenderWirtschaftsinformationen; allerdings gibt es ebenso Hinweise auf ein Zustandekommenübertriebener Marktdynamiken. Allein der bloße Eingang von Nachrichten aus demUnternehmenssektor oder Revisionen von Analystenschätzungen werden schon durchweg alsebenso starke Handelsimpulse betrachtet wie die Wahrnehmung grundlegend fehl bewerteterAktienkurse selbst. Darüber hinaus zeigt sich, daß sogar die Fundamentalisten - die für eineden Markt stabilisierende Arbitrage am ehesten in Frage kommen -. in erheblichem Maßedurch begrenzte Zeithorizonte und die Furcht vor Kursschwankungen eingeengt sind. Eineweitere Analyse ergibt, daß neben dem Anlageschwerpunkt und der grundsätzlichenEinstellung zur Markteffizienz auch "Agency"-Probleme das Anlageverhalten vonAktienfondsmanager nennenswert beeinflussen.

Table of Contents
1 Introduction 1
2 The use of survey data in capital market research 4
3 Questionnaire design and survey participation 4
4 Survey results 6
5 In search of a fundamental consistency among fund managers 26
6 A clustering of investors according to their behavioural patterns 29
7 On the limits of fundamental arbitrage 37
8 Concluding remarks 43
Acknowledgements
In preparing this questionnaire survey, I was able to rely on valuable insights and assistanceprovided by the following senior fund managers and consultants. Their support is gratefullyacknowledged as my interviews with them proved to be instrumental to the preparation ofthis study.
Achim Stranz (AXA Colonia Kapitalanlagegesellschaft mbH), Andreas Rachor (Julius BärKapitalanlage AG), Christian Eckert (ABN AMRO Asset Management DeutschlandGmbH), Dr Min Sun (FERI Trust GmbH), Dr Wolfgang Kirsten (Union-Fonds-HoldingAG), Günther Gerstenberger (Deka Investment Management GmbH), Holger J. Desch(Schroder Investment Management GmbH), Jürgen Wetzel (Bankgesellschaft Berlin In-vestment GmbH), Klaus Martini (DWS Investment GmbH), Matthias Schüller (State StreetGlobal Investment GmbH), Michael von Brauchitsch (Sal. Oppenheim), Ralf Peter Lem-mer (Gerling Investment Kapitalanlage GmbH), Sebastian Rott (SiemensKapitalanlagegesellschaft mbH), Stefan Günther (Commerzinvest), Thomas W. Tilse(ADIG Allgemeine Deutsche Investment-Gesellschaft mbH).

Acknowledgements
Survey research is crucially dependent on participation. The support of the German mutualfund companies listed below (arranged according to degree of confirmed participation), allof which offer equity fund services, is highly appreciated, not least the official backingfrom the Bundesverband Deutscher Investment-Gesellschaften e.V. (Association of Ger-man Investment Companies), Frankfurt am Main.
Merck Finck Invest Kapitalanlagegesellschaft mbH, München (Munich)MAINTRUST Kapitalanlagegesellschaft mbH, Frankfurt am Main
DEVIF Deutsche Gesellschaft für Investment-Fonds GmbH, Frankfurt am MainState Street Global Investment GmbH, München (Munich)
Mannheimer Asset Management Kapitalanlagegesellschaft mbH, MannheimHANSAINVEST Hanseatische Investment-Gesellschaft mbH, Hamburg
Swiss Life Asset Management Kapitalanlagegesellschaft mbH, München (Munich)Schroder Investment Management GmbH, Frankfurt am Main
Goldman, Sachs Investment Management GmbH, Frankfurt am MainDeutsche Investment-Trust Gesellschaft für Wertpapieranlagen mbH, Frankfurt am Main
Siemens Kapitalanlagegesellschaft mbH, München (Munich)METZLER INVESTMENT GMBH, Frankfurt am MainBankgesellschaft Berlin INVESTMENT GmbH, Berlin
ABN AMRO Asset Management Deutschland GmbH, Frankfurt am MainFrankfurt-Trust Investment Gesellschaft mbH, Frankfurt am Main
Franken-Invest Kapitalanlagegesellschaft mbH, Nürnberg (Nuremberg)Credit Suisse Asset Management Kapitalanlagegesellschaft mbH, Frankfurt am Main
Zürich Investmentgesellschaft mbH, Frankfurt am MainInternationale Kapitalanlagegesellschaft mbH, Düsseldorf
Allianz Kapitalanlagegesellschaft mbH, München (Munich)Münchner Kapitalanlage AG, München (Munich)
DG PanAgora Asset Management GmbH, Frankfurt am MainBaden-Württembergische Kapitalanlagegesellschaft mbH, Stuttgart
Activest Investmentgesellschaft mbH, UnterföhringHelaba Invest Kapitalanlagegesellschaft mbH, Frankfurt am Main
Universal-Investment-Gesellschaft mbH, Frankfurt am MainDeutsche Asset Management Investment-Gesellschaft mbH, Frankfurt am Main
Merrill Lynch Mercury Kapitalanlagegesellschaft mbH, Frankfurt am MainINVESCO Kapitalanlagegesellschaft mbH, Frankfurt am Main
GCR Kapitalanlagegesellschaft mbH, Köln (Cologne)VERITAS SG Investment Trust GmbH, Frankfurt am Main
Lazard Asset Management Deutschland GmbH, Frankfurt am Main

Deka Investment Management GmbH, Frankfurt am MainDeka Deutsche Kapitalanlagegesellschaft mbH, Frankfurt am MainCommerzbank Investment Management GmbH, Frankfurt am Main
ADIG Allgemeine Deutsche Investment-Gesellschaft mbH, Frankfurt am MainMEAG MUNICH ERGO Kapitalanlagegesellschaft mbH, München (Munich)
Bayern-Investment Kapitalanlagegesellschaft mbH, München (Munich)SüdKa SüdKapitalanlagegesellschaft mbH, Frankfurt am Main
M.M. Warburg Invest Kapitalanlagegesellschaft mbH, Frankfurt am MainJulius Bär Kapitalanlage AG, Frankfurt am Main
Oppenheim Kapitalanlage-Gesellschaft mbH, Köln (Cologne)DWS Investment GmbH, Frankfurt am Main
Allfonds Bayerische Kapitalanlagegesellschaft mbH, München (Munich)NORDINVEST Norddeutsche Investment-Gesellschaft mbH, Hamburg
J.P. Morgan Investment GmbH, Frankfurt am MainUBS Investment Kapitalanlagegesellschaft mbH, Frankfurt am MainGerling Investment Kapitalanlagegesellschaft mbH, Köln (Cologne)
Deutsche Postbank Privat Invest Kapitalanlagegesellschaft mbH, BonnDeutsche Postbank Invest Kapitalanlagegesellschaft mbH, Bonn
Union-Fonds-Holding AG, Frankfurt am MainWestKA Westdeutsche Kapitalanlagegesellschaft mbH, Düsseldorf
UBS Asset Management GmbH, Frankfurt am MainBfG Investment-Fonds GmbH, Frankfurt am Main
Salomon Brothers Kapitalanlagegesellschaft mbH, Frankfurt am MainCDC Asset Management Deutschland KAG mbH, Frankfurt am MainAM Generali Invest Kapitalanlagegesellschaft mbH, Köln (Cologne)
AXA Colonia Kapital-anlagesellschaft, Köln (Cologne)
List of Tables and Figures *
Table 1: Investment objectives (Q8.b.) 8
Table 2: Basic views on informational efficiency of stock prices (Q8.a.) 9
Table 3: Strategic options for information management (Q7.b.) 9
Table 4: Information channels (Q7.a.) 10
Table 5: Methods of analysis and forecasting horizons (Q6.b.) 12
Table 6: Potential buy signals (Q6.a.) 14
Table 7: Secondary criteria in selecting stocks (Q6.c.) 16
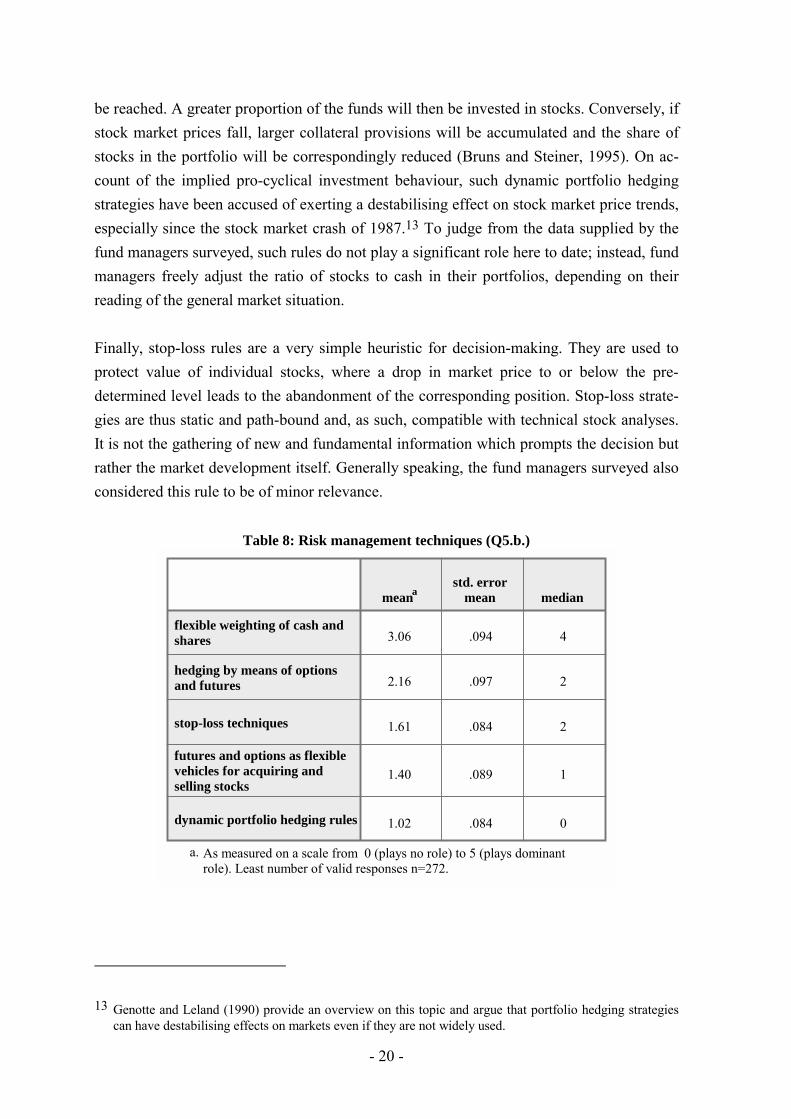
Table 8: Risk management techniques (Q5.b.) 20
Table 9: Personal notion of investment risk (Q5.c.) 22
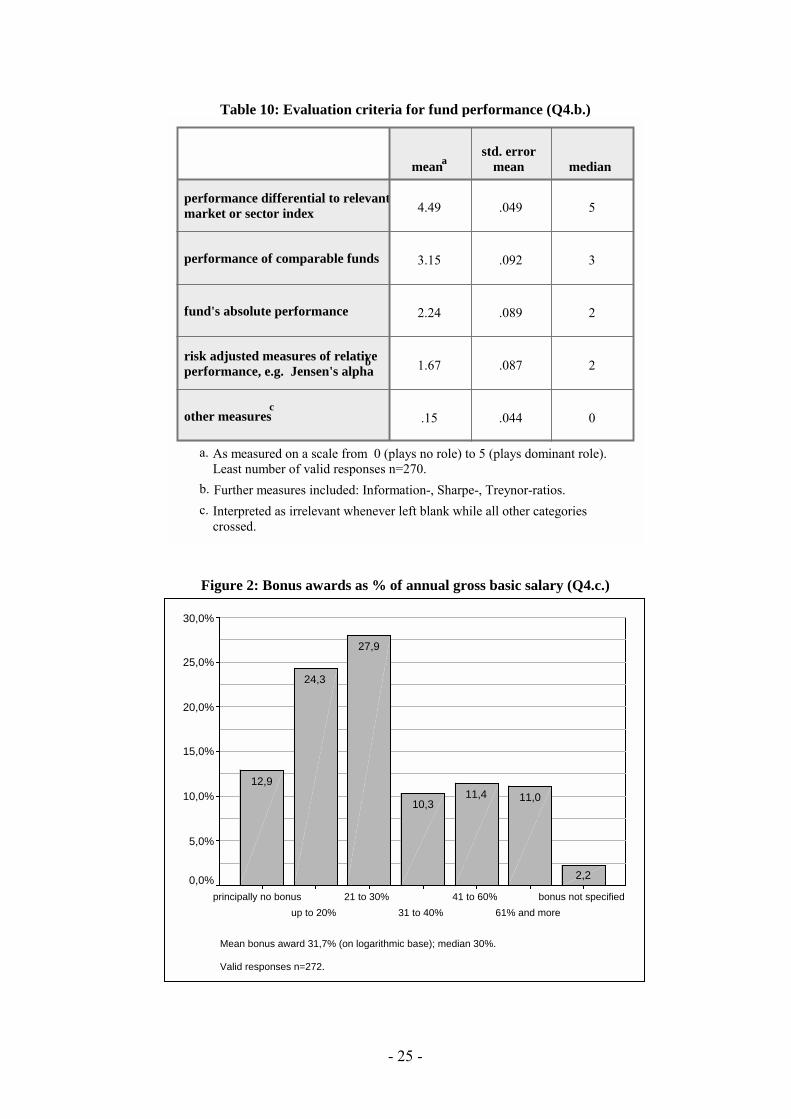
Table 10: Evaluation criteria for fund performance (Q4.b.) 25
Table 11: Bonus award criteria (Q4.c.) 26
Table 12: Investment approach and notion of market efficiency 27
Table 13: Company size, resources and use of privileged information 28
Table 14: How are decisions made? (Q5.a.) 32
Table 15: Which is more likely to make fund managers nervous, market newsor the market itself? (Q5.d.) 39
Table 16: Summary of a PROBIT-analysis of fundamental behaviour 41
Table 17: A comparison with official statistics to control for selectivity 46
Table 18: Brief profile of the typical fund manager (Q1.b./c., Q2.a.) 46
* Where appropriate, the corresponding question in the questionnaire (see Appendix) is specified in paren-theses.
Table 19: Information - Where from, what for? 47
Table 20: Company size, resources and investment approach 47
Table 21: Group analysis: Methods of analysis and time horizons (Q6.b., Q5.e.) 48
Table 22: Group analysis: Potential buy signals (Q6.a.) 49
Table 23: Group analysis: Investment objectives (Q8.b.) 50
Table 24: Group analysis: Secondary criteria in selecting stocks (Q6.c.) 51
Table 25: Group analysis: Risk management techniques (Q5.b.) 52
Table 26: Group analysis: Information channels (Q7.a.) 53
Table 27: The price-inertia view of the market by groups (Q8.a.) 54
Figure 1: Decision-making process (Q5.a.) 18
Figure 2: Bonus awards as a % of annual gross basic salary (Q4.c.) 25
Figure 3: Index-tracking and fundamental analysis 33
Figure 4: Deriving information from the behaviour of other investors 34
Figure 5: Endurance of fundamentalists (Q5.e.) 38
Figure 6: Educational background in terms of degrees earned (Q2.b.) 54
Figure 7: Finance-related education of fund managers 55
Figure 8: Description of the typical fund (Q3.d.) 55
Figure 9: Framework of a stylised investment process 56
Figure 10: Frequency of performance evaluation (Q4.a.) 56
Figure 11: Core investor types 57


- 1 -
Investment Behaviour of German Equity Fund Managers – An Exploratory Analysis of Survey Data *
1 Introduction
Critical observers of recent financial developments claim that equity markets are becomingmore unstable. They argue that share prices frequently lose touch with economic funda-mentals. To the extent that technological progress facilitates equity trading and the flow ofinformation, so the argument runs, capital movements on the international markets - unbri-dled since deregulation - tend to jack up prices and drive them down again in anexaggerated manner. Market uncertainty increases, as does the fragility of financial sys-tems. Powerful institutional investors are regularly seen as the “culprits” inasmuch as theyare said to huddle together and cheer each other on, driving markets into states of irrationalexuberance, and, then again, to collectively frighten each other into a panic. Be that as itmay, such concerns definitely coincide with the rapid rise of institutional investors to therank of dominant players on securities markets. The institutionalisation of asset manage-ment represents a major trend in Germany as it does in many other OECD countries,certainly in the last decade, if not longer (Friedman, 1995; Davis, 1997). Stability concernssuch as those expressed above also manifest a new awareness in this country as to thesharply increased importance of the equity market for the domestic economy.
For investors, stock-market stability remains as interesting a topic as ever since it includesthe issue of share-price efficiency, in the well known meaning established byFama (1970) - or, in non-technical terms, the opportunities and pitfalls surrounding thequest for extraordinary returns. Volatility is important on its own terms to the rational in-vestor as it effectively worsens expected returns adjusted for the investment risks to beassumed. The question whether stock market prices are informationally efficient or not hasinspired numerous studies beginning with Kendall’s first statistical analysis (1953).De Bondt and Thaler (1985, 1987) present evidence on the short-term underreaction andlong-term overreaction of market participants to fundamental news, a behavioural patterncompatible with evidence found in psychological research (Kahneman and Tversky, 1982).Since the seminal papers by Sharpe (1966) and Jensen (1968), a great deal of performancestudies related to market efficiency but dealing more specifically with equity funds have
* Torsten Arnswald, Deutsche Bundesbank, e-mail: [email protected]. Before all others, I wish toexpress my sincere thanks to all the fund managers and practitioners who devoted their time and effort to fillingout this questionnaire survey (see acknowledgements above). On the academic side, Lukas Menkhoff providedhelpful comments which I gratefully acknowledge.

- 2 -
tried to determine whether active management is capable of persistently outperformingmarkets (Carhart, 1997; Grünbichler and Pleschiutschnig, 1999; Grinblatt and Titman,1992; Trzcinka and Shukla, 1992; Wermers, 1995; Wittrock 1995). Most of them agreewith Jensen’s conclusion that, when risk is adjusted for, no evidence exists that mutualfunds achieve above-average returns.
Inefficiency and volatility of equity prices are important from a central banking standpointas well. They could be an indication, or even the cause, of fragility in the financial sector.In fact, price level or dynamic effects, e.g. a market crash or overvalued share prices, mightharm the entire economy. This is the reason for the widespread consensus that centralbanks also have a mandate to maintain financial stability at large.
For a long time, institutional investing played a merely subordinate role in Germany, inparticular, when compared with the UK and US, a chief reason being the pay-as-you-gobased state pension scheme (Nürk, 1998). This, though, appears to be changing. By the endof 1999, German banks, insurance companies and mutual funds already owned 36% of allnational assets held in equity (including direct corporate investments) - up from 23% at thebeginning of the last decade. During this period, the share which investment fund compa-nies have in the equity held by all domestic financial institutions rose from a fifth toroughly 38%. The ongoing intermediation of portfolio equity investments is mainly drivenby two factors: First, private households progressively purchase certificates of share-basedmutual funds instead of direct holdings in the stock markets, and secondly, banks and in-surance companies themselves increasingly favour portfolio investments in specialisedfunds reserved for institutional investors.
Such institutionalisation involves opportunities for enhancing, and risks to, the smoothfunctioning of stock markets. In principle, the concentration of assets in the hands of in-vestment professionals bodes well for an improved, i.e. faster, more comprehensive andthorough investment process, ranging from more efficient information-gathering and analy-sis to more consistent decision-making. Professionalism is, in essence, about well-reasoneddecisions. Moreover, mutual funds can be expected to enjoy economies of scale in securi-ties research and transactions which can be passed on to clients in the form of lower costs.Taken as a whole, institutionalisation may enhance trading liquidity on stock markets asmuch as it enhances the efficiency of equity pricing.
Paradoxically, trading liquidity appears on the risk side of institutionalisation as well. Anexcessive clustering of assets could, at least in some market segments, reduce the numberof trading partners, effectively jeopardising market depth. Institutional investors may alsoprefer large-cap “blue chips”, for instance, or else direct more attention to shares with par-

- 3 -
ticular features (Falkenstein, 1996; Friedman, 1995). As a consequence there could be un-welcome side-effects on local small-cap companies or high-risk start-ups stuck withoutadequate access to equity financing. An additional risk inherent in institutionalisationwould be the higher probability of extreme volatility, volatility increasing as investor be-haviour becomes more interdependent (Bouchaud and Cont, 2000), e.g. due to index-tracking or intentional herding. Another point bearing on market efficiency is that practi-tioners often confirm that their decisions are at times significantly influenced by otherinvestors. Indeed, there are good theoretical reasons for rational investors to base their be-haviour on what others do (Devenow and Welch, 1996). This will be discussed in moredetail below. Finally, a major concern is short-termism which institutional investors areblamed for encouraging. Although one would like to see fund managers act swiftly on rele-vant new information, ideally one expects them to maintain a long-term view while doingso. By contrast, so-called “buy-and-hold“ strategies are often associated with private in-vestors. To be fair, it needs to be said that failure to trade for a long period after buying isnot in itself indicative of a long-term view.
Institutional investors have become too important to allow our knowledge to rest on anec-dotal or partial evidence – whatever their merits. That is why I chose to conduct acomprehensive questionnaire survey based on voluntary and anonymous participation. Inkeeping with the notion of the typical investment process as occurring within a level play-ing field, the study focuses on the “parvenus” in German institutional investing, themanagers of share-based mutual funds. In the summer of 2000, I contacted all the Germanmutual funds which invest in equities and asked them to entrust all their equity fund man-agers with possibilities for personal participation. I solicited fund managers’ basic viewsand information on their usual evaluation methods, data sources, time horizons, and deci-sion-making as well as insights into their company’s performance-measuring andcompensation incentives. The results of this broad-based survey open new paths for theanalysis of institutional investor behaviour.
The remainder of the paper is structured as follows. In section 2 the use of survey data incapital market research is explained briefly. Section 3 provides information on survey de-sign and participation. Many of the results of the survey are discussed in section 4. Somecorrelation analyses, presented in section 5, help to probe for a basic consistency in re-sponse patterns. Section 6 investigates the heterogeneity of response patterns identifyingthree core groups of investors, labelled fundamentalists, tacticians and methodologists. Re-ponses are tested to determine whether certain styles are group-specific or universal inequity-fund investing. Section 7 takes a closer look at fundamentalists to gauge the poten-tial for fundamental arbitrage as well as to explore conditions in the working environment
- 4 -
that may influence fund managers to be more fundamentalistic. Section 8 concludes thepaper.
2 The use of survey data in capital market research
In most cases, financial market research relies on observable market quotes and volumes.This approach makes sense given that such data may be obtained rather easily at compara-tively low costs for various times, frequencies and securities. However, the preference formarket data does have another, more deeply rooted reason. Economic thinking is charac-terised by a consequentialistic understanding according to which all data that can beobserved and measured objectively cannot “lie” and thus best reveal underlying behaviour,in this case, that of investors. There are at least two drawbacks involved in restrictinganalysis to market data. First, investors’ behaviour may be the result of a multitude of fac-tors which might not be properly identifiable and isolatable by means of market data alone.Secondly, we are often interested in the risks of instability stemming from investors’ be-havioural patterns. But we have great difficulty in assessing the soundness of marketswhere no instabilities are observable in the market data. Here, survey data can be moretelling. The main advantage of carefully designed questionnaire research is that it system-atically sheds light on key aspects of institutional investing, otherwise seen as something ofa black box (Davis, 1997). Likewise, there is no need to adhere to the paradigm of the rep-resentative agent, as it is possible to explore directly the nature and degree of heterogeneityfor this type of investor. Of course, besides the well-known difficulties involved in surveyresearch such as selectitivity bias (Maddala, 1983), the possibility of participants givingidealised, distorted responses, or even untrue ones remain a fundamental concern. Such dif-ficulties and concerns need to be addressed. But they do not argue against the use ofsurveys as a valid instrument in capital market research, so long as they are used not to re-place, but to complement, conventional empirical analysis (Cheung and Chinn, 1999).1
3 Questionnaire design and survey participation
After consulting several senior fund managers, I designed a questionnaire with two mainparts (the complete questionnaire, translated from the German, is reprinted in this paper’sappendix). In the first part, fund managers are asked to discuss their background, experi-
1 Friedman and Savage (1948) draw an analogy between capital market participants and billiard players onthe basis of the fact that the latter are able to play well without understanding the physics of the game.Such a view can be seen to underlie the sceptical attitude toward surveys in capital market research(Cheung and Wong, 1999). In applied market research, however, e.g. on consumer behaviour, surveys area widely used instrument (Meffert, 1986).

- 5 -
ence and company-related circumstances. All of these questions can be answered objec-tively, the only exception being the characterisation of the typical equity fund managed. Inthe second part, participants are asked to assess the relevance of various behavioural op-tions that, in reverse sequence, mirror a stylised investment process. The framework forsuch a process is illustrated in Figure 9 (in the Appendix). For the questionnaire, the se-quence has been reversed in order to avoid “channelling” participants’ answers, startingwith the monitoring and compensation scheme and ending with basic views and objectives.All questions are closed ones, a necessity given the length of the questionnaire. Some an-swer categories are left to be specified by respondents so as not to exclude factors whichhad not been considered beforehand. Importantly, participants are given space at the end ofthe questionnaire for voluntary comments if they felt something critical had been leftunmentioned.2
At the end of July 2000, I sent out a total of 540 questionnaires to executive directors of 62German mutual fund companies. They had all been identified as managing equities inmixed or share-based funds that were either open to the public or for institutional clients orwere available to both types of customer. Also, all companies had been requested to specifythe number of fund managers engaged in equity investing, resulting in a total of 540. In theabsence of any official statistic, this is the best estimate of how many equity fund managerswere working in Germany at that time. Executive directors were asked to forward all ques-tionnaires received to every equity fund manager in the company. Each equity fundmanager thus had an equal opportunity to participate, with the result that the survey maybe deemed representative. To guarantee anonymity, I proceeded in a “mail-ballot” manner.Participants were asked to send the questionnaire back under separate, prepaid cover. Inde-pendently of that, they were able to confirm their participation by returning a prepaidpostcard with their addresses and company names. 89% of participants opted to do so.Hence in most cases I know who participated and where they work but I cannot associatequestionnaires with any of them.
By the beginning of September 2000 I had received 278 completed questionnaires from 60different companies, or 52% of all questionnaires sent out, from 97% of all mutual fundcompanies contacted. Only three questionnaires had to be cast aside because of gross in-completeness or obvious improprieties and doubts about the sincerity of answers.3 This canbe deemed an excellent result in itself but also when compared with a number of other sur-
2 Only very few participants added further comments, the vast majority of these providing extra informationand some further thoughts. Almost none, however, expressed discomfort about or a failure to understand thereasons for particular questions.
3 The maximum sampling error, calculated on the basis of these 275 valid questionnaires, is +/- 4%.

- 6 -
veys carried out in recent years among stock market investors or foreign exchange traders(Shiller and Pound, 1987, 1989; Shiller, 2000; Taylor and Allen, 1992; Menkhoff, 1998;Cheung and Wong, 2000; Cheung and Chinn, 1999; Freeman and Bartels, 2000). The par-ticipation rate may even be estimated to lie above 54% as some companies later reportedhaving initially submitted too high a number of equity fund managers owing to a failure toseparate investing adequately from distributional tasks. Total assets under management bythe survey’s respondents amount to some � 400 billion or 70% of all assets held in share-based and mixed mutual funds. One clear, if unavoidable, disadvantage of the survey set-up was the need for cooperation on the part of both executive directors and fund managers(Shiller and Pound, 1989). Indeed, some directors may have felt that a fair number offilled-out questionnaires from their company would have served perfectly well. Valuablesupport was given by the Bundesverband Deutscher Investment-Gesellschaften (Associa-tion of German Investment Companies) who appealed to its members to participate. Thiscertainly helps to explain why coverage of German mutual fund companies with equitybusiness was almost complete.
This type of coverage is very important if problems of selectivity among respondents are tobe ruled out. The survey results show that almost 71% of fund managers make decisions ontheir own responsibility, albeit in keeping with the investment strategy prescribed by themutual fund company or group; another 14% make joint decisions with their colleagues.Only 15% typically decide on their own without such a constraint. Here, what is most im-portant are fair rates of response from a pool which, ideally, would have included allcompanies, a condition which appears to have been proximately fulfilled. That selectivityis not so much of a problem manifests itself in another way as well. Managers were askedto rank their companies according to size. The corresponding shares of assets managed ineach of the resulting three categories very much resemble those that can be calculated onthe basis of the Bundesbank’s capital market statistics (see Table 17 in the Appendix).
4 Survey results
Information on the background, experience and company-related circumstances of equityfund managers are interesting in themselves, although not falling within the actual scope ofthis paper. Some key results are presented in Table 18 and Figures 6 to 8 (in the Appendix).Most notably, the typical German equity fund manager has, at age 35, spent a bit more thanfive years on the job and manages equities valued at some � 850 million. 59% of fundmanagers had earned a graduate university degree in economics or business administration,54% had undergone two to three-years of professional training in banking, most probablyas part of the dual-based German apprenticeship system, and 27% had received the profes-sional degree of certified financial analyst. The typical fund managing mandate exhibits a

- 7 -
distinct preference for blue chips. Fund managers describe their strategies to be, on aggre-gate, relatively growth-oriented and their analytical approach to be more bottom-up thantop-down. Index-tracking is seen to play a role. Next, the survey results are discussed inmore detail, starting with managers’ basic views and objectives, insofar applicable to thestylised investment process.
Market efficiency and investment philosophy
Whether fund managers pursue a more-or-less active or passive investment style is likely todepend on their philosophy. Passive investment strategies such as index-linked or index-related investments4 imply acceptance of the assumption that markets are largely informa-tion-efficient. On this assumption, the type of primary value creation which passive fundsoffer their investors represents a deliberate adaptation of a profit-risk profile through thediversification of risk. By contrast, active fund management attempts to achieve above-average returns, i.e. to “beat the market”. Thus the type of primary value creation whichactive funds try to offer their investors rests on the deliberate exploitation of suspectedcomparative advantages in the access to, and analysis of, information. It is only reasonableto assume this, if the distortions in market prices are sufficiently large to make the analysisof information worthwhile.
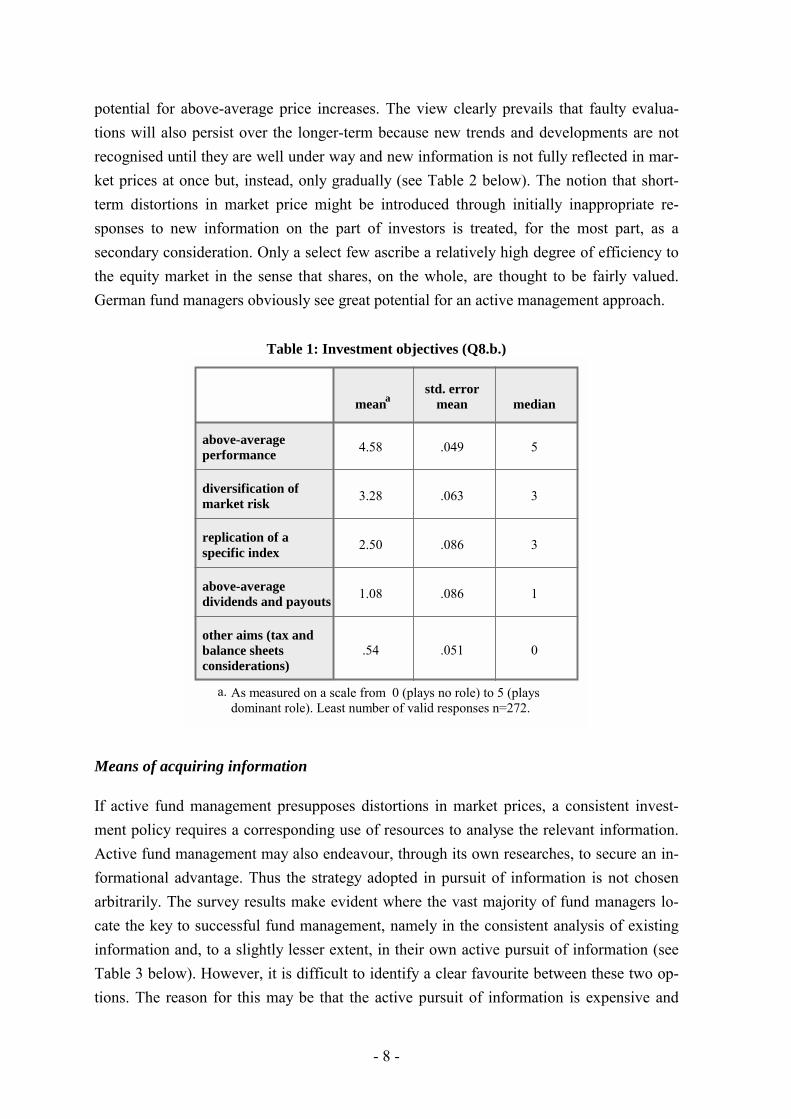
Whether active fund management can actually be expected to deliver extraordinary returnsis another story altogether. Even so, the fundamental convictions of institutional investorsconcerning their own capacity for value creation continue to influence their decisions. Thesurvey responses underscore the fact that German equity fund managers, in general, actu-ally perceive their primary role to consist in the pursuit of above-average market-priceincreases (see Table 1 below). Value creation through the implementation of diversificationstrategies - and implicitly through the replication of indices - evidently plays a significant,if subordinate, role. Dividends or other strategic considerations such as tax or balance-sheetadvantages tend, as a rule, to be unimportant.
With respect to the nature of markets, virtually all fund managers assume a lack of infor-mational efficiency, an assumption which is consistent with the objective of identifying the
4 In Germany, owing to legal portfolio share ceilings for individual securities it only became possible to in-troduce index funds which completely replicate such market indices as the DAX after the Third FinancialMarket Promotion Act took effect in September 1998. At the present time, index funds are subject to theprovisions of the statutory ordinance as set down in the Act on Investment Companies. The FederalBanking Supervisory Authority confirms that as of the end of 2000 permission had so far been granted toonly three specialised funds for the specific replication of market indices, but more than 30 funds are ex-pected to request such a permission in 2001.
- 8 -
potential for above-average price increases. The view clearly prevails that faulty evalua-tions will also persist over the longer-term because new trends and developments are notrecognised until they are well under way and new information is not fully reflected in mar-ket prices at once but, instead, only gradually (see Table 2 below). The notion that short-term distortions in market price might be introduced through initially inappropriate re-sponses to new information on the part of investors is treated, for the most part, as asecondary consideration. Only a select few ascribe a relatively high degree of efficiency tothe equity market in the sense that shares, on the whole, are thought to be fairly valued.German fund managers obviously see great potential for an active management approach.
Table 1: Investment objectives (Q8.b.)
4.58 .049 5
3.28 .063 3
2.50 .086 3
1.08 .086 1
.54 .051 0
above-averageperformance
diversification ofmarket risk
replication of aspecific index
above-averagedividends and payouts
other aims (tax andbalance sheetsconsiderations)
meanastd. error
mean median
As measured on a scale from 0 (plays no role) to 5 (playsdominant role). Least number of valid responses n=272.
a.
Means of acquiring information
If active fund management presupposes distortions in market prices, a consistent invest-ment policy requires a corresponding use of resources to analyse the relevant information.Active fund management may also endeavour, through its own researches, to secure an in-formational advantage. Thus the strategy adopted in pursuit of information is not chosenarbitrarily. The survey results make evident where the vast majority of fund managers lo-cate the key to successful fund management, namely in the consistent analysis of existinginformation and, to a slightly lesser extent, in their own active pursuit of information (seeTable 3 below). However, it is difficult to identify a clear favourite between these two op-tions. The reason for this may be that the active pursuit of information is expensive and

- 9 -
therefore also dependent on the fund manager’s institutional environment. I shall be de-voting more attention to this point later.
Table 2: Basic view on informational efficiency of stock market (Q8.a.)
70.0 22.0 8.1
22.3 57.5 20.1
7.7 20.5 71.8
100.0 100.0 100.0
most adequate
secondary
least adequate
personalranking
totala
frequency in %
gradual,longer-termprice adjust-
ments
short termprice
distortions
generallyfair-valued
equities
view on stock market
Least number of valid responses n=273.a.
Table 3: Strategic options for information management (Q7.b.)
40.1 43.1 15.7 1.1
37.6 32.8 27.4 2.6
20.1 22.3 51.5 5.8
2.2 1.8 5.5 90.5
100.0 100.0 100.0 100.0
most adequate
secondary
tertiary
least adequate
personalranking
totala
frequency in %
...by activelysearching for
newinformation.
...by subjectinginformation to
in-depthanalysis.
...by actingpromptly on
receipt of newinformation.
...as a matterof chance.
Above-average performance most likely to be achieved
Least number of valid responses n=274.a.

- 10 -
Rational investment decisions presuppose that information is an input variable. Evidencethat the potential for epidemic contagion exists among institutional investors may be foundby establishing preferences among information sources. Only three of the possible re-sponses in the questionnaire may be interpreted as primary information sources, thesebeing conversations with management and industry experts and the investment group’seconomic and company forecasts. All other information sources are second-hand and thusrepresent a means of transmitting informational contagion among investors or investorgroups (Shiller and Pound, 1989). They should, by contrast, be regarded to some extent asaccidental and unsystematic. Given the fact that these types of information are prepared inorder to be solicited, they also are, at least in part and from the very outset, the product ofgroup dynamics. Informational diffusion poses a risk to financial market stability since itmay elicit exaggerated and unbalanced market reactions, which cannot be counteracted, oronly partially, by fundamental arbitrage (Shleifer and Vishny, 1997).
Table 4: Information channels (Q7.a.)
4.08 .069 4
3.57 .061 4
3.46 .052 4
3.36 .066 3
2.95 .093 3
2.36 .073 2
2.33 .082 2
2.00 .070 2
1.05 .064 1
conversations/ exchanges of views withcompany executives and sector experts
conversations/ exchanges of views withprofessional colleagues
media publications
corporate earnings estimates by externalanalysts
corporate earnings estimates prepared byown investment company
economic forecasts by research institutes,banks and economic policy institutions
economic forecasts prepared by owninvestment company
portfolio investments of other marketplayers
investment news letters
meanastd. error
mean median
As measured on a scale from 0 (plays no role) to 5 (plays dominant role). Leastnumber of valid responses n=273.
a.

- 11 -
The survey indicates that fund managers consider their own conversations with manage-ment and with industry experts to be the most important source of information for theirwork (see Table 4 above). This finding supports the view that institutional investors wouldbe capable of exercising a special function in corporate governance. Given the increasingintegration of equity markets worldwide, it is worth noting that an integral part of the in-vestment strategies pursued by domestic fund managers is apparently local in orientation;this suggests the existence of specialisation effects.5 Alternatively, the survey results alsoindicate that “second-hand” reports, namely from professional colleagues and the mediaare, with second- and third-place rankings, of relatively great importance. One reason forthe importance attached to these channels might be that they implicitly provide fund man-agers, when ranking information, with external confirmation at the same time. Earningsprojections for public limited companies generally play a greater role than do economicforecasts, a circumstance which is hardly surprising because investment decisions on thestock market are taken primarily on the basis of bottom-up analyses. Still, it is the “second-hand” forecasts – notably, those by analysts from other investment firms, rather than thoseby analysts in the same company – which are most consulted. On the whole, observedportfolio investments by other market players are considered less significant but not ir-relevant. Thus, in the fund managers’ own estimation, a prerequisite for intentionallyaligned investment strategies applies.
Methods of stock analysis
Investment decisions can be considered well-founded only if they are taken on the basis ofrelevant information. If active portfolio managers proceed with their analysis of stocks in aconsistent manner, they should naturally gravitate towards those methods of analysis whichare in keeping with their basic conception of how the equity market functions, i.e. of howprice-efficient the equity market is. Technical analysis may be regarded as valuable whenapplied to markets where there is reason to believe that the adjustments of price to funda-mental supply and demand factors are relatively inelastic or where overreactions exist. Thismethod of analysis attempts to identify recurring - and hence predictable - trends in marketprices exclusively on the basis of past prices and trade volumes. By contrast, other analysisprocedures used to select stocks are usually thought to be more rigorous on account of theirunderlying economic models. However, they continue to belong, in essence, to the realm ofso-called quantitative methods insofar as they, too, are heavily dependent on past data.
5 Indeed, informational advantages due to corporate headquarter nearness have increasingly been consideredin the literature to explain pronounced home equity biases in institutional portfolios. Likewise, for equitytraders on the German exchange Xetra, Hau (1999) finds evidence in high frequency data that profits arepositively correlated with traders' geographic proximity to assets.

- 12 -
These procedures include not only the construction of efficiently diversified portfolios butalso single- and multi-factor models. Although the latter, when explaining price formation,have explicit recourse to forecast values by use of fundamental estimates, econometric es-timates of the model structures themselves are, by the very nature of the case, possible onlyon the basis of historical data. By contrast, fundamental analysis is, in its very conception,completely directed towards the future. This is because an attempt is being made to deter-mine the intrinsic value of an equity investment by forecasting trends in the determinants,corporate profits, dividends and interest rates, without first having to arrive at a structuralestimate of the corresponding equation of condition for this intrinsic value.6 However, ifexpectations are formed by extrapolation or on the basis of estimated structures, past dataimplicitly become relevant as well.7 Users of fundamental analyses are entitled to assumeadditional returns only if their evaluation schemes indicate that market prices do not fullyreflect generally accessible, relevant information.
Table 5: Methods of analysis and forecasting horizons (Q6.b.)
4.15 (46 weeks) .064 4
(51 weeks) n=272
(266)
2.61 (8 weeks) .096 3
(9 weeks) n=271
(228)
1.20 (23 weeks) .094 0
(26 weeks) n=272
(121)
1.12 (29 weeks) .091 0
(26 weeks) n=272
(127)
fundamental
technical
portfolio optimisation
econometric model
method ofanalysis(forecastinghorizon)a,b
meanstd. error
mean medianvalid numberof responses
As measured on a scale from 0 (plays no role) to 5 (plays dominant role).a.
Means of time estimated on a logarithmic basis.b.
6 In fundamental analysis, the usual valuation formulae such as the price-earnings ratio or the price-cashflow ratio mostly refer to the expected corporate earnings or operating result for the following fiscal year.Defined in the above terms, a value-oriented investment approach favours shares with low valuation whilea growth-oriented approach favours stocks with significant potential for earnings growth. This is more of apractical distinction and indicates, in each case, a basic preference for certain risk categories since the ac-tual purpose of fundamental analysis is to value all expected future earnings.
7 For company and macroeconomic analyses it is, of course, conceivable that estimates for underlying fac-tors, upon which intrinsic values are calculated, are themselves based on econometric models. However,as to the typical work of a fund manager, estimating single or multiple factor models serves to predictequity returns, not underlying factors themselves.

- 13 -
In practice, portfolio managers tend to employ different evaluation strategies at the sametime; quantitative instruments may be used, for example, to preselect securities out of aninvestment universe while individual choices are ultimately made in accordance with theresults of fundamental analysis (Bruns and Meyer-Bullerdiek, 1996). Perhaps fundamentalanalyses are especially well-suited to identifying the returns potential over the longer termwhereas quantitative methods find their primary use in the analysis of short-term fluctua-tions. This would explain why the overwhelming majority of foreign exchange marketplayers, when questioned by Taylor and Allen (1992), indicated using instruments of tech-nical analysis in conjunction with fundamental forecast methods. Technical analysispredominates in the preparation of short-term forecasts; fundamental criteria were moreimportant for longer-term estimates. The results of the present survey confirm that methodsof technical and fundamental analysis are not applied in a mutually exclusive manner butdiffer rather in terms of the time horizon for the forecasts produced (see Table 5 above).That having been said, fundamental analysis plays the more important role by far in every-day practice; the choice of a medium-term time horizon of roughly a year suggests thatfund managers concentrate on corporate earnings estimates for the financial year to come.
Pro-cyclical, trend-reinforcing behaviour
Do fund managers tend to act pro-cyclically and, in doing so, accelerate market momentumor do they act anti-cyclically and thus dampen market fluctuations? Great importance hasbeen attached to this question in the debate on financial market stability (Jegadeesh andTitman, 1993; Grinblatt, Titman, and Wermers, 1995). One thesis is that private investorsgenerally tend to act pro-cyclically and, collectively, may therefore trigger exaggeratedmarket price movements; by contrast, institutional investors would, through deliberate anti-cyclical behaviour, exercise a compensatory function which would serve to stabilise thecapital market.8
Some explanations of procyclical behaviour invoke the possibility that investors undertakerevaluations only gradually.9 Momentum strategies, i.e. shifts into those stocks for which
8 See Bundesverband der Deutschen Investmentgesellschaften on the economic benefits of investment fundsaving (2001) www.bvi.de/tourdefonds/volkswirt_funktionen.html.
9 Barberis, Shleifer and Vishny (1998) summarise a whole series of more recent empirical studies whichsupport the hypothesis that full market price adjustments may require a period of up to 12 months andoverreactions a period of between three and five years. Their explanatory scheme incorporates psycho-logical concepts having to do with conservatism and representative heuristics, which imply quasi-rationalreactions on the part of financial market players. For more on this see also Menkhoff (1995). According tothis theory, the rationality of investors is not only subject to cognitive constraints - as the expected utilitytheory in economics has traditionally taught - but is also prey to emotions (e.g. greed and fear) which col-our their responses. What is meant by conservatism in this case is that human beings, when confronted
- 14 -
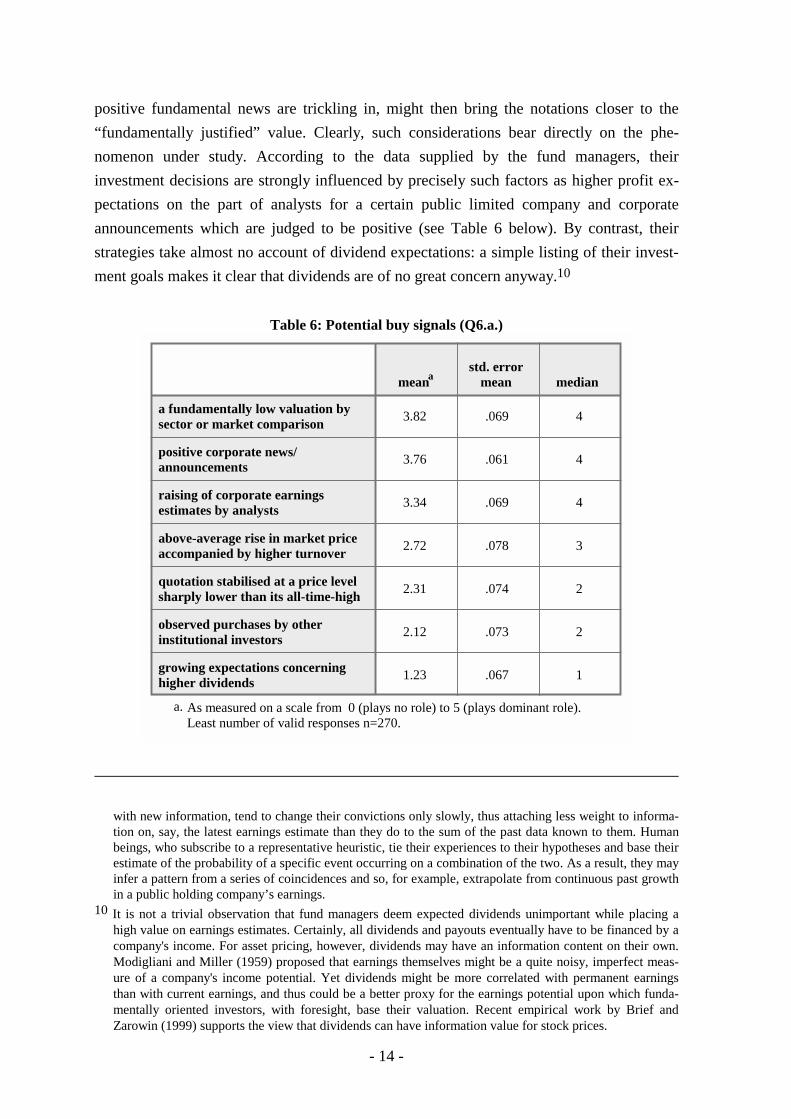
positive fundamental news are trickling in, might then bring the notations closer to the“fundamentally justified” value. Clearly, such considerations bear directly on the phe-nomenon under study. According to the data supplied by the fund managers, theirinvestment decisions are strongly influenced by precisely such factors as higher profit ex-pectations on the part of analysts for a certain public limited company and corporateannouncements which are judged to be positive (see Table 6 below). By contrast, theirstrategies take almost no account of dividend expectations: a simple listing of their invest-ment goals makes it clear that dividends are of no great concern anyway.10
Table 6: Potential buy signals (Q6.a.)
3.82 .069 4
3.76 .061 4
3.34 .069 4
2.72 .078 3
2.31 .074 2
2.12 .073 2
1.23 .067 1
a fundamentally low valuation bysector or market comparison
positive corporate news/announcements
raising of corporate earningsestimates by analysts
above-average rise in market priceaccompanied by higher turnover
quotation stabilised at a price levelsharply lower than its all-time-high
observed purchases by otherinstitutional investors
growing expectations concerninghigher dividends
meanastd. error
mean median
As measured on a scale from 0 (plays no role) to 5 (plays dominant role).Least number of valid responses n=270.
a.
with new information, tend to change their convictions only slowly, thus attaching less weight to informa-tion on, say, the latest earnings estimate than they do to the sum of the past data known to them. Humanbeings, who subscribe to a representative heuristic, tie their experiences to their hypotheses and base theirestimate of the probability of a specific event occurring on a combination of the two. As a result, they mayinfer a pattern from a series of coincidences and so, for example, extrapolate from continuous past growthin a public holding company’s earnings.
10 It is not a trivial observation that fund managers deem expected dividends unimportant while placing ahigh value on earnings estimates. Certainly, all dividends and payouts eventually have to be financed by acompany's income. For asset pricing, however, dividends may have an information content on their own.Modigliani and Miller (1959) proposed that earnings themselves might be a quite noisy, imperfect meas-ure of a company's income potential. Yet dividends might be more correlated with permanent earningsthan with current earnings, and thus could be a better proxy for the earnings potential upon which funda-mentally oriented investors, with foresight, base their valuation. Recent empirical work by Brief andZarowin (1999) supports the view that dividends can have information value for stock prices.
- 15 -
An above-average rise in market price, accompanied by increasing turnover, is generallyregarded as a clear buy signal from a chart-analytical standpoint. By contrast, a notationthat has stabilised at a level markedly lower than its peak values represents an anti-cyclicalbuying opportunity since a reversal of the trend is expected on the basis of support levelshitherto sustained (Pring, 1998). As a rule, fund managers attach significantly less impor-tance to these two technical buy signals than to fundamental criteria as such, which is notaltogether surprising, given that the fund managers interviewed thought fundamental analy-sis much more relevant (see Table 5 on page 12).
The response option where fund managers regard a fundamentally low valuation in cross-market or cross-sectoral comparison as a buy signal is the only option which does not as-sume some form of momentum. Instead it implicitly depends on the crossing of a certainminimum threshold. Strictly speaking, only this type of response is likely to be adopted byinvestors who are exclusively acting in a fundamental and anti-cyclical style. In point offact, this criterion does, on average, have a narrow lead over the others when the fund man-agers are deciding on stocks.
Further valuation criteria governing stock choices
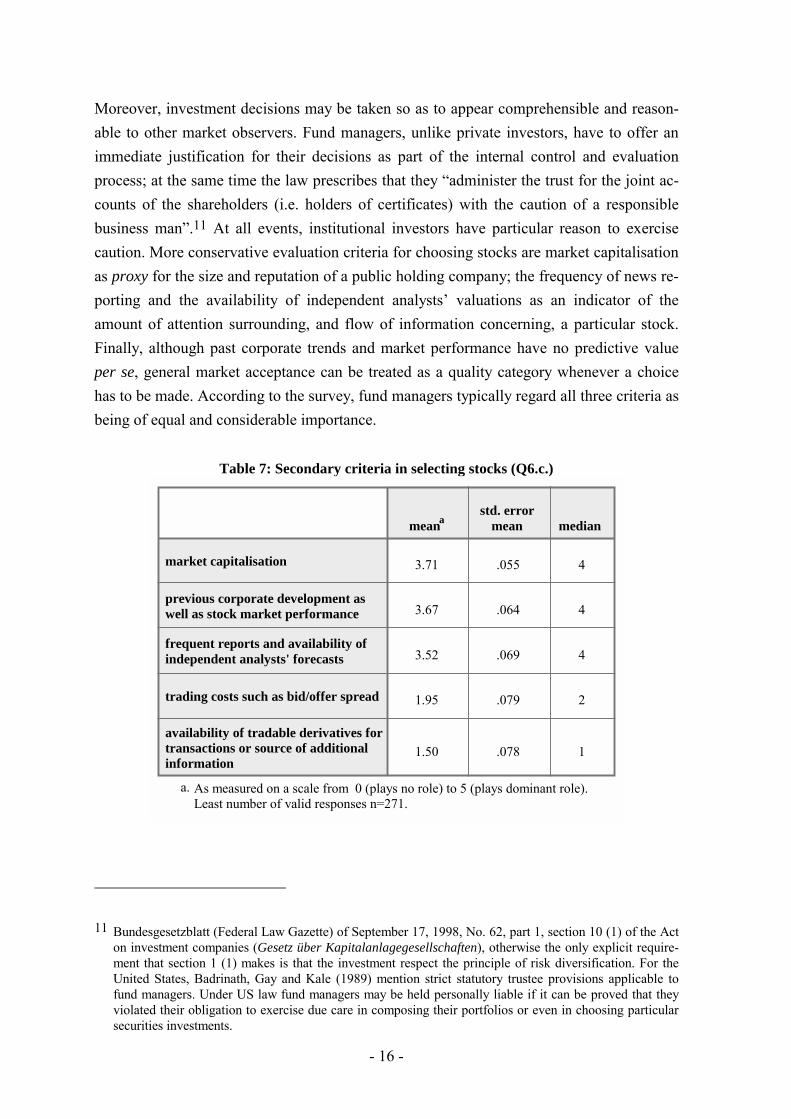
If institutional investors have other investment preferences than do private investors, theongoing intermediation with regard to stock investments will also have a corresponding ef-fect on relative market prices (Friedman, 1995). Several studies on institutional investmentbehaviour, especially by US investment funds, suggest that fund managers make a deliber-ate effort to meet certain secondary criteria. There is, for example, a well-documentedpreference for large, liquid assets (Falkenstein, 1996; Gompers and Metrick, 1998). Onetype of criteria relevant to the choice of portfolio holdings includes all stock characteristicswhich, in the eyes of the fund manager, influence indirectly the expected profit-risk profileof a portfolio. Thus high liquidity in securities trading lowers the transaction costs whilederivatives may enable risk transformation and offer, in principle, additional informationon market expectations and uncertainty. Such key stock characteristics probably only beginto come into their own when the large volumes and the more complex trading and hedgingstrategies of institutional investors have been reached. Even so, the fund managers sur-veyed assigned trading costs, as measured by the bid/offer spread, as well as the availabilityof tradable derivatives only a far secondary status (see Table 7 below). Although thebid/offer spread is regarded as an indirect measure of secondary market liquidity, adversetrading effects arising from a lack of market depth might perhaps, with even more justifi-cation, have been subsumed under the criterion of market capitalisation, which is deemedvery relevant.
- 16 -
Moreover, investment decisions may be taken so as to appear comprehensible and reason-able to other market observers. Fund managers, unlike private investors, have to offer animmediate justification for their decisions as part of the internal control and evaluationprocess; at the same time the law prescribes that they “administer the trust for the joint ac-counts of the shareholders (i.e. holders of certificates) with the caution of a responsiblebusiness man”.11 At all events, institutional investors have particular reason to exercisecaution. More conservative evaluation criteria for choosing stocks are market capitalisationas proxy for the size and reputation of a public holding company; the frequency of news re-porting and the availability of independent analysts’ valuations as an indicator of theamount of attention surrounding, and flow of information concerning, a particular stock.Finally, although past corporate trends and market performance have no predictive valueper se, general market acceptance can be treated as a quality category whenever a choicehas to be made. According to the survey, fund managers typically regard all three criteria asbeing of equal and considerable importance.
Table 7: Secondary criteria in selecting stocks (Q6.c.)
3.71 .055 4
3.67 .064 4
3.52 .069 4
1.95 .079 2
1.50 .078 1
market capitalisation
previous corporate development aswell as stock market performance
frequent reports and availability ofindependent analysts' forecasts
trading costs such as bid/offer spread
availability of tradable derivatives fortransactions or source of additionalinformation
meanastd. error
mean median
As measured on a scale from 0 (plays no role) to 5 (plays dominant role).Least number of valid responses n=271.
a.
11 Bundesgesetzblatt (Federal Law Gazette) of September 17, 1998, No. 62, part 1, section 10 (1) of the Acton investment companies (Gesetz über Kapitalanlagegesellschaften), otherwise the only explicit require-ment that section 1 (1) makes is that the investment respect the principle of risk diversification. For theUnited States, Badrinath, Gay and Kale (1989) mention strict statutory trustee provisions applicable tofund managers. Under US law fund managers may be held personally liable if it can be proved that theyviolated their obligation to exercise due care in composing their portfolios or even in choosing particularsecurities investments.

- 17 -
Methodology of decision-making
When formulating strategies, information is processed for the purpose of reaching deci-sions. But it is not only of interest to know which information sources and methods ofanalysis have been used in the process but also the manner in which the manager actuallyarrives at his valuations and acts on them. The choice of a valuation procedure already ap-pears to commit the decision-maker to a specific selection process since he primarilyprocesses information that is directly relevant to the decision itself. Nevertheless informa-tion-processing and the methodology of decision-making are two components within aprocess which may, in principle, be distinguished from one another.
This becomes evident in the case of a fund manager confronted with an investment deci-sion. Fund managers are intensely competitive in responding to markets. They are underpressure to take investment decisions quickly, even in the face of great uncertainty. Simul-taneously, they have access to a veritable wealth of potentially relevant information.Competition at the workplace further increases the pressure to perform. The findings of be-havioural science indicate that human beings under such working conditions tend tosimplify the decision task in line with their experiences and means.
Indeed, every person has cognitive limits, i.e. a constraint to absorb and process informa-tion only up to a certain point. Such limits bind utility-maximising rationality, asconventionally conceived in economics. What is more, the investment-making process in-cludes quasi-rational motives, which satisfy psychological needs (Menkhoff, 1995). In thelatter case, the paramount need is likely to be the desire to continue being able to decide atall, followed by the desire to control actions and to minimise cognitive dissonance, for ex-ample, with regard to previous decisions (Shefrin and Statman, 1985).
This being the case, one means of facilitating decision-making is to rely on proven organ-isational patterns to structure the surfeit of information (which, in any case, for a fund isalready restricted to the investment universe). Beyond that, the decision-making processmay itself be structured. In this way, prior commitment to a specific form of informationanalysis may offer an efficient means of simplifying complex choice processes. As a con-sequence, valuation procedures need not be devoted exclusively to the purpose ofvalidating suspected above-average earnings potential; they may also serve to organise newinformation into pre-determined patterns and, in doing so, greatly streamline the decision-making process. Moreover, trading strategies that are based on fixed valuation procedures,i.e. strictly rule-based investment decisions, are equally well-suited to reduce the psycho-logical costs associated with complex decisions. Not only are investors most likely subjectto cognitive restraints but they are also presumably prey to emotions such as euphoria and

- 18 -
defeatism, greed and fear. Thus a binding pre-commitment to definite decision-makingprocedures may also help to reduce the influence of emotional factors during periods ofgreat uncertainty.
Consistent with this train of thought, it is, in fact, a major management responsibility in in-stitutional asset investing to position the decision-making process between a rules-boundand a purely discretionary policy. Further evidence in support of this view may be found inthe fact that investment consulting firms, which are increasingly being commissioned bybanks and insurance companies to choose suitable asset managers, evidently place greatemphasis on consistent and rigorously implemented investment strategies (Dietz and Leser,1998). The corresponding advantage ascribed to the rule-based decision procedure, whichin ordinary practice is referred to as structured portfolio management, is that it enables theestablishment of a systematic, comprehensible and relatively emotion-free investment pro-cess. Here quantitative analyses are mainly used (Marquardt and Sauer, 1999). Possibledrawbacks arising from its reliance on past data, which means that it is inevitably tied toempirical circumstances, are rated lower accordingly. However, reduced flexibility in deci-sion-making, or discretionary latitude, incurs a cost of its own. It may result in non-optimaldecisions whenever unexpected factors and structural discontinuities originating in the firmor in the overall economy intervene.
Figure 1: Decision-making process (Q5.a.)
Analysis standardised or contingent upon situation. Decision-making
discrete or rule-bound. Valid responses n=273.
22,7%
30,0%47,3%
standard./rule-bound
standard./discretecontingent/discrete

- 19 -
The survey results show that almost one-half of the fund managers reserve for themselvesthe greatest possible degree of flexibility when taking an investment decision (see Figure 1above). They tend to analyse stocks in a manner dependent on the current situation, comingto a general judgement only after a personal appraisal. Almost one-third of the managerssurveyed made such discretionary judgements, albeit only after systematic analysis. Ac-cording to the data collected, only slightly more than one-fifth of the fund managers engagein systematic analysis and then apply a fixed decision rule.
Hedging and risk management strategies
Further investment decision rules may be inferred from strategies designed to limit marketrisks. Only funds which gear their investment strategies consistently to changes in the indi-ces can be said to have no conscious interest in shifting market price risks. This does notapply, however, to passive investors in general. Their task might precisely consist inachieving a certain risk-profit profile through the adoption of strategic measures. Index op-tions, for example, are suitable instruments for managing market portfolio risks since theyare usually relatively liquid and – on account of the lower volatility of indices – relativelycost-effective (Bruns and Steiner, 1995). By contrast, active fund management attempts toachieve above-average earnings from stock market investments by intentionally deviatingfrom the market portfolio.12 In so doing, portfolio managers may be seeking to neutralisesystematic risk in order to profit, independently of the general market trend, from suspectederrors in the valuation of specific stocks. Fund managers typically employ futures contractsto this end (Bodie, Kane and Marcus, 1996). The survey results indicate that derivatives areused more for hedging purposes and less as a means of flexibly building or dismantling aportfolio position. Even so, German equity fund managers do not attach great importanceto hedging strategies based on options and futures in their everyday dealings (see Table 8below).
Dynamic hedging strategies are intended to limit losses in the portfolio’s value in the eventof a general market downturn while simultaneously allowing the portfolio to profit frommarket-price changes. The share held in stocks is adjusted in accordance with the trend inmarket prices to ensure that the portfolio does not fall below a specific minimum value. Ifstock market prices rise, the cost of hedging will drop, it being less likely that the floor will
12 This assumption is justified by the fact that betting against the market, i.e. the attempt to exploit fluctua-tions affecting the entire market gainfully, entail a very much higher risk since, by definition,opportunities for diversification are lacking. Institutional investors find it very difficult to time such deci-sions properly.
- 20 -
be reached. A greater proportion of the funds will then be invested in stocks. Conversely, ifstock market prices fall, larger collateral provisions will be accumulated and the share ofstocks in the portfolio will be correspondingly reduced (Bruns and Steiner, 1995). On ac-count of the implied pro-cyclical investment behaviour, such dynamic portfolio hedgingstrategies have been accused of exerting a destabilising effect on stock market price trends,especially since the stock market crash of 1987.13 To judge from the data supplied by thefund managers surveyed, such rules do not play a significant role here to date; instead, fundmanagers freely adjust the ratio of stocks to cash in their portfolios, depending on theirreading of the general market situation.
Finally, stop-loss rules are a very simple heuristic for decision-making. They are used toprotect value of individual stocks, where a drop in market price to or below the pre-determined level leads to the abandonment of the corresponding position. Stop-loss strate-gies are thus static and path-bound and, as such, compatible with technical stock analyses.It is not the gathering of new and fundamental information which prompts the decision butrather the market development itself. Generally speaking, the fund managers surveyed alsoconsidered this rule to be of minor relevance.
Table 8: Risk management techniques (Q5.b.)
3.06 .094 4
2.16 .097 2
1.61 .084 2
1.40 .089 1
1.02 .084 0
flexible weighting of cash andshares
hedging by means of optionsand futures
stop-loss techniques
futures and options as flexible vehicles for acquiring andselling stocks
dynamic portfolio hedging rules
meanastd. error
mean median
As measured on a scale from 0 (plays no role) to 5 (plays dominantrole). Least number of valid responses n=272.
a.
13 Genotte and Leland (1990) provide an overview on this topic and argue that portfolio hedging strategiescan have destabilising effects on markets even if they are not widely used.

- 21 -
Appreciation of risk
One of the criticisms that has been directed against the Capital Asset Pricing Model is re-lated to the symmetric character of the concept of risk underlying it (Eakins, Stansell andBelow, 1996).14 However, the results of surveys where corporate finance executives wereasked about their appreciation of capital investment risk suggest that the perception ofdownwards risk, i.e. the danger of failing to attain certain target variables, is more pro-nounced (Brocket, Cooper, Kwon and Ruefli, 1997). The assumption that the asymmetricperception of risk plays a not inconsiderable role in the formulation of investment strate-gies applies to fund managers. Unlike private investors, they take their decisions asmembers of organisations with routine performance controls. Thus one of their investmentaims is not to lag behind other fund managers with comparable investments. However, in-dices or other comparative criteria do not suffice if the investments shall also guarantee acertain minimum return.15 Given the statistically abnormal distribution of stock marketreturns, which is well-confirmed empirically, it is safe to assume that the perception of riskwhen valuing stocks leads, in each case, to their being assigned different rankings.16
Only on one point do the survey results send an unequivocal message: risks arising fromforegone opportunities, conceivable in the light of fears that the distribution of informationin the market is asymmetric, play a subordinate role. As for the rest, the primary risk wasmost often perceived by fund managers as being one of underperformance, followed byprice volatility and market price losses. Still, for each of the three types of risk, a majorityof the fund managers did not agree with the ranking most often chosen (see Table 9 below).
14 In modern portfolio theory, the predicted dispersion of returns (standard deviation) from stock market in-vestments represents a valid measure of their total risk while the estimated contributions of individualsecurities to a market portfolio return variance (betas) are a relevant measure of security-specific risks.
15 The fund owner might have instigated this agreement in the expectation that he would be able to redeemliabilities. This is sometimes a relevant consideration for institutional clients such as banks and insurancecompanies.
16 Babak, Pedersen and Satchell (2000) propose as relevant capital market measures for earnings risk thevariance, the semi-variance and the lower partial moment. While the variance construes the entire standarddeviation of the expected return as earnings risk, above-average results are not included in the case ofsemi-variance. Semi-variance is thus an asymmetric measure of “downwards risk”. The lower partial mo-ment is defined in the same manner as semi-variance, with the risk-relevant area under considerationbeginning below a fixed parameter.

- 22 -
Table 9: Personal notion of investment risk (Q5.c.)
7.5 25.8 31.2 36.4
13.4 26.6 37.9 21.6
20.9 30.6 20.1 27.9
58.2 17.0 10.8 14.1
100.0 100.0 100.0 100.0
mostadequate
secondary
tertiary
leastadequate
personalranking
totala
frequency in %
foregoneinvestment
opportunitiessignificantprice losses
considerableprice
fluctuations
danger ofunderper-formance
Least number of valid responses n=269.a.
Institutional aspects of incentives and performance control
Basically, every time the responsible party delegates authority for certain actions – in thiscase equity investments – there is a corresponding need on his part not only to offer hissubordinates incentives conducive to the attainment of the desired goal but, in the end, tocontrol their actions as well. Depending on how stringent they are, incentive-building andcontrol measures may be expected to influence investment decisions (Baker, 1998). In thetheoretical literature on capital markets, principal-agent approaches, which show that coor-dinated group behaviour among institutional investors can be optimal, are based onremuneration incentives and signal effects relating to excellence in fund management(Roll, 1992; Brennan, 1993; Maug and Haig, 1995).
Effectively, a mutual fund investment company with a graduated commission businessfinds itself in a twofold principal-agent situation. On the one hand the company as such isagent for the investing client. Rational clients prefer, for their part, fund certificates fromwhich they expect opportune return-risk ratios. Their interest often centres on funds whichhave previously achieved above-average gains in value.17 On the other hand the companyacts as a principal in organising its own internal affairs, designing a remuneration structure
17 An empirical observation from the United States (Sirri and Tufano, 1992): The flow of capital into fundsis more sensitive to the most recently observed increase in value than the flow of capital out of funds is tothe most recently observed instance of underperformance.
- 23 -
which is to encourage fund managers to take portfolio decisions aggressive enough to makeabove-average returns possible; in so doing, however, fund managers should not incur un-due risk, i.e. they should not, as a matter of policy, pursue potentially higher returns bytaking greater risks. Thus, from the standpoint of a mutual fund company, effective riskmanagement leads to a desired, optimal degree of risk within each product segment.18
The portfolio manager’s incentive to deliver an above-average performance may be definedin terms of the expected value of the advantages which accrue to him thereby. These in-clude increased job security, possibly a bonus and/or other positive prospects (promotion).By contrast, a performance that is significantly under par would rule out the possibility ofadditional income and quite possibly jeopardise the portfolio manager’s position and pro-fessional advancement as well.
A simple reflection based on a model extending over two time-periods will illustrate the ef-fect which the incentive system may have on investing. On accepting an asset managementassignment, a fund manager receives a basic salary G. He cannot lose this money as long ashe opts for a passive strategy that replicates the index. Only if he pursues an active strategy,however, can he hope to earn the bonus B – and even then only if he tops a previouslyagreed benchmark (index). If it is assumed that stock markets are price-efficient in a strongsense, then the likelihood of this outcome obtaining, p, is exactly ½. Thus the expectedpayment flow for an active strategy is G+ ½ B. If the assignment is limited in advance to asingle time-period, a fund manager will always choose the active strategy since G+ ½ B >G. The reason for the latter is that the portfolio manager incurs no costs for missing his tar-get, i.e. for underperforming the index. If, however, by mutual agreement, the assignmentwill be renewed for a second period only if the goal for the first period has been met, thenthe total expected payment flow for both assignment periods will be result by adding½ (G+ ½ B). Thus the probability is ½ that the fund manager will no longer have the as-signment in the subsequent period. That being the case, will he once again decide in favourof an active strategy? That depends entirely on the size of the bonus. In the example cited,the bonus would have to amount to more than 2 /3 of the basic salary. Recursion over alarger period number t yields [1+p(B/G)]/(1-p)>t as the universally valid condition for ac-tive investment strategies. The willingness to pursue an active strategy is criticallydependent on two (three, depending on how t is counted) factors, i.e. the bonus in % of the
18 Orphanides (1996) examines risk management and compensation factors indirectly. He interprets thepresence of seasonal effects in the changes in value of US investment funds as a sign that compensationincentives influence the risk tolerance of professional investors. Chevalier and Ellison (1995) present evi-dence that mutual fund companies react to implicit incentives given by the relationship between fundperformance and subsequent investment flows by changing risk toward the end of year.

- 24 -
basic salary and the portfolio manager’s own judgement as to whether he can surpass a pre-determined benchmark.
How relevant are these considerations to German equity fund management, as usuallypractised? The survey results indicate that, within the investment company, the perform-ance of fund managers is reviewed every three months on average to ascertain changes inthe value of the investible funds entrusted to them. However, the average value is mis-leading in that it masks considerable differences (see Figure 10 in the Appendix).Benchmark indices are clearly the preferred means of identifying individual contributionsto fund performance (see Table 10 below). Risk-adjusted measurements of performancerarely use formal measures such as Jensen’s alpha, or Information-, Sharpe- and Treynor-ratios. Instead, it is apparently much more common to take comparable funds as a measure.Absolute fund performance does play a role, albeit a subordinate one. The salaries of al-most all fund managers include performance-based components, and for the vast majorityof these managers, the performance-based components are in the order of up to 60 % oftheir gross basic annual salary, with 30% being the median (see Figure 2 below). Normallythe primary criterion for bonus awards is relative performance (see Table 11 below). But,notably, a subjective evaluative criterion, namely in-house appraisals by colleagues and su-periors, is also quite important. On average, criteria which are more closely tied to themarketing success of the investment company’s product, such as corporate profit, influx offund monies, customer satisfaction, or the acquisition of new customers (in the specialisedfund business), are used less often as a basis for assessment. Yet, these criteria were theonly ones among all the six-tier Likert-scaled categories in the questionnaire to show a bi-modal frequency distribution. This means that a comparatively large number of fundmanagers considered these criteria to be either irrelevant or significantly relevant. I shall bereturning to this point later.
- 25 -
Table 10: Evaluation criteria for fund performance (Q4.b.)
4.49 .049 5
3.15 .092 3
2.24 .089 2
1.67 .087 2
.15 .044 0
performance differential to relevantmarket or sector index
performance of comparable funds
fund's absolute performance
risk adjusted measures of relativeperformance, e.g. Jensen's alpha
b
other measuresc
meanastd. error
mean median
As measured on a scale from 0 (plays no role) to 5 (plays dominant role).Least number of valid responses n=270.
a.
Further measures included: Information-, Sharpe-, Treynor-ratios.b.
Interpreted as irrelevant whenever left blank while all other categoriescrossed.
c.
Figure 2: Bonus awards as % of annual gross basic salary (Q4.c.)
Mean bonus award 31,7% (on logarithmic base); median 30%.
Valid responses n=272.
bonus not specified61% and more
41 to 60%31 to 40%
21 to 30%up to 20%
principally no bonus
30,0%
25,0%
20,0%
15,0%
10,0%
5,0%
0,0% 2,2
11,011,410,3
27,9
24,3
12,9

- 26 -
Table 11: Bonus award criteria (Q4.c.)
3.79 .097 4
3.37 .092 4
2.38 .106 3
2.23 .113 2
1.81 .099 2
fund's relativeperformance
in-house appraisal bycolleagues or superiors
promotion of fund inflows/profitability of company
marketing aspects likecustomer satisfaction andacquisition of new clients
fund's absoluteperformance
meana,bstd. error
mean median
As measured on a scale from 0 (plays no role) to 5 (playsdominant role).
a.
Least number of valid responses n=235. Fund managers receivingbonus awards total 237.
b.
5 In search of some fundamental consistency among fund managers
The next step of analysis involves the use of bivariate correlations to determine whetherfund managers, as a whole, exhibit some fundamental consistency in investment policiesimplemented, objectives chosen and notion of market efficiency assumed. The rationalebehind the search for internal consistencies in the behavioural patterns of fund managers istwofold. First, the search allows the authenticity of responses to be checked with regard totheir economic plausibility. One major concern with survey data analysis is that respon-dents might give one answer but do or mean something else entirely. If this were, onaggregate, the case, then, given the multitude and complex nature of the questions in thissurvey, one might expect to detect gross inconsistencies. Second, consistent behaviour onthe part of fund managers appears to be a key to group efficiency and thus to their possiblystabilising role on the markets. To see this point, one might conceive of a situation inwhich fund managers with ample research resources assume efficient stock market pricesand discard presumably superior first-hand-information to track indices or otherwise mimicmarket participants. By the same token, managers with scarce resources and second-hand-information might do just the opposite. This scenario would clearly run counter to the pic-

- 27 -
ture of investment professionals’ effectively contributing to the market’s information con-tent.
Table 12: Investment approach and notion of market efficiency
-.339**
-.172** .179**
-.251** .275** .643**
generally fair stock prices
degree of indextracking
indexreplication as
objective
investmentapproach
Spearman rank correlationcoefficients
gradualprice
adjustments
generallyfair stock
prices
basic view on marketnature
degree ofindex
tracking
Correlation is significant at the 0,01 level (one-tailed test). Leastnumber of valid responses n=267.
**.
Certainly, consistency implies that active fund managers noticeably pursue price inefficien-cies the exploitation of which is, in essence, their task. More passive managers, by contrast,are expected to consider markets less inefficient. The survey data reveal that such an asso-ciation does indeed exist (see Table 12 above). As a proxy for the passivity versus activityof fund management, I use the perceived degree of index tracking, as derived from the de-scription of the managers’ typical fund, and, alternatively, the rating on index replication asan investment goal. The two measures are themselves highly correlated, which makessense. High ratings for the notion of fairly efficient equity market prices accompany a morepassive investment approach, whereas the approach becomes more active the greater thebelief in price inertia. These correlations are all highly significant, albeit not very pro-nounced, indicating that a straight-line relationship cannot be assumed to hold.
Consistency further implies that fund managers who typically seek to outperform the mar-ket through their own investigative efforts also rate information obtained first-hand as moreimportant and, consequently, analyse it in a fundamental manner. The existence of such abehavioural pattern cannot be rejected on the basis of correlation analysis, even if technicalanalysis and portfolio investments of other market participants are taken into account (seeTable 19 in the Appendix).

- 28 -
Table 13: Company size, resources and use of privileged information
.173**
.045 .243**
.324** .087 .283**
.145* -.025 -.028 .505**
mutual fund company size
corporatemanagement, sector
experts (1)
corporate earningsforecasts of
investment group (2)
economic forecastsof investment group
informationsources
b
Spearman rank correlationcoefficients
number ofanalysts and
portfoliomanager in the
investment groupa
mutualfund
companysize (1) (2)
Correlation is significant at the 0,01 level (one-tailed test).**.
Correlation is significant at the 0,05 level (one-tailed test).*.
Least number of valid responses n=209.a.
Least number of valid responses n=271.b.
As information is costly, efficiency implies a positive association between the resourcescommitted to market and stock analyses and asset management by mutual fund companiesand the portfolio managers’ investment approaches. This is consistent with the existence ofseveral arbitrage equilibria in a stock market where prices are never completely informa-tionally efficient, with the result that exploitation of the remaining inefficiencies producesenough profits to just cover the expense involved in discovering them (Grossman and Sti-glitz, 1980). Do fund managers in large investment companies with ample researchresources then behave consistently, using available informational input in an appropriatemanner? Indeed, the larger the research resources within an investment group are, whenproxied by the number of equity analysts and fund managers, the more relevant fund man-agers find their groups‘ own economic forecasts and, in particular, company estimates.Although the size of mutual fund companies is positively correlated with these research ca-pacities to a slight degree, these two categories certainly need to be regarded separately. InGermany, a small subsidiary of a fairly large foreign financial institute may, for example,have broad access to very proficient capital market research. However, there is a positiverelationship between mutual fund company size on a national scale and the propensity tointerview corporate executives and sector experts, while research resources seem unrelatedto the latter (see Table 13 above). Fund managers working in an investment company witha rather large share in the local market are not necessarily better informed, but their role

- 29 -
seems to change a bit as they are more likely to inform themselves directly while invokingsome form of discretion under corporate governance. It is for this reason, perhaps, that pas-sivity in equity investing appears to be negatively correlated with both research resourcesand size (see Table 20 in the Appendix). Furthermore, fund managers in companies withless local market share and less research and investment are less inclined to pursue re-search-intensive bottom-up investment approaches but rather assemble portfolios accordingto top-down criteria, suggesting that fund managers in the aggregate do behave in a quiteconsistent manner.
In the next section the focus shifts to response variations among fund managers. I identifythree core groups and summarise the main aspects of their investment behaviour, thus de-tecting universal versus group-specific factors in equity fund investing.
6 A clustering of investors according to their behavioural patterns
At the two extremes, an exploratory analysis of the survey data would reveal either that allequity fund managers follow a quite similar investment approach, or that they all behavevery differently. Presumably, however, it should be possible to establish core groupingsamong fund managers according to their behavioural patterns. A longstanding concern inthe finance literature on market stability centres on the limits and existence of fundamentalarbitrage (Shleifer and Vishny, 1997). Given their resources and know-how together withtheir apparent belief in exploitable market inefficiencies, as evidenced by our survey data,professional fund managers ought to be more apt than any other market player to help en-sure that the prices on equity markets remain anchored to values calculated on the basis ofa balanced assessment of fundamental information. For this reason, we are interested inwhether the survey data enables a subgroup to be identified which resembles fundamentalarbitrageurs or, at least, demonstrates a certain potential which would enable them to bequalified as such. There is also a second rationale behind the search for core groups of fundmanagers. Institutional investors are often said to have specific preferences and investmentstyles (Badrinath, Gay and Kale, 1989; Falkenstein, 1996). If so, which of them appear tobe universal for professional equity investors and which of them specific to certain sub-groups?
Given the existence of comprehensive survey data, it is possible to investigate equity in-vestors’ behaviour using market research instruments which are conventionally applied toother groups of buyers, e.g. households in product markets. Where information on groupmembership or on the number and size of groups is unavailable, cluster analysis is the pri-mary tool for grouping cases on the basis of measured distances - in this case, between

- 30 -
selected response variables. Clusters are formed such that grouped cases are more homoge-nous relative to one another and more distinct from other groups (Hartung and Elpelt,1992). Rather than classifying fund managers according to some arbitrarily chosen criteria,it would seem more appropriate to take advantage of the rich information contained in thesurvey data by using cluster analysis to provide a segmentation. However, this analysiscomes at a cost as clustering is exploratory and does not yield a unique solution. Thus, toavoid misinterpretations, it should be pointed out that clustering, by itself, does not serve totest hypotheses of a given underlying model.
A two-stage procedure has proven useful for our purposes. First, cluster means are obtainedby applying Ward’s method, which begins with a completely partitioned set and groupscases stepwise to ensure that group variances are kept minimal.19 A best possible numberof clusters can be identified by analysing the sum of mean square errors prior and subse-quent to each merger of cases. Also, the desired number of clusters shall be restricted to avery few in order to allow further reasonable analysis. On this basis an appropriate seg-mentation into three core groups may be deduced from the survey data. Three out of the275 valid questionnaires were set aside prior to clustering in order to avoid unnecessary in-homogeneity of clusters. They came from respondents who declared themselves to bepurely passive (index-) fund managers and who could also be consistently recognised assuch. All remaining cases may thus be assumed to correspond, in effect, to managers withpredominantly active mandates.
In a second step, the variable means obtained for each of these three clusters are inputted asinitial cluster centres in a K-means clustering process.20 In the clustering that yielded myresults, convergence was achieved after just four iterations. Robustness of the results isfurther supported by mostly high F-ratios calculated from the variances between and withingroups. Obviously, more homogeneous subsets result from clustering the selected vari-ables. These variables are the responses given to questions regarding the use of informationsources, time horizons, methods of analysis and decision making, buying signals, secon-dary criteria for stock selection, portfolio management with hedging rules and investment
19 This technique is said to be conservative, i.e. it does not tend towards dilatation or contraction (Backhaus,Erichson, Plinke and Weiber, 1990) and has been found to partition very well relative to alternative meth-ods in Monte Carlo simulation studies (Milligan and Cooper, 1985).
20 Hierarchical agglomerations like Ward’s method are rigid because cases, once joined, always remain to-gether. To overcome this disadvantage, one may consider K-means clustering as a partitioning method fora specified number of clusters. Each case is then grouped into its nearest cluster, nearness being measuredin terms of the squared Euclidean distance to the cluster means. In an iterative process, means are updatedand cases regrouped until no further changes occur in cluster centres.

- 31 -
objectives.21 Since we are interested in identifying groups of fund managers who exhibitcertain behavioural patterns, they may all be deemed relevant cluster variables.
Importantly, the clusters obtained appear not to depend too strongly on the approach taken.Ward’s method, applied by itself with or without casewise standardised variables, and K-means-clustering with or without initial cluster centres all point to one and the same un-derlying kind of cluster profile. Nevertheless, the chosen solution seems best because thethree identified clusters are most equidistant. Ultimately, and most importantly, the validityof any suggested cluster solution depends on whether the results can be interpreted in atheoretically intelligible manner. This is the case.
Fundamentalists, tacticians and methodologists
The first group is estimated to have 83 members representing about 30% of all equity fundmanagers or almost 40% of assets under their management (see Figure 11 in the Appen-dix). Within the classical typification of investors according to use of analytical methods,these fund managers distinguish themselves through their supreme emphasis on funda-mental evaluations. Technical or chartist analyses play only a minor role for them, whereasforecasting based on econometric or portfolio optimisation models is rated as virtually ir-relevant (see Table 21 in the Appendix). Further, the vast majority of them exercisediscretion in decision-making, although they are evenly split as to whether, in so doing,they follow a systematic analytical procedure or one based on the underlying market situa-tion (see Table 14 below). The second group is the largest with 125 instances, or 46% of allfund managers (42 % of assets under management). The main difference between it and thefirst group is the somewhat lesser reliance on fundamental analysis and the markedlyhigher rating for technical analysis. These managers are very likely to be influenced in theiranalysis by the market situation and hence appeal to their discretion in making decisions.The smallest cluster is made up of 64 fund managers, or 23% (17%) of all fund managers(assets under management). They stand out because only they classify forecasting on thebasis of both econometric and portfolio optimisation models as quite relevant. It shouldcome as no surprise that a broad majority of them follow clear and standing decision rulesafter systematically analysing the market.22 For simplicity, the first group shall henceforth
21 The variables entered are standardised to neutralise effects from different scales. For the Ward’s methodresponse variables are further standardised across cases to ensure that differences in response patterns areaccounted for effectively. Eventually, time horizons other than those for fundamental predictions aredropped in order to prevent their influence from being inflated through high positive correlations. Also,six response items have again been omitted to avoid unnecessary inhomogeneity of clusters, afterANOVA showed them to be too similar across all survey participants.
22 Such practices are often called “quantitative management” or “structured investment” approaches.

- 32 -
be labelled fundamentalists, the second tacticians and the last one methodologists.23 Thisrepresents a simplification because the results clearly show that, in a general sense, behav-ioural differences among investment fund managers are not so much a matter of choosingamong various options; rather, fund managers differ by degrees, depending on how muchweight they attach to different types of alternatives.
Table 14: How are decisions made?
40.2 70.2 14.1
41.5 25.0 26.6
18.3 4.8 59.4
analysis contingent onmarket situation, discretedecision-making
standardised analysis,discrete decision-making
standardised analysis,rule-bound decision-making
frequency in %fundamen-
talists tacticians methodologists
cluster
The cluster results also seem relevant as they support the prior finding of a fundamentalconsistency with respect to specialisation among fund managers. For example, Table 22(see Appendix) presents the group means for the appraisal of various possible buy signals.Unlike both tacticians and methodologists, fundamentalists attribute much less importanceto technical factors such as an above-average increase in share price accompanied by risingvolume or a bottomed-out share price sharply lower than historic values. But they consis-tently give a top rating to a low fundamental valuation relative to the market or sector, onethat is significantly higher than other groups.
Group means for all behavioural characteristics are listed in Tables 21 to 26 (in the Appen-dix). As the data are ordinal by nature, the nonparametric Kruskal-Wallis-H-statistic iscalculated along with the ANOVA-F-ratio to test for overall differences in distributionbetween clusters. The Levene-statistic serves to test for homogeneity of group variances. If
23 Statistically, fundamentalists differ from methodologists to a slightly greater degree than from tacticians,the latter two groups being, however, most akin. Further, not only the variance but also the mean of dis-tances between cases and its cluster centre is greatest for methodologists, indicating that this group is,independent of its smaller group size, the least homogenous cluster. In this respect, the other two groupsare roughly alike.
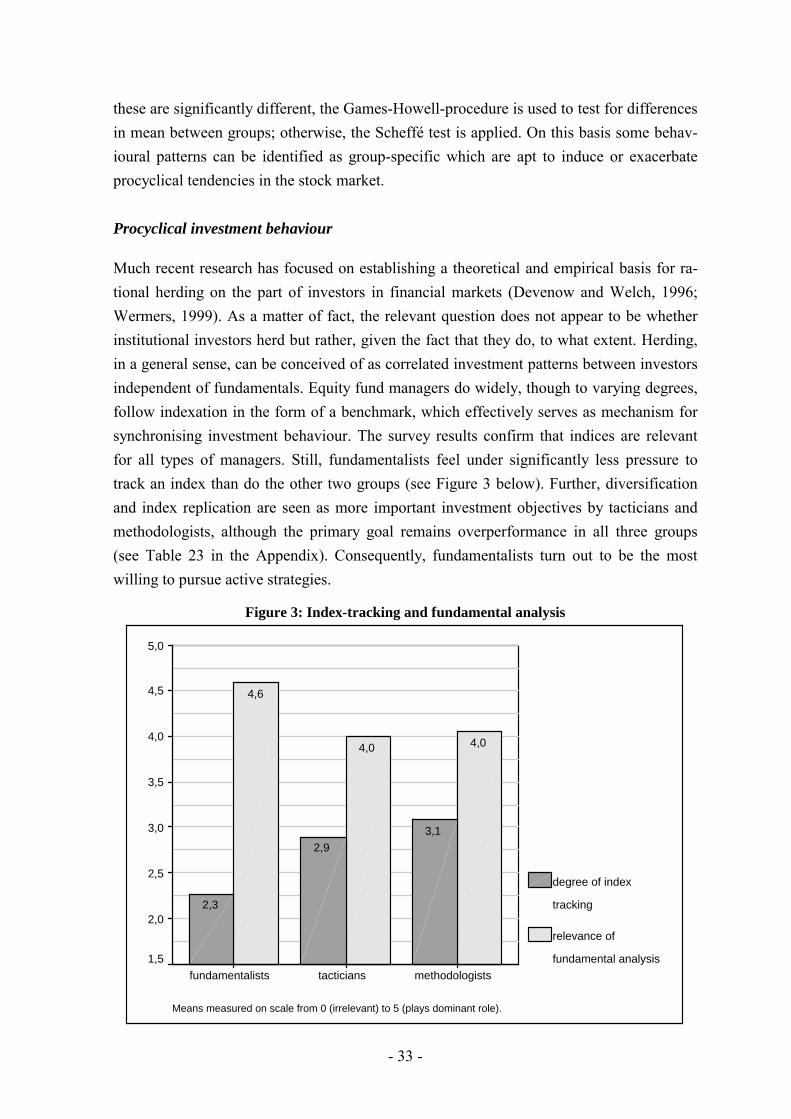
- 33 -
these are significantly different, the Games-Howell-procedure is used to test for differencesin mean between groups; otherwise, the Scheffé test is applied. On this basis some behav-ioural patterns can be identified as group-specific which are apt to induce or exacerbateprocyclical tendencies in the stock market.
Procyclical investment behaviour
Much recent research has focused on establishing a theoretical and empirical basis for ra-tional herding on the part of investors in financial markets (Devenow and Welch, 1996;Wermers, 1999). As a matter of fact, the relevant question does not appear to be whetherinstitutional investors herd but rather, given the fact that they do, to what extent. Herding,in a general sense, can be conceived of as correlated investment patterns between investorsindependent of fundamentals. Equity fund managers do widely, though to varying degrees,follow indexation in the form of a benchmark, which effectively serves as mechanism forsynchronising investment behaviour. The survey results confirm that indices are relevantfor all types of managers. Still, fundamentalists feel under significantly less pressure totrack an index than do the other two groups (see Figure 3 below). Further, diversificationand index replication are seen as more important investment objectives by tacticians andmethodologists, although the primary goal remains overperformance in all three groups(see Table 23 in the Appendix). Consequently, fundamentalists turn out to be the mostwilling to pursue active strategies.
Figure 3: Index-tracking and fundamental analysis
Means measured on scale from 0 (irrelevant) to 5 (plays dominant role).
methodologiststacticiansfundamentalists
5,0
4,5
4,0
3,5
3,0
2,5
2,0
1,5
degree of index
tracking
relevance of
fundamental analysis
4,04,0
4,6
3,12,9
2,3

- 34 -
Conventional empirical investigations using market data have, to date, failed to distinguishadequately between spurious forms of herding and intentional ones among institutional in-vestors. Herding clearly leads to correlated trading but the reverse need not be true. Giventhe multitude of factors that might affect an investment decision, it may be impossible todetermine the sources of correlated, procyclical investment behaviour, even if such couldbe found in the market data (Bikchandani and Sharma, 2000). However, reliable surveydata, conceived as yielding supplementary information, may be of help.
Figure 4: Deriving information from the behaviour of other investors
Means measured on scale from 0 (irrelevant) to 5 (plays dominant role).
methodologiststacticiansfundamentalists
4,0
3,5
3,0
2,5
2,0
1,5
1,0
purchases by other
instit. investors
abovage-average
rise of stock price
use of technical
analysis
1,8
3,6
1,8
3,13,2
1,8
2,3
2,7
1,2
With a view to information-based herding, survey participants have been asked to appraiseobserved institutional purchasing activity as a signal to buy (specific) stocks. Such signalsplay a much larger role in the investment decisions of methodologists and tacticians – andfor the latter more than for the former - than they do for fundamentalists. This is also con-sistent with the significantly higher rating given to technical buying signals, as indicatedabove. On balance, investors in these groups are much more inclined to derive informationfrom the behaviour of other market participants (see Figure 4 above). Intentional herding

- 35 -
therefore appears to be a group-specific form of behaviour. This, in turn, speaks in favourof fundamentalists being able to assume a stabilising role in markets.24
Arguments for reputation-based herding among institutional investors have been voicedalongside arguments for information-based herding. Fund managers may simply prefer tomove with the crowd as they are risk-averse when it comes to “lone” decisions whichmight eventually turn out to be bad ones (Scharfstein and Stein, 1990). Procyclical behav-iour may result from investor preferences for stock criteria which, insofar as they suggestsuperior stock quality, implicitly offer some protection for fund managers’ own reputation(Badrinath, Gay and Kale, 1989). In the questionnaire I have therefore asked respondents torate the importance of a corporation’s past performance as well as that of its stock price asan additional criterion for portfolio selection. Indeed, the fairly high average scores for allgroups indicate that such considerations are deemed very relevant by fund managers ingeneral, although tacticians exhibit the most pronounced preference for “winner-type”shares (see Table 24 in the Appendix).
Investment decision rules and portfolio techniques, such as stop-loss-orders, margin pur-chases or dynamic hedging, may - unintentionally but effectively - contribute to procyclicalprice tendencies (Davis, 1997). Here, tacticians, in line with their greater reliance on tech-nical factors, are the only ones to assign a role to stop-loss-techniques in their investmentapproach. Together with methodologists they attest to the use of options and futures at asubstantial level, albeit primarily for hedging purposes and not for position-taking on mar-gin. Group differences also exist with regard to dynamic hedging strategies. Such strategiesappear to be adopted by methodologists, albeit only to a minor extent. On balance, these re-sults suggest that the risk management techniques employed by equity fund managers havequite a limited potential to induce procyclical tendencies (see Table 25 in the Appendix).
Procyclical tendencies need not be contrary to fundamentals. Rather, they can be triggeredby independent, yet similar, responses to the arrival of new information. A common con-cern regarding the ongoing institutionalisation of portfolio investment decisionspresupposes an implicit trend towards standardised behavioural patterns or strategies. Ifthat were the case, price adjustment processes would at least be sped up, manifesting them-selves in an increase in short-term volatility. These processes may move prices towards,
24 Positive feedback strategies, which represent procyclical trading based on price signals, may be regardedas optimal by participants, provided they assume that investors better informed on fundamentals movemarket prices (Banerjee, 1992; Bikhchandani, Hirshleifer and Welch, 1992; Diamond and Verrechia,1981). Speculative bubbles are conceivable if uncertainty exists in the market as to the proportion of cor-rectly informed trading, and investors, as a consequence, are not able to recognise whether trading reflectsnew information or herding (Avery and Zemsky, 1998).

- 36 -
rather than away from, equilibrium values (Nofsinger and Sias, 1999). If, however, infor-mation arrival as such provides the basis for momentum strategies which come tosupersede a fundamental assessment independent of market dynamics, then worries overpossible overreactions are warranted. Consequently, I have asked fund managers to rateupbeat fundamental news as a buying signal (see Table 22 in the Appendix). In all threegroups, positive company announcements are rated equally high. An upgrade in analysts’corporate earning forecasts presents virtually the same picture. Interestingly, only funda-mentalists have a clear preference for a third category of buy signals which has nothing todo with the arrival of news as such but which reflects the relative share price level insofaras it is based on fundamentals. Seen from this angle, tacticians and methodologists appearto act as much on positive news alone as on its implications for relative pricing.
Informational input and sources of contagion
Do fundamentalists differ from the other groups in relying on relevant information ob-tained through their own or through their companies’ research? The answer is a qualifiedyes. Fundamentalists clearly value first-hand information derived from interviews withcompany management or sector experts most (see Table 26 in the Appendix). Further, theyregard in-house company analyses and forecasts as quite relevant. Methodologists sharethis assessment with fundamentalists but tacticians’ ratings drop off significantly. How-ever, both tacticians and methodologists rate macroeconomic predictions as moreimportant for their decision-making than fundamentalists. This observation is again con-sistent with fund managers’ descriptions of their typical mandates. Unlike fundamentalists,managers in both these groups grant a significantly greater role to top-down analyses. Thus,these types of investors seem more likely to “trade markets”, or sectors, and not stocks. In-deed, it is market-wide and cross-market herding which has increasingly been observed inrecent years and which has been cited as the main cause of concern (Davis, 1997).
It is also interesting to note where fund managers’ assessments do not differ. Exchanges ofviews with professional colleagues, media coverage and company forecasts by externalanalysts are rated equally high and relevant in all three investor groups. This tallies with theobservation that all groups assign the same importance to frequent reports and availabilityof independent analysts’ forecasts (see Table 24 in the Appendix). Apparently, the possi-bility to be influenced in an implicit, indirect and hence unintended manner remains quitepertinent to all fund managers, also to fundamentalists.
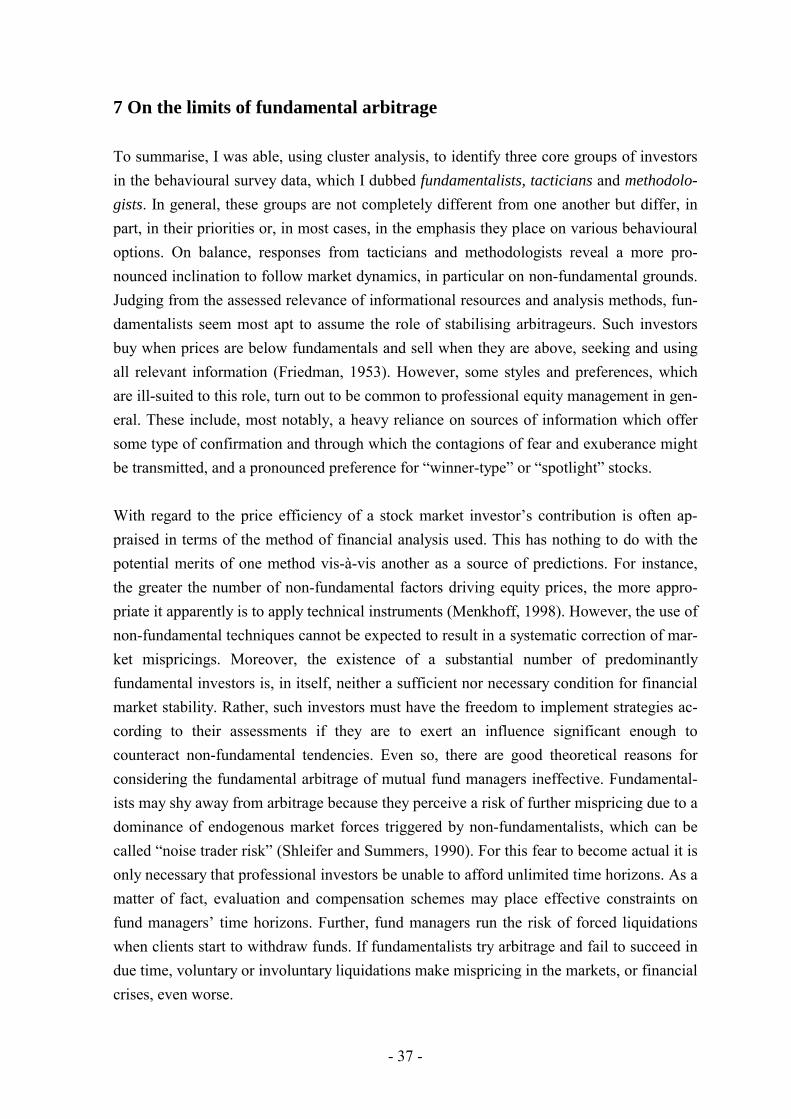
- 37 -
7 On the limits of fundamental arbitrage
To summarise, I was able, using cluster analysis, to identify three core groups of investorsin the behavioural survey data, which I dubbed fundamentalists, tacticians and methodolo-gists. In general, these groups are not completely different from one another but differ, inpart, in their priorities or, in most cases, in the emphasis they place on various behaviouraloptions. On balance, responses from tacticians and methodologists reveal a more pro-nounced inclination to follow market dynamics, in particular on non-fundamental grounds.Judging from the assessed relevance of informational resources and analysis methods, fun-damentalists seem most apt to assume the role of stabilising arbitrageurs. Such investorsbuy when prices are below fundamentals and sell when they are above, seeking and usingall relevant information (Friedman, 1953). However, some styles and preferences, whichare ill-suited to this role, turn out to be common to professional equity management in gen-eral. These include, most notably, a heavy reliance on sources of information which offersome type of confirmation and through which the contagions of fear and exuberance mightbe transmitted, and a pronounced preference for “winner-type” or “spotlight” stocks.
With regard to the price efficiency of a stock market investor’s contribution is often ap-praised in terms of the method of financial analysis used. This has nothing to do with thepotential merits of one method vis-à-vis another as a source of predictions. For instance,the greater the number of non-fundamental factors driving equity prices, the more appro-priate it apparently is to apply technical instruments (Menkhoff, 1998). However, the use ofnon-fundamental techniques cannot be expected to result in a systematic correction of mar-ket mispricings. Moreover, the existence of a substantial number of predominantlyfundamental investors is, in itself, neither a sufficient nor necessary condition for financialmarket stability. Rather, such investors must have the freedom to implement strategies ac-cording to their assessments if they are to exert an influence significant enough tocounteract non-fundamental tendencies. Even so, there are good theoretical reasons forconsidering the fundamental arbitrage of mutual fund managers ineffective. Fundamental-ists may shy away from arbitrage because they perceive a risk of further mispricing due to adominance of endogenous market forces triggered by non-fundamentalists, which can becalled “noise trader risk” (Shleifer and Summers, 1990). For this fear to become actual it isonly necessary that professional investors be unable to afford unlimited time horizons. As amatter of fact, evaluation and compensation schemes may place effective constraints onfund managers’ time horizons. Further, fund managers run the risk of forced liquidationswhen clients start to withdraw funds. If fundamentalists try arbitrage and fail to succeed indue time, voluntary or involuntary liquidations make mispricing in the markets, or financialcrises, even worse.

- 38 -
But, then, what is to be considered “due” time? Fundamentalists face a dilemma. On theone hand, for them to be active in the markets and undertake arbitrage they must believe inprice inefficiencies. On the other hand, each of them must also believe that price ineffi-ciencies are arbitraged away in “due” time. The survey results help us to gauge thepotential for fundamental arbitrage. More than 85% of fundamentalists - a share signifi-cantly greater than in other groups (see Table 27 in the Appendix) - favour the view thatinvestors dither in recognising new trends and developments and, hence, only graduallyadapt prices to new information sets. Thus, one necessary condition for fundamental arbi-trage is obviously satisfied.
Figure 5: Endurance of fundamentalists
Valid responses n=78.
12 months and longerup to 6 months
up to 3 monthsup to 1 month
rule-bound change
40,0%
30,0%
20,0%
10,0%
0,0%
11,5
29,5
34,6
12,811,5
Also, the analyses of fundamentalists typically have the longest time horizons; for funda-mental predictions these extend to little over one year (see Table 21 in the Appendix).Broadly speaking, it seems as if they benchmark equities on the basis of expected companyresults up to the end of the following financial year.25 But when asked how long they
25 Freeman and Bartels (2000) present some recent survey results which, on the whole, point to a specialpreference on the part of equity managers for practicable benchmarking tools like ratios of price to earn-ings, price to book value, and return to equity, in the given order and before all other indicators.

- 39 -
would hold on to a portfolio strategy if the markets turned against them and underperfor-mance became significant, the average response was just over three months. Less than aquarter of fundamentalists indicated they would keep it up for half a year, and only lessthan ⅛ for a year or more (see Figure 5 above). Since internal monitoring and evaluationsmay play a pivotal role here, it should be added that a thin majority of fundamentalists areevaluated once a year at most, the remainder are evaluated more often. As a consequence,for the bulk of fundamentalists sheer endurance seems enough to weather a storm. But is itenough for them to get through the winter?
Table 15: Which is more likely to make fund managers nervous,market news or the market itself? (Q5.d.)
78.3% [21.7%] 46.9% [53.1%]
91.8% [8.2%] 57.2% [42.8%]
78.2% [21.8%] 62.1% [37.9%]
fundamentalists
tacticians
methodologists
cluster
frequency in % first ranked second ranked
market dynamics versus [news]a
Participants were to rank the following five scenarios: periods of sharplyfalling or rising market prices or without a clear market trend (marketdynamics) as well as periods prior to announced publications of importanteconomic or corporate data and decicions (news). Least number of validresponses n=263.
a.
The survey results on sentiment cast more doubt on whether fundamentalists can stand thetide. All survey participants were asked to rank different scenarios in terms of their poten-tial for generating particular tension during professional decision making. Almost all fundmanagers cited market dynamics, especially when they are on the downside, but even, to aconsiderable extent, when they are on the upside, as the most likely source of nervousness.Fundamentalists were the only ones to have “voted” with a slight majority for economicand company-related news as the second-ranked source of nervousness (see Table 15above). On this score there can be little doubt: market movements must be on virtually eve-ryone’s mind, including those who expressly adhere to fundamentals when investing. Onbalance, much evidence therefore exists to validate arguments in support of limited arbi-trage, as suggested by the behavioural finance literature on noise trading (Shleifer, 2000).
Finally, the survey results imply that, as far as financing constraints on arbitrage are con-cerned, discretion in the maintenance of cash reserves is considered the most important

- 40 -
way to protect the portfolio, regardless of investor type. Nevertheless, tacticians allowthemselves a much higher degree of discretion in this regard than, for instance, fundamen-talists (see Table 25 in the Appendix). In turn, fundamentalists are relatively moredependent on the reaction of clients to asset-price variations, and thus have a greater effec-tive exposure to liquidation risk. One possible reason for this kind of behaviour can befound in the type of funds managed by fundamentalists, which will be discussed brieflybelow.
Which conditions favour fundamentalism?
As efficient fundamental arbitrage is a desirable feature of capital markets from a macro-economic point of view, special interest attaches to the question of what may influenceinvestors, in the first place, to behave in a fundamental manner. The survey data on poten-tially influential factors like compensation and monitoring arrangements have beenpresented above, likewise the styles of the typical fund under management as well as thebasic views and beliefs of equity fund managers. Subsequently, I have found that funda-mental behaviour is most likely to occur in a cluster of 83 fund managers, who I haveconsequently been dubbed fundamentalists. In the absence of a completely specified be-havioural model, it seems appropriate to identify factors that favour the managing of fundsassociated with this type of investor using a probit estimation on group membership as abinary dependent variable. The results of the regression are presented in Table 16 below.26
McFadden’s R2, at 0.34, looks promising, indicating a reasonable degree of explanatorypower in the regression. Likewise, analysing the classification of predicted cases reveals asensitivity of 64% and a specificity of 91%, with 82% of all cases being correctly classi-fied. In comparison with constant probabilities, a total gain in predictive power of 15percentage points is achieved. Methodologically, there is good reason to take the results asrobust.27
26 The variables are the evaluation criteria from Q4.b. (EVALU) and the award criteria from Q4.c. (BONUS)with bonus size and evaluation frequencies (EVALUTIME) also being included. Further explanatory vari-ables are criteria, derived from Q3.d., which specify the investment focus and style of the typical fundmanaged (STYLE). Fund managers’ views on how to achieve an above-average performance (OVERP)constitute rankings according to which the last category from Q7.b. is redundant and hence is not in-cluded. Likewise, only the second answer option from Q8.a., the price-inertia-view (EFFIC2), is enteredas the first option corresponds implicitly to the third one in Q7.b.
27 Since the regression includes a good number of cases, a robust estimate of covariances and thus of stan-dard errors can be obtained using the quasi-maximum likelihood (Huber-White) model. Also, individualapplication of the Newton-Raphson, Goldfeld-Quandt and Berndt-Hall-Hall-Hausman algorithms for non-linear optimisation results in only very minimal, insubstantial changes. Finally, as regards goodness-of-fit,the Hosmer-Lemeshow test statistics, calculated for both quartiles and quintiles, fails to indicate signifi-cant misspecification (see Eviews User’s Guide, 1997, pp. 415-466).
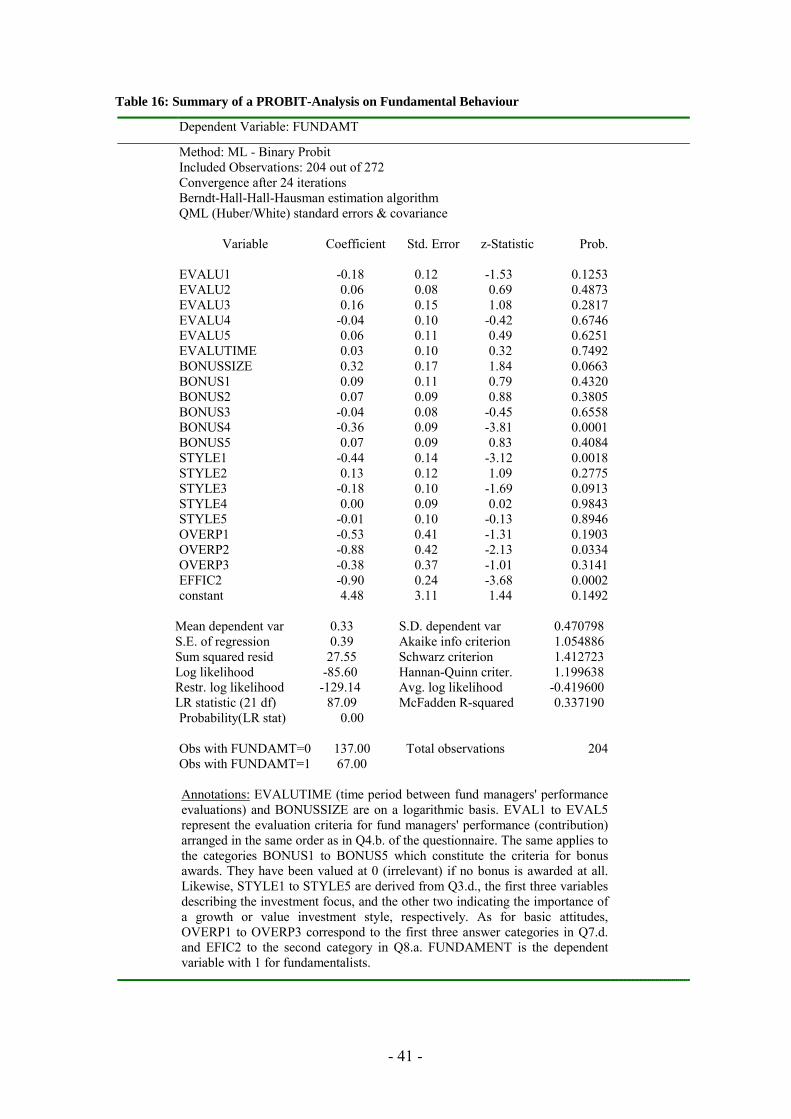
- 41 -
Table 16: Summary of a PROBIT-Analysis on Fundamental Behaviour
Dependent Variable: FUNDAMT
Method: ML - Binary ProbitIncluded Observations: 204 out of 272Convergence after 24 iterationsBerndt-Hall-Hall-Hausman estimation algorithmQML (Huber/White) standard errors & covariance
Variable Coefficient Std. Error z-Statistic Prob.
EVALU1 -0.18 0.12 -1.53 0.1253EVALU2 0.06 0.08 0.69 0.4873EVALU3 0.16 0.15 1.08 0.2817EVALU4 -0.04 0.10 -0.42 0.6746EVALU5 0.06 0.11 0.49 0.6251EVALUTIME 0.03 0.10 0.32 0.7492BONUSSIZE 0.32 0.17 1.84 0.0663BONUS1 0.09 0.11 0.79 0.4320BONUS2 0.07 0.09 0.88 0.3805BONUS3 -0.04 0.08 -0.45 0.6558BONUS4 -0.36 0.09 -3.81 0.0001BONUS5 0.07 0.09 0.83 0.4084STYLE1 -0.44 0.14 -3.12 0.0018STYLE2 0.13 0.12 1.09 0.2775STYLE3 -0.18 0.10 -1.69 0.0913STYLE4 0.00 0.09 0.02 0.9843STYLE5 -0.01 0.10 -0.13 0.8946OVERP1 -0.53 0.41 -1.31 0.1903OVERP2 -0.88 0.42 -2.13 0.0334OVERP3 -0.38 0.37 -1.01 0.3141EFFIC2 -0.90 0.24 -3.68 0.0002constant 4.48 3.11 1.44 0.1492
Mean dependent var 0.33 S.D. dependent var 0.470798S.E. of regression 0.39 Akaike info criterion 1.054886Sum squared resid 27.55 Schwarz criterion 1.412723Log likelihood -85.60 Hannan-Quinn criter. 1.199638Restr. log likelihood -129.14 Avg. log likelihood -0.419600LR statistic (21 df) 87.09 McFadden R-squared 0.337190Probability(LR stat) 0.00
Obs with FUNDAMT=0 137.00 Total observations 204Obs with FUNDAMT=1 67.00
Annotations: EVALUTIME (time period between fund managers' performanceevaluations) and BONUSSIZE are on a logarithmic basis. EVAL1 to EVAL5represent the evaluation criteria for fund managers' performance (contribution)arranged in the same order as in Q4.b. of the questionnaire. The same applies tothe categories BONUS1 to BONUS5 which constitute the criteria for bonusawards. They have been valued at 0 (irrelevant) if no bonus is awarded at all.Likewise, STYLE1 to STYLE5 are derived from Q3.d., the first three variablesdescribing the investment focus, and the other two indicating the importance ofa growth or value investment style, respectively. As for basic attitudes,OVERP1 to OVERP3 correspond to the first three answer categories in Q7.d.and EFIC2 to the second category in Q8.a. FUNDAMENT is the dependentvariable with 1 for fundamentalists.

- 42 -
Economically, the results are in accord with basic expectations about fundamental atti-tudes. A strong price-inertia view of the market makes it more likely that fund managerswill be fundamentalists (EFIC2).28 A fervent belief in the ability to overperform by sub-jecting already known data and information to in-depth analysis (OVERP2) is an equallygood indicator. Conversely, the stronger the investment focus on blue chips (STLYE1), theless likely it is that fundamentalism has been embraced. Either fund managers assume bluechips to be more efficiently priced than other stocks, thus offering fewer opportunities forfundamental arbitrage. Or they regard the nonfundamental market dynamics of blue chipsas being, at least at times, more pronounced and thus more likely to thwart attempts at suc-cessful fundamental arbitrage. Indeed, as blue chips effectively make up a large chunk ofthe most widely used indices, concerns about nonfundamental dynamics arising frombenchmarking may be particularly warranted.
Bonus size can play a role, as I have argued above, in inducing the active management styletypical of a fundamentalist. Although the sign of the corresponding coefficient (BONUS-SIZE) is positive, the significance level falls short of the 5% level by a small margin.However, the greater the dependence of bonuses on marketing aspects like customer satis-faction or the acquisition of new clients (BONUS4) the less likely fundamental investmentbehaviour becomes. Rationally, such marketing-related bonus awards are paid only whenfund management also involves client-relationship tasks. While this is certainly not practi-cable for funds open to the public, bonuses are more habitual in the specialised fundbusiness for institutional clients. In fact, when membership in the fundamentalists’ groupand the categories of age, professional experience, education, company size and principaltype of fund managed respectively are examined on associations, only the last categoryproves to be important.29 Thus an overproportionate fraction of fundamentalists are en-gaged in managing funds open to the public, whereas non-fundamentalists are more highlyconcentrated in the specialised fund business.
What could account for the difference? Lakonishok, Shleifer and Vishny (1992) postulate“an extra layer of agency problems” in the U.S. pension fund industry – the one most com-parable to the German specialised fund business – that is lacking in the mutual fundindustry, which offers services to private customers. Individuals invest their own wealth.But corporate treasurers who are in charge of selecting fund services may want to shift re-sponsibility for the investment outcome to fund managers. It is possible to outsource most
28 Given the ordinal nature and diversity of the data, the only matters that will concern us here are the mean-ing of the coefficients and the direction of their influence, and not their size as such.
29 Pearson’s χ2 equals 10.1 at an asymptotic significance level of 0.1%.
- 43 -
of the responsibility by choosing active, mixed funds, thus assigning fund management arole in the allocation of assets as well. As a matter of fact, 84% of total assets in specialisedGerman equity-related funds are mixed funds.30 What is more, this tallies with the survey’sfinding that non-fundamentalists are leaning more towards top-down approaches in securi-ties analysis.
It goes without saying that institutional clients can exert a much greater and more direct in-fluence on fund managers. Investing on behalf of institutional clients is clearly different incases that the job no longer involves simply investing monies but also entails promoting in-flows, advising clients and explaining the investment strategy to them (Perry, 1992). At anyrate, these additional tasks occupy time and resources. Although I do not know whether theeffect thereof on the investment outcome for German funds has ever been examined, I havefound evidence in the survey data that it does, in fact, impact on investment behaviour assuch. Burdened by more responsibility and working under greater pressure, fund managersobviously shift risk, too. They do so by tracking the market movements themselves moreclosely, either by using a benchmark or technical analysis or directly, by copying othermarket participants. Their time horizons become shorter and they are less willing to engagein fundamental arbitrage. I am far from suggesting that this way of investing is worse, oreven wrong. Still, it certainly is more liable to generate non-fundamental dynamics in stockmarkets. It is apparent that agency problems, as have been discussed previously in the fi-nance literature, play into this.
8 Concluding remarks
With the ongoing institutionalisation of portfolio investment, professional managers havemoved to centre stage on equity markets. At the same time, high volatility market phasesseem to have become more frequent, although there is no clear evidence of such highervolatility over the longer term (Blommestein, 1998). At any rate, the debate over how suchinstitutions impact on financial market stability is gaining ground, attracting not least theattention of central banks. Yet, institutional investing is often looked upon as a black box,and excessive attention has been paid to the analysis of investment outcomes. Under thatapproach, however, behavioural styles may remain concealed which are apt to have impli-cations for market stability. Thus, the primary objective of this paper has been to shed light,in a systematic manner, on key aspects of institutional investment processes. To this end, Ihave conducted a broad-based survey directed towards all German equity fund managers,
30 The corresponding figure for retail mutual funds is a mere 14% (Deutsche Bundesbank, capital marketstatitics, July 2000, own calculations).

- 44 -
in which an estimated 54% of fund managers of 97% of the investment companies con-tacted participated. A careful review of the data, including the examination of subgroups,reveal associations and patterns that are economically plausible and coherent. Since thefund managers surveyed were granted anonymity, there is no reason to assume that they didnot respond to the best of their knowledge, offering, to a large extent, their own subjectiveassessments as well. Also, there are no indications that selectivity in response has taintedthe survey data obtained. For these reasons, I regard the results as providing a reliablesource of information on equity fund managers’ beliefs and practices.
Some key findings with implications for market efficiency and stability may be brieflysummarised as follows: First, fund managers generally identify longer-term price inefficen-cies on stock markets and pursue predominantly active strategies with the principal aim ofachieving above-average returns for their clients. Second, in analysing investment patterns,I have identified three core types of managers, which I have dubbed fundamentalists, tacti-cians and methodologists. With the help of these categories, some investment styles andapproaches can be shown to be group-specific whereas others turn out to be common to allforms of professional equity investing. For instance, information-based herding, i.e. theintentional mimicking of other market players, or the practice of following non-fundamental market signals is more pronounced among tacticians and methodologists.Third, of all the groups, fundamentalists, in keeping with their name, seem best suited toassume the role of arbitrageurs, returning equity prices to, and stabilising them at, fair andsound levels. However, doubts concerning the effectiveness of such fundamental arbitrage,as voiced in the recent literature on behavioural finance, are reinforced by this survey’sdata. For the great majority of fundamentalists, investment time horizons are quite re-stricted and, in the intervening period, the fear of becoming caught up in a negative marketenvironment seems to prevail. Fourth, the survey results nevertheless endorse the view thatinstitutional investors can generally contribute to more efficient stock market pricing.Managers from all groups demonstrate a clear preference for stock analyses based on un-derlying economic factors. Fifth, this assertion is corroborated by the priorities fundmanagers generally assign to fundamental buy signals. By the same token, the level ofstock valuations, i.e. their intrinsic values, does not appear to be the only criterion whichmatters. In addition, fund managers indicated that they commonly react as much to themarket dynamic itself, which is set in motion by the arrival of corporate news or earningsrevisions. Then, if enough fundamental momentum is triggered, stock price overreactionsbecome possible. Sixth, there are still other practices and preferences which the survey datashow to be common to all forms of professional equity management and which carry somerisk to market stability. In particular, fund managers clearly rely to a great extent on infor-mation from external analysts, the media, and professional colleagues. While all thesesources involve some type of confirmation, they are also channels for contagions of fear

- 45 -
and exuberance. Likewise, there is evidence that fund managers tend to favour stockswhich receive ample attention from analysts or in the form of reports; they also preferstocks with a proven record of outstanding corporate and stock price performances. Thathaving been said, and provided institutional equity investors’ behaviour is taken as the solecriterion, there is much evidence to indicate that market dynamics can persist well beyondeconomically justified equilibrium levels. Finally, the survey results reveal that agencyproblems due to the intermediate nature of the equity fund business are likely to have abearing on managers’ investment behaviour.
- 46 -
Appendix
Table 17: A comparison with official statistics to control for selectivity
18.8 13.5
26.3 27.3
54.9 59.2
100% (575.2 billionEuro)
100% (400.0 billionEuro)
up to 8 billionEuro
over 8 but lessthan 20 billionEuro
over 20 billionEuro
size of mutualfund company byequity investmentvolume
total
share of all equity investments in %according to
official statisticsaaccording to the
survey
Deutsche Bundesbank, capital market statistics, published October 2000, for allequity-based and mixed funds in the reporting month August 2000.
a.
Table 18: Brief profile of the typical fund manager (Q1.b./c., Q2.a.)
848.5 751.8 - 957.6 900 n=239
35.4 34.9 - 35.9 35 n=275
5.2 4.8 - 5.5 5 n=272
equity investmentsunder management inmillion Euro
age (in years)
professionalexperience on the job(in years)
meana95%- confidence
intervall medianvalid
responses
Estimated on a logarithmic basis.a.
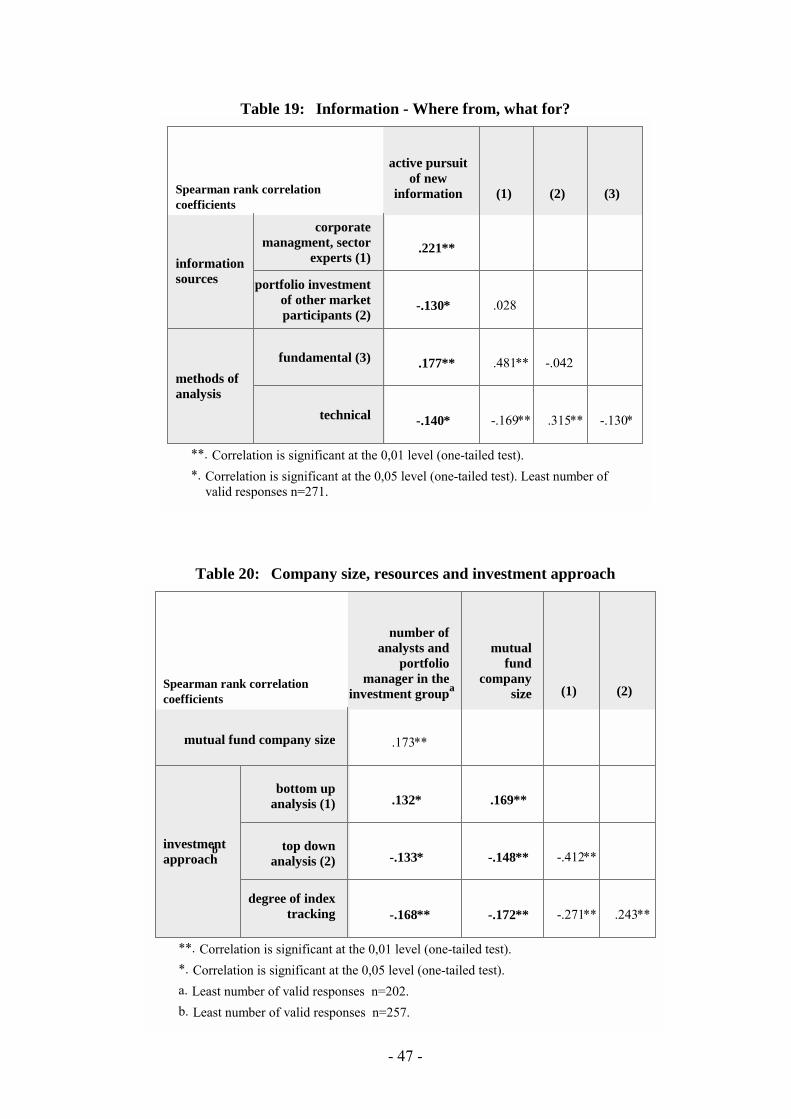
- 47 -
Table 19: Information - Where from, what for?
.221**
-.130* .028
.177** .481** -.042
-.140* -.169** .315** -.130*
corporatemanagment, sector
experts (1)
portfolio investmentof other marketparticipants (2)
informationsources
fundamental (3)
technical
methods ofanalysis
Spearman rank correlationcoefficients
active pursuitof new
information (1) (2) (3)
Correlation is significant at the 0,01 level (one-tailed test).**.
Correlation is significant at the 0,05 level (one-tailed test). Least number ofvalid responses n=271.
*.
Table 20: Company size, resources and investment approach
.173**
.132* .169**
-.133* -.148** -.412**
-.168** -.172** -.271** .243**
mutual fund company size
bottom upanalysis (1)
top downanalysis (2)
degree of indextracking
investmentapproach
b
Spearman rank correlationcoefficients
number ofanalysts and
portfoliomanager in the
investment groupa
mutualfund
companysize (1) (2)
Correlation is significant at the 0,01 level (one-tailed test).**.
Correlation is significant at the 0,05 level (one-tailed test).*.
Least number of valid responses n=202.a.
Least number of valid responses n=257.b.
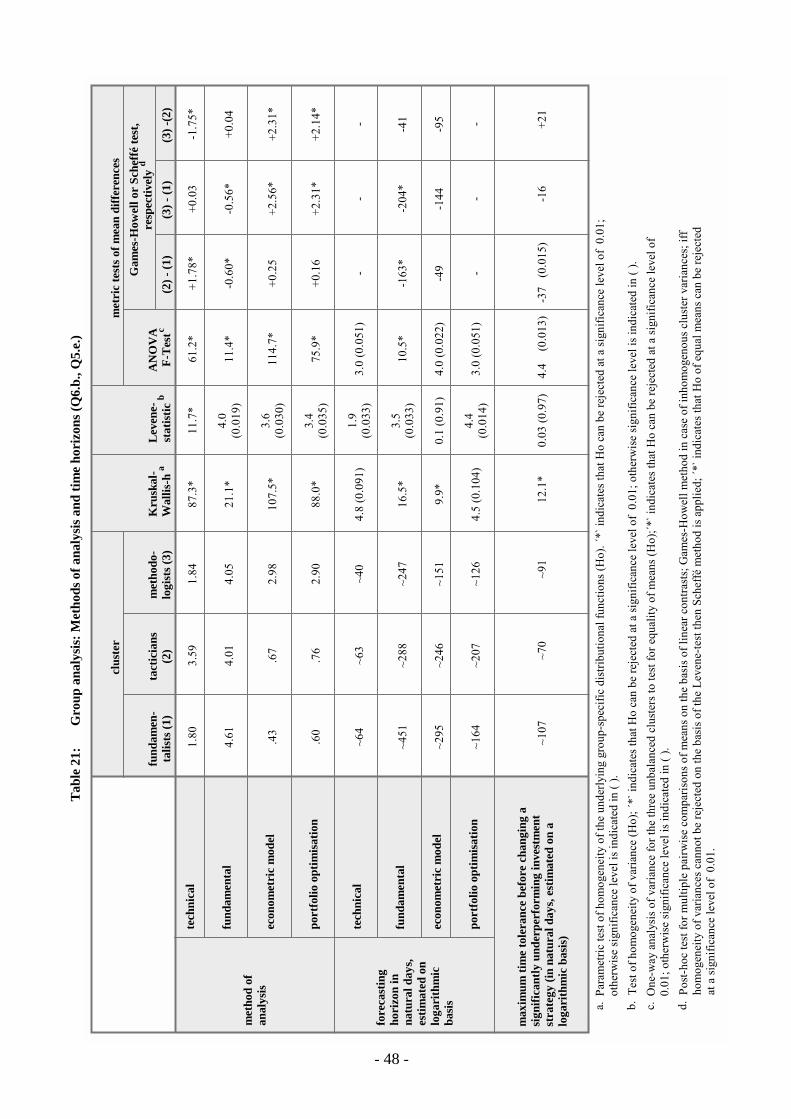
Tabl
e 21
:G
roup
ana
lysis
: Met
hods
of a
naly
sis a
nd ti
me
hori
zons
(Q6.
b., Q
5.e.
)
1.80
3.59
1.84
87.3
*11
.7*
61.2
*+1
.78*
+0.0
3-1
.75*
4.61
4.01
4.05
21.1
*4.
0(0
.019
)11
.4*
-0.6
0*-0
.56*
+0.0
4
.43
.67
2.98
107.
5*3.
6(0
.030
)11
4.7*
+0.2
5+2
.56*
+2.3
1*
.60
.76
2.90
88.0
*3.
4(0
.035
)75
.9*
+0.1
6+2
.31*
+2.1
4*
~64
~63
~40
4.8
(0.0
91)
1.9
(0.0
33)
3.0
(0.0
51)
--
-
~451
~288
~247
16.5
*3.
5(0
.033
)10
.5*
-163
*-2
04*
-41
~295
~246
~151
9.9*
0.1
(0.9
1)4.
0 (0
.022
)-4
9-1
44-9
5
~164
~207
~126
4.5
(0.1
04)
4.4
(0.0
14)
3.0
(0.0
51)
--
-
~107
~70
~91
12.1
*0.
03 (0
.97)
4.4
(0
.013
)-3
7 (
0.01
5)-1
6+2
1
tech
nica
l
fund
amen
tal
econ
omet
ric
mod
el
port
folio
opt
imis
atio
n
met
hod
ofan
alys
is
tech
nica
l
fund
amen
tal
econ
omet
ric
mod
el
port
folio
opt
imis
atio
n
fore
cast
ing
hori
zon
inna
tura
l day
s,es
timat
ed o
nlo
gari
thm
icba
sis
max
imum
tim
e to
lera
nce
befo
re c
hang
ing
asi
gnifi
cant
ly u
nder
perf
orm
ing
inve
stm
ent
stra
tegy
(in
natu
ral d
ays,
estim
ated
on
alo
gari
thm
ic b
asis
)
fund
amen
-ta
lists
(1)
tact
icia
ns(2
)m
etho
do-
logi
sts (
3)
clus
ter
Kru
skal
-W
allis
-ha
Lev
ene-
stat
istic
bA
NO
VA
F-T
estc
(2) -
(1)
(3) -
(1)
(3) -
(2)
Gam
es-H
owel
l or
Sche
ffé te
st,
resp
ectiv
ely
d
met
ric
test
s of m
ean
diffe
renc
es
Para
met
ric te
st o
f hom
ogen
eity
of t
he u
nder
lyin
g gr
oup-
spec
ific
dist
ribut
iona
l fun
ctio
ns (H
o). ´
*` in
dica
tes t
hat H
o ca
n be
reje
cted
at a
sign
ifica
nce
leve
l of
0.01
;ot
herw
ise
sign
ifica
nce
leve
l is i
ndic
ated
in (
).a.
Test
of h
omog
enei
ty o
f var
ianc
e (H
o); ´
*` in
dica
tes t
hat H
o ca
n be
reje
cted
at a
sign
ifica
nce
leve
l of
0.01
; oth
erw
ise
sign
ifica
nce
leve
l is i
ndic
ated
in (
).b.
One
-way
ana
lysi
s of v
aria
nce
for t
he th
ree
unba
lanc
ed c
lust
ers t
o te
st fo
r equ
ality
of m
eans
(Ho)
;´*` i
ndic
ates
that
Ho
can
be re
ject
ed a
t a si
gnifi
canc
e le
vel o
f 0.
01; o
ther
wis
e si
gnifi
canc
e le
vel i
s ind
icat
ed in
( ).
c. Po
st-h
oc te
st fo
r mul
tiple
pai
rwis
e co
mpa
rison
s of m
eans
on
the
basi
s of l
inea
r con
trast
s; G
ames
-How
ell m
etho
d in
cas
e of
inho
mog
enou
s clu
ster
var
ianc
es; i
ffho
mog
enei
ty o
f var
ianc
es c
anno
t be
reje
cted
on
the
basi
s of t
he L
even
e-te
st th
en S
chef
fé m
etho
d is
app
lied;
´*` i
ndic
ates
that
Ho
of e
qual
mea
ns c
an b
e re
ject
edat
a si
gnifi
canc
e le
vel o
f 0.
01.
d.
- 48 -

Tabl
e 22
:G
roup
ana
lysis
: Pot
entia
l buy
sign
als (
Q6.
a.)
1.80
3.15
3.11
57.7
*3.
9 (0
.021
)40
.8*
+1.3
5 *
+1.3
1*-0
.04
1.72
2.73
2.31
35.0
*0.
05(0
.953
)19
.8*
+1.0
1*+0
.59*
-0.4
2
.77
1.34
1.64
22.9
*6.
6*13
.4*
+0.5
7*+0
.87*
+0.3
0
3.20
3.22
3.89
17.1
*10
.5*
9.3*
+0.0
2+0
.69*
+0.6
7*
1.23
2.66
2.28
69.4
*5.
4*48
.1*
+1.4
2*+1
.05*
-0.3
8
3.89
3.82
3.59
3.0
(0.
225)
1.8*
1.9
(0.1
6)-
--
4.18
3.66
3.77
11.4
5*3.
0*6.
1*-0
.52*
-0.4
1-0
.11
abov
e-av
erag
e ri
se in
mar
ket p
rice
acco
mpa
nied
by
high
er tu
rnov
er
quot
atio
n st
abili
sed
at a
pri
ce le
vel
shar
ply
low
er th
an it
s all-
time-
high
grow
ing
expe
ctat
ions
con
cern
ing
high
er d
ivid
ends
rais
ing
of c
orpo
rate
ear
ning
ses
timat
es b
y an
alys
ts
obse
rved
pur
chas
es b
y ot
her
inst
itutio
nal i
nves
tors
posi
tive
corp
orat
e ne
ws/
anno
unce
men
ts
a fu
ndam
enta
lly lo
w v
alua
tion
byse
ctor
or
mar
ket c
ompa
riso
n
fund
amen
-ta
lists
(1)
tact
icia
ns(2
)m
etho
do-
logi
sts (
3)
clus
ter
Kru
skal
-W
allis
-ha
Lev
ene-
stat
istic
bA
NO
VA
F-te
stc(2
) - (1
)(3
) - (1
)(3
) - (2
)
Gam
es-H
owel
l or
Sche
ffé
test
,re
spec
tivel
yd
met
ric
test
s of m
ean
diff
eren
ces
See
Tabl
e 21
.a.
See
Tabl
e 21
.b.
See
Tabl
e 21
.c.
See
Tabl
e 21
.d.
- 49 -

Tabl
e 23
:G
roup
ana
lysis
: Inv
estm
ent o
bjec
tives
(Q8.
b.)
4.69
4.61
4.60
1.1
(0.5
9)1.
1(0
.335
)0.
4 (0
.645
)-
--
2.89
3.38
3.77
28.3
*0.
4(0
.658
)14
.2*
+0.4
9*+0
.88*
+0.4
0
1.72
2.76
2.89
34.6
*0.
02(0
.981
)67
.7*
+1.0
3*+1
.17*
+0.1
3
.77
1.24
1.22
13.9
*0.
1(0
.924
)12
.5*
+0.4
7+0
.45
-0.0
2
.29
.65
.69
14.4
*8.
2*8.
0*+0
.36
+0.4
0+0
.04
abov
e-av
erag
e pe
rfor
man
ce
dive
rsifi
catio
n of
mar
ket r
isk
repl
icat
ion
of a
spec
ific
inde
x
abov
e-av
erag
e di
vide
nds a
ndpa
yout
s
othe
r ai
ms (
tax
and
bala
nce
shee
tco
nsid
erat
ions
)
fund
amen
-ta
lists
(1)
tact
icia
ns(2
)m
etho
do-
logi
sts (
3)
clus
ter
Kru
skal
-W
allis
-ha
Leve
ne-
stat
istic
bA
NO
VA
F-te
stc(2
) - (1
)(3
) - (1
)(3
) -(2
)
Gam
es-H
owel
l or
Sche
ffé
test
,re
spec
tivel
yd
met
ric
test
s of m
ean
diff
eren
ces
See
Tabl
e 21
.a.
See
Tabl
e 21
.b.
See
Tabl
e 21
.c.
See
Tabl
e 21
.d.
- 50 -

Tabl
e 24
:G
roup
ana
lysis
: Sec
onda
ry c
rite
ria
in se
lect
ing
stoc
ks (Q
6.c.
)
1.44
2.14
2.21
16.9
*1.
6(0
.213
)9.
2*+0
.69*
+0.7
7*+0
.07
3.62
3.74
3.81
1.8
(0.4
13)
3.9
(0.0
21)
0.8
(0.4
37)
--
-
3.61
3.47
3.65
2.1
(0.3
42)
0.5
(0.6
23)
0.7
(0.5
16)
--
-
3.44
3.93
3.63
8.9
(0.0
12)
11.3
*6.
4*+0
.49*
+0.1
9-0
.30
.62
1.85
1.94
58.6
*10
.4*
34.5
*+1
.23*
+1.3
1*+0
.09
trad
ing
cost
s suc
h as
bid
/off
er sp
read
mar
ket c
apita
lisat
ion
freq
uent
new
s cov
erag
e an
d av
aila
bilit
y of
inde
pend
ent a
naly
sts'
fore
cast
s
prev
ious
cor
pora
te d
evel
opm
ent a
s wel
l as
stoc
k m
arke
t per
form
ance
avai
labi
lity
of tr
adab
le d
eriv
ates
for
tran
sact
ions
or
as a
sour
ce o
f add
ition
alin
form
atio
n
fund
amen
-ta
lists
(1)
tact
icia
ns(2
)m
etho
do-
logi
sts (
3)
clus
ter
Kru
skal
-W
allis
-ha
Leve
ne-
stat
istic
bA
NO
VA
F-Te
stc(2
) - (1
)(3
) - (1
)(3
) -(2
)
Gam
es-H
owel
l or
Sche
ffé
test
,re
spec
tivel
yd
met
ric
test
s of m
ean
diff
eren
ces
See
Tabl
e 21
.a.
See
Tabl
e 21
.b.
See
Tabl
e 21
.c.
See
Tabl
e 21
.d.
- 51 -
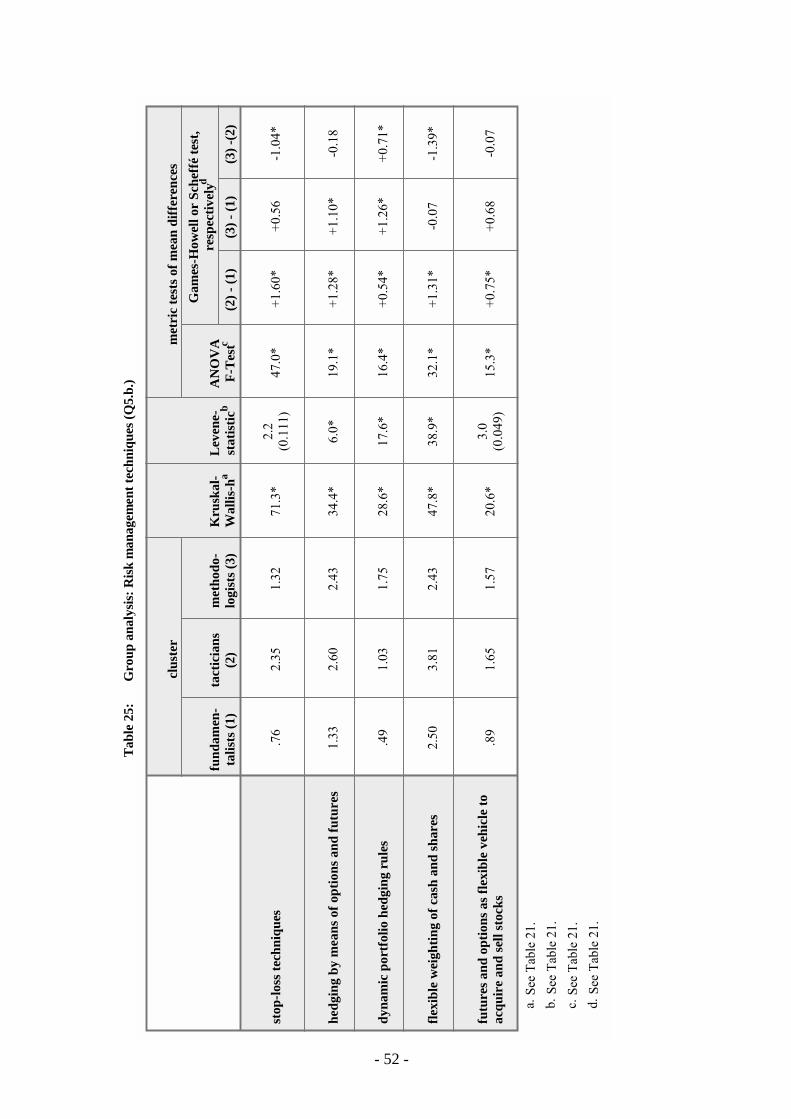
Tabl
e 25
:G
roup
ana
lysis
: Risk
man
agem
ent t
echn
ique
s (Q
5.b.
)
.76
2.35
1.32
71.3
*2.
2(0
.111
)47
.0*
+1.6
0*+0
.56
-1.0
4*
1.33
2.60
2.43
34.4
*6.
0*19
.1*
+1.2
8*+1
.10*
-0.1
8
.49
1.03
1.75
28.6
*17
.6*
16.4
*+0
.54*
+1.2
6*+0
.71*
2.50
3.81
2.43
47.8
*38
.9*
32.1
*+1
.31*
-0.0
7-1
.39*
.89
1.65
1.57
20.6
*3.
0(0
.049
)15
.3*
+0.7
5*+0
.68
-0.0
7
stop
-loss
tech
niqu
es
hedg
ing
by m
eans
of o
ptio
ns a
nd fu
ture
s
dyna
mic
por
tfol
io h
edgi
ng r
ules
flexi
ble
wei
ghtin
g of
cas
h an
d sh
ares
futu
res a
nd o
ptio
ns a
s fle
xibl
e ve
hicl
e to
acqu
ire
and
sell
stoc
ks
fund
amen
-ta
lists
(1)
tact
icia
ns(2
)m
etho
do-
logi
sts (
3)
clus
ter
Kru
skal
-W
allis
-ha
Leve
ne-
stat
istic
bA
NO
VA
F-Te
stc(2
) - (1
)(3
) - (1
)(3
) -(2
)
Gam
es-H
owel
l or
Sche
ffé
test
,re
spec
tivel
yd
met
ric
test
s of m
ean
diff
eren
ces
See
Tabl
e 21
.a.
See
Tabl
e 21
.b.
See
Tabl
e 21
.c.
See
Tabl
e 21
.d.
- 52 -
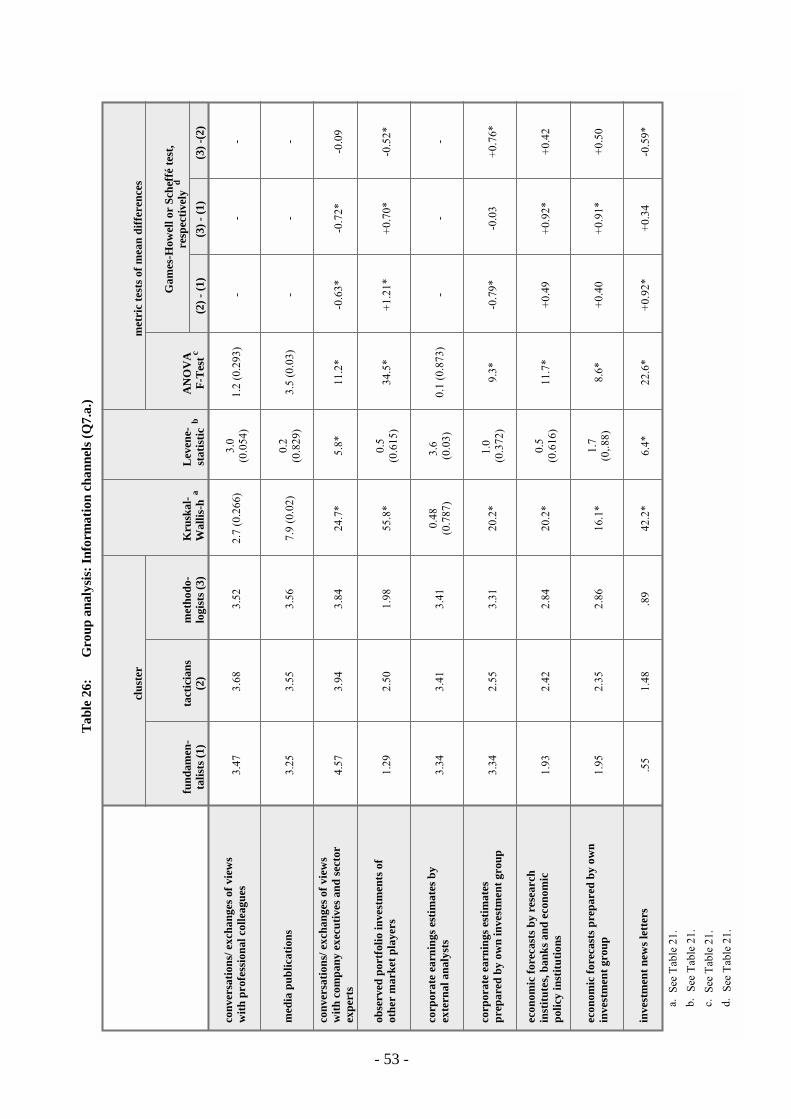
Tabl
e 26
:G
roup
ana
lysis
: Inf
orm
atio
n ch
anne
ls (Q
7.a.
)
3.47
3.68
3.52
2.7
(0.2
66)
3.0
(0.0
54)
1.2
(0.2
93)
--
-
3.25
3.55
3.56
7.9
(0.0
2)0.
2(0
.829
)3.
5 (0
.03)
--
-
4.57
3.94
3.84
24.7
*5.
8*11
.2*
-0.6
3*-0
.72*
-0.0
9
1.29
2.50
1.98
55.8
*0.
5(0
.615
)34
.5*
+1.2
1*+0
.70*
-0.5
2*
3.34
3.41
3.41
0.48
(0.7
87)
3.6
(0
.03)
0.1
(0.8
73)
--
-
3.34
2.55
3.31
20.2
*1.
0 (0
.372
)9.
3*-0
.79*
-0.0
3+0
.76*
1.93
2.42
2.84
20.2
*0.
5(0
.616
)11
.7*
+0.4
9+0
.92*
+0.4
2
1.95
2.35
2.86
16.1
*1.
7(0
,.88)
8.6*
+0.4
0+0
.91*
+0.5
0
.55
1.48
.89
42.2
*6.
4*22
.6*
+0.9
2*+0
.34
-0.5
9*
conv
ersa
tions
/ exc
hang
es o
f vie
ws
with
pro
fess
iona
l col
leag
ues
med
ia p
ublic
atio
ns
conv
ersa
tions
/ exc
hang
es o
f vie
ws
with
com
pany
exe
cutiv
es a
nd se
ctor
expe
rts
obse
rved
por
tfol
io in
vest
men
ts o
fot
her
mar
ket p
laye
rs
corp
orat
e ea
rnin
gs e
stim
ates
by
exte
rnal
ana
lyst
s
corp
orat
e ea
rnin
gs e
stim
ates
prep
ared
by
own
inve
stm
ent g
roup
econ
omic
fore
cast
s by
rese
arch
inst
itute
s, ba
nks a
nd e
cono
mic
polic
y in
stitu
tions
econ
omic
fore
cast
s pre
pare
d by
ow
nin
vest
men
t gro
up
inve
stm
ent n
ews l
ette
rs
fund
amen
-ta
lists
(1)
tact
icia
ns(2
)m
etho
do-
logi
sts (
3)
clus
ter
Kru
skal
-W
allis
-ha
Lev
ene-
stat
istic
bA
NO
VA
F-T
estc
(2) -
(1)
(3) -
(1)
(3) -
(2)
Gam
es-H
owel
l or
Sche
ffé
test
,re
spec
tivel
yd
met
ric
test
s of m
ean
diff
eren
ces
See
Tabl
e 21
.a.
See
Tabl
e 21
.b.
See
Tabl
e 21
.c.
See
Tabl
e 21
.d.
- 53 -

- 54 -
Table 27: The price-inertia view of the market by group (Q8.a.)
85.4 64.5 59.4
13.4 25.8 26.6
1.2 9.7 14.1
most adequate
secondary
least adequate
personalranking
frequency in %fundamen-
talists tacticians methodologists
cluster
Figure 6: Educational background in terms of degrees earned (Q2.b.)
Valid responses n=275.
univers. economics
bank training
CFA, CEFA or similar
polytech. business
bank academy
other prof. training
oth. academic degree
univer. nat.sc./math
CA/Ph.d./MBA
relative frequency
60,0%50,0%40,0%30,0%20,0%10,0%0,0%
13,5
14,2
14,9
27,3
53,8
58,9

- 55 -
Figure 7: Finance-related education of fund managers
highest finance-related educational degree obtained* (frequencies)
* Finance-related postgraduate degrees included are CFA, Ph.d., MBA and
Chartered Accountant; valid responses n=275.
postgraduate degree*univers. economics
polytech. businessbank training
oth. academic degree
45,0%
37,5%
30,0%
22,5%
15,0%
7,5%
0,0%
29,8
42,2
18,5
6,52,9
Figure 8: Description of the typical fund (Q3.d.)
Means measured on scale from 0 (irrelevant) to 5 (plays dominant role).
blue chips
small and mid-caps
new market stocks
value style
growth style
bottom up analysis
top down analysis
index-tracking
'house' view matters
5,004,003,002,001,000,00
2,19
2,75
2,13
3,72
3,51
2,36
1,70
1,72
4,24
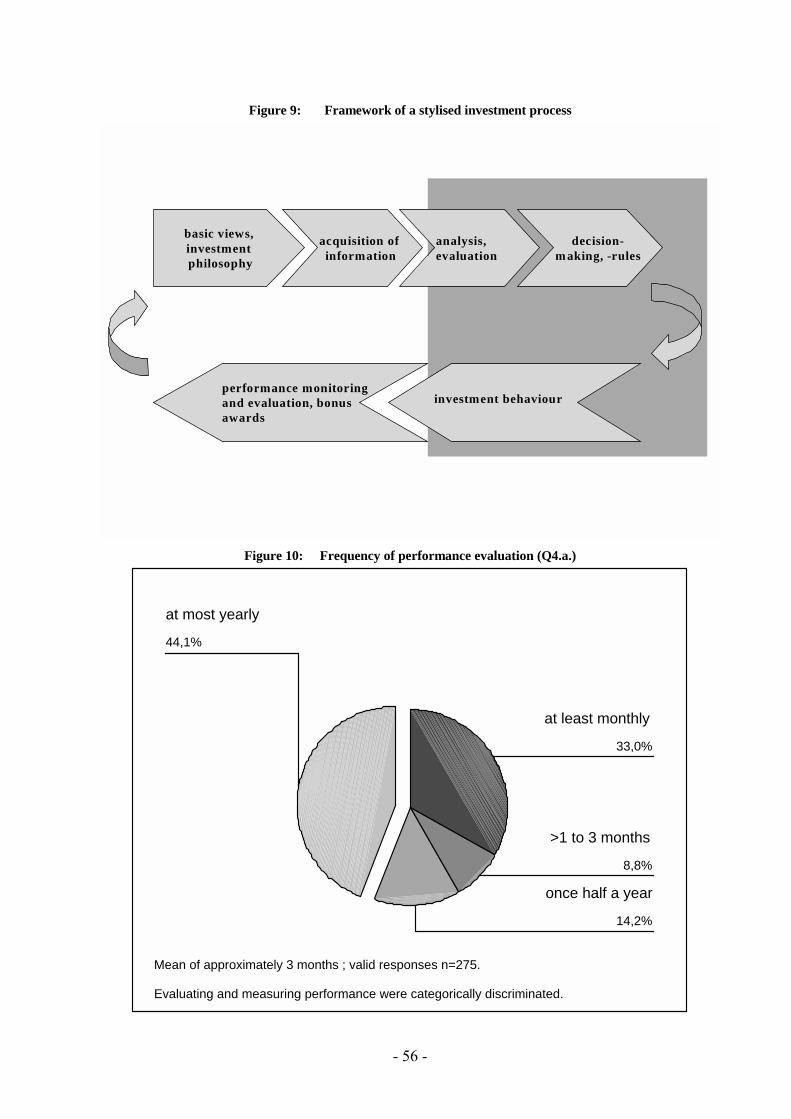
- 56 -
Figure 9: Framework of a stylised investment process
basic views, investment philosophy
acquisition of information
analysis, evaluation
decision-making, -rules
performance monitoringand evaluation, bonusawards
investment behaviour
Figure 10: Frequency of performance evaluation (Q4.a.)
Mean of approximately 3 months ; valid responses n=275.
Evaluating and measuring performance were categorically discriminated.
44,1%
14,2%
8,8%
33,0%
at most yearly
once half a year
>1 to 3 months
at least monthly

- 57 -
Figure 11: Core investor types
Identified by a comprehensive clustering of behavioural data.
Valid responses n=275.
23,3%
45,5%
1,1%
30,2%
methodologists
tacticiansindex fund managers
fundamentalists

- 58 -
1
DeutscheBundesbank
Economic Research Group
Torsten Arnswald
Tel.: +49 (0 69) 95 66-25 07Fax: +49 (0 69) 95 66-30 [email protected]
A survey of equity fund managers on portfolio management
questionnaire
- 59 -

Q1: Data on professional status
If you like to comment on the topics touched upon in the questionnaire, we would certainly appreciate amore detailed response of yours. Please feel free to use the space provided at the end of this que-stionnaire for this purpose.
a. Which position do you currently hold within your investment company?
junior equity manager.
senior equity manager.
head of equity team.
chief executive officer.4
3
2
1
b. How long have you been working as aprofessional asset manager?
years.
c. How large is the total volume of equityunder your management, and for whichyou are personally responsible?
million EURO.
I am unfortunately unable to provide specific data.
d. How do you take investment decisionsfor most of the funds in your charge?
Please cross only one category.
on my own responsibility, but in keepingwith the investment strategy prescribed bymy investment company or group.
on my own responsibility, there being noprescribed investment strategy in my invest-ment company or group.
as a joint decision with colleagues.
after consultation.
after authorisation.5
4
3
2
1
- 60 -

Q2: Personal data
a. How old are you? years.
b. Which educational level have you attained?
Please cross all the categories that are applicable in yourcase.
3-year apprenticeship as a banker, or comparable professional training.
banking academy/technical college.
university degree in law.
university degree in economics or businessadministration.
university degree in natural sciences/mathematics.
chartered accountant, M.B.A., doctorate ineconomics.
C.F.A., C.E.F.A.
doctorate or postgraduate degree in another area.
other form of academic training
Which?
other form of vocational training.
Which?
- 61 -

Q3: Description of the fund
a. How many analysts and portfolio mana-gers does the entire investment group forwhich you work as a fund manageremploy in its stock market divisions, bothin its foreign branches and in the parentcompany?
Please answer to the best of your knowledge.
I am unfortunately unable to provide specific data.
c. In which type of fund do you primarilymanage stock market investments?
Please cross only one category.
investment fund open to the general public.
specialised investment fund of an insurancecompany.
specialised investment fund of a credit insti-tution.
other specialised fund.4
3
2
1
d. Please describe the assignment mosttypical of your type of work or the largestfund which your decisions help manage.
Please cross all categories.
5 = very pronounced !" 0 = minimal.
5 4 3 2 1 0
Investment focus: blue chips
Investment focus: second-tier stocks
Investment focus: new market stocks
Investment style: value-oriented
Investment style: growth-oriented
Method of analysis: bottom up
Method of analysis: top down
Investment policy: index orientation
Investment decisions: role playedby “house opinion”
b. How large is the domestically domiciledinvestment company, for which you workas fund manager, as measured in terms ofthose assets which it manages as stocks-and mixed securities-based investmentfunds?
Please cross only one category.
up to E 8 billion.
over E 8 billion but less than E 20 billion.
over E 20 billion.
I am unfortunately unable to provide specific data.
4
3
2
1
PLEASE TAKE ALL FURTHER QUESTIONS AS REFERRING EXCLUSIVELY TO THE TYPEOF FUND DESCRIBED ABOVE.
- 62 -

Please cross out what does not apply.
Every years / months / weeks.
Every years / months / weeks.
Q4: Performance appraisal and performance incentives
a. How often is your own personal contribu-tion to fund performance measured?
How often is your own personal contribu-tion to fund performance appraised?
b. Your personal contribution to fund performance is judged by which criteria?
Please cross all categories.
5 = plays a predominant role !" 0 = plays no role.
practical relevance: 5 4 3 2 1 0
absolute fund performance.
the performance of other comparable funds.
the difference between fund performance and a relevant market or sector index.
risk-adjusted measures of relative performance such as Jensen´s Alpha.
other criteria: which ones?
c. How large was your performance-relatedbonus last year, expressed as a % ofyour gross annual basic salary?
Please provide a rough estimate.
I do not, as a rule, receive performance-related bonuses.
% of my annual basic salary (gross).
What was the criterion used to determinethe size of the bonus?
Please cross all categories.
5 = plays a predominant role !" 0 = plays no role.
practical relevance: 5 4 3 2 1 0
absolute fund performance.
relative fund performance (e.g. vis-à-vis a bench-mark index or the median of comparable funds).
the promotion of capital flows into the funds or the profitability of the investment company.
marketing aspects such as customersatisfaction or the acquisition of new clients.
in-house (subjective) appraisal by colleagues or superiors.
- 63 -

Q5: Decision procedures, attitude towards risk
a. Which method do you follow in reachingan investment decision?
Please select only that option which you believe correspondsmost closely to your method of reaching a decision.
I have committed myself in advance to a fewauspicious selection criteria. I reach myinvestment decision by weighting these cri-teria according to my own personal estimateof the situation and in this way I arrive at afinal summary assessment.
The focus of my stock analysis is choseneither on a case-by-case basis or dependingon the market situation and available infor-mation. I reach my investment decision byweighting these criteria according to my ownpersonal estimate of the situation and in thisway I arrive at a final summary assessment.
I have committed myself in advance to certain auspicious selection criteria or to acertain selection algorithm. I then set aboutidentifying stocks that satisfy these criteria.My investment decisions follow, as a matterof course, from these criteria.
3
2
1
b. What is your primary means of adequate-ly hedging positions in the portfolios youmanage, assuming you hedge your port-folio at all?
Please cross all categories.
5 = plays a predominant role !" 0 = plays no role.
practical relevance: 5 4 3 2 1 0
stop-loss techniques.
hedging transactions involving options/futures contracts.
dynamic hedging of the entire portfolio through the rule-governed weighting of
stocks and cash.
flexible weighting of shares and cash, dependingon how I read the current market situation.
I use futures contracts and options almost exclusively to ensure flexibility in taking or
abandoning investment positions or to acquire stocks at good value.
- 64 -

Please cross out what does not apply.
Up to years/months/weeks.
From the outset, the investment strategywas so conceived that significant under-performance results in an automatic adjust-ment of the strategy.
c. Which of the following attempts at a definition best reflects your personalunderstanding of the risk posed by stockmarket investments?
Please indicate an order of priority by assigning the number one to the definition to which you personally ascribe the most importance in your work, and the numberfour to the definition with the least importance.
Stock market investments involve a special kindof risk because …
_____ the wide variety of investment opportuni-ties makes it easy to overlook the betterones.
_____ significant price losses may be sustained.
_____ the value of the portfolio may be subjectto considerable fluctuations.
_____ there is a significant danger of performance falling below a specificbenchmark.
d. As a fund manager, you bear a heavy res-ponsibility on account of the investmentcapital that has been entrusted to you,and must take decisions in the face ofuncertainty and under time pressure.
In which of the following situations areyou most likely to experience particulartension?
Please indicate an order of priority by assigning the number one to the situation that you consider most likelyto cause tension, and the number five to the situation thatis least likely to have this effect.
_____ a period in which there is a sharp rise inmarket prices
_____ a period in which there is a sharp fall inmarket prices
_____ a period in which the price trend remainsunclear
_____ a period prior to the announced publica-tion of important macroeconomic data orof economic policy decisions.
_____ a period prior to the announced publica-tion of important corporate data or decisions.
e. Please try to imagine a situation in which your portfolio underperformed significantly.
How long would you, generally speaking,refrain from modifying your investmentstrategy?
- 65 -

Q6: Evaluation methods
a. Please rate the importance of the followingpotential buy signals for the inclusion ofstocks in the portfolio that you manage:
Please cross all categories.
5 = strong buy signal !" 0 = no purchasing demand.
strength of the buy signal: 5 4 3 2 1 0
an above-average rise in market price accompanied by an increase in turnover.
a market price that has stabilised at a level significantly lower than its all-time high.
growing expectations concerning higher dividends.
the raising of corporate earningsestinates by analysts.
observed purchases by other institutional investors.
corporate announcements and statements that are perceived as being positive.
a low valuation, on a cross-market or cross-sector comparison, based on profit
expectations for the coming financial years.
b. Which method of analysis do you primarily apply to the selection ofstocks?
Please cross all categories.
5 = plays a predominant role !" 0 = plays no role.
practical relevance: 5 4 3 2 1 0
technical analysis of price trends, price formation and turnover trends.
fundamental analysis based on forecast factors.
a structural econometric estimate of single- or multiple-factor models.
a portfolio optimisation approach, based on estimated yields and covariances.
- 66 -

How far in the future does the foreca-sting horizon for your different portfoliostypically, i.e. on average, lie?
Please cross all categories. Enter 00 if that particularmethod of analysis is not employed by you.
Technical analysis/chart analysis: years/months/days.
Fundamental analysis: years/months/days.
Single- or multiple-factor models: years/months/days.
Portfolio optimisation approach: years/months/days.
c. To which other criteria do you attributespecial importance when taking invest-ment decisions?
Please cross all categories.
5 = plays a predominant role !" 0 = plays no role.
practical relevance: 5 4 3 2 1 0
trading costs, such as bid-offer spread.
market capitalisation.
frequent reports and availability of independent analysts’ estimates.
previous corporate development as well as performance on stock market.
availability of tradable derivatives for transactionsor as a source of additional information.
- 67 -
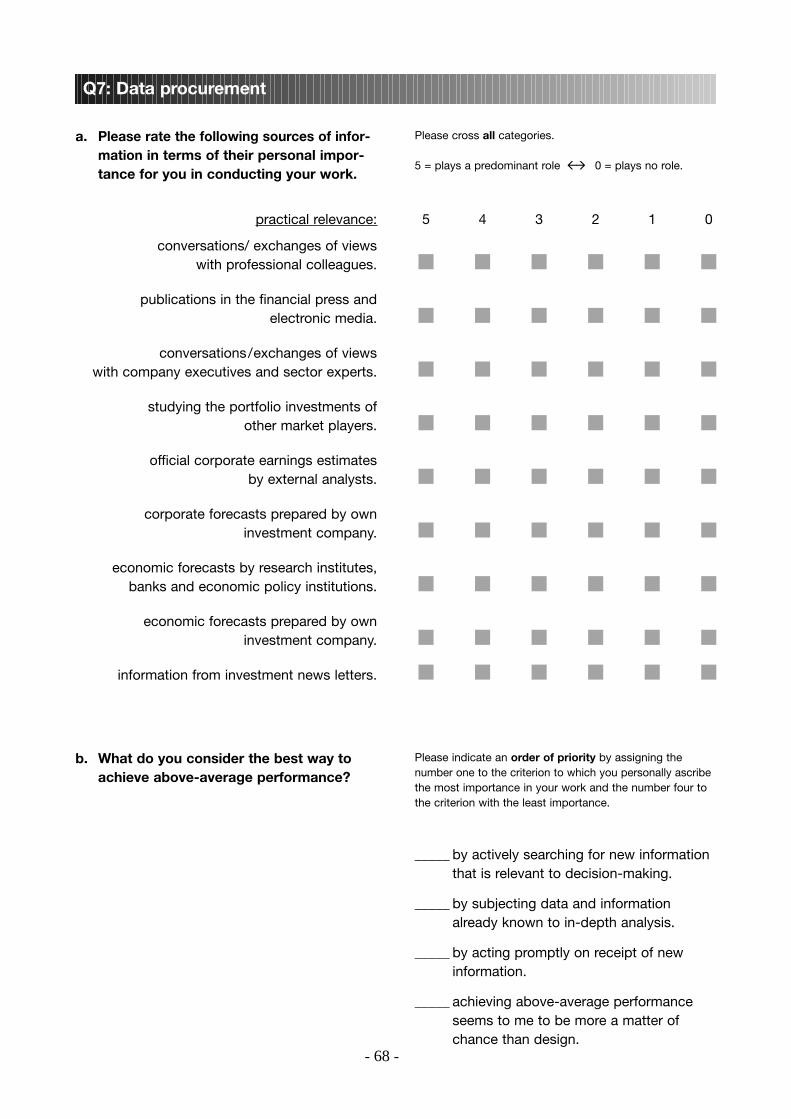
Q7: Data procurement
a. Please rate the following sources of infor-mation in terms of their personal impor-tance for you in conducting your work.
Please cross all categories.
5 = plays a predominant role !" 0 = plays no role.
practical relevance: 5 4 3 2 1 0
conversations/ exchanges of views with professional colleagues.
publications in the financial press and electronic media.
conversations/exchanges of views with company executives and sector experts.
studying the portfolio investments of other market players.
official corporate earnings estimatesby external analysts.
corporate forecasts prepared by own investment company.
economic forecasts by research institutes, banks and economic policy institutions.
economic forecasts prepared by own investment company.
information from investment news letters.
b. What do you consider the best way toachieve above-average performance?
Please indicate an order of priority by assigning the number one to the criterion to which you personally ascribethe most importance in your work and the number four tothe criterion with the least importance.
_____ by actively searching for new informationthat is relevant to decision-making.
_____ by subjecting data and information already known to in-depth analysis.
_____ by acting promptly on receipt of newinformation.
_____ achieving above-average performanceseems to me to be more a matter of chance than design.
- 68 -

Q8: Basic views, investment philosophy
a. Which of the following attitudes corre-sponds most closely to your basic viewof how the market segment which ismost relevant to your work functions?
Please indicate an order of priority by assigning the number one to the criterion to which you personally ascribethe most importance in your work, and the number three tothe criterion with the least importance.
_____ Market participants often tend to respondinappropriately at first to new information.Hence particular profits may best be earned over the short term by positioningone-self correctly at the right time.
_____ Investors are often slow to recognise newtrends and developments, and only gra-dually price new information into marketprices. Hence particular profits may bestbe earned over the longer term by strate-gically positioning oneself.
_____ In general, most companies in the marketare evaluated fairly, since market pricestend to reflect most of the accessibleinformation.
b. Which of the following best describes theguiding principle which you pursued incompiling your present portfolio?
Please cross all categories.
5 = plays a dominant role !" 0 = plays no role.
strength of the buy signal: 5 4 3 2 1 0
I expect above-average dividends and pay-outs in future from each of the shares
included in your portfolio.
I expect each of the shares included in your portfolio to experience above-
average increases in their market price.
I expect each of the stocks included in your portfolio to contribute
to a diversification of market risk.
I include stocks in my portfolio such that a specific stock market index
is replicated.
I am guided by other expectations (e.g. tax or balance-sheet advantages
for investors):
- 69 -

If you wish to provide any further information (participation entirely optional), we would, of course, be greatly interested in learning more about your views on the topics mentioned in the questionnaire.Please make brief informal comments (e.g. using key words) in the space provided below.
Further comments
Return of the questionnaire
Please avoid writing either your name or that of your investment company anywhere on the questionnaire.
Place the completed questionnaire in the large, postage-prepaid envelope provided and mail the sealed envelope to us.
To show our appreciation we have already reserved a copy of the research study in which you havejust participated for your own personal use. In order to ensure that you receive your free copy, pleaseplace your name and address on the accompanying postage-prepaid card to confirm your participation.Please return this card to us under separate cover.
Thank you for your assistance.
- 70 -
- 71 -
References
Avery, C. and Zemsky, P. (1998), Multidimensional Uncertainty and Herd Behavior in FinancialMarkets, American Economic Review, Vol. 88 No. 4, pp. 724-748.
Babak, E., Pedersen C. and Satchell, S. (2000), On the Volatility of Financial Risk: An Investiga-tion Using Returns from European Markets, European Journal of Finance, Vol. 6, pp. 18-38.
Backhaus, K., Erichson, B., Plinke, W. and Weiber, R. (1990) Multivariate Analysemethoden,Berlin/ Heidelberg.
Badrinath, S., Gay, G. and Kale, J. (1989), Patterns of Institutional Investment, Prudence, and theManagerial “Safety-Net” Hypothesis, Journal of Risk and Insurance, pp. 605-629.
Baker, M. (1998), Fund Managers' Attitudes to Risk and Time Horizons: The Effect of Perform-ance Benchmarking, European Journal of Finance, Vol. 4, pp. 257-278.
Banerjee, A. (1992), A Simple Model of Herd Behavior, Quarterly Journal of Economics, Vol.107 No. 3, pp. 797-818.
Barberis, N., Shleifer, A. and Vishny, R.W. (1998), A Model of Investor Sentiment, Journal of Fi-nancial Economics, Vol. 49 No. 3, pp. 307-343.
Bikhchandani, S. Hirshleifer, D. and Welch, I. (1992), A Theory of Fads, Fashion, Custom andCultural Change as Informational Cascades, Journal of Political Economy, Vol. 100 No. 5, pp.992-1027.
Bikhchandani, Sushil and Sunil Sharma (2000), Herd Behavior in Financial Markets: A Review,IMF Working Paper, WP/00/48.
Blommestein, H. (1998), Impact of Institutional Investors on Financial Markets, in Blommestein,H. and Funke, N. (1998), Institutional Investors and Institutional Investing; OECD, Paris
Bodie, Z., Kane, A. and Marcus, A. (1996), Investments, Boston/New York.
Bouchaud, J. and Cont, R. (2000), Herd Behavior and Aggregate Fluctuations in Financial Mar-kets, Macroeconomic Dynamics, Vol. 4 No. 2, pp. 170-196.
- 72 -
Brennan, M. (1993), Agency and Asset Pricing, London Business School working paper No. 172-193.
Brief, R. and Zarowin, P. (1999), The Value Relevance of Dividends, Book Value and Earnings,Stern School of Business working paper, New York University
Brocket, P., Cooper, W., Kwon, K. and Ruefli, T. (1997), A Study of Evaluations of Mutual FundInvestment Strategies, in: Essays in Decision making, Berlin, pp. 237-274.
Bruns, C. and Meyer-Bullerdiek., F. (1996), Professionelles Portfoliomanagement, Stuttgart.
Bruns, C. and Steiner, M. (1995), Wertpapiermanagement, Stuttgart.
Bundesgesetzblatt (Federal Law Gazette) of September 17, 1998, No. 62, part 1, Gesetz überKapitalanlagegesellschaften (investment company law), section 10 (1).
Bundesverband der Deutschen Investmentgesellschaften (2001), Zur Volkswirtschaftlichen Funk-tion des Investmentsparens, www.bvi.de/tourdefonds/volkswirt_funktionen.html.
Carhart, Mark M. (1997), On Persistence in Mutual Fund Performance, Journal of Finance, Vol.52 No. 1, pp. 57-82.
Cheung and Chinn (1999), Traders, Market Microstructure and Exchange Rate Dynamics, NBERworking paper 7416.
Cheung, Y. and Wong, C. (2000), A Survey of Market Practitioners’ View on Exchange Rate Dy-namics, Journal of International Economics, Vol. 51 No. 2, pp. 401-419.
Chevalier, J. and Ellison, G. (1995), Risk taking by mutual funds as a response to incentives,NBER working paper 5234
Davis, E. P. (1997), Why Might Institutional Investors Destabilise Financial Markets?, in:Richardson, J. (1997), World Ethics Report on Finance and Money, Distortions in the Finan-cial System, Responses and Perspectives.
De Bondt, W. and Thaler, R. H. (1985), Does the Stock Market Overreact?, Journal of Finance,Vol. 40, pp. 793-808.

- 73 -
De Bondt, W. and Thaler, R. H. (1987), Further Evidence on Investor Overreaction and StockMarket Seasonality, Journal of Finance, Vol. 42, pp. 557-581.
Devenow, A. and Welch, I. (1996), Rational Herding and Financial Economics, European Eco-nomic Review, Vol. 40, pp. 603-615.
Diamond, D. and Verrechia, R. (1981), Information Aggregation in a Noisy Rational ExpectationsEconomy, Journal of Financial Economics, Vol. 9 No. 3, pp. 221-235.
Dietz, R. and Leser, H. (1998), Auswahl von institutionellen Vermögensverwaltern – FachkundigeÜberprüfung der Kompetenz von Anbietern in verschiedenen Anlagesegmenten, Börsenzei-tung No. 195.
Eakins, S., Stansell, S. and Below, S. (1996), The Determinants of Institutional Demand forCommon Stock: Tests of the CAPM vs. Individual Stock Attributes, International Review ofFinancial Analysis, Vol. 5 No. 3, pp. 237-257.
Ebertz, T., Kosiolek, F. and Merkens, H., Arithmetik des aktiven/passiven Managements: Opti-male Mischung hängt vom Grad der Effizienz and der Informationsverteilung ab, Börsen-Zeitung of 24.04.1999.
Eviews User’s Guide (1997), Quantitative Micro Software, Irvine/California, pp. 415-466.
Falkenstein, Eric G. (1996), Preferences for Stock Characteristics as Revealed by Mutual FundPortfolio Holdings, Journal of Finance, Vol. 51 No. 1, pp. 111-135.
Fama, E. (1970), Efficient Capital Markets: A Review of Theory and Empirical Work, Journal ofFinance, Vol. 25, pp. 383-417.
Freeman, N. and Bartels, F. (2000), Portfolio Investment in Southeast Asia’s Stock Markets: ASurvey of Institutional Investors’ Current Perceptions and Practices, Institute of SoutheastAsian Studies working papers, economics and finance No. 3.
Friedman, B. (1995), Economic Implications of Changing Share Ownership, NBER Working Pa-per No. 5141.
Friedman, M. (1953), The Case for Flexible Exchange Rates, in Essays in Positive Economics,Chicago, pp. 157- 203

- 74 -
Friedman, M. and Savage, L. J. (1948), The Utility Analysis of Choices Involving Risk, Journal ofthe Political Economy, Vol. 56, pp. 279-304.
Gennotte, G. and Leland, H. (1990), Market Liquidity, Hedging, and Crashes, American EconomicReview, Vol. 80 No. 5, pp. 999- 1021
Gompers, Paul A. and Andrew Metrick (1998), Institutional Investors and Equity Prices, NBERWorking Paper No. 6723.
Grinblatt, M and Titman, S. (1992), The Persistence of Mutual Fund Performance, Journal of Fi-nance, Vol. 42, pp. 1977-1984.
Grinblatt, M., Titman, S. and Wermers R. (1995), Momentum Investment Strategies, PortfolioPerformance, and Herding: A Study of Mutual Fund Behavior, American Economic Review,Vol. 85 No. 5, pp. 1088-1105.
Grossman, S. and Stiglitz, J. (1980), On the Impossibility of Informationally Efficient Markets,American Economic Review, Vol. 70 No. 3, pp. 393-408.
Grünbichler and Pleschiutschnig (1999), Performance Persistence: Evidence for the EuropeanMutual Funds Market, University of St. Gallen working paper No. 99-13.
Hartung, J. and Elpelt, B. (1992), Multivariate Statistik, Munich.
Hau, H. , Information and Geography: Evidence from the German Stock Market, CEPR discussionpaper No. 2297.
Jegadeesh, N, and Titman, S. (1993), Returns to Buying Winners and Selling Losers: Implicationsfor Stock Market Efficiency, Journal of Finance, Vol. 48 No.1, pp. 65-91.
Jensen, Michael C. (1968), The Performance of Mutual Funds in the Period 1945-64, Journal ofFinance, Vol. 23 No.1, pp. 389-416.
Kahnemann, D. and Tversky, A. (1982) Judgment under Certainty: Heuristics and Biases, Cam-bridge.
Kendall, M. (1953), The Analysis of Economic Time Series, Part I: Prices, Journal of the RoyalStatistical Society, Series A, Vol. 96, pp. 11-34.

- 75 -
Lakonishok, J., Shleifer, A. and Vishny, R. W. (1992), The Structure and Performance of theMoney Management Industry, Brookings Papers on Economic Activity, Microeconomics, pp.339-379.
Maddala, G. S., Limited Dependent and Qualitative Variables in Econometrics, 1983.
Marquardt, H. and Sauer, A. (1999), Anlageentscheidungen erfordern mehr denn je StrukturiertesPortfolio-Management als zukunftsweisendes Konzept, Börsenzeitung No. 88.
Maug, E. and Haig, N. (1995), Herding and Delegated Portfolio Management: The Impact ofRelative Performance Evaluation on Asset Allocation, London Business School working pa-per.
Meffert, H. (1986), Marketing: Grundlagen der Absatzpolitik, Wiesbaden.
Menkhoff, L. (1995), Spekulative Verhaltensweisen auf Devisenmärkten, Tübingen
Menkhoff, L. (1998), The Noise Trading Approach – Questionnaire Evidence from Foreign Ex-change, Journal of International Money and Finance, Vol. 17, pp. 563.
Milligan, G.W., and Cooper, M.C. (1985), An Examination of Procedures for Determining theNumber of Clusters in a Data Set, Psychometrica, Vol. 50, pp. 159-179.
Modigliani, F. and Miller, M. (1959), The cost of Capital, Coporation Finance, and the Theory ofInvestment: Reply, American Economic Review, Vol. 49, pp. 655-669.
Nofsinger, John R. and Richard W. Sias (1999), Herding and Feedback Trading by Institutionaland Individual Investors, Journal of Finance, Vol. 54 No.6, pp. 2263-2295.
Nürk, B (1998), Institutional Investors and Their Implications for Financial Markets in Germany,in Blommestein, H. and Funke, N. (1998), Institutional Investors and Institutional Investing;OECD, Paris
Orphanides, A. (1996), Compensation and Risk Taking Behavior: Evidence from Mutual Funds,Finance and Economics Discussion Series, Federal Reserve Board of the United States ofAmerica.

- 76 -
Perry, G. L. (1992), Comment on: Lakonishok, J., Shleifer, A. and Vishny, R. W. (1992), TheStructure and Performance of the Money Management Industry, Brookings Papers on Eco-nomic Activity, Microeconomics, pp. 384-389.
Pound, J. and Shiller, R. (1987), Are Institutional Investors Speculators?, Journal of PortfolioManagement, Vol. 13 No. 3, pp. 46-52.
Pring, M.J. (1998), Introduction to Technical Analysis, New York.
Roll, R. (1992), A Mean/Variance Analysis of Tracking Error, Journal of Portfolio Management,pp. 13-22.
Scharfstein, D. and Stein, C. S. (1990), Herd Behavior and Investment, American Economic Re-view, Vol. 80 No. 4, pp. 465-479.
Sharpe, W. F. (1966), Mutual Fund Performance, Journal of Business, Vol. 39, pp. 119-138.
Shefrin, H. and Statman, M. (1985), The Disposition to Sell Winners Too Early and Ride LosersToo Long: Theory and Evidence, Journal of Finance, Vol. 40 No. 3, pp. 777-790.
Shiller, R. (1989), Investor Behavior in the October 1987 Stock Market Crash: Survey Evidence,in: Market Volatility, London: MIT Press, pp. 379-402.
Shiller, R. (1995), Conversation, Information, and Herd Behavior, American Economic Review,Papers and Proceedings, Vol. 85 No. 2, pp. 181-185.
Shiller, R. (2000), Measuring Bubble Expectations and Investor Confidence, Journal of Psychol-ogy and Financial Markets, Vol. 1 No. 1, pp. 49-60.
Shiller, R. and Pound, J. (1989), Survey Evidence on Diffusion of Interest and Information AmongInvestors, Journal of Economic Behavior & Organization, Vol. 12, pp. 47-66.
Shleifer, A. (2000), Inefficient Markets – An Introduction to Behavioural Finance, Oxford.
Shleifer, A. and Summers, L. (1990), The Noise Trader Approach to Finance, Journal of Eco-nomic Perspectives, Vol. 4 No. 2, pp. 19-33.
Shleifer, A. and Vishny, R. (1997), The Limits of Arbitrage, Journal of Finance, Vol. 52, pp. 35-55.

- 77 -
Sirri, E. and Tufano, (1992), Competition and Change in the Mutual Fund Industry, in Hayes, S.(1993), Financial Services: Perspectives and Challenges for the 1990s.
Summers, L. (1986), Does the Stock Market Rationally Reflect Fundamental Values?, Journal ofFinance, Vol. 4 No. 3, pp. 591-602.
Taylor, M. and Allen, H. (1992), The Use of Technical Analysis in the Foreign Exchange Market,Journal of International Money & Finance, Vol. 11, pp. 304-314.
Trzcinka and Shukla, (1992), Performance Studies, Basil Blackwell Series on Financial Markets,NYU Center.
Wermers, R. (1995), Essays on the Investment Behavior of Institutional Investors, Diss. Universityof California, Los Angeles.
Wermers, R. (1999), Mutual Fund Herding and the Impact on Stock Prices, Journal of Finance,Vol. 54, pp. 581-622.
Wittrock, C. (1995), Messung und Analyse der Performance von Wertpapierportfolios, Bad So-den/Taunus.

- 78 -
The following papers have been published since 1999:
January 1999 Die Geldmenge und ihre bilanziellenGegenposten: Ein Vergleich zwischenwichtigen Ländern der EuropäischenWährungsunion * Dimut Lang
February 1999 Die Kapitalmarktzinsen in Deutschlandund den USA: Wie eng ist der Zinsverbund?Eine Anwendung der multivariatenKointegrationsanalyse * Manfred Kremer
April 1999 Zur Diskussion über den Verbraucher-preisindex als Inflationsindikator –Beiträge zu einem Workshop in derDeutschen Bundesbank *
July 1999 Monitoring Fiscal Adjustmentsin the European Union and EMU Rolf Strauch
October 1999 Cyber money as a medium of exchange Gabriele Kabelac
December 1999 Implicit Government Guaranteesand Bank Herding Behavior Rasmus Rüffer
December 1999 Implications of the new sesonaladjustment method CensusX-12-ARIMA for currenteconomic analysis in Germany Robert Kirchner
February 2000 How Safe Was the „Safe Haven“?Financial Market Liquidity duringthe 1998 Turbulences Christian Upper
* Available in German only.

- 79 -
May 2000 The determinants of the euro-dollarexchange rate – Synthetic fundamentals Jörg Clostermannand a non-existing currency Bernd Schnatz
July 2000 Concepts to Calculate EquilibriumExchange Rates: An Overview Ronald MacDonald
August 2000 Kerinflationsraten: Ein Methoden-vergleich auf der Basis westdeutscherDaten * Bettina Landau
September 2000 Exploring the Role of Uncertaintyfor Corporate Investment Decisionsin Germany Ulf von Kalckreuth
November 2000 Central Bank Accountability andTransparency: Theory and Some Sylvester C.W. EijffingerEvidence Marco M. Hoeberichts
November 2000 Welfare Effects of Public Stephen MorrisInformation Hyung Song Shin
November 2000 Monetary Policy Transparency, PublicCommentary, and Market Perceptionsabout Monetary Policy in Canada Pierre L. Siklos
November 2000 The Relationship between the FederalFunds Rate and the Fed’s Funds RateTarget: Is it Open Market or OpenMouth Operations? Daniel L. Thornton
November 2000 Expectations and the Stability Problem George W. Evansfor Optimal Monetary Policies Seppo Honkapohja
* Available in German only.

- 80 -
January 2001 Unemployment, Factor Substitution, Leo Kaasand Capital Formation Leopold von Thadden
January 2001 Should the Individual Voting Records Hans Gersbachof Central Banks be Published? Volker Hahn
January 2001 Voting Transparency and Conflicting Hans GersbachInterests in Central Bank Councils Volker Hahn
January 2001 Optimal Degrees of Transparency inMonetary Policymaking Henrik Jensen
January 2001 Are Contemporary Central BanksTransparent about Economic Modelsand Objectives and What DifferenceDoes it Make? Alex Cukierman
February 2001 What can we learn about monetary policy Andrew Claretransparency from financial market data? Roger Courtenay
March 2001 Budgetary Policy and Unemployment Leo KaasDynamics Leopold von Thadden
March 2001 Investment Behaviour of German EquityFund Managers – An Exploratory Analysisof Survey Data Torsten Arnswald