Embed Size (px)
Citation preview
T. Al Austin Robert A. Lohnes F. Wayne Klaiber
Investigation of Uplift Failures in Flexible Pipe Culverts
~t. Iowa Department ~l of Transportation
. .
Sponsored by the Iowa Department of Transportation Highway Research Advisory Board
March 1990
Iowa DOT Project HR-306 ISU-ERI-Ames-90227
-College of · Engineering
Iowa State University

The opinions, findings, and conclusions expressed in this publication are those of the authors and not necessqrily those of the Highway Division of the Iowa Department of Transportation.
£ l .
I
T. Al Austin Robert A; Lohnes · F. Wayne Klaiber ·
. .
·investigation.of .Uplift Failures . ·in Flexible Pipe Culverts
Sp6nsored by the Iowa Department of Trcmsportation Highway Research Advisory Board
March 1990
Iowa DOT Project HR-306 -ISU-ERI-Ames-90227
.· .. ·· · .. ',~1· en i~eep.ng . researc · · institute
iowa state university
i
ABSTRACT
This study was precipitated by several failures of flexible
pipe culverts due to appa+ent inlet floatation. A survey of Iowa
County Engineers revealed 31 culvert failures on pipes greater than '
72" diameter in eight Iowa counties within the past five years. No
special hydrologic, topography, ·and .geotechnical· environments
appeared to be more susceptible to failure.· However, most failures
seemed to be on pipes flowing in inlet control. Geographically,
most of the failures were in the southern and western sections of
Iowa. The forces· acting on a culvert pipe are quantified. A worst
'case scenario, where the pipe is completely plugged, is evaluated
to determine the magnitude of forces that ·.must be resisted by a tie
down or headwall. Concrete · headwalls or slope collars are
recommended for most pipes over 4 feet in diameter.

ii
ACKNOWLEDGEMENTS
This study was sponsored by the Highway Research Advisory
Board, Iowa Department of Transportation under Research Project HR-
3 06. The authors e.xtend sincere appreciation to Darrell Coy, Iowa
DOT for nis assistance in tne conduct of this project.· A special
thanks go to the Iowa county engineers who ·provided valuable
information concerning flexible pipe culverts in.their counties.
Special thanks are accorded to graduate students Michael
Chyi: Dipak Patel, and Steve Van Welding for their contributions to
this project.
iii
TABLE OF CONTENTS
Abstract·
Acknowledgments
Problem Definition
IDOT Survey (1975)
Objectives
1988 Survey Results
Hydraulic Considerations
Types of Flow Entrance Conditions Computer Prog~am Classification· of Flow Profiles Simulation of Water Surface Profiles Use of the Models
. Pore Pressure Analysis
Objective and Assumptions Moment Diagrams for Partial Flows Static Analysis with Variable Depth of Cover Discussion of Pore Pressure Analyses
case Histories ·
Site 1 Site 2
Conclusions and Recommendations
General Conclusions Tentative Design Suggestions based on the Pore . Water Analyses ·
Recommendations to Develop Rational Design of Tiedowns for CMP
Recommended Action
References
Appendices
A: Photos of Culve·rt Failures B: Water Surface Profile Computer Programs C: Iowa DOT Road Design Standards D: FHWA Notice E: Indiana DOT Design Standards
i
ii
1
1
3
4
6
7 ·8 12 16 18 20
22
22 24 32 37
40
40 42
46
46 46
47
47
48
.49
49 60
ios 108 116 119
1
1. PROBLEM DEFINITION
Flexible pipe culverts .(corrugated metal pipes) are important
·components of the drainage systems associated with Iowa's. road
system. Many county engineers have used large diameter flexible
.pipe culverts to replace small bridges and have realized
significant savings to the counties. However, there is a
perception that in some situations, these· flexible pipe culverts
have not performed adequately. In late 1987, the authors.met with
several Iowa Department of Transportation (Iowa DOT) personnel.to . .
discuss research needs regarding apparent.uplift failures of large
corrugated metal pipe (CMP) culverts. This meetin·g led to
. submittal of a problem statement, and subsequently a. research
proposal to the Highway Re.search· Board, Iowa .DOT. See Appendix A
for photographs of several recent culvert failures. "This report
summarizes the findings of this. research· program. and makes ' .
recommendations for immediate action and future research.
1.1. Iowa DOT Survey (1975)
A survey of Iowa county engineers, conducted by the Iowa DOT
in 1975, attempted to.determine the extent of CMP culvert failures
in Iowa. About 50% ~f the county engineers in Iowa _responded. No
additional follow-up to the questionnaire . was 'made.
shows the results of the survey.
Table 1.1
2
Table 1.1. Survey Results Iowa DOT, 1975
Pipe Size Numbe+·of Structures Number of Failures (Inch) · Projecting Beveled Projecting Beveled
Inlets Inlets Inlets Inlets
60 to 96 226 166. 2 11 97.to 120 19 46 1 5 121 up 11 53 2 9
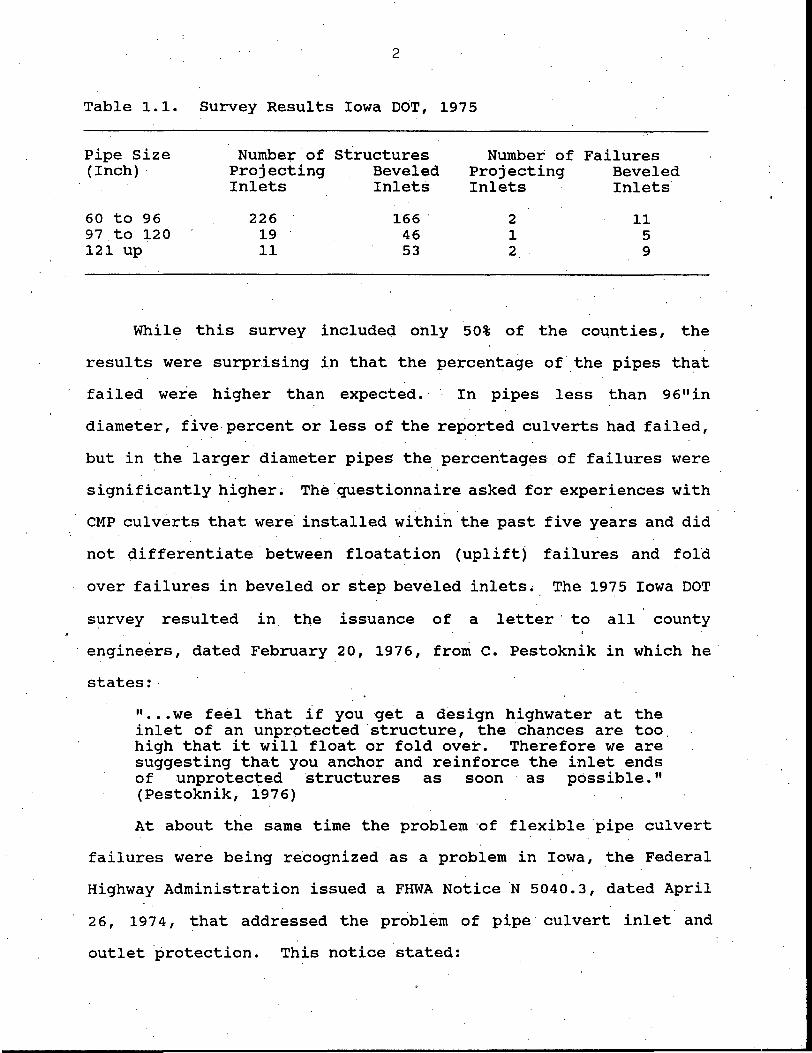
While this survey included only 50% of the counties, the
results were surprising in that the percentage of .the pipes that
failed were higher than expected. . In pipes less than 96 11 in
diameter, five. percent or less of the reported culverts had failed,
but in the larger diameter pipes the percentages of failures were
significantly higher. The questionnaire asked for experiences with
CMP culverts that were installed within the past five years and did
not differentiate ·between floatation (uplift) failures and fold
over failures in beveled or step beveled inlets. The 1975 Iowa DOT
s~rvey resulted in the issuance of a letter · to all county
engineers, dated February 20, 1976, from c. Pestoknik in which he·
states: ·
11 ••• we feel that if you -get a design highwater at the inlet of an unprotected structure, the chances are too high that it will float or fold over. Therefore we are suggesting that you anchor and reinforce the inlet.ends of unprotected structures as soon as possible. 11
(Pestoknik, 1976)
At about the same time the problem ·of flexible pipe culvert
failures were being recognized as a problem in Iowa, the Federal
Highway Administration issued a FHWA Notice ·N 5040.3, dated April
26, 1974, that addressed the problem of pipe culvert inlet and
outlet ·protection. This notice stated:
3
"Positive engineering attent.ion should be given· to the need for providing protection at the ends of all pipe culverts having a height of. 48 inches and .·larger." (FHWA, 1974)
Enclosed with the FHWA Notice were headwall and slope paving
design standards for circular and slope tapered culverts up to 180
. inches in diameter. The. Iowa DOT included the FHWA headwall and
slope paving standard designs with the 1975 Survey results.sent to
all Iowa County Engineers and suggested the county engineers adopt
some type of tie down.· structures; such as, the FHWA standards.
Despite the above efforts by the Iowa DOT and the FHWA,
reports of CMP culvert .failures continued to arrive at the Iowa DOT
headquarters. Concern that current design and/or construction.
p·ractices were not adequate led to the development of this project.
2. OBJECTIVES
.The· ultimate goal of this project is to eliminate or
significantly. reduce ·uplift failures in CMP culverts through
improved design of new · structures and. retrofitting· of existing . .
·culverts. Elimination or reduction of uplift failures can be
realized only if certain intermediate objectives are met. The
objectives of this project are:
• define the · hydrologic, topographic, and geotechnical environments and pipe . geometries most conducive to CMP culvert uplift failures, ·
• identify. the mechanism(s) that causes.uplift and subsequent failure of CMP culverts, and
. . • determine the magnitude and distribution of the forces that
are likely to cause flotation of ,CMP culverts. ·
The research plan included a new survey of Iowa county
engineers to obtaln more specific information about the number of
4
·cMP failures and the hydraulic, geotechnical and structural
environments associated with each failure. Data on tie downs,
anchors and cutoffs that are being used were also to be collected.
These data were to be used to develop and evaluate hypotheses about
a "worst possible case scenario" and "a most likeli to be .stable
scenario". Based on these scenarios, evaluations of the potential
loading on the culvert was developed~ The amount of resisting
force. located at the inlet of the pipe necessary to maintain.
structural equilibrium was determined for a range of geometric r
conditions. "Post mortem" evaluations of two failures for which . .
sufficient data were available were ·conducted to quanti~y ·the
.loadings derived.
3. 1988 SURVEY RESULTS
A survey questionnaire was sent to all Iowa County Engineers
iri April 1988 requesting information on the· number of culverts that
had failed due to inlet floatation or fold over. . . Sixty eight
questionnaires . were returned completed (69% of the counties).
Eight counties (12 % of those reporting) indicated they had one or . .
more culvert failures during the past five years. This compares to
eight counties reporting failures (16% of the 50 ·counties
. reporting)· in the 1975 Iowa DOT survey. Despite the use of various
tie down structures, CMP failures are still qccurring. Of the
counties repor.ting failures, 75% indicated that they used some form
of tie down, including pile and. cable tie downs, tied concrete
curtain walls, concrete slope collars,· and tied sheet piling cut
off wall structures. Therefore, it appears that many forms of tie
5
downs being._ utilized have not solved the uplift problems and thus
improved designs are still needed.
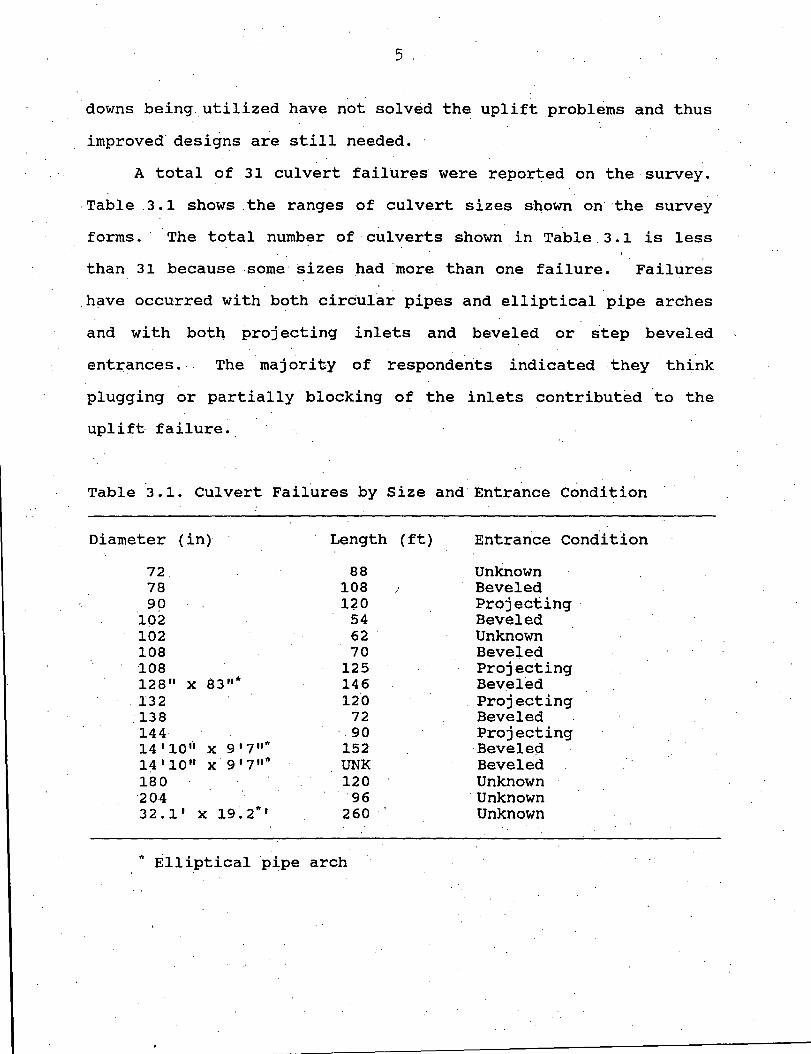
A total of 31 culvert failur~s were reported on the survey.
-Table .3.1 shows .the ranges of culvert sizes shown on· the survey
forms. · ·The total number of culverts shown in Table . 3. 1 is less
than 31 because some sizes .had ·more than one failure. Failures
have occurred with both cirdular pipes and elliptical pipe arches
and with both projecting inlets and beveled or step beveled
ent:r:ances. The majority of respondents indicated they · think
plugging or partially blocking of the inlets contributed to the
uplift failure.
Table 3.1. Culvert Failures by Size and Entrance Condition
Diameter {in)
72 78 99
102 102 108 ·100 128 11 x 83 11 *
. 132 138 144 14 I 10 II X 9 I 7 II*
14 1 10" x·9 1 7 11 * 180 ·204 32.1 1 x 19~2* 1
Length {ft)
88 108 / 1~0
54 62 70
125 146 120
72 . 90 152 UNK 120
96 260.
* Elliptical ·pipe arch
Entrance Condition
Unknown Beveled Projecting · Beveled Unknown Beveled Projecting Beveled Projecting Beveled Projecting Beveled Beveled Unknown
·unknown Unknown
6
No unique geologic or .hydrologic conditions could be
identified that characterized the majority of the failure sites.
The problem appears to be more common in those regions of the state
where significant elevation drop exists across the culvert, and the
downstream river valley would yield. low tailwater. Also, the
problems seem more common in areas of the state where loess derived
soils occur.
Field trips w~re made to seven county that responded with ·
failures to the· survey and data on faiiures were obtained. . Two
sites will be discussed in detail later in the section ori case
History.
A brief collection of photos from Iowa DOT staff and those
taken by the principal investigators on this proj.ect are included
. in Appendix A.
4. HYDRAULIC CONSIDERATIONS
An analys'is of the hydraulics of flow. into and through
culverts is necessary to understand the various loadings that may
lead to uplift failures.· A culvert represents a reduction in cross
sectional area of flow for the approaching water; therefore,·the
velocity of the water· in the culvert must be increased
proportionally to the_reduction in cross sectional area. In order
to gain the energy ne~ded to accelerate the flow, an increase in ' ' .
' . '
potential energy upstream of the culvert must .occur. This . increase
in potential energy is developed by a ·r-ise in the water level
upstream of the culvert. This headwater also provides the pressure
for uplift of the pipe inlet, if the water is able to saturate the
•'
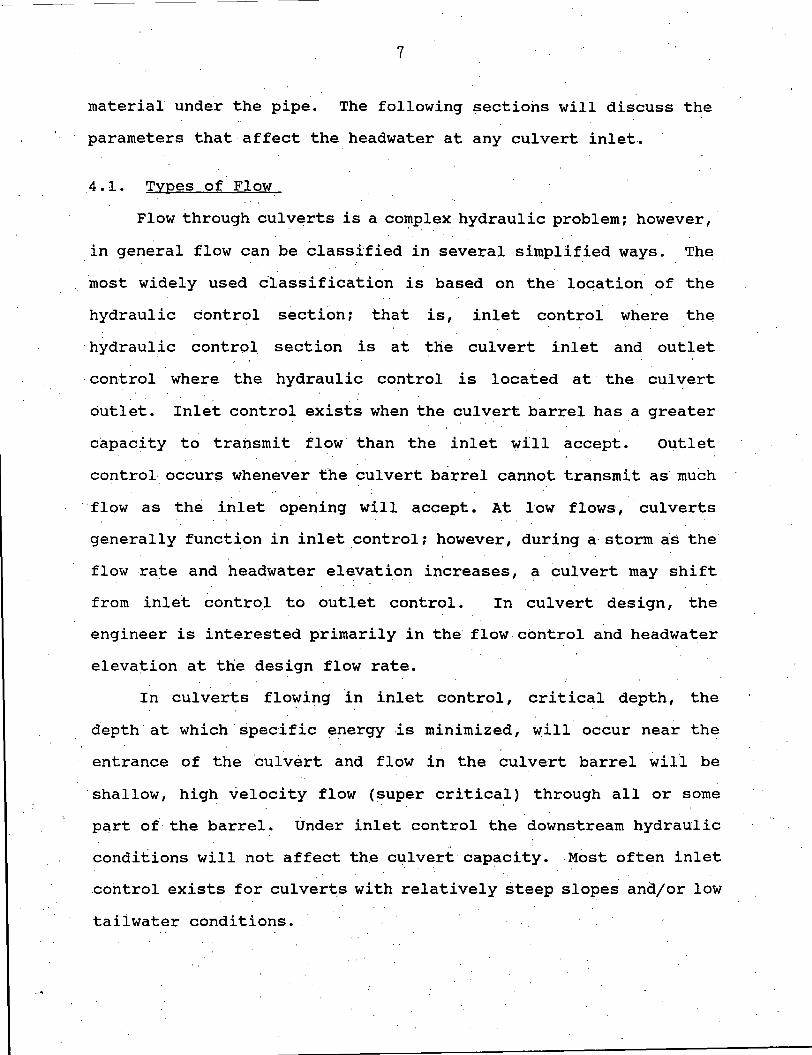
7
material under the pipe. The following sectiohs will discuss the
parameters that affect the headwater. at any culvert inlet~
.4.1. Types of Flow
Flow through culverts is a complex. hydraulic problem; however, ·
in general flow can be classified in several simplified ways. The
~est widely used 6lassification is based on the location of the
hydraulic control section; that is, inlet control where . the
hydraulic control section is at the culvert inlet and outlet , .
·control where the hydraulic control is located at· the culvert
outlet. Inlet control exists when the culvert barrel has a greater
capacity to transmit flow than the inlet will accept. outlet
control· occurf;; whenever the culvert barrel cannot transmit as· much , ,
flow as the inlet opening will accept. At l·ow flows, ·culverts
generally function in inlet control; however, during a storm as the
flow rate and headwater elevation increases, a culv~rt fuay shift
from inlet control to outlet control. In culvert design, the
engineer is interested primarily in the flow.control and headwater
elevation at the design flow rate.
In culverts flo~ing ln inlet control, critical depth, the
depth at which specific energy is minimized, will occur near the
entrance of the ·culvert and flow in the culvert barrel will be
·shallow, high velocity flow (super critical) through all or some
part of the barrel. Under inlet control the downstream hydraulic
condi~ions will not affect the culvert capacity. -M6st often inlet
control exists for culverts with relatively steep slopes and/or low
tailwater conditions.
8
In outlet control the headwater is dependent on the tailwater
conditions, the friction loss in the pipe· and the entrance
condition. Downstream conditions affect the headwater upstream of
the culvert. Culverts flowing in outlet control . generally ·have
flatter slopes than.those in inlet control, higher tailwater depths
and frequently the culvert barrel is flowing full or near full .
. The weight of the water within the culvert serves . as a . .
resisting force against the uplift pressures, so culverts that are
flowing full or near full. have the largest resisting.force against
uplift. The.problems of inlet uplift appear to be associated with
culverts flowing in inlet control since in inlet control the flow
is supercritical through all or most of . the culvert barrel ' .
resulting in depths of flow in the culvert barrel that are less
than the headwater depth and most often are less than the diameter
of the pipe. Uplift effects will be increase if the inlet is
blocked or partially blocked with debris because the depth of. flow,
and therefore the weight of the water, in the culvert will be
reduced.
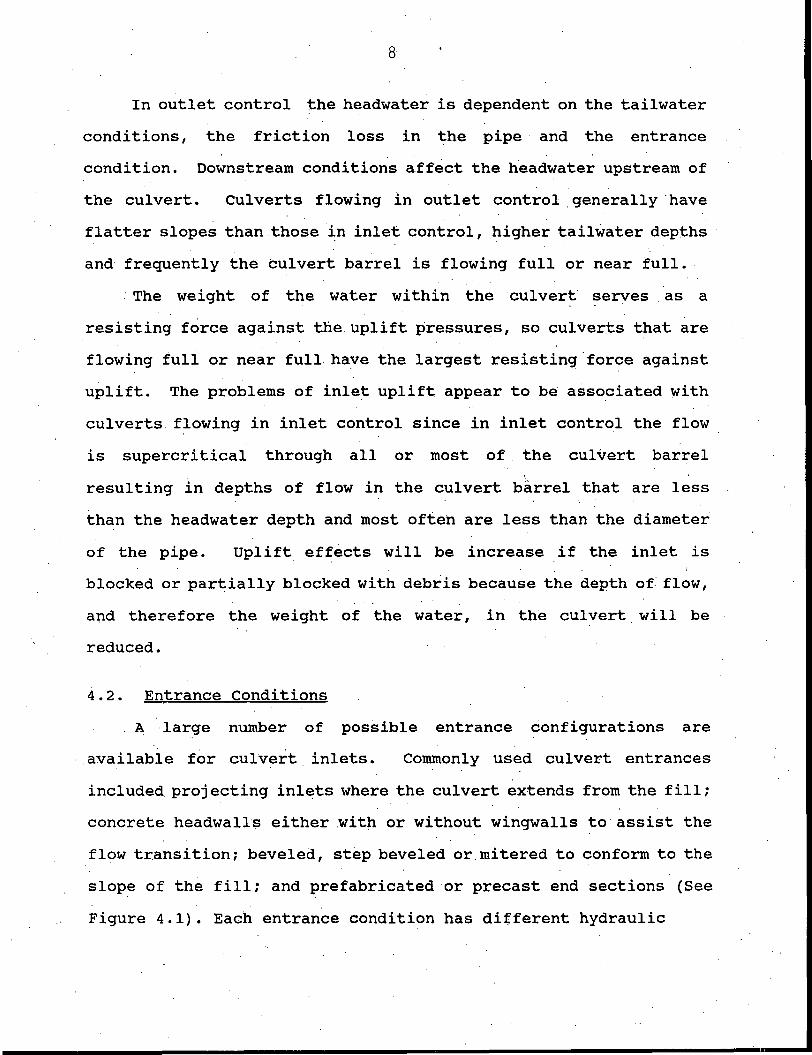
4.2. Entrance Conditions
A large number of possible entrance configurations are
·.available for culvert. inlets. Commonly used culvert entrances
included. projecting inlets where the culvert extends from the fill;
concrete headwalls either .with or without wingwalls to assist the
flow transition; beveled, step beveled or.mitered to conform to the
slope of the fill; and prefabricated or precast end sections (See
Figure 4.1). Each entrance condition has diiferent hydraulic
PROJECTING BARREL
·PRECAST ENO SECTION
9
CAST-IN- PLACE CC).ICRETE HEADWALL a.· WINGWALLS
. /)) ) ENO MITERED TO THE SLOPE
Fig. 4.1 Typical inlets for culverts .. (~EC 5, 1985)

---------------
10
properties that can be estimated using techniques such as those
outlined in "Hydrauli6 Design bf Highway Culverts" (HEc~s, 1985).
In Iowa, most CMP culverts are either projecting inlets, step
beveled inlets or use a standard CMP end section. In general, at
a constant flow rate through the culvert, the headwater depths will
be greatest for projecting inlets followed by step.beveled inlet
and standard end section, in the order of decreasing headwater.
Projecting inlets, especially for large diameter p°ipes, project a
significant pipe distance uncovered by the fill. Fqr e.xample, a 12
feet diameter circular pipe projecting from . a fill with 3
horizontal to 1 vertical side slopes will extend out of the fill 36
feet. The force available to· resist uplift pressures in this
uncovered length consists only of the weight of the pipe and water
w1thin the pipe. This condition creates the mos.t severe situation
possible for uplift failure.
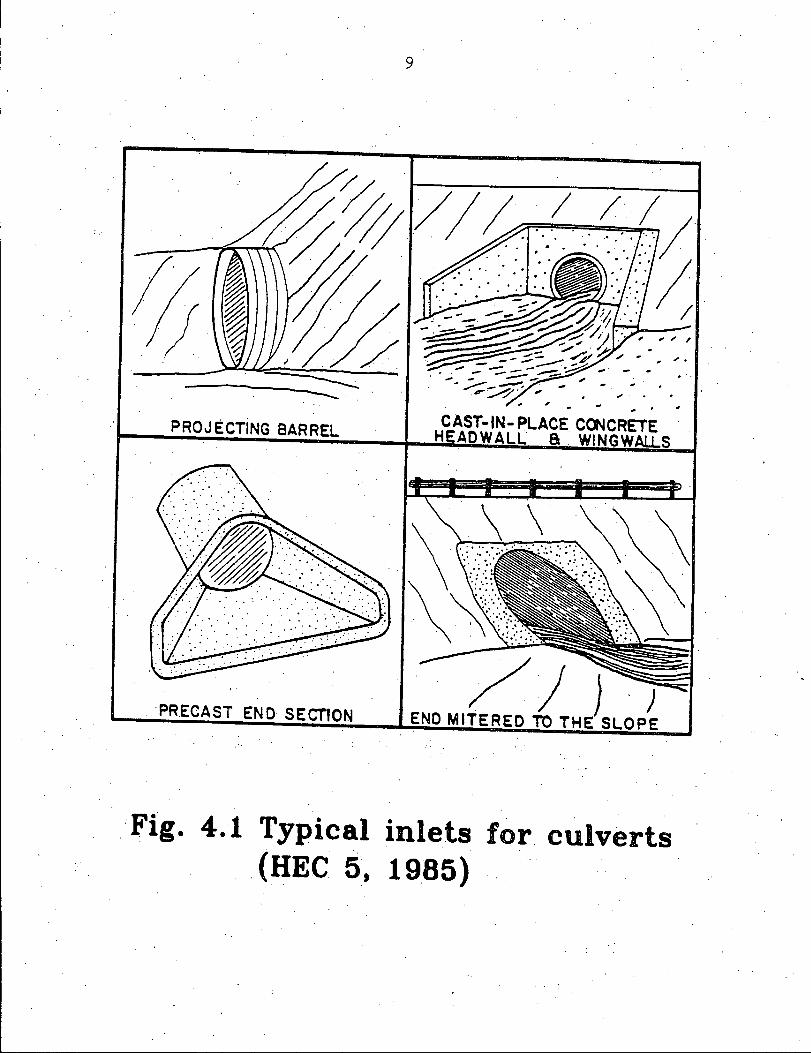
Pipes with step beveled .inlets generally have the fill
extending to the top of the pipe with little or no uncovered pipe .
. The step bevel that .Iowa uses consists of a vertical ·cut· 1/ 4 of the
diameter on the top and bottom of the pipe and a sloping section
between (See Figure 4 . 2) • . The step bevel inlet improves the
hydraulic efficiency of. the inlet and decreases the flow
contraction that occurs in the inlet. An added advantage of step
beveled inlets is the increased resisting force due to th~ extra
weight of the fill on top of the inlet since it is not projecting
from the fill. However, cutting the pipe in a step bevel.reduces
the internal resistance of the pipe to deformation.
11
2' H
A T . . "A A
D ~ . D/2
A .A
"A -t/4 A A
f • AA.
A A ·A A A . 4'·
A. . A. j_ ~
. End VieN Side View
Fig 4.2 Schematic ·of headwall currently remmended by . . . ' .
Iowa DOT for step beveled inlets
12·
· Headwalls at culvert inlets allow not only the. fill to come to
the top of the pipe, but also provides an extra concrete mass at
the pipe entrance to resist the uplift pressure. The same affect
can be obtained through concrete slope paving around step beveled
inlets. Adequate provision for attaching the pipe to the· headwall
must be provided if the pipe and headwall are to resist uplift
together. In some cases, partial headwalls, extending only 1/3 to
1/2 of the pipe diameter have been used to provide extra concrete
mass to resist uplift.
4.3. Computer Program
A computer program was developed ·as . part of .this res.earch to
estimate the water surface profile through a culvert with various
entrance condi ti.ens and flow controls. This computer .model uses
the gradually varied open channel flow equation and the direct step
method to estimate the water surface profile through a cµ.lvert. It
is recognized · that at some locations in a culvert the flow
condition may be rapidly varied, especially hear the entrance to
the culvert. Rapidly varied flow is.not included in the computer
model.
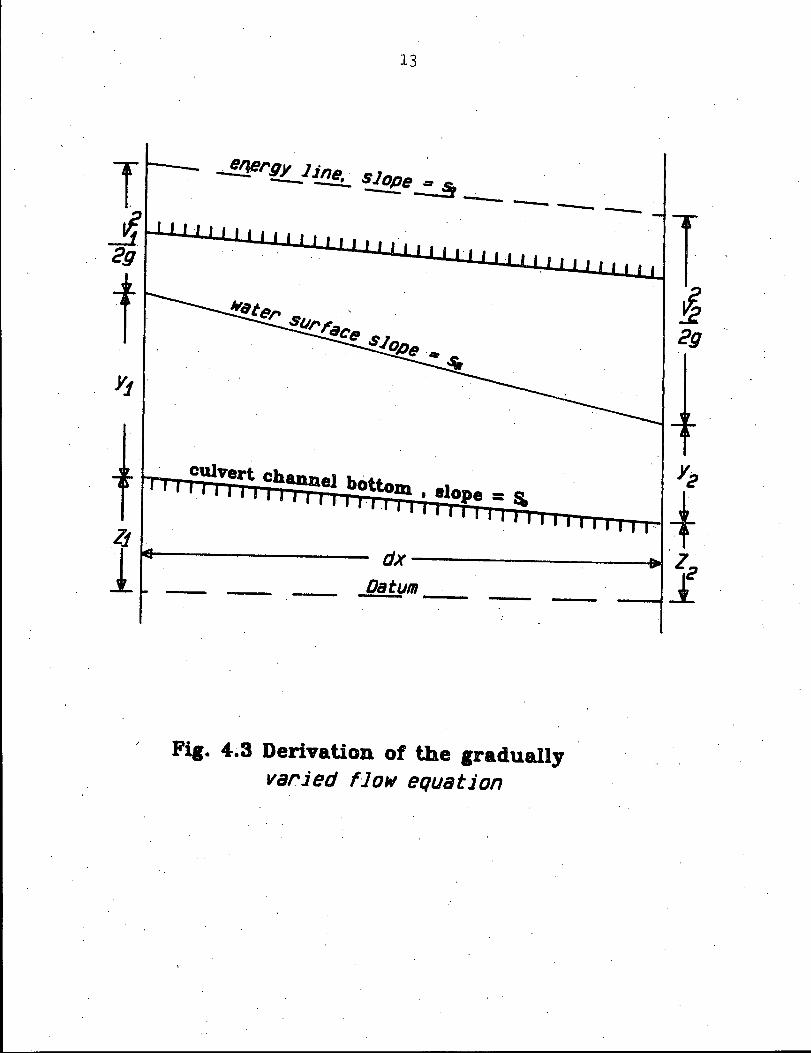
A typical gradually varied flow situation in an el.emental
length of a culvert is shown in Figure. 4. 3. This situation assumes
the culvert is not flowing full. as will be the case in most inlet
control situations and in some outlet control situations. Applying
the energy equation at section i and section 2 in Figure 4.3 (in
the direction of flow) gives:
13
Fig. 4~3 Derivation of the gradually varied flow equation
14
where:
V1 and V2 are velocities at sections 1 and 2; respectively, ·
Y1 and Y2 are depth at section 1 and 2 respectively,
z 1 and z 2 are invert elevations at section 1 and 2 respectively, and
hf is the headless between sections 1 and 2.
The slope on the energy gradeline, sf, is headless per unit
length of pipe or hrfdx. Thus hf = se dx. The slope of the channel
bottom, s 0 , is the difference in elevation per unit pipe length or
(z1 - z 2 )/dx. Thus, (z 1 "'." z 2 ) = s 0 dx. Rearranging equation 4.1
and substituting for hf and .z1 - z 2 gives:
4.2
The specific energy, E,· in open channel flow is the depth of flow,
y, plus the velocity head (V2/2g). Thus Equation 4. 2 can · be
rewritten as:
4.3
Equation 4.3 can be solved using the direct step method. In
the direct step method, the computations begin at a hydraulic
control where. the depth and velocity of the flow is known a.nd
proceed either upstream for subcritical flow (depths of flow·
greater than critical depth) or downstream for supercritical flow
15
·(depths of flow less than critical depth). If the design
discharge, culvert size and material, and culvert entrance
condition have been determined, all. hydraulic properties at the
control section can be found. Assume, the·control section becomes
section 1 in equation 4. 3. The specific energy, E1 · can be
determined since the depth and velocity must be known at the
control section. A depth, y 2 , is assumed at some other section;
however, the location of this section is not known at this time.
The velocity can be found from the assumed .y2 , the culvert shape,
and the design· discharge using the continuity equation. The
distance upstream or downstream to the point where the depth of
flow.is y2 is then calculated using equation 4~3. The slope on the
energy gradelin.e, sff is determined using a uniform flow equation,
such as the Manning Equation;
.where:
v = n = R = A = p =
st= [ v n /(1.486 R 213 )]2
velocity Manning roughness dependent on culvert material · Hydraulic radius = A/P area perpendicular to flow Wetted perimeter
4.4
Once the distance upstream, dx~ is calculated, the section 2 ·
in equation 4. 3 becomes a "new" section 1 for the next step
computation. Repeated application of .equation 4.3 in this manner
provides computation of the entire surface water profile through
the culvert. Once the profile is determined, the weight of water
in the pipe can be found by simple geometry.
...
16
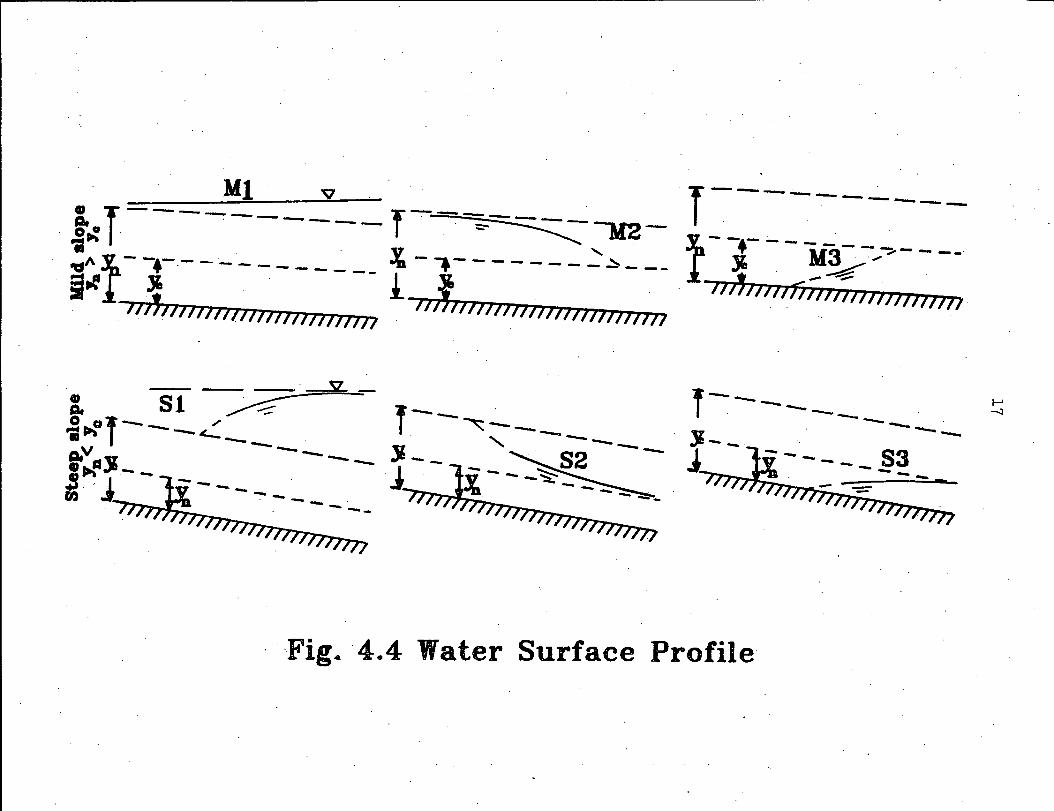
4.4. Classification of Flow Profiles
For a given discharge and culvert, . the . normal depth and
critical depth can be determined. Normal depth is the depth
corresponding to uniform flow or the depth where the energy lost·
due to friction equals the energy. gained through a change in
elevation. Critical depth is the depth ·that corresponds to the
minimum specific energy at a given flow rate. For hydraulically
mild .sloping channels normal ·depth is greater than critical depth.
For hydraulically steep sloping channels normal depth is· less than
critical depth. If the slope on a channe~ is equal to the critical
slope, normal depth and critical depth are equal. Thus, critical
and normal depths are used to divide the possible flow profiles
into three zones based on the relationship between the depth of .
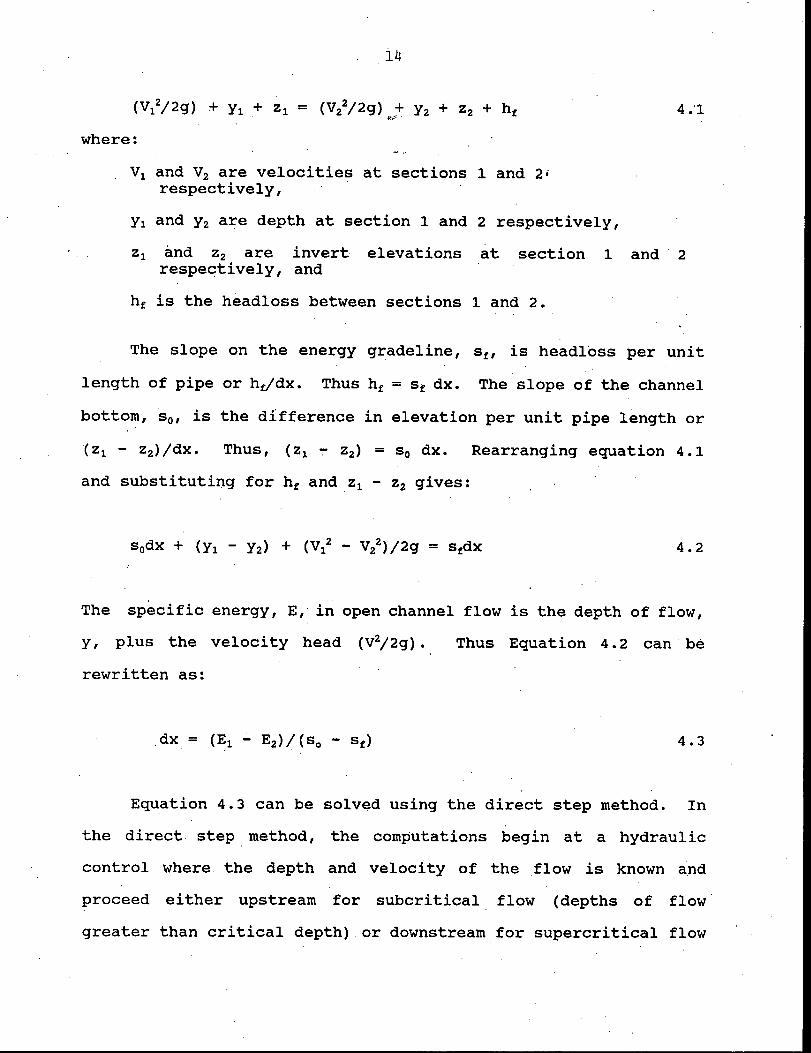
flow in the channel and critical and normal depth (Figure 4.4). If
the depth of flow is above the upper line the flow profile is in
Zone 1 (i.e. M-1 or S-1 on Figure 4.4). If the depth is·between
normal and critical depth the profile is in Zone 2 (i.e. M-2 or s-2
on Figure 4. 4) , and if the depth of flow is below the' lower line,·
the flow profile is in zone 3 (i.e. M~3 or S-3 on Figure. 4.4).
Figure 4.4 shows the flow profiles used in.the model developed in
this project. It is necessary to determine the flow profile
applicable to each situation so the appropriate hydraulic control
section can be located.
A culvert will flow full when the outlet is submerged or when
the outlet is not submerged but the headwater is high and the
barrel is long. According to laboratory· investigations, the
entrance of an ordinary culvert will not, be submerged if the
~ v T------~---. g.~ T---~------ r~-~~Ara- i.-.. . . ~ ' -.---1r13-~~----·~~lii--.ia-.----------- I -7 -.-----. ---~--- l'' . -~ . :a .!. ' .t.. - ~ . 717 11717fi77/J/J/}///////}/7 . . .
117~7771771117/1/////7/l///7 7~11717171111171177''''''''
-- -- -- -"""'v~ -!. Sl ~ o ..... uf-- .,,,. 'il~ -'-- .
V --a. v ----~st.JD_ -11· ·j --- . .,. .... :"' -- -----
f ----. -- . -- . v_ ·.· --
J..JC - . - - - - - - 83 --. -
··Fig .. ·4.4 Water Surface Profile
18
headwater/diameter ratio (HW/D) is less than 1.2 to 1.5. ·For this
project it was· assumed the culvert was flowing full whenever the
HW/D ratio is 1.5 or greater.
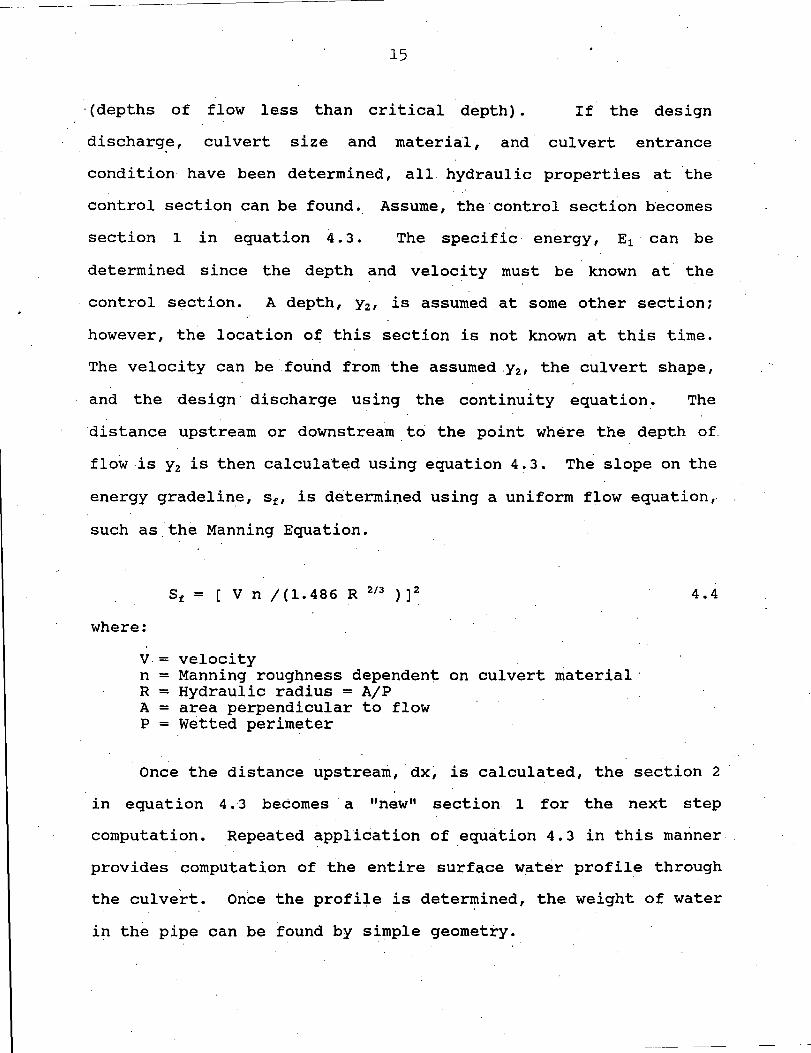
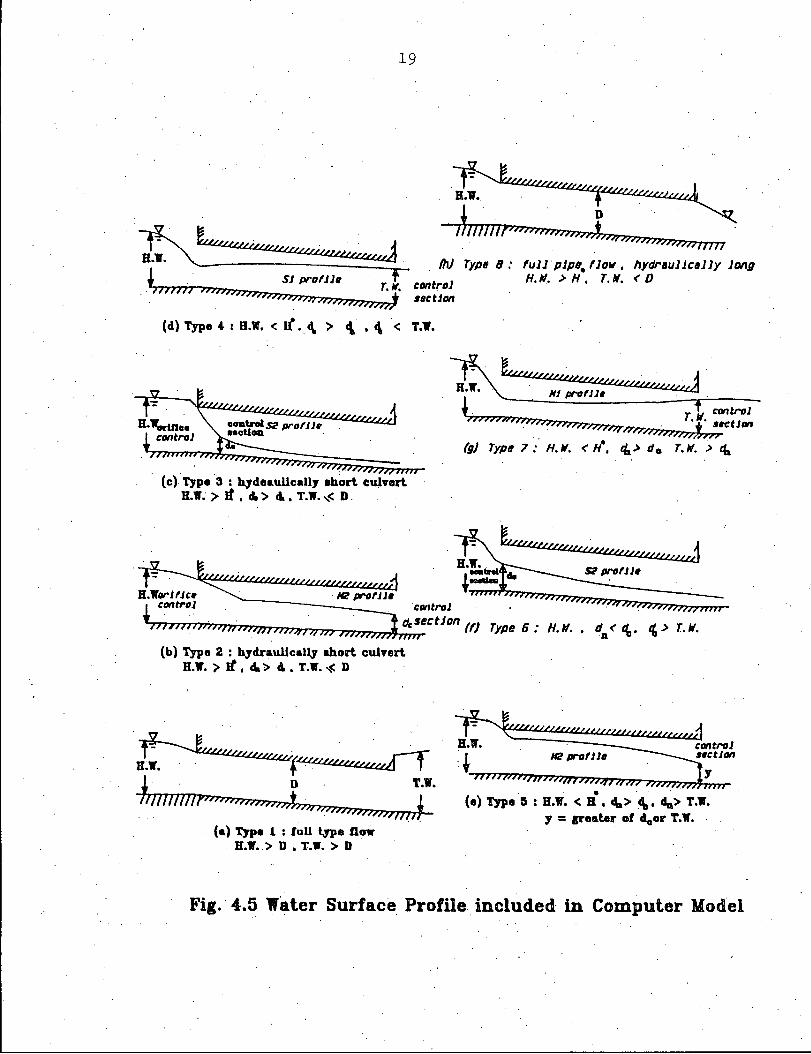
For this research, culvert flow is divided into eight types as
shown in Figure 4.5. Table 4.1 shows the pipe slopes, tailwater
depths, headwater /diameter ratio and water surface profile type
associated with the eight flow profiles shown in Figure 4.5.
4.5. Simulation of Water Surface Profiles
Three computer programs ·were written as part of this research.
All models use Turbo Pascal computer language and will operate o~
most personal computers. CULVERT simulates the water surface
profil~ for Type~ 2 to 7 .(Table 4.1) for circular pipe culverts.
·This program is also capable of plotting the water surface profile
on the screen, printer or plotter. CULVERT calculates the critical
Table 4 .1. Flow Profile Classifications for Culvert Flow used in this Project
Profile Pipe Tail water Headwater/depth Water surf ace Type Slope1 Depth2 Profile
1 M or s >D >1.5 Undefined3
2 M <de '>l. 5 M-2 3· s <de >1.5 S-2 4 s >de <1.5 S-1 5 M >dn <1.5 M-2 6 s <de. <1.5 S-2 7 M >dn <1.5 M-1
r ' 8 M or s <D >1.5 Undefined3
1M= mild slope dn > de ; S= steep slope de > dn 2D= pipe diameter or height; de =. critical depth; dn = normal
depth 3Undef ined means pipe is flowing full and no water surface profile exists.
19
J . . . D . . I lll/Jlf>n»n1m;n17j,,
{II} Type 8 : full plp11. fla.,,, hydr11ullc1Jly Jang
control .r•ctJon
(d) Type 4- : B.W. < Jf. ,c\, > ~· , c\ < T.W.
H.11. > H, T.11. < D
~ Lt«utwwu,. j H:.w. '--- 111 praru/uN'«t«tV«v.
{c) Type 3 : h1deaullcally abort cuJvert. H.W. >If I dt> cl.. T.W.,< D. .
{b) Type 2 : hydraulically abort culvert H. W. > Jt , d. > A • T. W. ~ D .
·~····: a;w.· J~ "· · D · T.'I. 71/11/l/lf>n;n;n;;;;;;;jn,, mm ,__.
. . . ' . ,,,,,,,,,,,?, .. {a) Type 1 : full l.Jpe ftaW
H.11' •. > D I T.W. > D
t + control n;;n;;;;;·nn;; ; T:,t"· .r-t1-,,,,,,.~/7f° hh:. -·- ... -· '777771;r;, ,,., . .
(g) Type 7: H.11. < H, IL> do T.11. > t4i
Type 6 : H. It/. • d.,. < ~, '{. > T. ltf.
. . . . . .
(e) Type 5 : H.W. < B , 4a> 4a, cln> T.lr. 1 = greater of clcor T.W~
Fig.· 4.5 Water Surface Profile included in Computer Model
20.
embankment depth that would be required to resist the. uplift
pressures if the pipe were acting as a simple beam.
CULVERT. 2 also simulates the water surface profile. for the
same conditions as CULVERT, but in addition, CULVERT.2 calculates
the mo~ent about the inlet of the culvert at one. foot intervals
along the culvert length . CULVERT .. 2 is capable of plotting the
. water surface profile, and the moment versus pipe length diagram on
the screen, .printer or plotter.
CUL-FLOW is used to determine the flow rate coinciding with a
given headwater depth, pipe sl,ope, pipe diameter, tailwater,
Manning's "n", and entranc~ conditions. This model evaluate.d both
inlet and outlet control to determine the minimum. flow rate that
results in the, given headwater depth.
Listings of the source codes for these three programs are
included in Appendix B.
4 .. 6. Use -Of the Models
The models have been tested on a culvert site where a failure
occurred due to uplift. The culvert was a 12 feet diameter CMP on
a . slope of 3. 8%. The models were used to .determine. the water
surface protile. for various assumed headwater and tail water depths .
. Once the profile was computed; the CULVERT. 2. model was. used to
calculate the moments diagram for the pipe .. since the roadway
cross-section was fixed, the on'iy additional resisting force
against uplift was due to the weight of the water in the pipe.
Ignoring any pipe strength, the pipe was determined to be either
. "safe" when the resisting force exceeded the uplift force or "failn . .
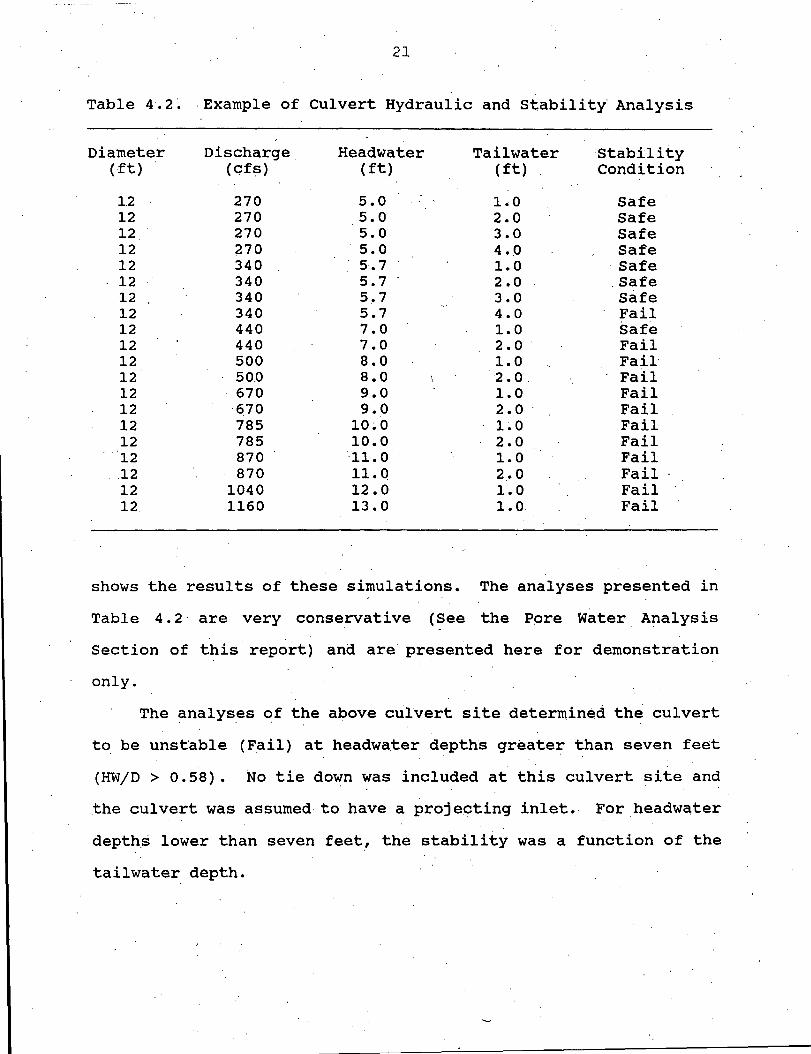
when the resistin9 force was less than the uplift force. . Table 4. 2
21
Table 4. 2 ~ .Example of Culvert Hydraulic and stabiliti Analysis
Diameter Discharge. Headwater Tail water Stability (ft) (cfs) (ft) (ft) Condition
1.2 270 5.0 1.0 Safe 12 270 5.0 2.0 Safe 12 270 5.0 3.0 Safe 12 270 . 5. 0 4 •. o Safe 12 340 5.7 1.0 ·Safe 12 340 5.7 2.0 Safe 12 340 5.7 3.0 Safe 12 340 5.7 4.0 Fail 12 440 7.0 1.0 safe 12 440 7.0 2. 0 . Fail 12 500 8.0 1.0. Fail 12 50.0 8.0 2.0. Fail 12 670 9.0 1.0 Fail 12 6.70 9.0 2.0 Fail 12 785 10~0 l~O Fail 12 785 10.0 2.0 Fail 12 870 ·11.0 1.0 Fail
.. 12 870 11.Q 2 .• 0 Fail 12 1040 12.0 1. 0 Fail 12. 1160 13.0 1. o. Fail
shows the results of these simulations. The analyses presented in
Table 4. 2 · are very conservative (See the Pore Water Analysis
Section of this report) and are presented here for demonstration
only.
The analyses of the above culvert site determined the culvert
to be unstable (Fail) at headwater depths greater than seven feet
(HW/D > 0.58). No tie down was included at this culvert site and
the culvert was assumed· to have a projecting inlet. For headwa,ter
depth.s lower than seven feet, the stability was a function of the
tailwater depth.
22
5. PORE PRESSURE ANALYSIS
5.1. Objective and Assumptions
The objective of t.he uplift pressure study is to· obtain an
estimate of the magnitude of uplift forces and the location of the •
resultant. The assumptions for these analyses are:
1)
2)
3)
4)
5)
6)
7)
8)
the pipe is treated as a beam but no consideration is given to its longitudinal flexural strength (stiffness), the only re$istance from the pipe is its weight; ·
soil shear strength or deformation characteristics-are ignored, only the soil weight is considered arid ·the unit weight is assumed to be 120 lb/ft3 ·; · ·
Variations in the flow line of the water in the conduit are not calcµlated, in most cases the analysis assumes a plugged pipe with no flow in some analyses the pipe is assumed to be flowing 50% or 75% ·full with a uniform flow line;
The headwater elevation is at the top of the pip~ on the upstream end and the tailwater is at the bottom of the pipe;
the· pore pressure is dissipated linearly beneath· the pipe;
all vertical forces act on. a horizontal plane that has a width equal to the pipe diameter;
roadway is 30 ft shoulQer to shou+der; and
the soil slope extends from the bottom of the culvert to the edge of the shoulder and the pipe is not beveled.
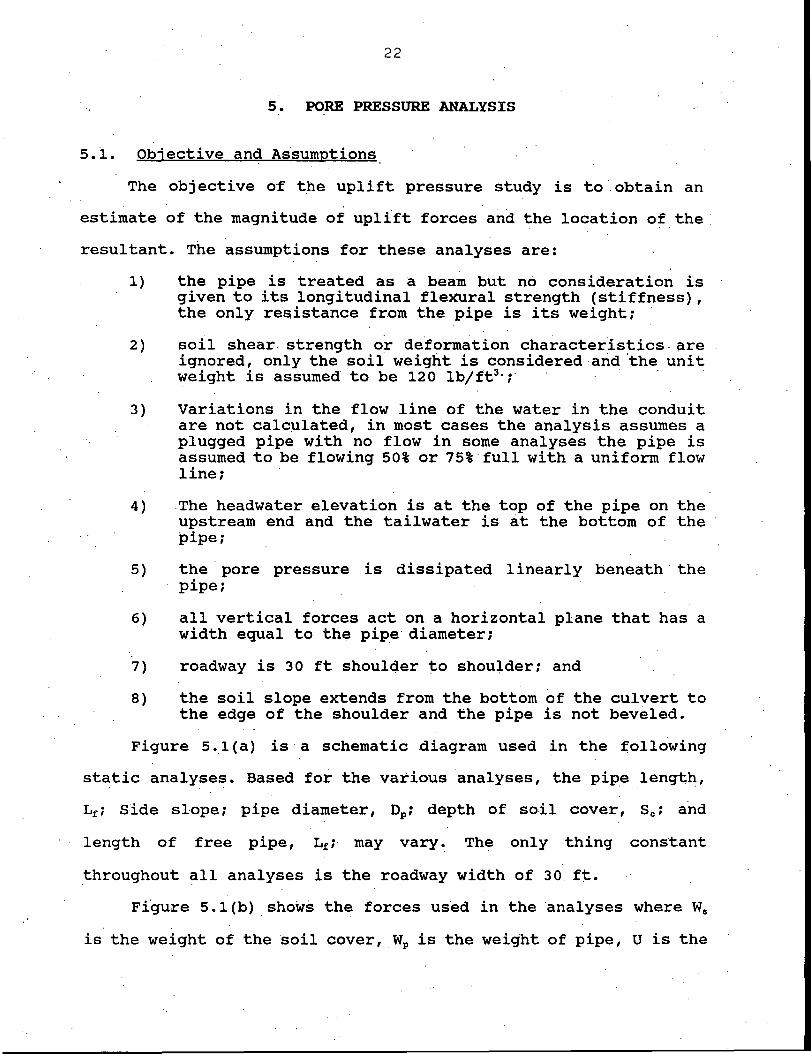
Figure 5 .. 1 (a) is· a schematic diagram used in the ~ollowing
st~tic analyses. Based for the various ·analyses, the pipe length,
Lf; Side slope; pipe diameter, DP; depth of soil cover, Sc; and
length of free pipe, Lf;. may vary~ The only thing constant
.throughout all analyses is the roadway width of 30. ft.
Ffgure 5.l(b) .shows the forces used in the analyses where W8
is the weight of the soil cover, WP is the weight of pipe, U is the
Lt~.
/ /
/
23
I I
I I
IE1Rt---- 310' ~---....~
Lp -------F>I
(a) Dimensions used in static analysis
R
U·
W1
lfp ' ' '
(b) Forces assumed to be acting as a pipe .
Fig. 5.1
-------------------------------
24
uplift force from the porewater, and R. is the resistance of the tie
down. The·soil and pipe weight resultants act through the center of
the embankment a~d the pore water force acts through the centroid
of t~e porewater pressure distribution at one third the distance,
. ~- The location of R varies with the other loading conditions.
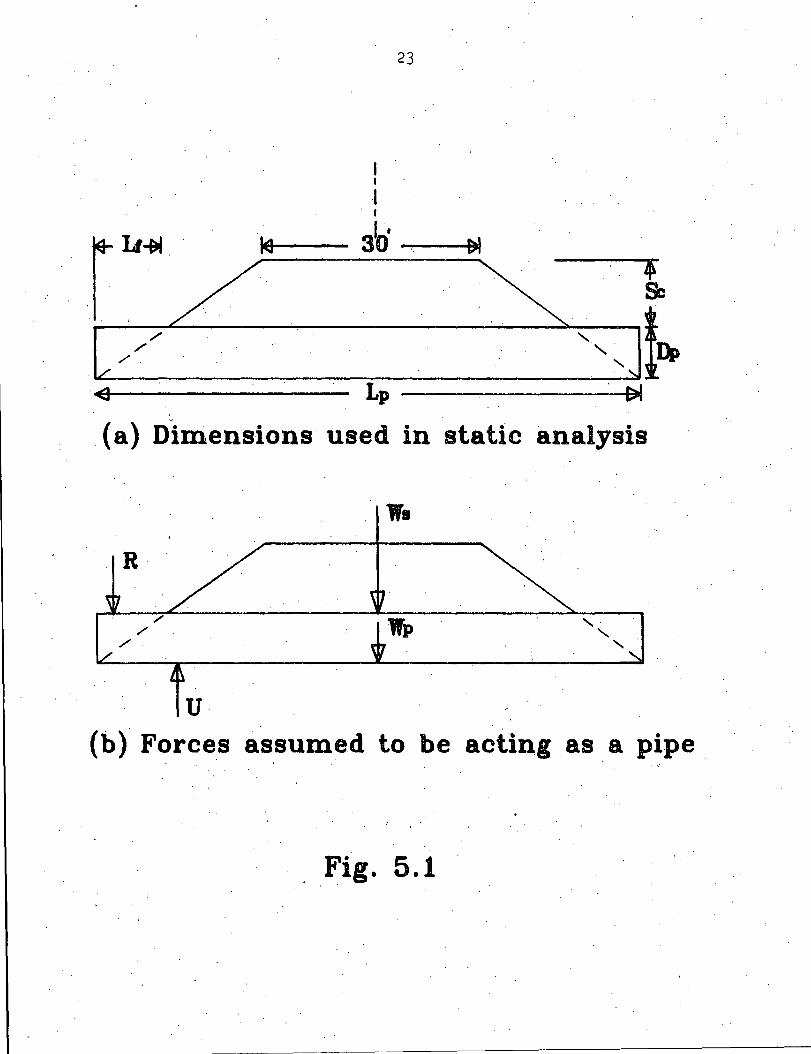
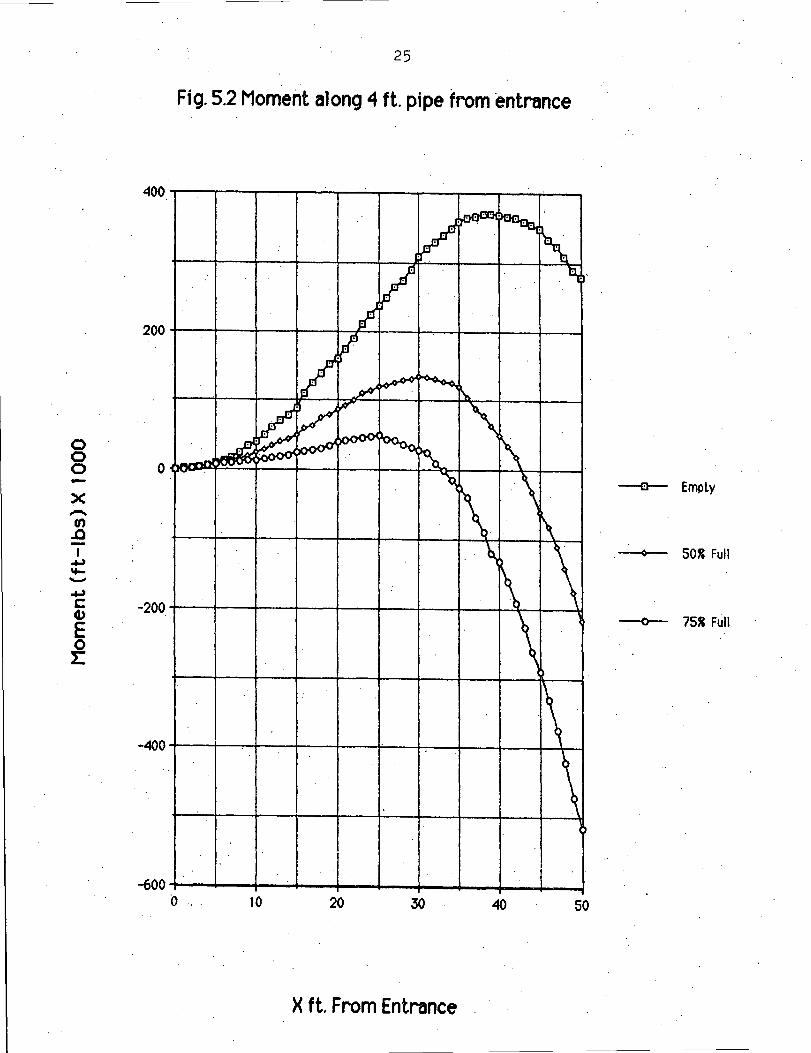
5.2. Moment Diagrams for Partial Flows
For this analysis, a 100 ft long culvert with 5 ft of fill is
analyzed for zero flow, SO%, and 75% full flow. Because of
constant pipe length, depth of soil ·fil'i, and roadway width, the
side slope varies as the pipe diameter increases. For example, a 5
ft diameter pipe has a slope of 3.5 to 1 whereas a 9 ft diameter
pipe has a side slope of 2.5 to 1. These dimensions are somewhat
representative of the flexible pipe culve.rts in Iowa .. Moments were
taken about the upstream· end of a cut section with the section
increased by 1 ft increments from the upstream end. This approach
allows a computation to determine the location and magnitude of the
maximum moments. ·
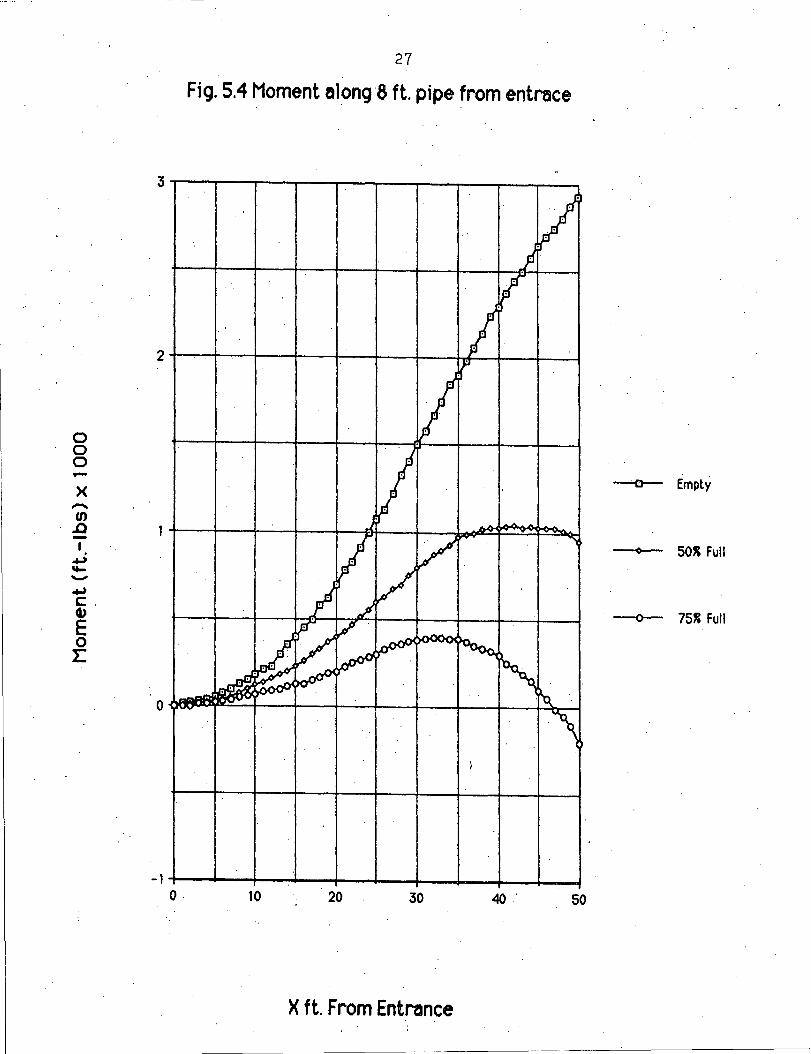
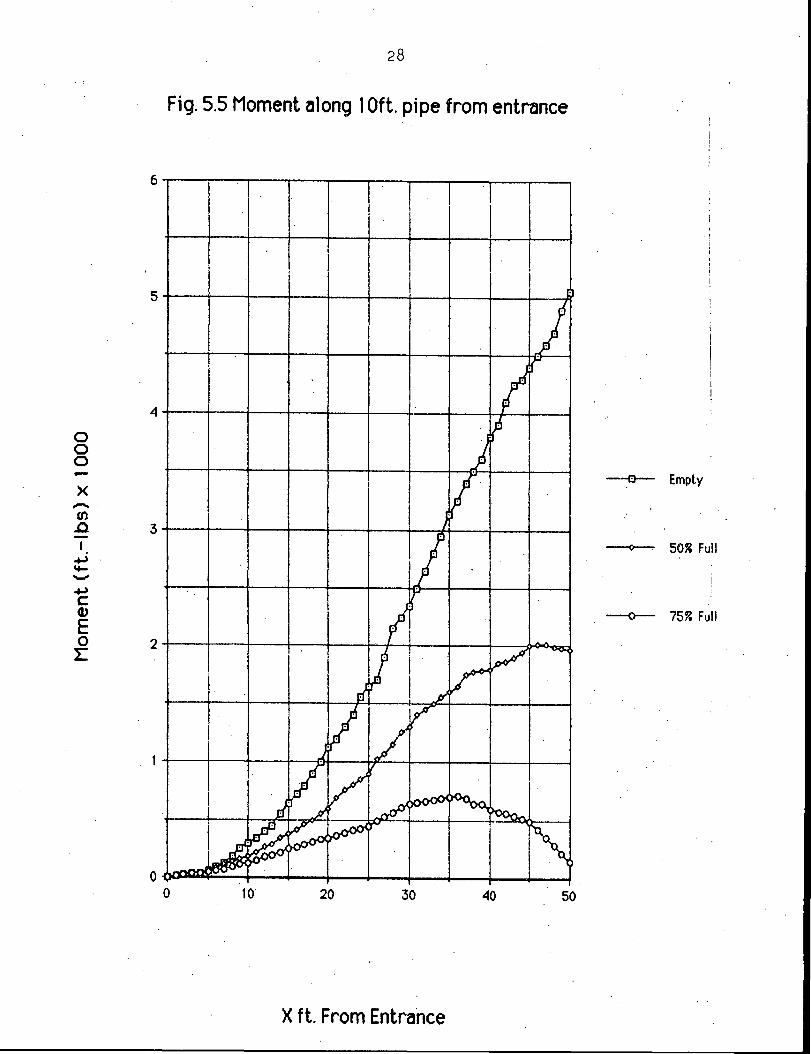
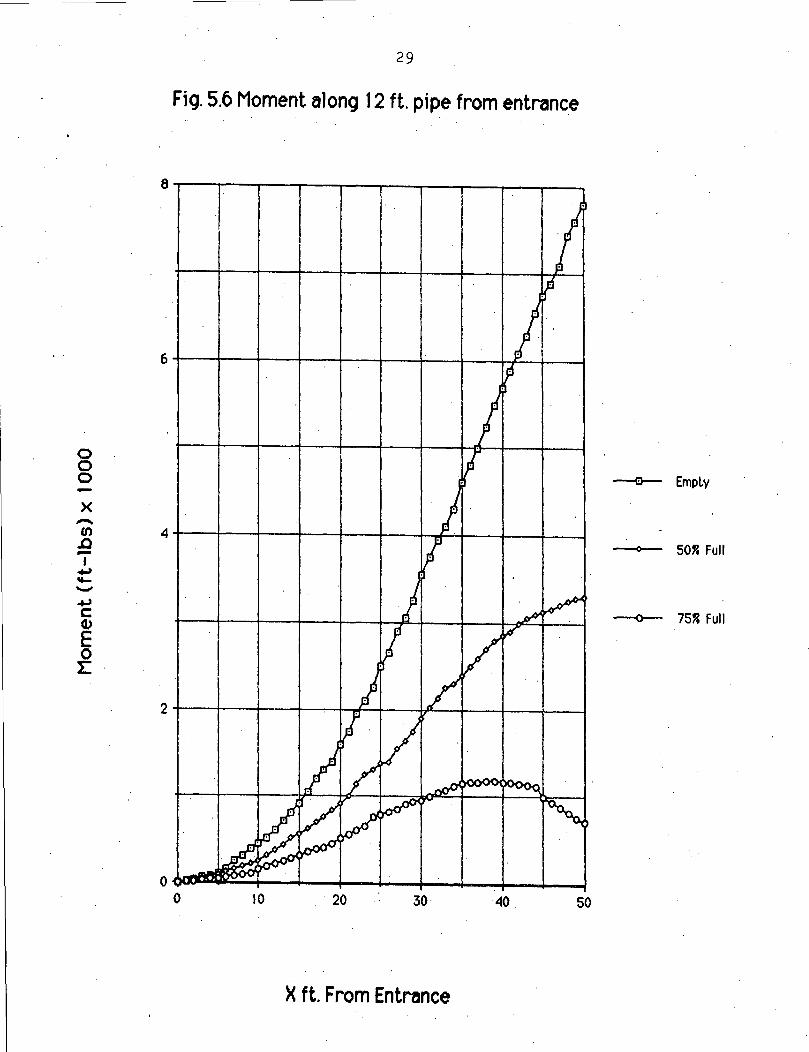
The results of this analysis are contained Figures 5.2, 5.3,
5.4, 5.5, and 5.6. As shown in these graphs, the moments increase
with increasing culvert diameter and decreasing water level in the
culvert. The location of maximum moment shifts · toward the
centerlin~ of the roadway as· the pipe diameter increases. . For
example, at 50% full the maximum moment of a 4 ft pipe is at 32 ft
from the inlet and at 47 ft. for a 12 ft pipe.
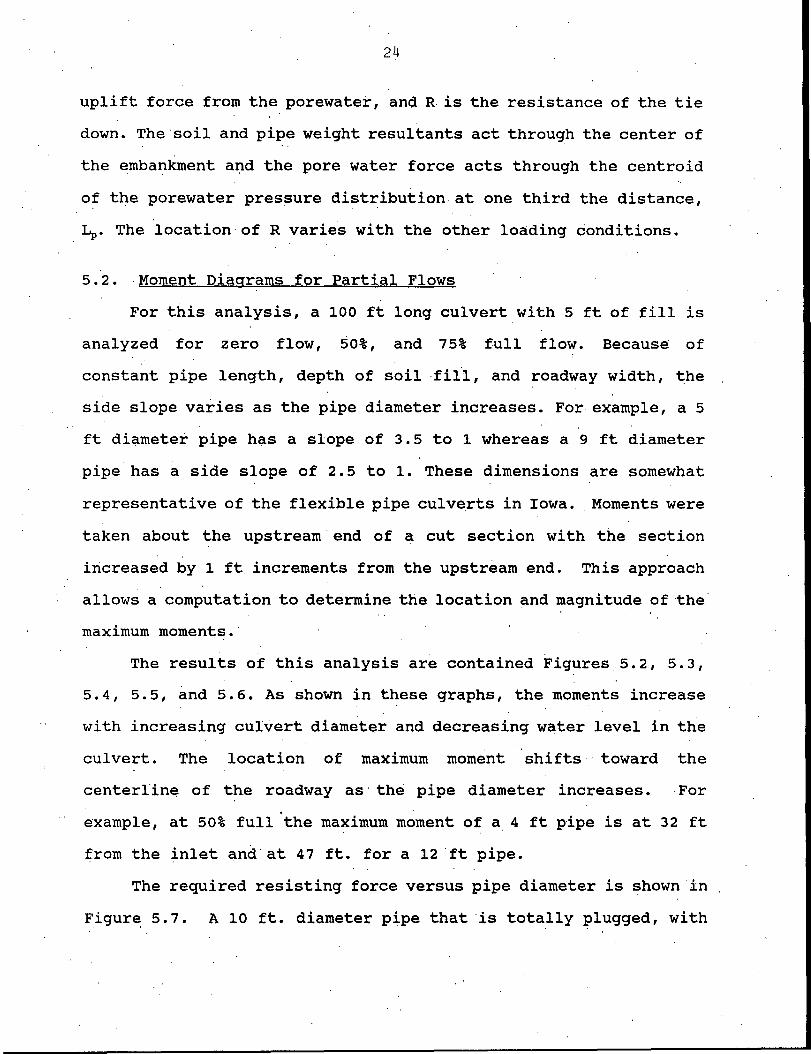
The required resisting force versus pipe diameter is shown in
Figur~ 5.7. A 10 ft. diameter pipe that ·is totally plugged, with
0 0 0 -x -(I)
.a I .....,
'to--....., c: . 4,)
E 0 l:
25
Fig. 5.2 Moment along 4 ft. pipe from entrance
--i:l-- Empty
b, 50" Full
\ -200 -+---~---+----+---+----+--+--+--+-\+---\i --o-- 751' Full
-400 -+---l~--+---+---+'----+-l---+----+-\-\--1
~00-+----4---+-~-+---j~-+----+-~~-+----+-~ () 10 20 30 40 50
X ft. From Entrance

26
Fig.·5.3 Moment along 6 ft .. pipe from entrance
l
0 0 0 - --a- Empty x -(I) .0 -I . 50~ Full +.) ~ -+.) .c
75~ ~ull 4' ---<>--E 0 0
. I:
-1-+-__.~...._~.__--+-~~~~_._~-+-___..~~
0 . 10 20 . 30 40 50
X ft From Entr~nce
27
Fig. 5.4 Moment al_ong 8 ft. pipe from entrace
0 0 0 -x -a-- Empty -(I) .0 -I ..; 501' Full
"'"' -~ C. GJ E -o-- 751' Full
0 I:
0
-1~~1--~~-+---~--+~-+----+---.._-+---~ 0 10 20 30 50
X ft. From Entrance
28
Fig. 5.5 Moment aJong 1 Oft. pipe from entrance
6
I l I
I I ·l
) 5
4
0
I I .r
. /i 0 0 ) -x ,,....... /· --o-- Empty
(I)
..0 3 -I +> It-.....,,.
J
I --<>---- 50~ Full
+> c: 4' E 0 2 r::
Ir .1 ,./I -
I r d .P
-<>-- 75~ Full
l/ I I /' v ,
I / -d ~,vv~- -~~ .JI
~ ~ ~ '
·~ ,/!.
0 ,.JV" I
0 10 20 30 40 50
X ft. From Entra·nce
29
Fig. 5.6 Moment along 12 ft. pipe from entrance
j.
0 0
---a- Emply 0 -x -(I) 4 .a 50" Full -I ~ .... -~
75~ Full c: --<>--G)
E 0 I:
2
o~am:~~_..:...._ __ +-----i..;._..,+....;_.J-~~~--~ 0 10 . 20 30 40. 50
X ft. From Entrance
30
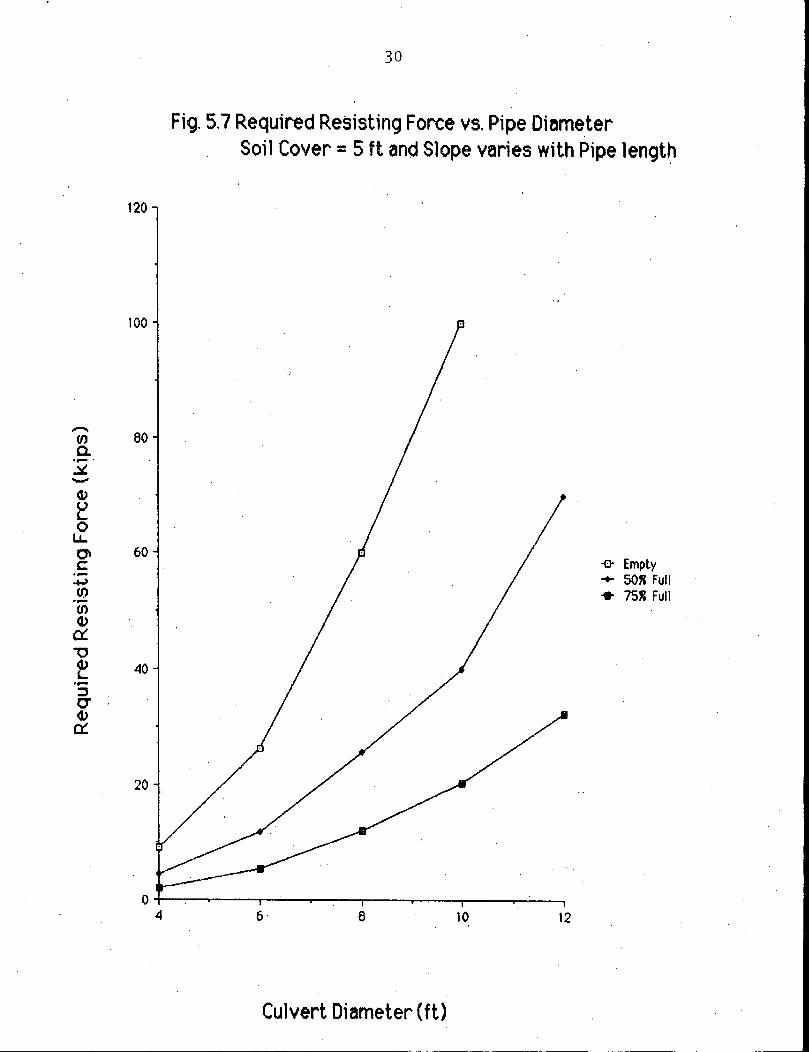
Fig. 5.7 Required Resisting Force vs. Pipe Dh~meter Soil Cover= 5 ft and Slope varies with Pipe lengt~ .
120
100
-(() 80 0. ·-.::i. -~ ~ 0 u. O' 60
-o- Empty c ...., + 50" Full (f.) + 751' Full ·-(() ~ a: '"O ~ 40 '-.,... ::J CJ' ~ a:
20
o+-~-.-~-.--'---~--~---~---~---~--.
4 6· 8 10 12
Culvert Diameter (ft)
31
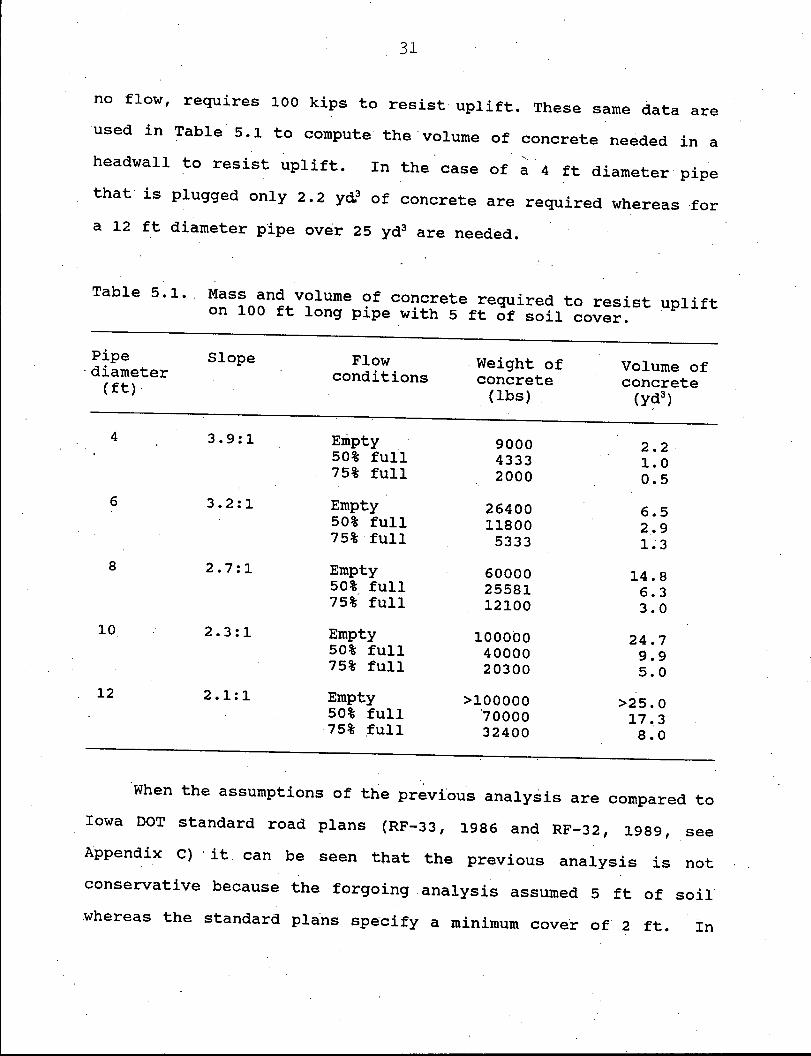
no flow, requires 100 kips to resist uplift. These same data are
used in Table 5.1 to compute the volume of concrete needed in a
headwall to resist uplift. In the case of a 4 ft diameter pipe
that is plugged only 2.2 yd3 of concrete are required whereas for
a 12 ft diameter pipe over 25 yd3 are needed.
Table 5 .1 .. Mass and volume of concrete required to resist uplift on 100 ft long pipe with 5 ft of soil cover .
Pipe Slope Flow . Weight of Volume of ·diameter conditions concrete concrete (ft). · (lbs) (yd3)
4 3.9:1 Empty 9000 2.2. 50% full 4333 1.0 75% full 2000 o .• 5
6 3.2:1 Empty 26400 6.5 50% full 11800 2.9 75% full 5333 1~3
8 2.7:1 Empty 60000 14.8 50% full 25581 6.3 75%. full 12100 3.0
10 2.3:1 Empty 100000 24.7 50% full 40000 9.9 75% full 20300 5.0
12 2.1:1 Empty >100000 >25.0 50% full '70000 17~3 75% full 32400 8.0
When the assumptions of the previous analysis are compared to
Iowa DOT standard road plans (RF-33, 1986 and RF-32, 1989, see
Appendix C) ·it. can be seen that the previous analysis is not
conservative because the forgoing . analysis assumed 5 ft of soil
whereas the standard pla·ns specify a minimum cover of 2 ft. In
32
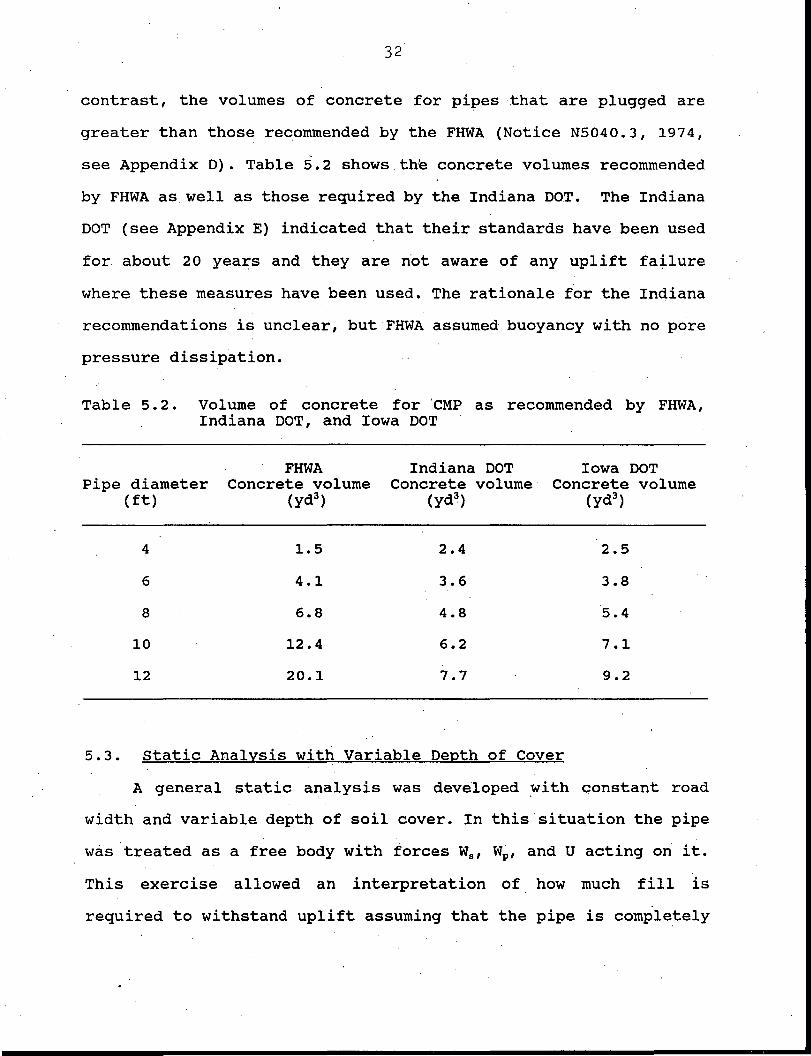
contrast, the volumes of concrete for pipes that are plugged are
greater than those recommended by the FHWA (Notice N5040.3, 1974,
see Appendix D). Table 5.2 shows.t~e concrete volumes recommended
by FHWA as well as those required by the Indiana DOT. The Indiana
DOT (see Appendix E) indicated that their standards have been used
for. about 20 years and they are n·ot aware of any uplift failure
where these measures have been used. The rationale·for the Indiana
recommendations is unclear, but·FHWA assumed buoyancy with no pore
pressure dissipation.
Table 5. 2. Volume of concrete for 'CMP as recommended by FHWA, Indiana DOT, and Iowa DOT
Pipe diameter (ft)
4
6
8
10
12
FHWA Concrete volume
(yd3)
1.5
4.1
6.8
12.4
20.1
Indiana DOT Iowa DOT Concrete volume Concrete volume
(yd3) (yd3)
2.4 2.5
3.6 3.8
4.8 5.4
6.2 7.1
7.7 9.2
5.3. static Analysis with Variable Depth of Cover
A general static analysis was developed ~ith c:::onstant road
width and variable depth of soil cover. In this situ~tion the pipe
was treated as a free body with forces W6 , WP, and U acting on it.
This exercise allowed an interpretation of how much fill is
required to withstand uplift assuming that the pipe is completely
33
piugged. The results of this analysis are not intended for use in
any design applications.
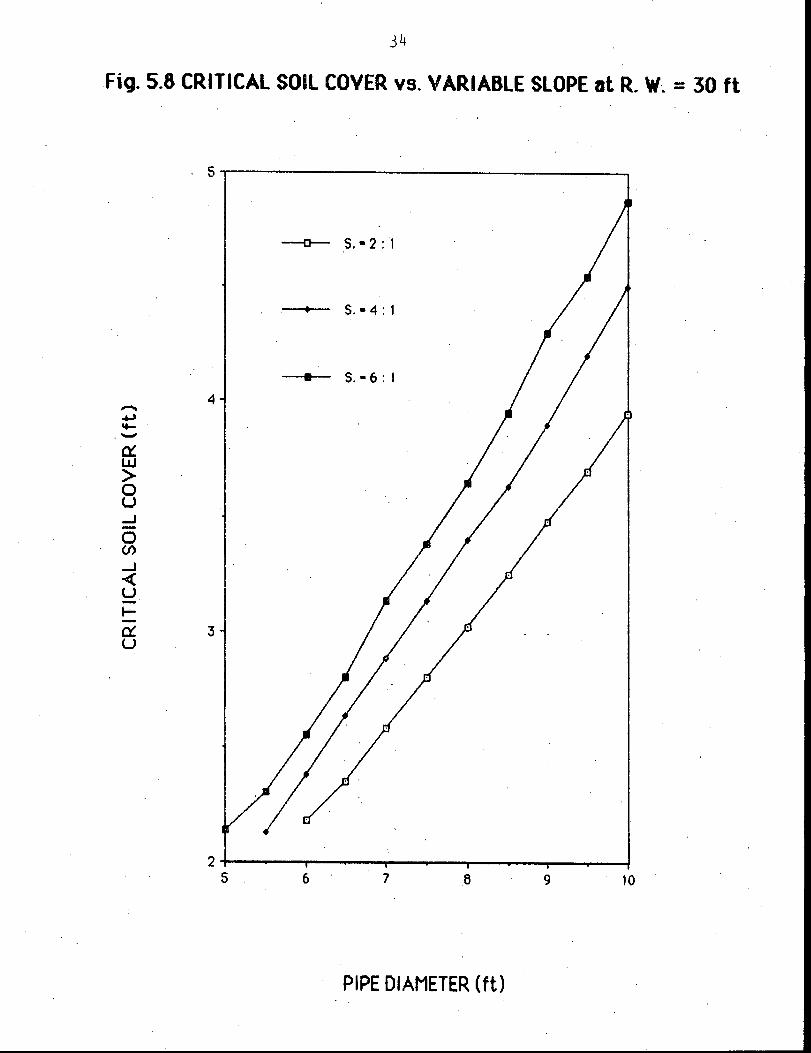
For one subset within this analysis, th~ slope was held
constant and the pipe length varied as the depth of cover
increased. The minimum depth of soil beneath the road that. is
required to balance the uplift force is called a critical soil
cover~ Figure 5.8 is a plot of pipe diameter versus the critical . .
soil cover for slopes of ~:1, 4:1, and 6:1. These graphs show that
the critical soil cover.is relatively insensitive to slope with the·
ratio of critical soil cover to pipe diameter about o ~ 5. These data
indicate that the 2 ft cover specified as minimum depths by.the
Iowa DOT standards will do little to resist uplift of pipes larger
than 4 ft diameter and that some type of tie down on the upstream
end of flexible metal culverts is required.
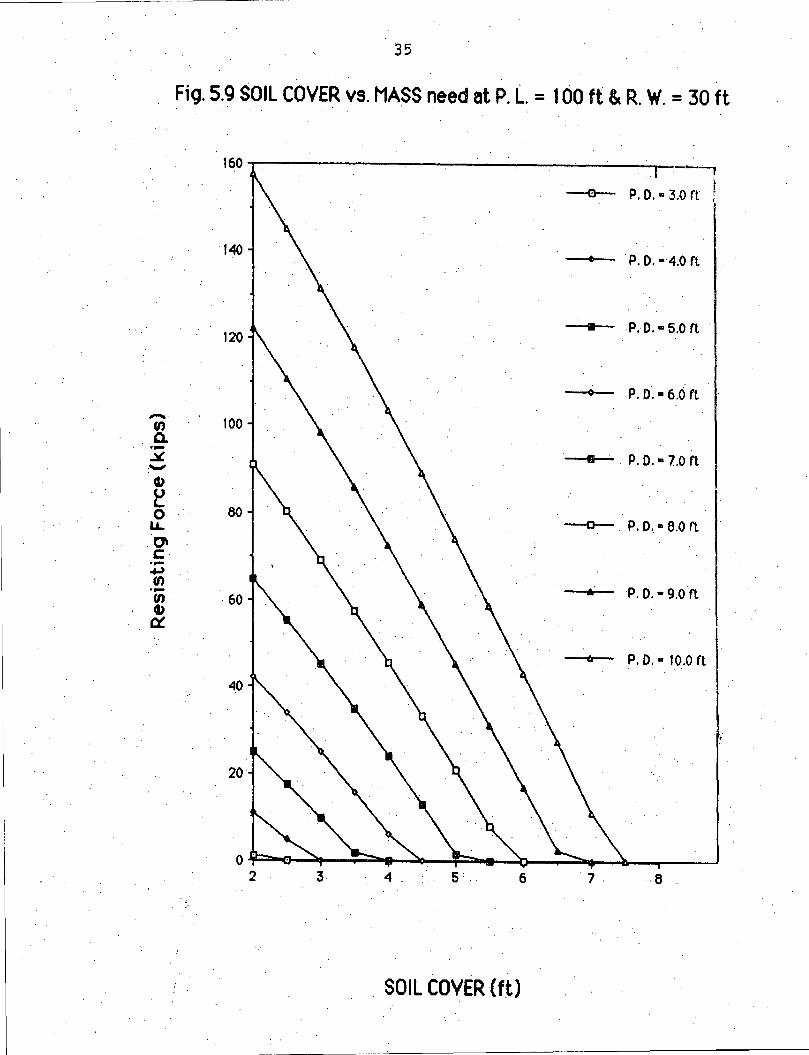
Recognizing that tiedowns are necessary, but that the
resistance of the tiedown can be reduced by increasing soil cover,
an analysis with a constant pipe length of 100 ft, variable soil
cover and therefore variable side slope was conducted. The results
of this analysis, shown in Figure 5.9, are not for design, but are
intended to better understand the magnitude of the required forces.
Figure 5.9 implies that if the ratio of depth of soil cover to
pipe diameter is about O. 73, no tiedowns are required. This ignores
the flexibility of the corrugated metal. pipe and presumes that the
soil cover acts as a rigid continuum. Neither of these conditions·
are realistic and the first errs on the side of being too liberal
because any free section of pipe, not cpvered by soil, may deflect
as the result of high headwater pressures. However, on the whole,
34
Fig. 5.8 CRITICAL SOIL COVER vs. VARIABLE SLOPE ·at R. W. = 30 ft
--e--- s ... 2 : 1
s .• 4: 1
• S. • 6: I
4 -.+.) ...... -0:: UJ > 0 u _J
0 (/)
_J
<( u ..... -a: 3 u
2-+----------------------------------i 5 6 7 .8 9 10
PIPE DIAMETER (ft)
35
Fig. 5.9 SOIL COVER vs. MASS need at P. l. = 100 ft &. R. W. = 30 ft
160 -------------------.,..---"'! P. ~ ... 3.0 rt I
140 -~ . P.O. ··4.0 ft
• P.O ... 5.0 ft 120
P. 0. • 6.0 ft
-· 100 (I) a. ·- . P.0.•7.0ft .:Ji. II ·-Q)
~ 80 0
LL -0-- P. 0. • 8.0 ft .·O" c ·-+' (I) .. P. 0. • 9.0 ft . ,... (I) 60 Q)
ex: A P. D. D 10.0 ft
~o
'
20
o~·:::::...a-~~~ ..... ~~p;;:::. ..... -4:1--.......;~___.r.--__ ----J
2 3 . 4 . 6 1.
·. SOIL COVER (ft)
36
it is probably conservative to ignore some longitudinal stiffness
in the CMP. The second assumption is conservative. Another
conservative element in this· analysis is the assumption-that the
pipe is completely plugged because the-likelihood of complete pipe
plugging decreases with increasing pipe diameter. The curves do
show that the force required to prevent uplift decreases with
increasing soil cover. .For pipes between 6 and 10 ft in diameter,_
each foot of . soil cover beneath the road reduces the required
resistance by about 25 kips.
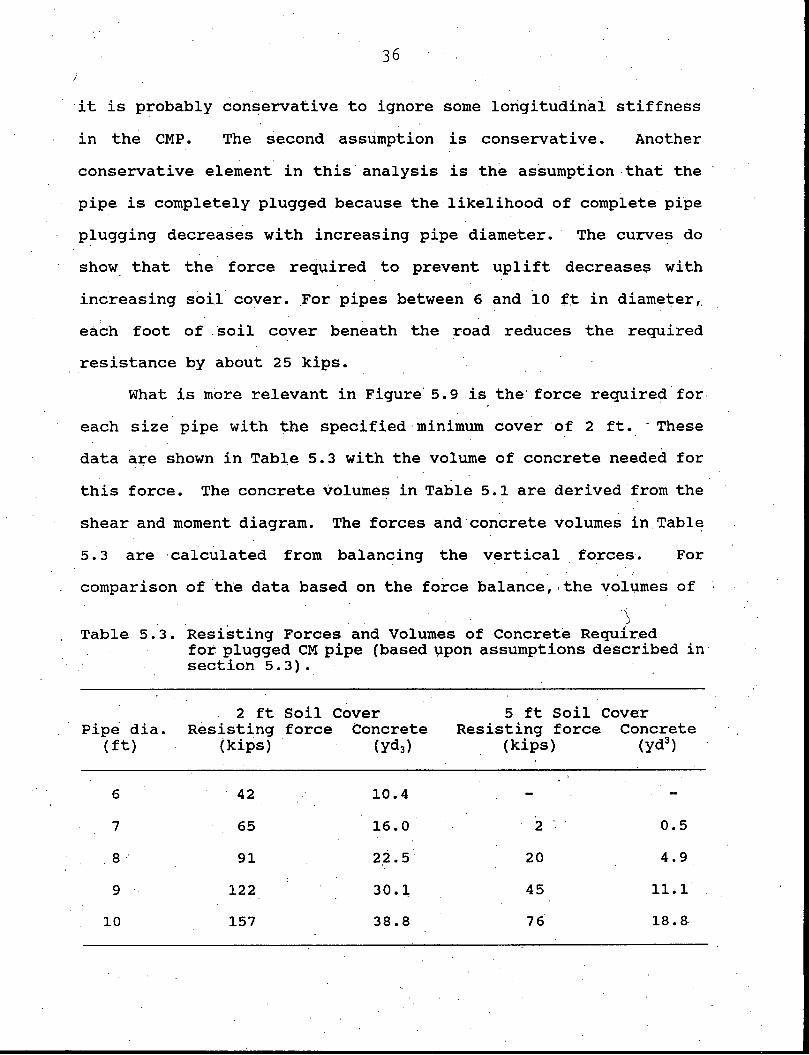
What is more relevant in Figure· 5.9 is the· force require~· for.
each size pipe with the specified·minimum cover ·of 2 ft. ·These
data are shown in Table 5.3 with the volume of concrete needed for
this force. The concrete volumes in Table 5.1 are derived from the
shear and moment diagram. The forces and ·concrete volumes in. Table
5. 3 are ·calculated from balanc;:ing the vertical forces. For
comparison of the data based on the force balance, . the volumes of
\ Table 5. 3. Resisting Forces and Volumes of Concrete Requf r.ed
Pipe dia. (ft)
6
7
9·
9
10
for plugged CM pipe (based µpon assumptions described in· section 5.3).
2 ft Soil Cover 5 ft Soil Cover Resisting force Concrete Resisting force Concrete
(kips) (yd3) (kips) (yd3)
42 10.4
65 16.0 2 0.5
91 22.5 20 4.9
122 30.1 45 11.1
157 38.8 76 18.8
37
concrete for 5 .ft of soil cover are also presented in Table 5.3.
It can be seen that the volumes ·in Table 5.3 are much lower t~an
those in Table 5~1. This results from balancing the forces rather
than balancing the moments. and indicates that the sy~tem is n·ot in
static equilibrium.
5.4. Discussion of P6re Pressure Anal~ses
The static. analyses of uplift forces on CMP indicate that for•
some geometries the soil, pipe,. pore wa.ter systems are not in
static equilibrium·. The lack of equilibrium is caused by the
symmetrical. loading imposed by the pressures from soil ·cover and
pipe _and the unsymmetrical loading from the pore pressure
distribution .. It is also recognized that.once the pip~ starts to
bend and/or the soii begins to deform, the assumptions of the
static analysis are no longer valid.· The static equilibrium could
be· restored by unsymmetrical loading imposed by: 1) the flow line
of the water in the pipe, 2) a longitudinal bending resistance in"
the pipe that decreased downstream, or 3) soil deformation
resistance that decreases with distance toward the centerline of
the roadway. c:t:iapter 2 of this report has shown that the flow line . .
of the water in the pipe will be higher at the upstream end than at
the tail water, consequently for. certain flow conditio.ns (but not
all) the·equilibrium can be obtained from loading 1 above. If .the
pipe is coinpletely plugge·d, it is highly unlikely that" either of
·the loadings suggested by 2 or 3 above would be realized; ~owever,
ignoring _these resistance components adds considerable conservatism
to this ~rational analysis"~
Although the Iowa DOT has no standards for tie downs on CMP,
it has recommended headwalls that., in general, conforin to the
design showri in Figure· 4.2. For this design, the·resistipg force
and the required volume of concrete was calculated and the results
included in Table 5.2.
The California DOT has in.its bridge design specifications for
CMP the statement: "Concr.ete headwalls or collars shall be P.laced '
at each inlet or outlet". California DOT does not provide an
indication of what the magnitude of the resisting force .should be.
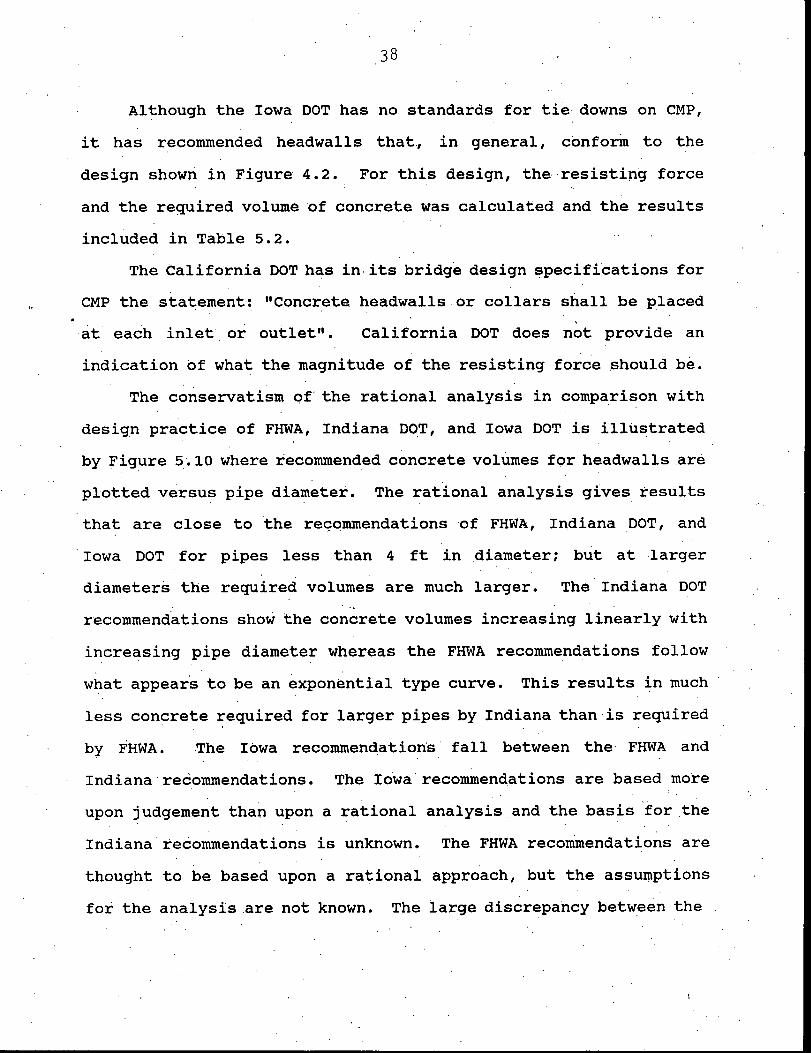
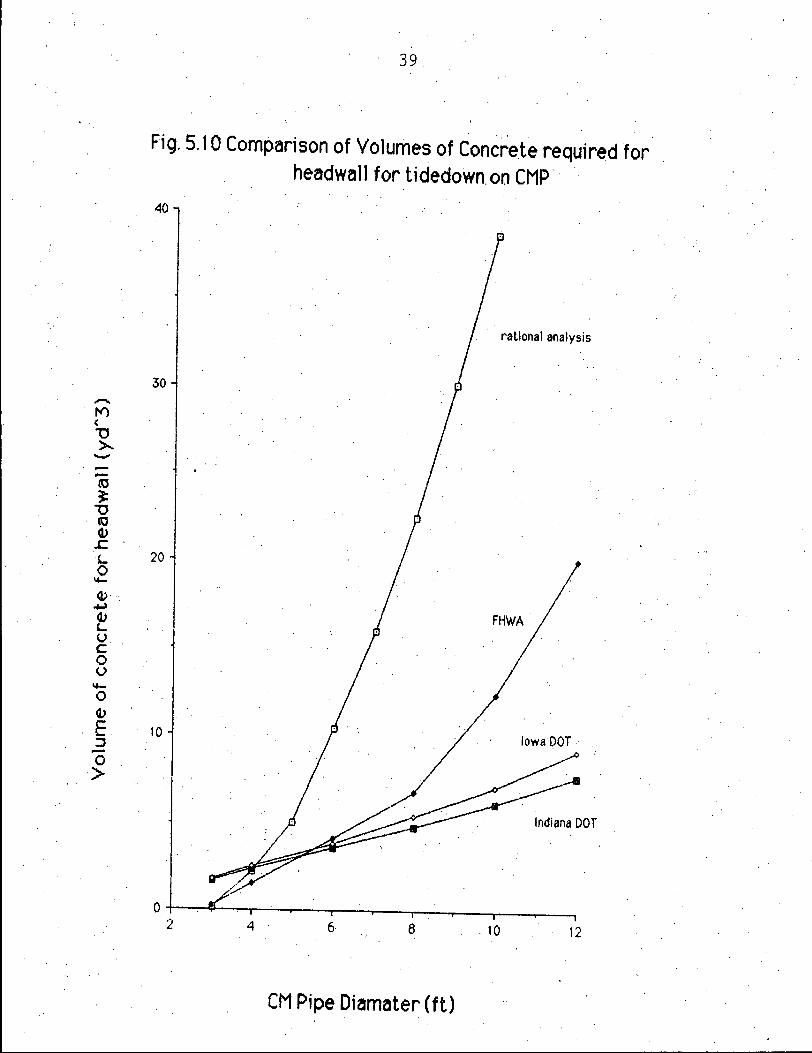
The conservatism of' the rational analysis in comparison with
design practice of FHWA, Indiana DO.T, and Iowa DOT is illustrated
by Figure s·.10 where recommended concrete volumes for headwalls are
plotted versus pipe diameter. The rational analysis gives results
that are close to the. regqmmendations of FHWA, Indiana DOT, and
Iowa DOT for pipes less than 4 ft in .diameter: · but at ·larger
diameters the required volumes are much larger. The Indiana DOT
recommend.ations show the con~rete volumes increasing linearly with
increasing pipe diameter whereas the FHWA recommendations follow
what appears to be an exponential type curve. This results in much
less concrete required for larger pipes by Indiana than·is required
by FHWA. .The Iowa recommendations· fall between the FHWA and
Indiana·recommendations. The Iowarecommenciations are based more
upon judgement than upon a rational analysis and the basis '!or .the
Indiana recommendations is unknown. The FHWA recommendations are
thought to be based upon a rational approach, but the assu~ptions
for the analysis .are not known. The large discrepancy between the
...... . !'(')
< "O ~ ---OJ ~
"O tO Q.> .c. L 0
\4.-
Q.> .. ...., Qj L u c: 0 v
\4.-
0 Qj
E :J -0 >
39
Fig. 5.10 Comparison of Volumes of Concrete required for headwa11 for tidedown on CMP · ·
40
rational analysis
30
20
FHWA
10
Indiana DOf
2 4 6 8 . 10 12
CM Pipe Diamater (ft)
40
various design recommendations indicates that more · study is
required to obtain the best possible specifications for CMP design.
6. CASE HISTORIES
As part . of the .initial survey done on this project, . several
failure sites were selected for further investigation. Two such.
sites are presented.
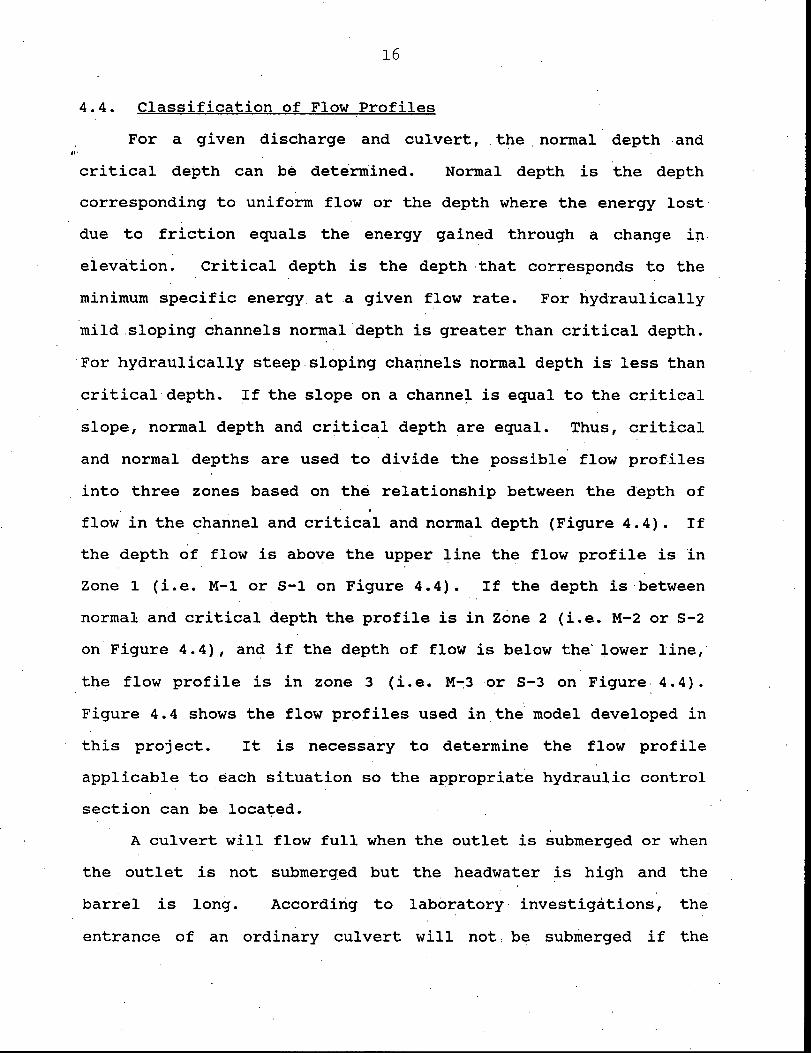
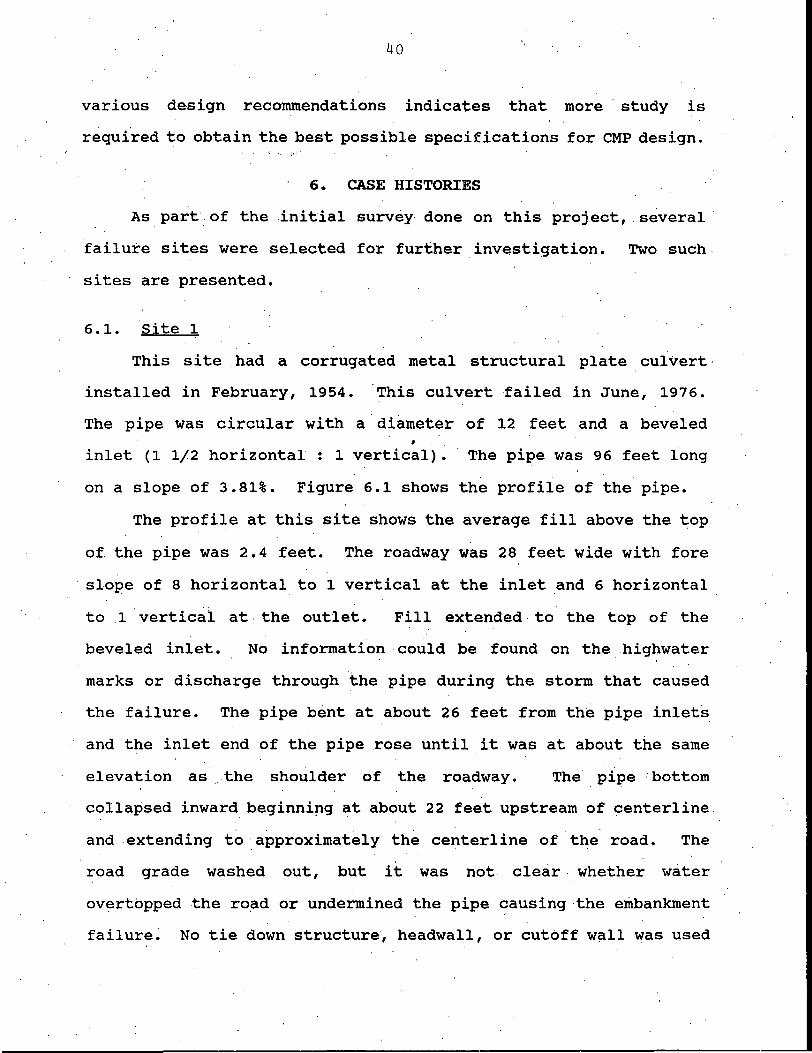
6 .1. Site 1
This site .had a corrugated metal structural plate culvert·
installed in February, 1954. This culvert failed in June, 1976.
The pipe.was circular with a diameter of 12 feet and a beveled ,
inlet (1 1/2 horizontal: 1 vertical). The pipe was 96 feet long
on a slope of 3.81%. Figure 6.1 shows the profile of the pipe.
The profile at this site shows the average fill above the top
of. the pipe was 2.4 feet. The roadway was 28 feet wide with fore
slope of 8 horizontal. to 1 vertical at the inlet and 6 horizontal
to .1 vertical at. the outlet. Fill extended.to the top of the
beveled inlet. No information ·could be found on the. highwater
marks or discharge through the pipe during the storm that caused
the failure. The pipe bent at about 26 feet from the pipe inlets
and the inlet end of the pipe rose until it was at about the same
elevation as . the shoulder of the roadway. The pipe bottom
collapsed inward beginni~g at about 22 feet upstream of centerline . .
and . extending to ·.approximately the centerline of the road. The
road grade washed out, but it was not clear whether water
overtopped the road or undermined the pipe causing ·the embankme.nt
failure~ No tie down structure, headwall, or cutoff wall was used

4i 24.8' Lt 14· u center 14· Rt 30.48' Rt
I I I I I I I I I L _..J-' I __..I_· __._____ ___ J
12 rt
I.
" l I ·I ~ I I J J i-1
1.008 kips /'
30
20
10
0
.-10
.. -20
-30
1000
750
500
250
x(f t)
1.636 k1ps
Fig. 6.1 Profile at··Site 1
unit: kip
78.48'
23.~' 29' 34'
-27.70
Shear Dia1ram
979.66 1 004.8 14.35 unit: kip-ft
23.2' 29' 34' 48' 52.7' 62' 74.48'
Moment Diagram ....
Fig ·a.2 Shear and Moment diagram at Site 1
42
at this site nor was there any indication of diaphragms being used
to control seepage along the pipe. From data at this site, it
appears that the bend in the pipe o.ccurred about 26 feet from the
i~let end of the pipe.
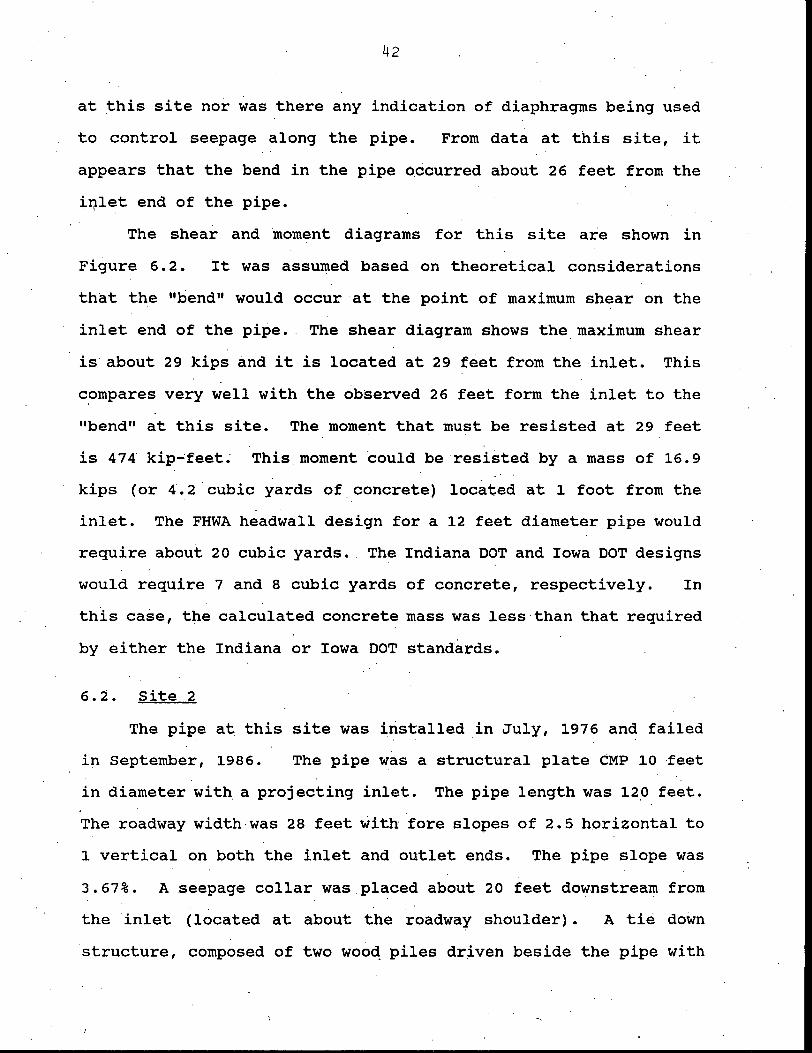
The shear and moment diagrams for this site are shown in
Figure 6.2. It was assumed based on theoretical considerations
that the "bend" would occur at the point of maximum shear on the
inlet end of the pipe .. The shear diagram shows the maximum shear
is about 29 kips and it is located at 29 feet from the inlet. This
compares very well with the observed 26 feet form the inlet to the
"bend" at this site. The moment that must be resisted at 29 feet
is 474 kip-feet~ This.moment ·could be resisted by a mass of 16.9
kips (or 4.2 cubic yards of_ concrete) located at 1 foot from the
inlet. The FHWA headwall design for a 12 feet diameter pipe would
require about 20 cubic yards. The Indiana DOT and Iowa DOT designs
would require 7 and 8 cubic yards of concrete, respectively. In
this case, the calculated concrete mass was less than that required
by either the Indiana or Iowa DOT standards.
6.2. Site 2
The pipe at this site was iristalled in July, 1976 and failed
in September, 1986. The pipe was a structural plate CMP 10 feet
in diameter with a projecting inlet. The pipe length was 12_0 feet.
The roadway width-was 28 feet with fore slopes of 2. 5 horizontal to
1 vertical on both the inlet and outlet ends. The pipe slope was
3.67%. A.seepage collar was.placed about 20 feet downstream from
the inlet (located at about the roadway shoulder) • A tie down
structure, composed of two woo~ piles driven beside the pipe with

43
I. B.112.78 B.112.83 B.192.N B.111.'6 B.191.21
10 ft . , ________ _ i I.NO. 78 l.ll0.1'7 1.180.CN 1.ne.11 1.111.21
. 11t-fG ------- 96 ft ----------..et
Fig .. 6.3 -Profile of Pipe at Site 2
44
two J"x 16 11 wood planks across the top of the pipe and a 1/2 11 wire
rope cable stretched across the pipe top, was constructed at this
site.
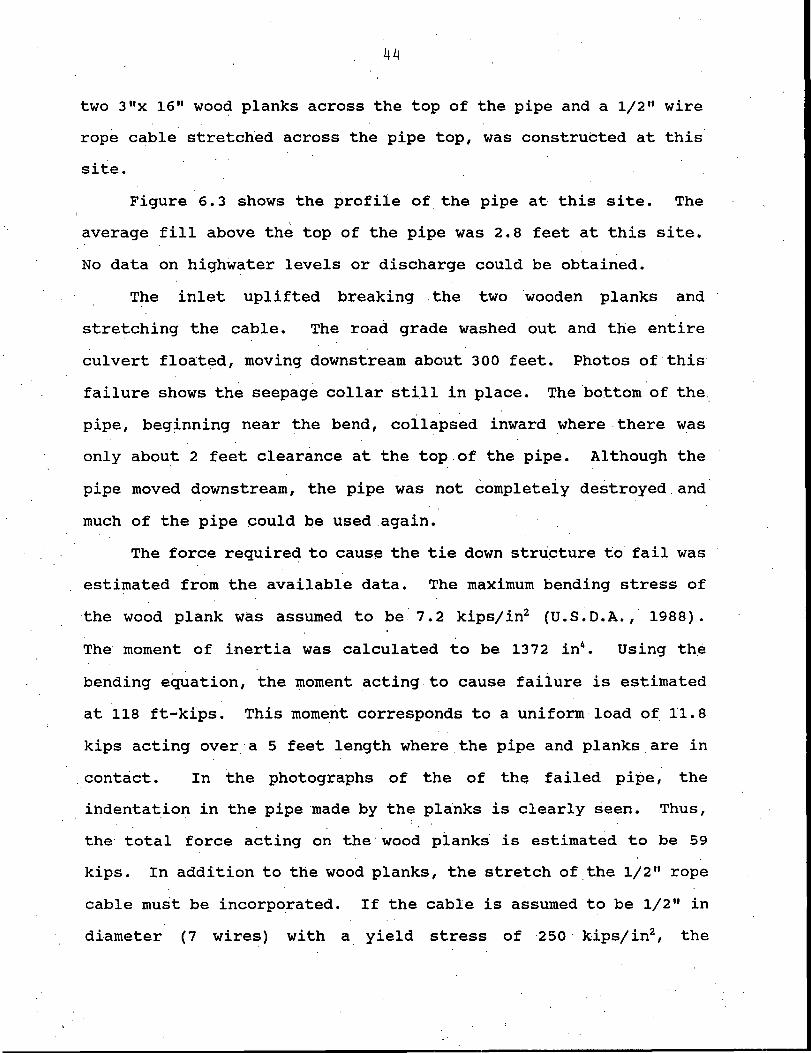
Figure 6.3 shows the profile of the pipe at this site. The
average fill above the top of the pipe was 2.8 feet at this site.
No data on highwater levels or discharge could be obtained.
The inlet uplifted breaking the two wooden planks and
stretching the cable. The road grade washed out and the entire
culvert floated, moving downstream about 300 feet. Photos of·this
failure shows the seepage collar stiJl in piace. The ·bottom of the.
pipe, beginning near the bend, collapsed inward where.there was
only about 2 feet clearance at the top.of the pipe. Although the . .
pipe moved downstream, the pipe was not completely destroyed and
much of the pipe could Qe used again.
The force required to cause the tie down structure to fail was
estimated from the available data. The maximum bending stress of
the wood plank was assumed to be 7.2 kips/in2 (U.S.D.A. ,· 1988).
The moment of inertia was calculated to be 1372 in4• Using the
bending equation, the moment acting to cause faiiure is estimated
at 118 ft-kips. This moment corresponds to a uniform-load of 11.8
kips acting over·a 5 feet length where.the pipe and planks are in
contact. In the photographs of the of the. failed pipe, the
indentation in the pipe ·made by the planks is clearly seen~ Thus,
the total force acting on the· wood planks is estimated to be 59
kips.· In addition to the wood planks, the stretch of the 1/2" rope
cable must be incorpo_rated. If. the cable is assumed to be 1/2" in
diameter (7 wires) with a yield stress of 250 · kips/in2, the
45
ultimate load would be 36 kips. Information obtained from the
county engineer indicated the cable was used not new cable. The
estimated ultimate load was reduced . by 20% to account for
corrosion. · Thus, the cables . ( 2). would carry an additional load of
58 kips. The total estimated load in order to fail the tie down
structu.re was estimated to be· 117 kips •.
For comparisons, the resisting force from Figure 5. 9 for a 10'
di~meter pipe with 2.8 feet of cover is 140 kips. The calculated
failure load was 117 kips. Because of the numerous assumptions
that went into Figure 5.9 and the ultimate loading of the tie.down
structure, the. agree is thought to be acceptable.
At this site a diaphragm was placed at about .20 feet from the ·. . . .
inlet. Construction of these. culverts normally call for over
excavation and bac](fill with granular fill. If this procedure is
used, the seepage collar (diaphragm) should as close to the inlet . . . .
as possible and the granular fill should be isolated·as much as
possible from direct contact with the water at the inlet.
The analysis of the tie down structure would indicate :the
failure load would be about 100 kips, located at about one foot
from the inlet. Table 5.3 shows that for a 10 ft. diameter plugged
pipe with 2 ft. of cover, a resisting force of 157 kips would be
required. From Figure 5.9 for a 10 ft diam·eter pipe with 2.8 feet
of cover, the reqUired resisting force is· 140 kips. The analysis
of site 2 does not include any consideration of the res_isting force
generated because of the .Pipe stiffness. However, the. general
agreement between the required resisting force' as estimated by the . . .
pore water analysis (140- 157 kips), and the estimated tie down
L_ ____________________ _

46
structure failure load (100 kip~) suggest,s that the assumptions
used to generate Figu~e 5.9 and Table 5.3 are reasonable.
7. CONCLUSIONS AND RECOMMENDATIONS
7.1. General Conclusions
The following conclusions arise from this study:
1.. A significant number of failures of CMP culverts are still occurring in Iowa despite design.warnings issued in 1974.
2. Uplift failure seems to be.the result of pore water pressure on the under side of· the pipe.
3. · There is a wide · variation in the designs of tie downs structures being used.
4. The minimum size pipe that was found to have failed was a 72 11 •
5. There . were no special hydrologic, topographic, and geotechnical environments that appeared to be more susceptible · to failures. However, most failures are thought to be at pipes flowing in inlet control.. ·
7. 2. Tentative Design Suggestions based on the Pore Water Analyses
. The ultimate object of this research is to provide a rational
basis for design of flexible metal culvert pipes against uplift. . . .
The immediate objective of this project is to clearly define the
problem with regard to the magnitude of the forces involved;
however in the interest of providing some immediate, practical
results from this project it is suggested:
1.. All CMP larger than 4 ft in diameter should be provided with headwalls or.tiedowns at the'upstream end of the pipe. For CMP greater than 6 ft tiedowns are essential.
2. The magnitude of :the resisting force in. the tiedow.n should be equivalent to no less than the weight provided by the volumes of concrete from· FHWA recommendations shown in Figure S.1~. The current Iowa, DOT design suggestions are less conservative, but probably adequate for most situations.
47
3. · Resisting forces greater than the equivalent weight of concrete volume indicated by the "rationa1 11 ·curve in Figure 3.10 are likely to be over designed. ;
7. 3. Recommendations to Develop Rational Design of Tiedowns for·CMP
:Although some states and FHWA have criteria f.or CMP tiedowns,
it is apparent that these criteria are not based upon consistent
theories. In order to arrive design standards.for well engineered
tiedown structures for flexible metal· pipe culverts, a rational . .
design process should be developed. The pore ·water analysis .c~n be
improved by combining the flow line analysis of. Chapter 4 with.and
improved version of the pore water. force analysis in Chapter 5 .
. The pore water force analysis can be improved by obtaining
experimental data on.the longitudinal flexural strength of large
diameter CMP. .A . second component to improve the pore water
·analysis 1s to experimentally and theoretically develop equations
to characterize the stress strain characteristics of the soil in
the.embankment above and adjacent to the pipe. . . .
7. 4.. Recommended Action
All current and future CMP culverts above 4 ft. in diameter
should have adequate tie downs to resist·uplift forces. Concrete
headwalls or· slope collars are recommended for most locations;
however, other engineered tie down structures can be successful if
. they provide adequate resistent force as outlined in Chapter 5.
Adequate attention should be given to spacing of the. bolts
connecting the pipe to the concrete mass. The concrete should
extend at least 4 feet below the pipe and to the .side of .the pipe
about 1/4 the pipe diameter.
48
REFERENCES
1. ,Pestotnik, c. A letter· to County Engineers on "Report on Flexible Culvert Inlet Floatation Failures Survey", Iowa DOT Ref No .. 521.1, February 20, 1976.
2. Pestotnik, c. A letter t6 County Engineers on "Inlet Flotation Failures on Flexible Type Pipe Culverts, Iowa DOT, no date.
3. Edgerton, Roy C~ "Culvert Inlet Failures- A Case History", Highway Research Board Bulletin 286, 1960.
4. Federal Highway Administration. "Pipe Culvert Inlet and Outlet Protection", ·FHWA Notice N 5040.3, April 26, 1974.
5. Federal Highway Administration. nHydraulic Design of Highway Culverts", Hydraulic Design Series No. 5, September, 1985.
6 .. Iowa Department of Transportation. "Depth of Cover Tables for Corrugated Metal Pipe",. Standard Road Plan RF-32, September, 1989.
7. Iowa Department of Transportation. "Depth of Cover Tables for Corrugated Metal Pipe", standard Road Plan RF-33, September, 1988. .
8. Indiana Department of Transportation. "Single Pipe .Concrete Anchors", Indiana DOT, March 198.7.
9. California Department of Transportation. "Highway Design Manual", pages 820-3 'to 820-11, August 5, 1988.

49
APPENDIX A
PHOTOS OF CULVERT FAILURES

50
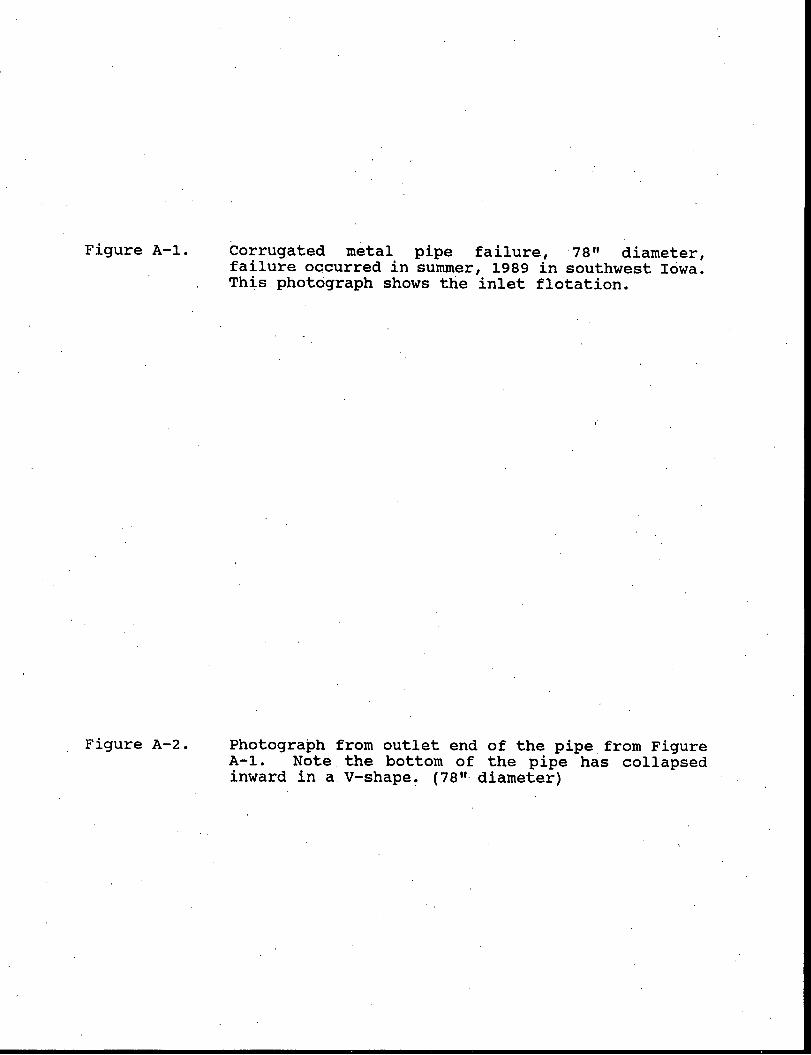
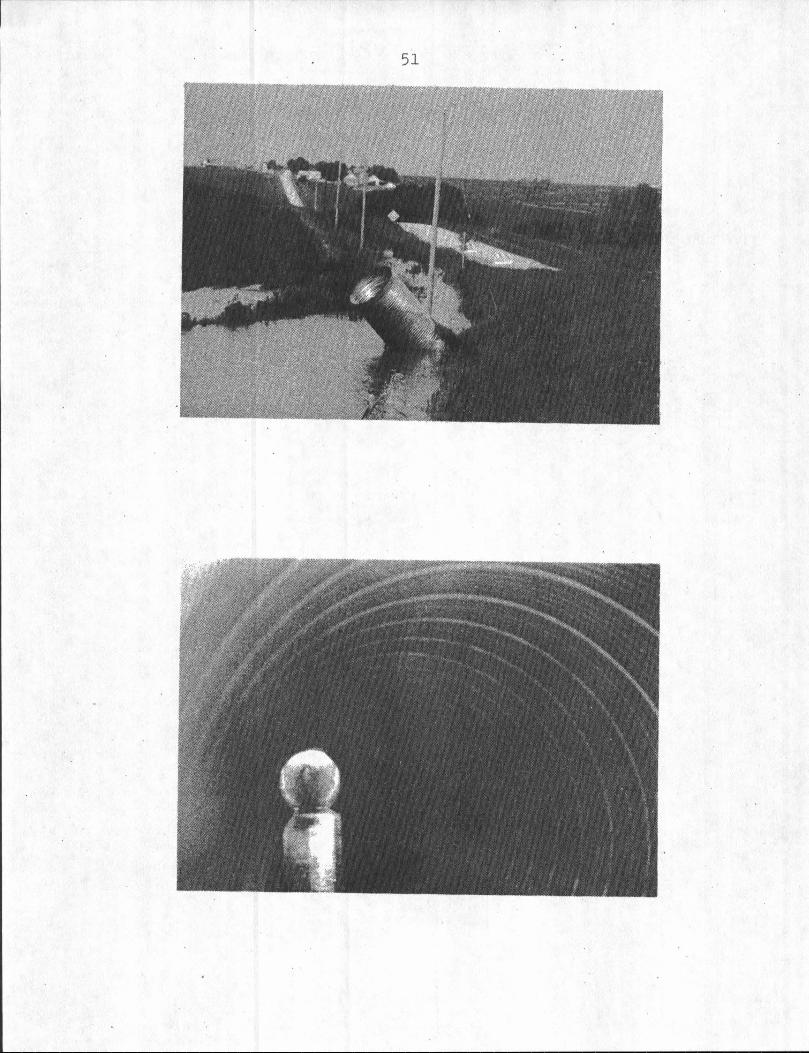
Figure A-1.
Figure A-2.
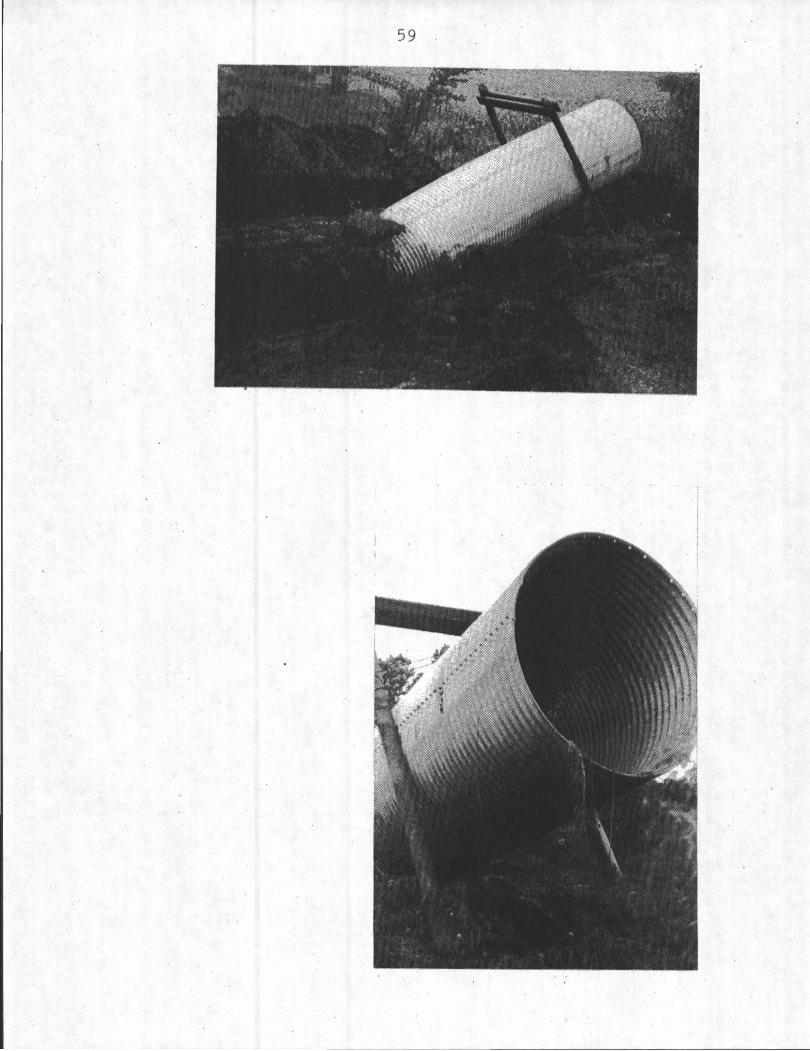
~orrugated metal pipe failure, '78" diameter, failure occurred in summer, 1989 in southwest Iowa. This photograph shows the inlet flotation.
Photograph from outlet end of the pipe from Figure A-1. Note. the bottom of the pipe has collapsed inward in a. v-shape~ (78"· diameter)
51

52
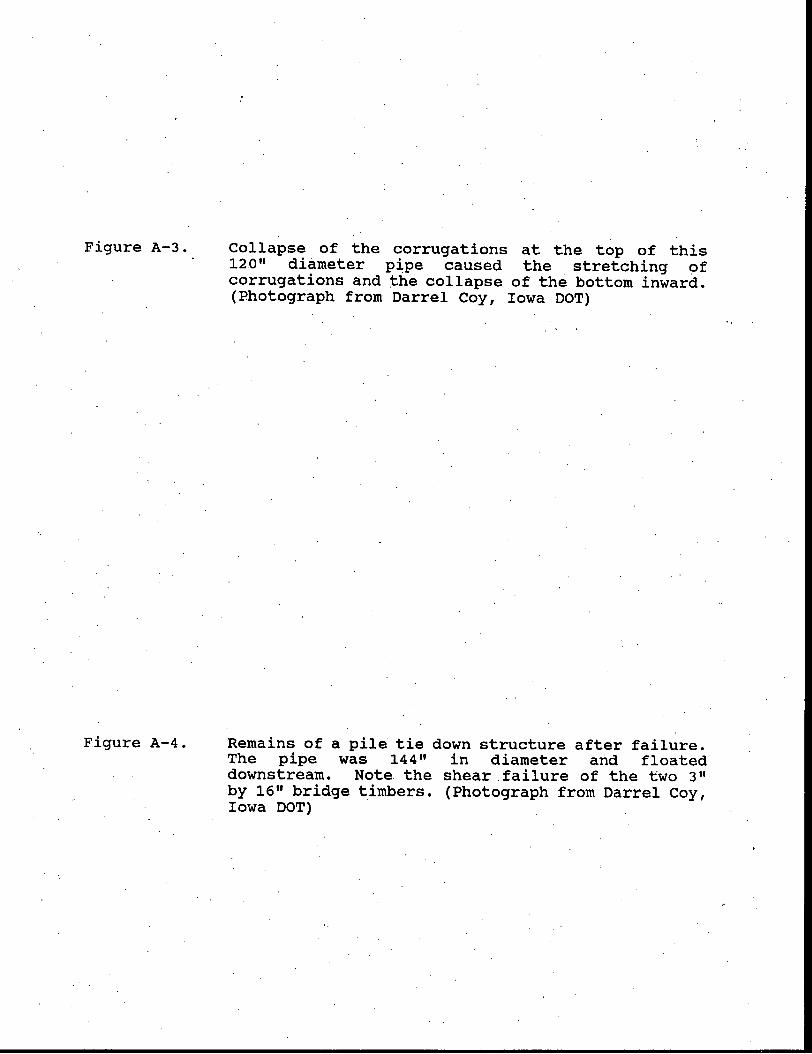
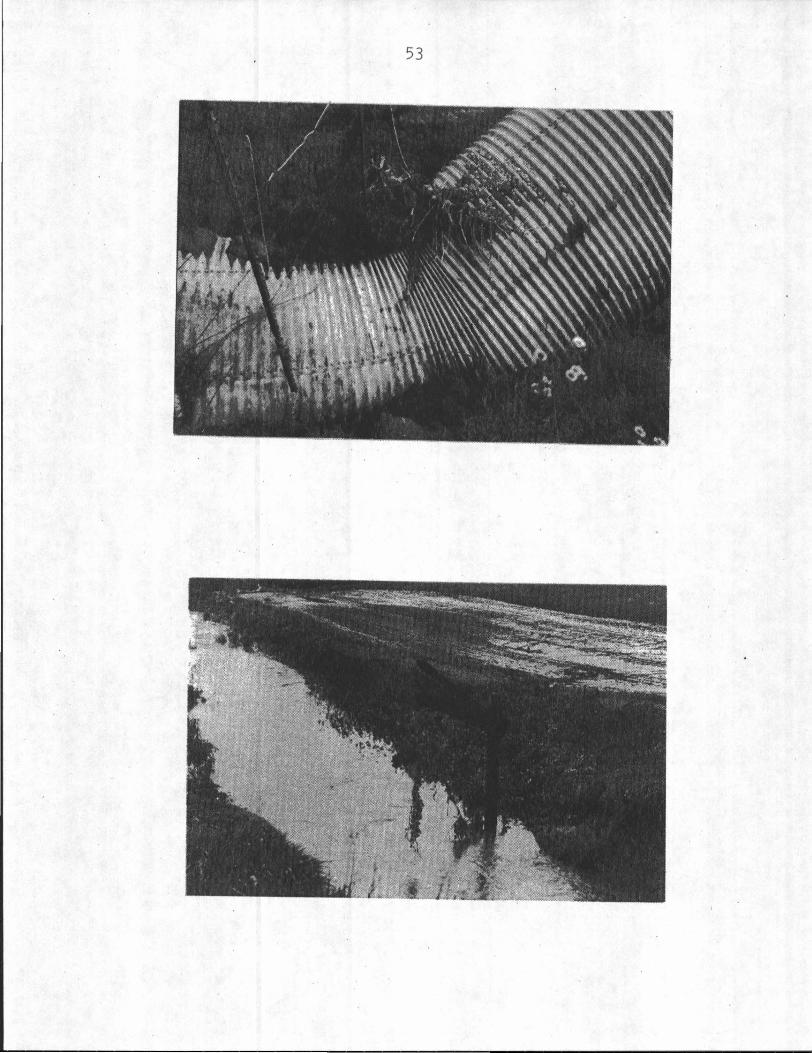
Figure A-3.
Figure A-4.
Collapse of the corrugations ·at the top of this 120" di~meter pipe caused the stretching of corrugations and the collapse of the bottom inward. (Photograph from Darrel Coy, Iowa DOT)
Remains of a pile tie down structure after failure. The pipe was 144" in diameter arid floated downstream. Note the shear failure of the two 3 11
by 16" bridge timbers. (Photograph from Darrel Coy, Iowa DOT) .
53

54
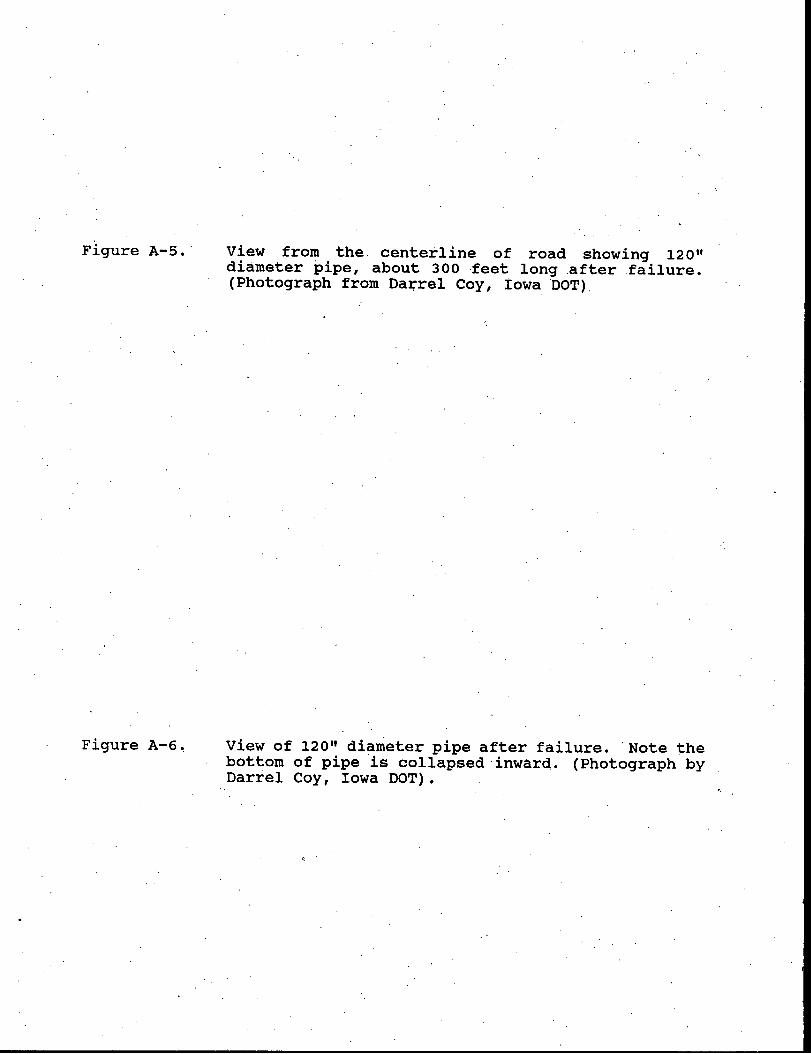
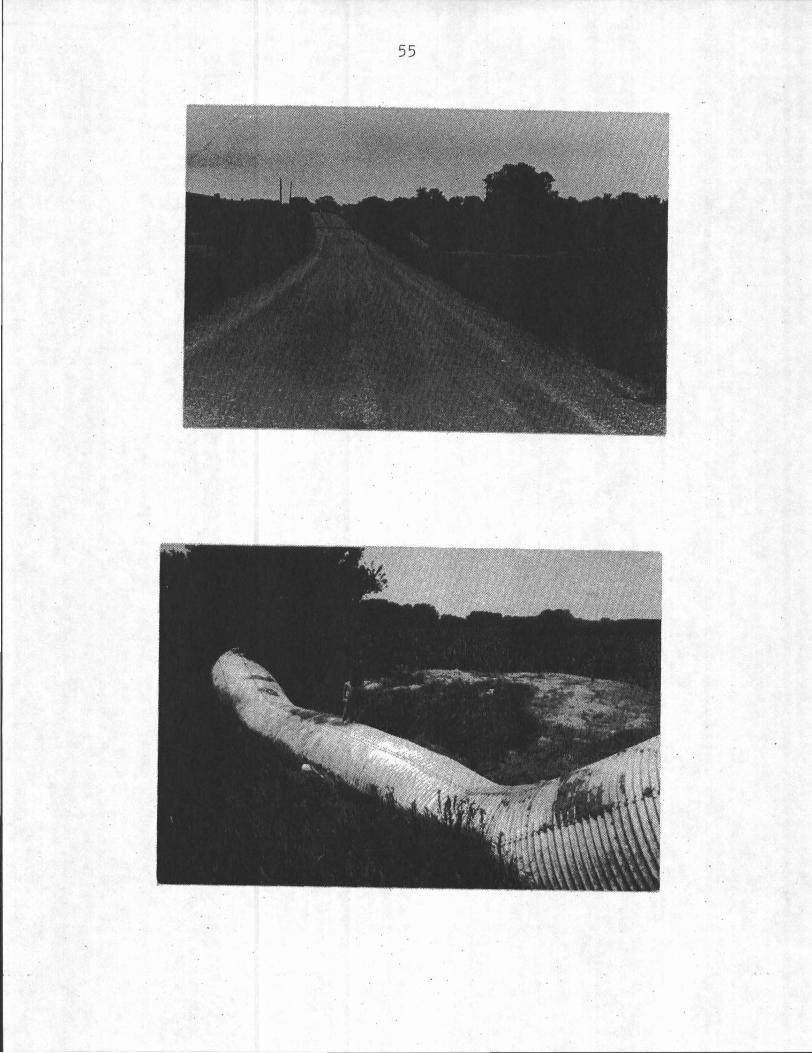
Figure A-5. ·
Figure A-6~
View from the. centerline of road showing 120 11
diameter pipe, about 300 feet long .after failure. (Photograph from Dai;-rel Coy, Iowa DOT)
View of 120" diameter pipe after failure. ·Note the bottom of pipe is collapsed inward. (Photograph by Darrel Coy, Iowa DOT).
55

56
..
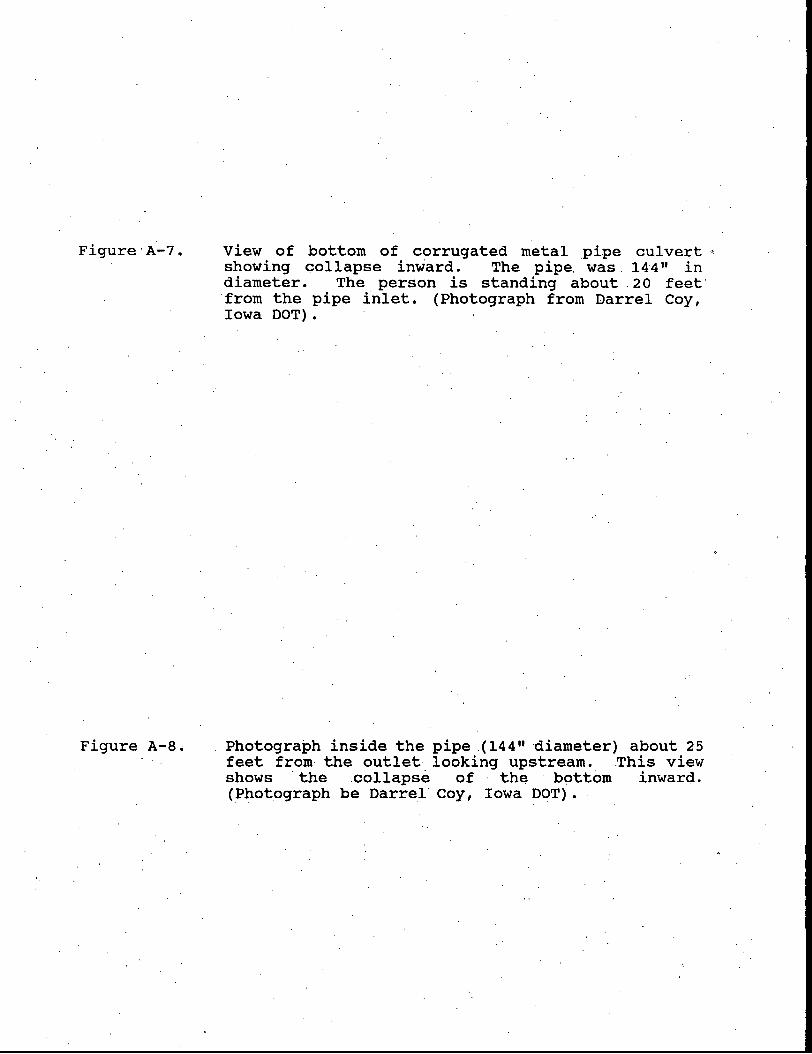
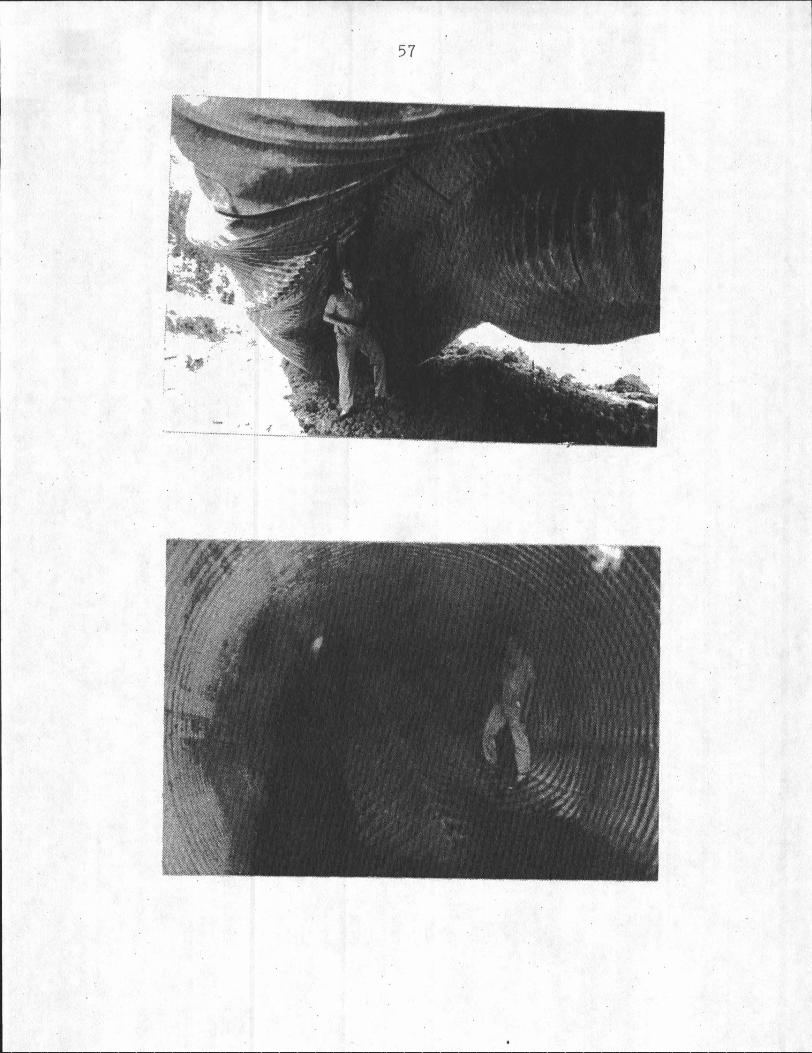
Figure·A-7.
Figure A-a.
View of bottom of corrugated metal pipe culvert ' showing collapse inward. The pipe. was 144" in diameter. The person is standing about . 2 o feet· from the pipe inlet. {Photograph from Darrel Coy, Iowa DOT).
Photograph inside the pipe {144" diameter) about 25 feet from the outlet looking upstream. .This view shows · the .collapse . of the bottom inward. <.Photograph be Darrel· coy, Iowa DOT).
57
-· , ·• .{
•.-....................... __ ... , ................ _____ _

58
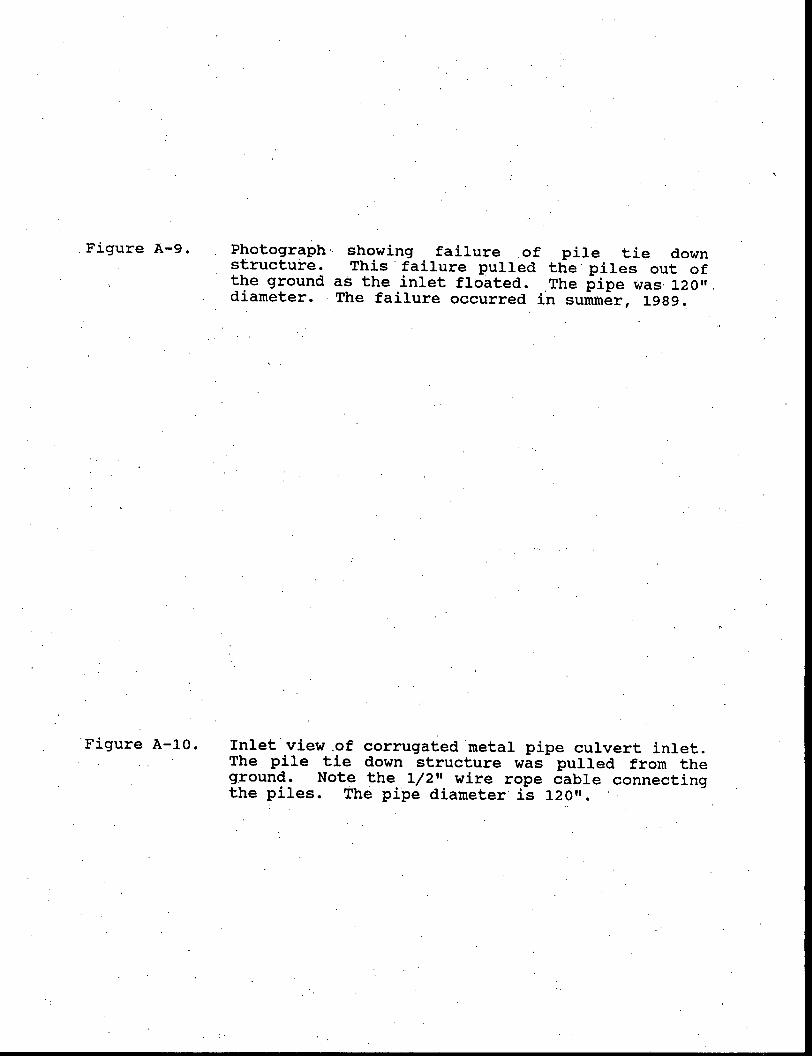
.Figure A-9.
·Figure A-10.
Photograph ·. structure. the ground diameter.
showing failure of pile tie down This.failure pulled the.piles out of
a~ the inlet flo~ted .. The pipe ~as· 120". The failure occurred in summer, 1989 ..
Inlet.view .of corrugated metal pipe culvert inlet. The pile tie down structure was pulled from the ground. Note the 1/2" wire rope cable connecting the piles. The pipe diameter is 120 11 • ·