Embed Size (px)
Citation preview

T E C H N I C A L A R T I C L E
Investigation of the Effect of Low-Velocity Impacton Composite Plates with PreloadingA. Kursun1 and M. Senel2
1 Department of Mechanical Engineering, Pamukkale University, Denizli, Turkey
2 Department of Mechanical Engineering, Dumlupinar University, Kutahya, Turkey
KeywordsE-glass/Epoxy, Low-Velocity Impact,
Composites with Plastic Matrix, Preload,
Damage
CorrespondenceM. Senel,
Department of Mechanical Engineering,
Dumlupinar University,
Kutahya 43100, Turkey
Email: [email protected]
Received: January 6, 2011; accepted:
February 14, 2011
doi:10.1111/j.1747-1567.2011.00738.x
Abstract
In this study, the effects of low-velocity impact on the preloaded E-glass/epoxy-laminated composites were investigated. Unidirectional reinforcedE-glass/epoxy-laminated composite materials, [0/90]2s, were manufacturedand tested. Dimensions of the specimens are 140 × 140 mm and its thickness is2 mm. Impact tests were conducted in a vertical drop weight test device, whichwas specially manufactured. Impactor has geometry with a semi-sphericalend of diameter 12 mm and weight 3.1 kg. In the tests, tension–tension,tension–compression (shear), and compression–compression preloads wereapplied on the specimen and low-velocity impacts were applied in themiddle of the plate for the specimens under preload and the differenceswith regard to damage were specified. Force–time graphs obtained from thetest specimens are given and discussed. Other graphs namely energy–time andforce–displacement are calculated from the force–time graphs.
Introduction
Most of the studies, which focus on low-velocityimpact in composite structures, are experimental.Besides, there are also numerical studies. In the liter-ature, low-velocity impact tests are generally appliedon the specimen with no tension or a unidirectionaltension is applied on the specimen. In general, asthese studies are performed through standard testdevices in the market, no preload could be applied onthe specimen through these test devices. In fact, thesestudies are not sufficient as the materials are affectedby the multidirectional complex loads. It is necessaryto perform experimental studies, in which bidirec-tional preload is applied on the specimen so as to getcloser to the actual operational conditions; a speciallydesigned testing apparatus is needed to achieve thisaim. Whittingham et al.1 performed a similar studythrough a special testing apparatus they designed.They analyzed the effect of prestress on laminated car-bon fiber/epoxy plates and response of the prestressto low-velocity impact. They did not focus on com-pression–compression prestress although they statedthat tension–tension, compression–compression, and
tension–compression (shear) prestresses could beused for testing apparatus. They also observe theuse of specimen with carbon/epoxy layer in a pre-stress arrangement in the study by Mitrevski et al.2
In their study, impactors with varying geometrywere used on the specimens under prestress andthey experimentally determined changes in relationto force–time and the quantity of energy absorbedby the specimens. Thus, they analyzed effects ofthe impactors with semi-spherical, conic, and sharpgeometry. They compared the results of the exper-imental study with the results of analytical impactobtained for the specimens under preloading condi-tions by Sun and Chattopadhyay.3 Robb et al.4 exper-imentally analyzed impact behaviors of carbon/epoxyand glass/polyester composites. They observed thattension prestresses applied on the specimen increasedwhile time of contact of the impactor on the specimendecreased. On the other hand, they did not observeany effect of the maximum force on the damage area.Chui et al.5 investigated the effect of the low-velocityimpact on prestress composites with semi-isotropicgraphite/epoxy layers. They applied the tests under
Experimental Techniques (2011) © 2011, Society for Experimental Mechanics 1

Impact on Composite Plates A. Kursun and M. Senel
various impact energies. They obtained the highestforce in tension prestress. As a result, the most con-siderable damage occurred under this prestress.
Analytical models are used in parametric studiesand for prediction of damage. To this end, Rossikhinand Shitikova6,7 used a method, which they devel-oped on the specimens without prestress, for inves-tigating the impact effect of the transverse isotropicplates with compression preload in 1994. They alsoincluded the values of inertia and sliding in theircalculations. They presented an analytical solutionthrough this method based on Ray series. In the lit-erature, there are studies, in which finite elementmethod is used for prediction of damage. In thisrespect, Choi8 referred to one of the numerical solu-tions, made an analysis and comparison through thefinite element code he developed. In addition, heapplied prestress on the specimen and developed asolution. In these solutions, he concluded that theapplied prestresses did not have any effect on theimpact damage areas, which occurred in the layers.
In this study, impact tests were applied on thespecimens at energy of 23.6 J after 2, 4, and 6 kNof forces were applied as preload. Besides, the studywas repeated at the same impact energy withoutapplying any preloading on the specimens and theresults were compared. As a result, the rigidity ofthe material increases with the effect of preloading.Therefore, energy brings about more damage as theelastic capability of the material decreases. It wasshown, through the results, that the type of damagevaried depending on the type of preloading.
Materials and Testing Apparatus
Test specimen
The composite material used for this study wasmanufactured from unidirectional E-glass continuousfibers and epoxy resin. The fiber volume fractionand the nominal thickness of the composite wereapproximately 55% and 2 mm, respectively. E-glass/epoxy composite plates with eight plies weremanufactured at Izoreel Firm by using hand lay-up technique. For matrix material, the epoxy CY225resin and hardener HY225 were used. The curingprocess was carried out at 120◦C for 3 h undera pressure of 0.25 MPa. Then, the composite wascooled to room temperature. The specimens werecut to required dimensions of 140 × 140 mm fromthe manufactured composite plates. Galvanized plateswere used in the parts of the specimen, which wereplaced on the claws, to prevent the composite plates
from a damage caused by the claws and to grasp theplates in a better way.
Testing apparatus
Several test techniques are used for impact tests.There is no standard test technique to characterizethe impact behaviors of the composite materials. Inthe literature, there is no technique, which is gen-erally accepted by different countries, organizations,and researchers. This issue results in a problem inrelation to comparison of results obtained from dif-ferent sources. Under these circumstances, it is nearlyimpossible to develop an appropriate model for theresponse of composite materials to impact. In spiteof these negative aspects, original test devices, whichare developed in various types to determine impactresistance of the composite materials, are used in acommon way.
A special test device with a height of 5 m, which wasbased on drop weight, was designed in the universitylaboratory for the impact tests. A maximum dropheight of 5 m is sufficient for velocities at and lessthan 10 m/s and this range of velocity is equivalentto the velocity envisaged for low-velocity impacts.9
Impacts, which are faster than this velocity, are calledhigh-velocity impact in the literature.10
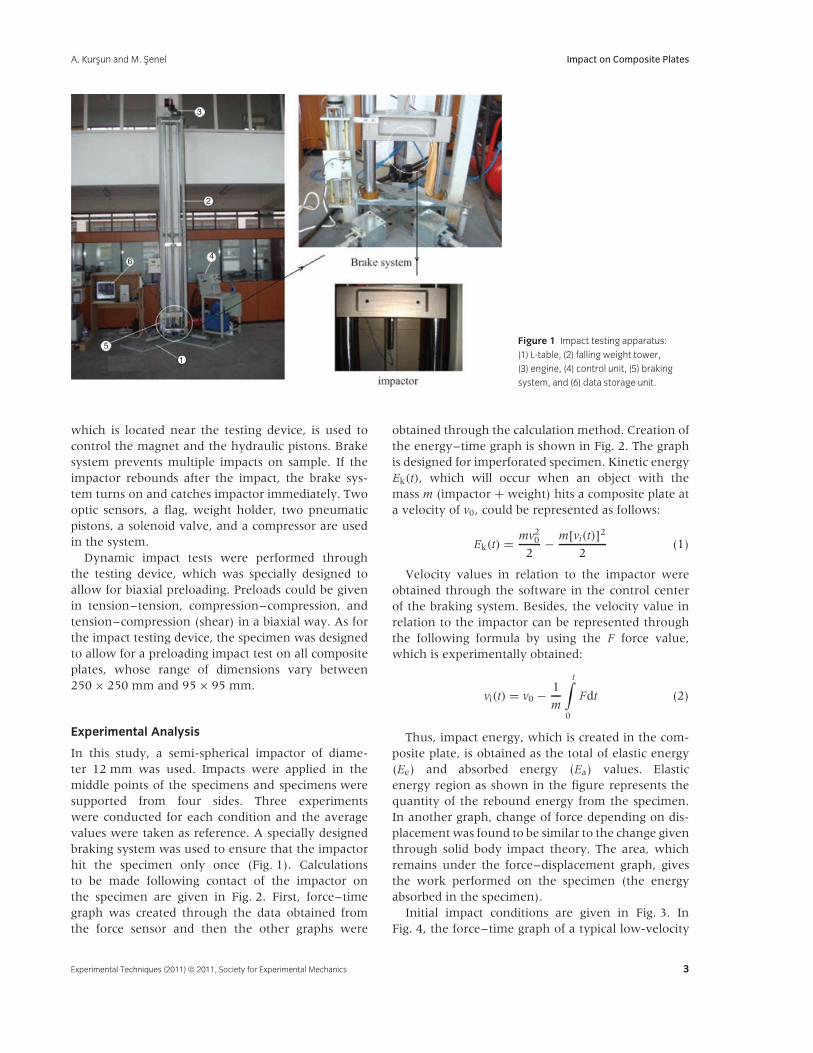
The testing apparatus is composed of six maincomponents: L-shaped bottom plate, weight droptower, lift engine, control unit, braking system, anddata storage unit. General layout of the low-velocityimpact testing apparatus is shown in Fig. 1. L-shapedbottom plate is made of steel material with a thicknessof 5 mm and there are hydraulic (for preloading) andpneumatic (for braking) pistons, specimen holders,and tower connections in this apparatus.
Impactor and weight were connected onto the rodsof the drop weight tower. A piezoelectric force sensor,which is placed between the weight and the impactor(PCB Quartz ICP Force Sensor [Model 201B04]),gives the relation between force–time during theimpact as a graph through Labview software. Lab-VIEW is a graphical programming environment todevelop sophisticated measurement, test, and con-trol systems using graphical icons and wires thatresemble a flowchart.11 Quartz, piezoelectric forcesensors are durable measurement devices which pos-sess exceptional characteristics for the measurementof dynamic force events, for example compression,impact, impulse, reaction, and tension.12 Data aretransferred from the sensor to the computer, graphi-cal results are created and analyzed. Besides, there is askid-type electromagnet, which will draw the weightto the desired distance, in the tower. The control unit,
2 Experimental Techniques (2011) © 2011, Society for Experimental Mechanics
A. Kursun and M. Senel Impact on Composite Plates
3
2
64
5
1
Figure 1 Impact testing apparatus:
(1) L-table, (2) falling weight tower,
(3) engine, (4) control unit, (5) braking
system, and (6) data storage unit.
which is located near the testing device, is used tocontrol the magnet and the hydraulic pistons. Brakesystem prevents multiple impacts on sample. If theimpactor rebounds after the impact, the brake sys-tem turns on and catches impactor immediately. Twooptic sensors, a flag, weight holder, two pneumaticpistons, a solenoid valve, and a compressor are usedin the system.
Dynamic impact tests were performed throughthe testing device, which was specially designed toallow for biaxial preloading. Preloads could be givenin tension–tension, compression–compression, andtension–compression (shear) in a biaxial way. As forthe impact testing device, the specimen was designedto allow for a preloading impact test on all compositeplates, whose range of dimensions vary between250 × 250 mm and 95 × 95 mm.
Experimental Analysis
In this study, a semi-spherical impactor of diame-ter 12 mm was used. Impacts were applied in themiddle points of the specimens and specimens weresupported from four sides. Three experimentswere conducted for each condition and the averagevalues were taken as reference. A specially designedbraking system was used to ensure that the impactorhit the specimen only once (Fig. 1). Calculationsto be made following contact of the impactor onthe specimen are given in Fig. 2. First, force–timegraph was created through the data obtained fromthe force sensor and then the other graphs were
obtained through the calculation method. Creation ofthe energy–time graph is shown in Fig. 2. The graphis designed for imperforated specimen. Kinetic energyEk(t), which will occur when an object with themass m (impactor + weight) hits a composite plate ata velocity of v0, could be represented as follows:
Ek(t) = mv20
2− m[vi(t)]2
2(1)
Velocity values in relation to the impactor wereobtained through the software in the control centerof the braking system. Besides, the velocity value inrelation to the impactor can be represented throughthe following formula by using the F force value,which is experimentally obtained:
vi(t) = v0 − 1
m
t∫
0
Fdt (2)
Thus, impact energy, which is created in the com-posite plate, is obtained as the total of elastic energy(Ee) and absorbed energy (Ea) values. Elasticenergy region as shown in the figure represents thequantity of the rebound energy from the specimen.In another graph, change of force depending on dis-placement was found to be similar to the change giventhrough solid body impact theory. The area, whichremains under the force–displacement graph, givesthe work performed on the specimen (the energyabsorbed in the specimen).
Initial impact conditions are given in Fig. 3. InFig. 4, the force–time graph of a typical low-velocity
Experimental Techniques (2011) © 2011, Society for Experimental Mechanics 3

Impact on Composite Plates A. Kursun and M. Senel
Figure 2 Impact energy level,
absorbed energy, and elastic
energy.
Figure 3 Initial impact time.
impact test is observed. Acceleration at t = ti wascalculated based on the second law of motion (ai =Fi/m) of Newton.13 Fi value is the value obtainedfrom the force sensor depending on time. This graph isdrawn through Labview software in computer duringtesting. Displacement of the impactor could be easilycalculated through a derivative of velocity in relationto time. Thus, a displacement graph is drawn on thebasis of the force.
Test Procedures
A test procedure was developed to determinethe change in relation to the maximum force,deposition, and absorbed energy in an experimentalmanner with the effect of preload in the compositeplates under the effect of low-velocity impact.Each specimen was checked against a structuraldeformation or a dimensional change prior to testing.
In the tests, contact of the impactor in the centerof the specimen is important for the creation of
Figure 4 Force–time graph of low-velocity impact.
damage. Therefore, first of all, coordinate system ofthe middle point was marked on each specimen.In this way, it was easily ensured that the impactis applied in the center of the specimen. Then, apreloading was applied on the specimens through thehydraulic pistons in the control system. The brakingsystem was calibrated through the optical sensorby contacting the impactor with the semi-sphericalgeometry on the specimen. After the calibrationprocedure was completed, the mass was drawn to theheight of impact (80 cm) through the electromagnetand at the same time, the calibration settings weresaved in the control system. The electromagnet circuitwas turned off, the mass freely fell, and an impact testwas applied on the specimen. The data obtained fromthe force sensor were stored in the computer andnecessary graphs were created. PCB Quartz ICP Force
4 Experimental Techniques (2011) © 2011, Society for Experimental Mechanics
A. Kursun and M. Senel Impact on Composite Plates
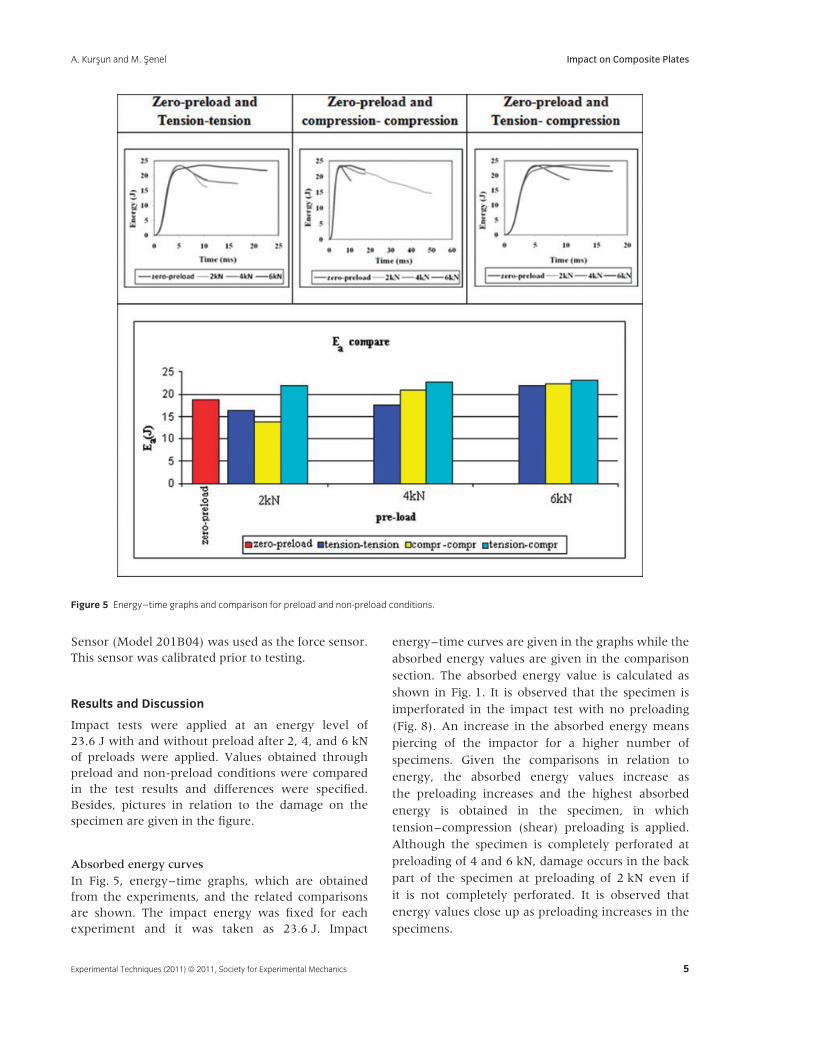
Figure 5 Energy–time graphs and comparison for preload and non-preload conditions.
Sensor (Model 201B04) was used as the force sensor.This sensor was calibrated prior to testing.
Results and Discussion
Impact tests were applied at an energy level of23.6 J with and without preload after 2, 4, and 6 kNof preloads were applied. Values obtained throughpreload and non-preload conditions were comparedin the test results and differences were specified.Besides, pictures in relation to the damage on thespecimen are given in the figure.
Absorbed energy curves
In Fig. 5, energy–time graphs, which are obtainedfrom the experiments, and the related comparisonsare shown. The impact energy was fixed for eachexperiment and it was taken as 23.6 J. Impact
energy–time curves are given in the graphs while theabsorbed energy values are given in the comparisonsection. The absorbed energy value is calculated asshown in Fig. 1. It is observed that the specimen isimperforated in the impact test with no preloading(Fig. 8). An increase in the absorbed energy meanspiercing of the impactor for a higher number ofspecimens. Given the comparisons in relation toenergy, the absorbed energy values increase asthe preloading increases and the highest absorbedenergy is obtained in the specimen, in whichtension–compression (shear) preloading is applied.Although the specimen is completely perforated atpreloading of 4 and 6 kN, damage occurs in the backpart of the specimen at preloading of 2 kN even ifit is not completely perforated. It is observed thatenergy values close up as preloading increases in thespecimens.
Experimental Techniques (2011) © 2011, Society for Experimental Mechanics 5
Impact on Composite Plates A. Kursun and M. Senel
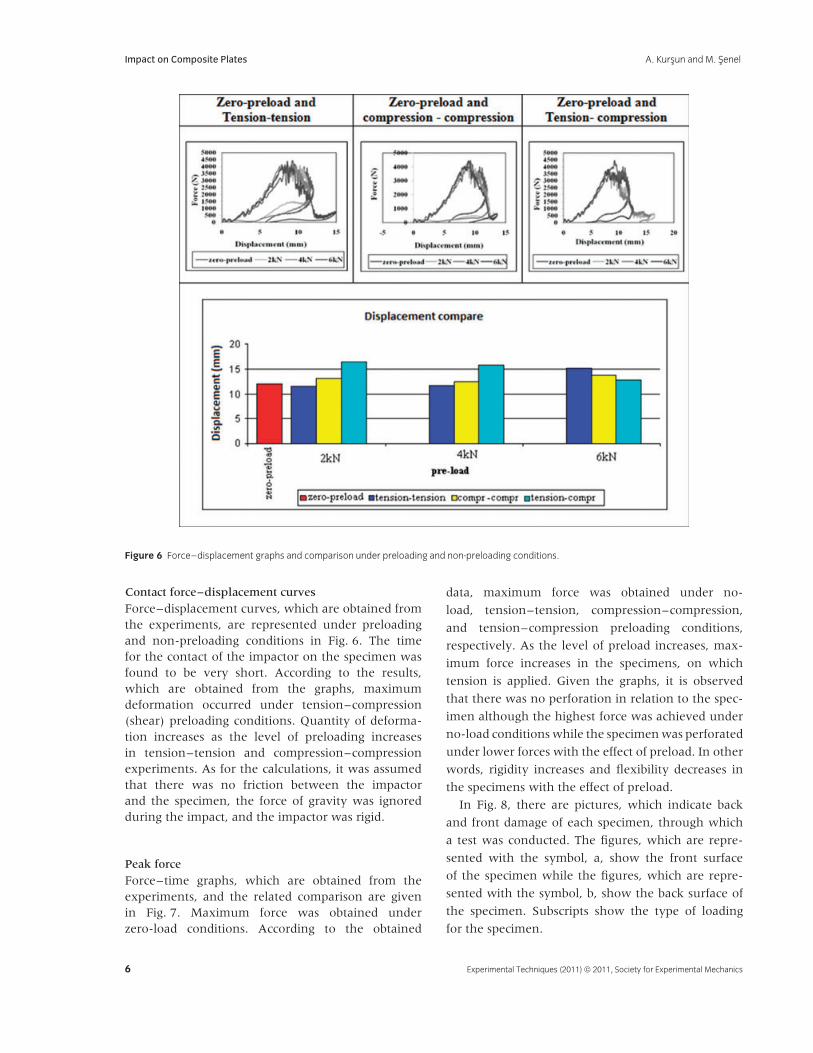
Figure 6 Force–displacement graphs and comparison under preloading and non-preloading conditions.
Contact force–displacement curves
Force–displacement curves, which are obtained fromthe experiments, are represented under preloadingand non-preloading conditions in Fig. 6. The timefor the contact of the impactor on the specimen wasfound to be very short. According to the results,which are obtained from the graphs, maximumdeformation occurred under tension–compression(shear) preloading conditions. Quantity of deforma-tion increases as the level of preloading increasesin tension–tension and compression–compressionexperiments. As for the calculations, it was assumedthat there was no friction between the impactorand the specimen, the force of gravity was ignoredduring the impact, and the impactor was rigid.
Peak force
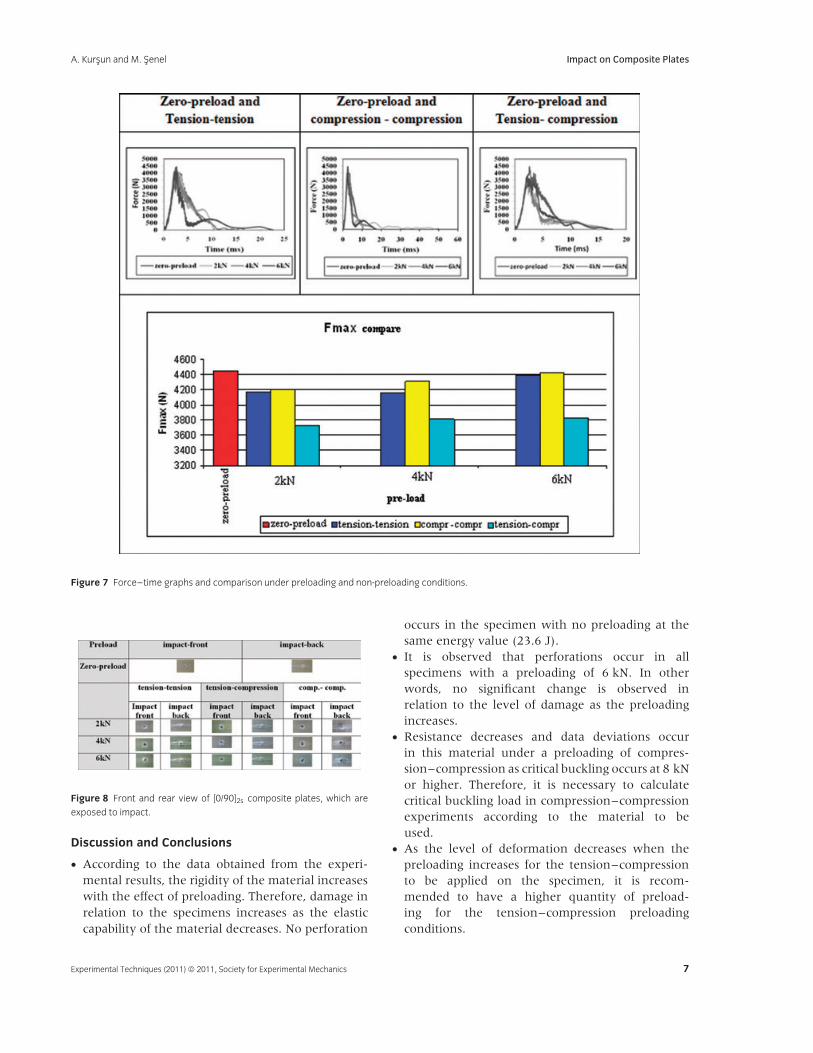
Force–time graphs, which are obtained from theexperiments, and the related comparison are givenin Fig. 7. Maximum force was obtained underzero-load conditions. According to the obtained
data, maximum force was obtained under no-
load, tension–tension, compression–compression,
and tension–compression preloading conditions,
respectively. As the level of preload increases, max-
imum force increases in the specimens, on which
tension is applied. Given the graphs, it is observed
that there was no perforation in relation to the spec-
imen although the highest force was achieved under
no-load conditions while the specimen was perforated
under lower forces with the effect of preload. In other
words, rigidity increases and flexibility decreases in
the specimens with the effect of preload.
In Fig. 8, there are pictures, which indicate back
and front damage of each specimen, through which
a test was conducted. The figures, which are repre-
sented with the symbol, a, show the front surface
of the specimen while the figures, which are repre-
sented with the symbol, b, show the back surface of
the specimen. Subscripts show the type of loading
for the specimen.
6 Experimental Techniques (2011) © 2011, Society for Experimental Mechanics
A. Kursun and M. Senel Impact on Composite Plates
Figure 7 Force–time graphs and comparison under preloading and non-preloading conditions.
Figure 8 Front and rear view of [0/90]2s composite plates, which are
exposed to impact.
Discussion and Conclusions
• According to the data obtained from the experi-mental results, the rigidity of the material increaseswith the effect of preloading. Therefore, damage inrelation to the specimens increases as the elasticcapability of the material decreases. No perforation
occurs in the specimen with no preloading at thesame energy value (23.6 J).
• It is observed that perforations occur in allspecimens with a preloading of 6 kN. In otherwords, no significant change is observed inrelation to the level of damage as the preloadingincreases.
• Resistance decreases and data deviations occurin this material under a preloading of compres-sion–compression as critical buckling occurs at 8 kNor higher. Therefore, it is necessary to calculatecritical buckling load in compression–compressionexperiments according to the material to beused.
• As the level of deformation decreases when thepreloading increases for the tension–compressionto be applied on the specimen, it is recom-mended to have a higher quantity of preload-ing for the tension–compression preloadingconditions.
Experimental Techniques (2011) © 2011, Society for Experimental Mechanics 7

Impact on Composite Plates A. Kursun and M. Senel
Future Work
The future work will focus on the analysis of theeffects of an impactor with a different geometry onthe specimens with preloading.
Acknowledgment
The authors would like to thank The Science andTechnological Research Council of Turkey (TUBITAK)for the financial support of this work.
References
1. Whittingham, B., Marshall, I.H., Mitrevski, T., andJones, R., ‘‘The Response of Composite StructuresWith Pre-Stress Subject to Low Velocity impactDamage,’’ Composite Structures 66:685–698 (2004).
2. Mitrevski, T., Marshall, I.H., Thomson, R.S., andJones, R., ‘‘Low-Velocity Impacts on PreloadedGFRP Specimens With Various Impactor Shapes,’’Composite Structures 76:209–217 (2006).
3. Sun, C.T., and Chattopadyay, S., ‘‘DynamicResponse of Anisotropic Laminated Plates UnderInitial Stress to Impact of a Mass,’’ Journal of AppliedMechanics 42:693–698 (1975).
4. Robb, M.D., Arnold, W.S., and Marshall, I.H., ‘‘TheDamage Tolerance of GRP Laminates Under BiaxialPrestress,’’ Composite Structures 32(9):141–149(1975).
5. Chiu, S.T., Liou, Y.Y., Chang, Y.C., and Ong, C.L.,‘‘Low Velocity Impact Behavior of Pre-StressedComposite Laminates,’’ Materials Chemistry andPhysics 47:268–272 (1997).
6. Rossikhin, Y.A., and Shitikova, M.V., ‘‘A RayMethod of Solving Problems Connected With aShock Interaction,’’ Acta Mechanica 102:103–121(1995).
7. Rossikhin, Y.A., and Shitikova, M.V., ‘‘DynamicResponse of a Pre-Stressed Transversely IsotropicPlate to Impact by an Elastic Rod,’’ Journal ofVibration and Control 15(1):25–51 (2009).
8. Choi, I.H., ‘‘Low-Velocity Impact Analysis ofComposite Laminates Under Initial In-Plane Load,’’Composite Structures 86:251–257 (2008).
9. Shivakumar, K.N., Elber, W., and Illg, W.,‘‘Prediction of Low-Velocity Impact Demage in ThinCircular Laminates,’’ AIAA Journal 23(3):442–449(1985).
10. Luo, R.K., Gren, E.R., and Morrison, C.J., ‘‘ImpactDamage Analysis of Composite Plates,’’ InternationalJournal of Impact Engineering 22(4):435–447 (1999).
11. LabVIEW, Web site: http://www.ni.com/labview/whatis/.
12. PCB PIEZOTRONIC, Web site: http://www.pcb.com/.
13. Uyaner, M., and Kara, M., ‘‘Dynamic Response ofLaminated Composites Subjected to Low VelocityImpact,’’ Journal of Composite Materials 41:2877–2896(2007).
8 Experimental Techniques (2011) © 2011, Society for Experimental Mechanics