Embed Size (px)
Citation preview

7/27/2019 Strutting (Preloading test).pdf
http://slidepdf.com/reader/full/strutting-preloading-testpdf 1/49
Report on
Full-Scale Load Testing of Steel Strutting System
For
Yongnam Holding Limited
Prepared by
Dr Richard LiewPhD, MIStrutE, CEng, PE(S’pore)
Department of Civil Engineering
National University of Singapore
08 December 2006
(This Report Contains 48 Pages)

7/27/2019 Strutting (Preloading test).pdf
http://slidepdf.com/reader/full/strutting-preloading-testpdf 2/49
1
CONTENTS
Page
1 Modular Strutting System 3
2 Test Objectives 3
3 Test setup 4
4 Instrumentation
4.1 Displacement measurements
4.2 Stress measurements
5
5
6
5 Test Procedure 7
6 Mechanical Properties of Used Steel 7
7 Test Results
7.1 Axial load-displacement relationship
7.2 Applied load- vertical displacement relationship
7.3 Applied load- lateral displacement relationship
7.4 Stresses in the main struts
7.5 Force distribution in the ties and lacing members
7.6 Test Observations and failure modes
9
9
9
9
10
10
10
8 Comparison with Code’s Design Capacity 11
9 Conclusions 12
References 13
Table 1: Loading intervals and observation 14
Table 2: Table 2: Initial out-of-straightness deflection (downwards deflection) of
struts before loading
14
Table 3: Locations, alignment and direction of sensors 15
Table 4: Axial load capacity of laced strut -comparison of predicted results with test
result
17
Figure 1: Test and instrument layout 18
Figure 2: Load application using hydraulic actuators and high-strength strands 19
Figure 3: S Strut with the loading tendons in position 20
Figure 4: Base support allowing horizontal movement 21
Figure 5: Base support preventing lateral translations. 21
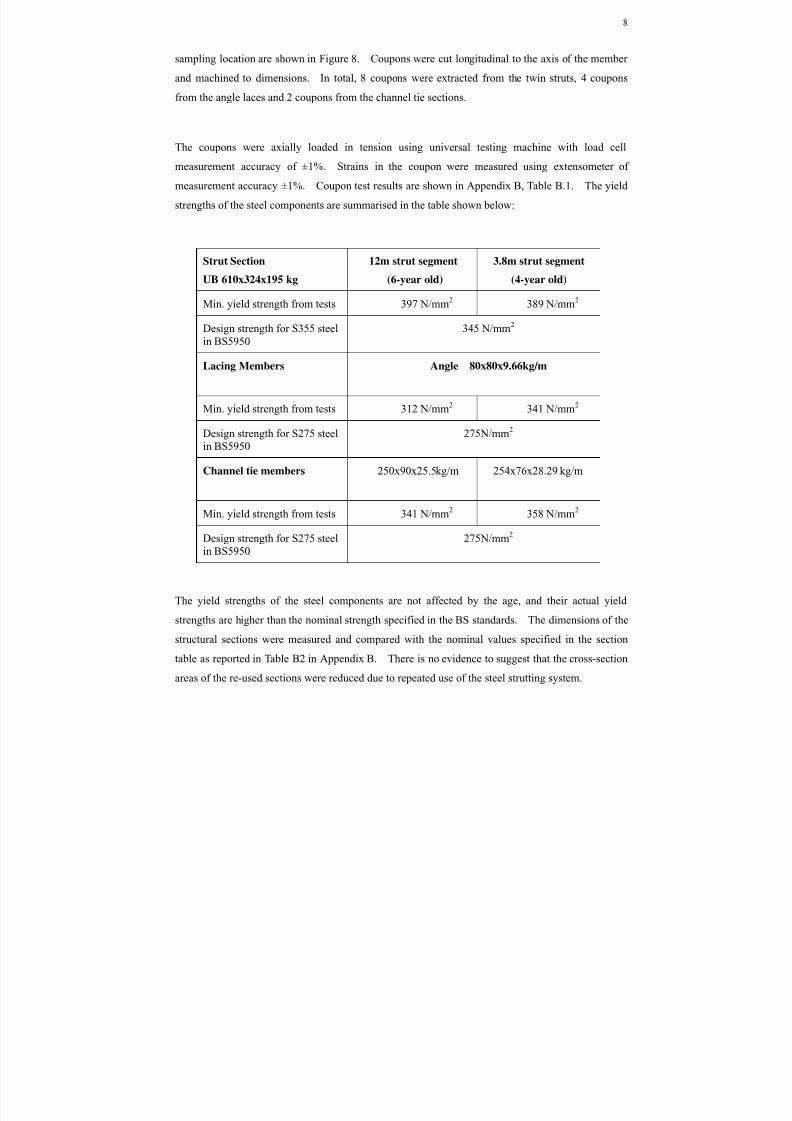
Figure 6: Transducer D3 measuring axial displacement at the real end of the strut. 22
Figure 7: Vertical displacement transducers D5 and D6 at the splice joint of strut. 23
Figure 8: Details of coupon specimens and extracted location 24
7/27/2019 Strutting (Preloading test).pdf
http://slidepdf.com/reader/full/strutting-preloading-testpdf 3/49
2
Figure 9: Applied load versus axial displacements 25
Figure 10: Applied load versus vertical deflection 26
Figure 11: Vertical deflection profile of the strut 27
Figure12: Load versus lateral displacement at mid-length 27
Figure 13: Stresses on top and bottom flanges of the strut sections at mid-length 28Figure 14: Axial forces in the Channel Sections 28
Figure 15: Applied load versus axial forces in the lacing members 29
Figure 16: Buckling of the main struts and lacing members after collapse 30
Figure 17: Buckling of the mid-length strut section 31
Figure 18: Another view showing the buckling of the laced strut 32
Figure 19: Applied force versus lacing forces – comparison with EC3 approach 33
Appendix A: Certificate of Calibration for Digital Pressure Gauge 34
Appendix B: Coupon Test Results 35
Appendix C: Design Approaches for Calculating Buckling Resistance of Build-up
Members
37
C.1 BS5950:Part1:2000 Approach
C.2 BS EN1993-1-1:2005 Approach
C.3 EC 3 approach to evaluate the shear force of the axially loaded
laced struts
C.4 Example
37
40
46
47

7/27/2019 Strutting (Preloading test).pdf
http://slidepdf.com/reader/full/strutting-preloading-testpdf 4/49
3
Full-Scale Load Testing of Steel Strutting System
1 Modular Strutting System
Yongnam has developed a proprietary Modular System of components that may be assembled to
provide a structural strutting system appropriate for the majority of excavation support requirements.
The system comprises of:
• Laced universal beams of various cross-sections in modular lengths.
• Single and double waler beams in various lengths, intermediate supporting beams, king
posts, bracing and waler support brackets.
• Various strut to waler joints have been produced to suit to suit the site conditions as
required.
The Yongnam strutting system has been used in many basement construction and civil engineering
excavation works including high-rise and mass rapid transit projects in Singapore, Hong Kong and
the Middle East.
There are, however, a number of questions asked with regard to the performance of the modular
strutting system, such as the performance of the splice joint, strength of the reusable materials, force
distributions in the lacings and channels between the main struts. In response to these questions, a
full scale load test of “used” modular strutting system spanning about 20m was carried out in the
premise of Yongnam Holdings Limited, located at 51 Tuas South Street 5, Singapore 637644, on 8
November 2006. This report provides the test results and their interpretation with regard to the
performance of the strutting system in comparison with the code’s predicted results.
2 Test Objectives
The objectives of carrying out full scale test on the laced strut system are:
• To determine the maximum load capacity of the strut system and compare against the
design capacity
• To investigate the performance and to identify the possible failure mode of the strut system
• To ascertain the maximum induced forces on lacing members and compare them with
results predicted by the design equations given in BS5950:2000:Part 1 and Eurocode 3
• To investigate the force distributions on the lacing members along the length of the strut

7/27/2019 Strutting (Preloading test).pdf
http://slidepdf.com/reader/full/strutting-preloading-testpdf 5/49
4
• To study the load-displacement behaviour of the strut system
• To determine the strength of re-usable strut materials and their implication to structural
safety.
To accomplish the objectives, the strutting system was load tested to failure to establish its buckling
capacity and failure mode. The failure load is compared with the code’s predicted load to gain
insight to its ultimate strength behaviour. The load-displacement relationship and internal force
distribution in the main struts and lacing members were monitored on-line during the test.
3 Test Setup
The test specimen consists of two universal beams, UB 610x324x195 kg/m, inter-connected by
diagonal laces of equal angle section 80x80x9.66kg/m, and ties of channel sections C254x76 and
C254x90 as shown in Figure 1. The length of the strut is 19.6m consisting of three modular
segments of lengths 3.8m, 12m and 3.8m. The three strut segments were connected by using 8
number of M24 Grade 8.8 bolts via flush end plate connections. The two end-strut 3.8m segments
was about 4 years old and they were used in KPE strutting works fo r project C-421 and circle line
MRT project C-853. The central strut segment of 12m length was more than 6 years old and had
been used in Hong Kong MRT project and subsequently deployed to LTA projects C-421 and C-851
( Note: This information was provided by Yongnam Holdings on requested by the author ).
The laced strut specimen was arranged in a horizontal position and connected to waler beams at both
ends. Loads were applied horizontally from the ends of the struts through the waler beams using
three hydraulic jacks of maximum capacity of 800 tons each (Figure 2). The loading system
utilizes high tensile strands running along the sides of the strut and mounted onto the walers at the
ends applying a compressive loading on the struts (see Figure 3). A third party contractor, VSL
Singapore Pte Ltd, was engaged to supply and operate the hydraulic jacks. The jacks are linked to
share equal hydraulic pressure during load application using a hydraulic pump. Each hydraulic
jack was connected to 31 numbers of 0.6" diameter super low relaxation strands with the following
properties:
• Nominal Diameter of the strand: 15.7mm
• Nominal Area: 150mm
• Yield Strength: 1500 MPa
• Min. Breaking Load: 265 kN

7/27/2019 Strutting (Preloading test).pdf
http://slidepdf.com/reader/full/strutting-preloading-testpdf 6/49
5
The load was controlled by using a digital pressure gauge which was calibrated to ISO 17025. The
certificate of calibration is attached in Appendix A. Total applied load was manually
communicated to the data acquisition system at predetermined loading intervals listed in Table 1.
The two ends of the strutting system were bolted to waler beams which were supported by short
columns. The column bases were welded to end-plates. One end of the column base was seated
on a smooth concrete pad allowing free translation in the longitudinal direction of the strut as shown
in Figure 4. The other end of the column base (where the hydraulic jacks were mounted) was bolted
down to the concrete pad preventing any lateral movement (see Figure 5). The bolt connection to
the concrete pad offered very little resisting against overturning moment. The two end boundary
conditions of the strutting system simulate a pinned support and a roller support condition.
Before loading, the initial vertical deflection of the struts was measured and the results are shown in
Table 2. The strut has initial out-of-straightness with maximum vertical deflection of about 19 mm
at the spliced joint. This is slightly less than the maximum out-of-straightness tolerance of span
length/1000 (or 19.6mm) for column design as in BS5950:Part1:2000 [Ref. 1]. The initial
out-of-straightness in the lateral direction of the strut was found to be very small. This was due to
the present of lateral bracing members which controlled the straightness of the two struts in the
lateral direction.
4 Instrumentation
The test specimen was instrumented with strain gauges and displacement transducers to determine
the stresses in the strut and the lacing members and the lateral and vertical displacements. The
instrumentation layout plan is shown in Figure 1. A summary of the sensor locations and theirsensing direction is given in Table 3.
4.1 Displacement measurements
Displacements were measured using spring mounted strain gauge based displacement transducers.
The transducers have the following maximum travel distances (see Figure 1):

7/27/2019 Strutting (Preloading test).pdf
http://slidepdf.com/reader/full/strutting-preloading-testpdf 7/49
6
Displacement Transducers Maximum Travel Distance
D1 and D2 50 mm
D3, D4, D5 and D6 200 mm
D7 and D8 100 mm
The measurement accuracy of the displacement transducers is ±0.02mm. The instruments were
connected electrically to a data logger of resolution 1 micro-strain and with measurement accuracy
of ±0.05% of reading.
The axial displacement was measured by taking the average readings from the displacement
transducers mounted at mid-height of the strut at positions D1, D2, D3, and D4 (see Figure 6). The
vertical deflections at the mid-span of the strut were measured using strain gauge based
displacement transducers mounted at positions D7, and D8. Additional vertical deflections were
measured at the splice joints of the laced strut at 3.8m from both ends of the test specimen as shown
in Fig. 7.
Lateral displacements were measured at the mid-length of the strut. The transducers were mounted
at positions D11, D12, D13, and D14 in Figure 1 measuring the lateral displacements of the top and
bottom flanges of the struts at mid-length.
4.2 Stress measurements
− Strain gauges were attached at the mid-length section of the lacing members along one-half of
the strut. They are indicated as L1 to L16, comprising 8 top and 8 bottom laces. Each lace
was instrumented with two strain gauges mounted longitudinally on each leg of the angle lace.
The first 4 laces nearest to the end were instrumented with 4 strain gauges with two gauges at
each leg, labelled as -1 to -4, to monitor their bending stresses.
− Strain gauges were attached to the mid-length of the strut to measure the compressive and bending stresses at the top and bottom flanges of the strut. These comprise two strain gauges

7/27/2019 Strutting (Preloading test).pdf
http://slidepdf.com/reader/full/strutting-preloading-testpdf 8/49
7
mounted on the top and bottom flanges at the mid-length section of each strut member, labelled
as S1 to S4.
− Strains gauges were attached to the channel tie sections located at the front end of the strut and at
the splice joints location, indicated as C1 to C6. Each channel section was instrumented with
three strain gauges to measure the average stresses acting on the channel section.
Data collection was triggered manually when the applied load reached the predetermined values.
The scanning rate of the data logger is approximately 0.08 second per channels.
5 Test Procedure
The load procedure was divided in 3 stages:
1 Preload cycling from 0 to 500 tons
− Repeated loading up to 500 tons and unloading without recording data. The bolts at the
splice joints were tighten at preload of 500 tons. This was necessary to remove any lack of fit
in the test specimen.
2 Load up to service load of 700 tons
− The service load of the test specimen is about 700 tons (design load capacity is about 1000
tons with factor of safety of 1.4). The service load indicated in Yongnam technical brochure
for this laced strut is about 750 tons. A quasi-static load was applied at an incremental load
of 100 tons up to 700 tons. At every load intervals, deflection and strain gauge readings were
taken.
3 Loading from 700 tons to failure− Without unloading, the load was monotonically increased at intervals of 100 tons up to 1000
tons and thereafter at 50 tons increment till failure. At each load increment, deflection and
strain gauge readings were taken. Observations were made of the strut behaviour and failure
mode.
6 Mechanical Properties of Used Steel
Mechanical properties of the steel strut components were determined from coupon specimens
extracted from the used steel similar those in the test specimens. Details of the coupons and
7/27/2019 Strutting (Preloading test).pdf
http://slidepdf.com/reader/full/strutting-preloading-testpdf 9/49
8
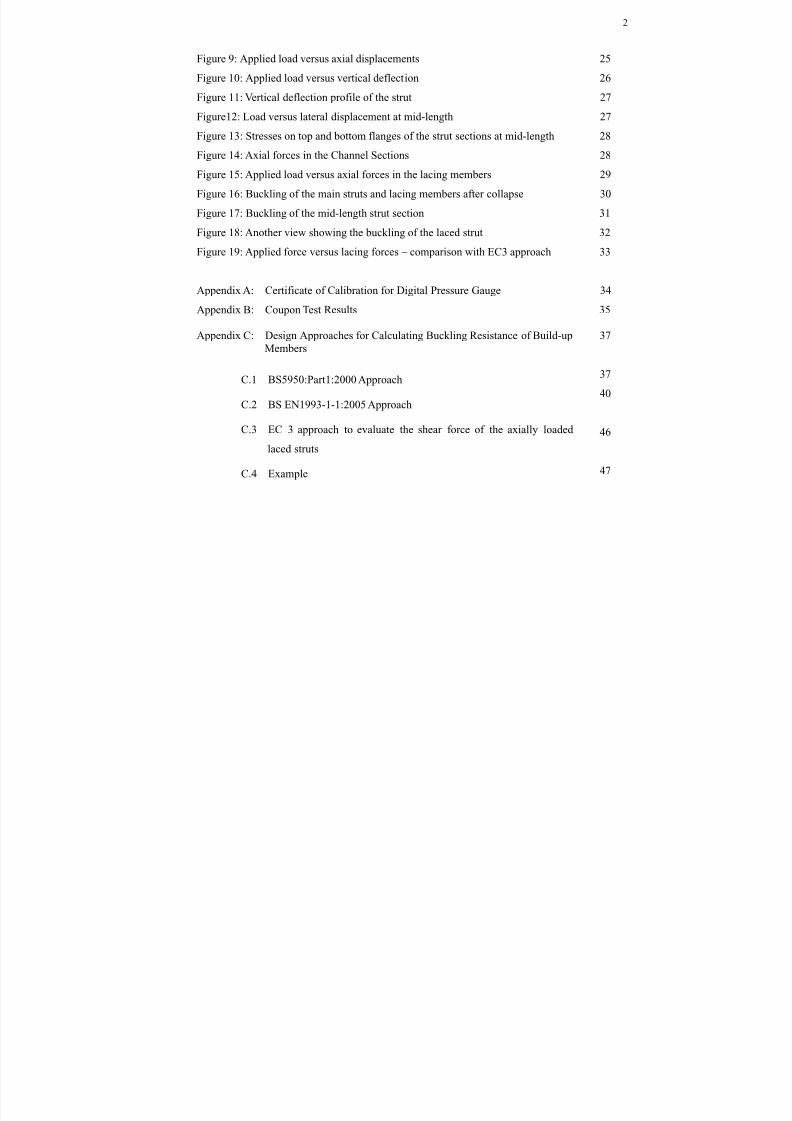
sampling location are shown in Figure 8. Coupons were cut longitudinal to the axis of the member
and machined to dimensions. In total, 8 coupons were extracted from the twin struts, 4 coupons
from the angle laces and 2 coupons from the channel tie sections.
The coupons were axially loaded in tension using universal testing machine with load cell
measurement accuracy of ±1%. Strains in the coupon were measured using extensometer of
measurement accuracy ±1%. Coupon test results are shown in Appendix B, Table B.1. The yield
strengths of the steel components are summarised in the table shown below:
Strut Section
UB 610x324x195 kg
12m strut segment
(6-year old)
3.8m strut segment
(4-year old)
Min. yield strength from tests 397 N/mm2 389 N/mm2
Design strength for S355 steel
in BS5950
345 N/mm2
Lacing Members Angle 80x80x9.66kg/m
Min. yield strength from tests 312 N/mm2 341 N/mm2
Design strength for S275 steel
in BS5950
275N/mm2
Channel tie members 250x90x25.5kg/m 254x76x28.29 kg/m
Min. yield strength from tests 341 N/mm2 358 N/mm2
Design strength for S275 steel
in BS5950
275N/mm2
The yield strengths of the steel components are not affected by the age, and their actual yield
strengths are higher than the nominal strength specified in the BS standards. The dimensions of the
structural sections were measured and compared with the nominal values specified in the section
table as reported in Table B2 in Appendix B. There is no evidence to suggest that the cross-section
areas of the re-used sections were reduced due to repeated use of the steel strutting system.

7/27/2019 Strutting (Preloading test).pdf
http://slidepdf.com/reader/full/strutting-preloading-testpdf 10/49
9
7 Test Results
7.1 Axial load-displacement relationship
The axial load displacement relationship obtained from the test data is almost linear up to about
1000 tons as shown in Figure 9. The axial load displacement at service load of 700 tons is about 13
mm. Thereafter, axial displacement of the left strut increased faster than the right strut with an
average axial displacement of about 35mm at 1400 tons. Thereafter, axial deflection increased
rapidly and the strut failed at 1438 tons. Failure was characterised by the buckling of the main strut
members bending about their major axis (x-x axis) causing large deflection in the downward
direction.
7.2 Applied load- vertical displacement relationship
Figure 10 shows the applied load versus the vertical displacement curves taken at the mid-length
section and at the splice joint positions of the strut. The mid-length vertical deflection is about
14mm at the service load of 700 tons. When the applied load exceeded 1000 tons, the lateral
deflection increased in a nonlinear manner; the maximum measured vertical deflection is about 78
mm at applied load of 1400 tons occurred at the mid-length of the strut. The vertical deflection
increased rapidly when the load approached the maximum capacity of 1438 tons. The strut buckled
in the downward direction until the mid-length sections of the strut touched the ground. The
deflection profile of the strut was measured at various load stages and the deflected curves are
plotted in Figure 11. There is no slope discontinuity due to the present of splice joints along the
strut length. No opening up of splice joints was observed up to the load of 1400 tons.
7.3 Applied load- lateral displacement relationship
Figure 12 shows the applied load versus the lateral displacements measured at the mid-length sectionof the strut. The lateral deflection of the strut was very small at the service load level (less than
2mm). This increases to about 8.4 mm just before failure at 1400 tons applied load. The bottom
flange of the Universal beam section defected more than the top flange under the increased load.
The maximum difference in lateral deflection is about 4mm at 1400 tons of applied. The lateral
deflection is considered to be very small as compared to the vertical displacement, indicating that the
lacing members were effective in preventing buckling in the lateral direction (i.e, y-y axis).

7/27/2019 Strutting (Preloading test).pdf
http://slidepdf.com/reader/full/strutting-preloading-testpdf 11/49
10
7.4 Stresses in the main struts
Figure 13 shows the applied load versus the average stresses taken at the top and bottom flanges of
the main strut sections at the mid-length. The compressive stresses at the top flanges are higher
than those at the bottom flanges because of the combined axial and bending stresses at the
mid-length of the strut. It is noted that at 1400 tons of applied load, the strut sections at the mid
length are fully in compression, indicating that the moment was not large enough to induce tensile
stress in the strut. In other words, the strut remained in compression up to 1400 tons of applied
load. Slight yielding was observed at the top flange fibres at 1400 tons of applied load.
Significant yielding is expected beyond 1400 tons and up to failure load of 1438 tons since large
displacement occurred suddenly and cross section distortion occurred as shown in Figs. 17 and 18.
7.5 Force distribution in the ties and lacing members
The horizontal ties (channel members) experienced very small axial force of about 5 tons at the
applied load of 1400 tons as shown in Figure 14. Larger axial force was observed at the top
channel member near the supported end of the strut than those at the splice joints.
Figure 15 shows the axial force distribution in the lacing members along the half length of the laced
strut. Again the axial forces in the lacing members are very small. When the applied load is 700
tons (service load), the maximum lacing force is 4.4 tons which is about 0.63% the applied strut load.
When the applied load is 1400 tons, the maximum lacing force is about 7.5 tons, which is about 0.54
% the applied strut load.
The axial forces in the ties and lacing members are considered to be small as compared to the
requirement in BS5950:Part1:2000 of 2.5% of the axial force in the member, divided amongst the
transverse lacing systems in parallel planes. Detailed comparison with code’s requirement is
discussed in Section 8.
7.6 Test Observations and failure modes
Figures 16 to 18 show the deformed modes of the laced strut after collapse. The maximum load
capacity of the laced strut is 1438 tons. The failure is due to the buckling of the two main struts
buckled about their major axis (x-x direction). The large deflection caused yielding and distortion
of the universal beam section nears the mid-length of the strut as shown in Figures 16-18. All the

7/27/2019 Strutting (Preloading test).pdf
http://slidepdf.com/reader/full/strutting-preloading-testpdf 12/49
11
bolted connections (in the splice joints, the ties and the laces) remained intact without any sign of
failure. The lacing members and their connections were adequate and effective in preventing
lateral buckling of the struts (i.e, y-y axis direction).
8 Comparison with Codes’ Design Capacity
The design of axially loaded laced struts, compared against that of conventional axially loaded struts
with web plates, should includes strength, stiffness and overall stability verifications, and
furthermore, the verification of local stability of single component should also be carried out and the
design check for all bracings (lacings) is necessary. The design of laced strut is provided in
BS5950:Part1:2000 Clause 4.7.8 [Ref. 1] and in Eurocode 3-1-1:2005 Clause 6.4 for built up
compression member [Ref. 2]. The capacity of the laced strut is controlled by (1) global bucklingof the two main struts about the major axis bending (X-X global), (2) global buckling about the y-y
axis of the compound strut (Y-Y global), and (3) local overall buckling of I-beam between the two
laced points, and (4) buckling of lacing or failure of connection. The comparison of axial capacity
based on codes’ predicted values and test result are shown in Table 4. Detailed calculations of
buckling capacity of laced strut using BS5950:Part1:2000 and EC3 (2005) are given in Appendix C.
The maximum load predicted by EC3-1-1:2005 is 984 tons, 1147 tons and 1314 tons assuming
effective length of 1.0L, 0.85L and 0.7L, respectively. The capacity is controlled by global
buckling about the X-X axis. This is consistent with the predicted failure mode and the predicted
buckling capacity is conservative compared to the test failure load of 1438 tons.
The maximum load predicted by BS5950:Part1:2000 is 995 tons, 1168 tons and 1320 tons assuming
effective length of 1.0L, 0.85L and 0.7L, respectively. If a shear force of 2.5% axial load is
assumed, the capacity of the strut is limited by the buckling capacity of lacing member which gives a
value of 1131 tons. However, failure of lacing member was not observed in the test before
buckling of the main struts. The BS5950:Part1:2000 approach is conservative as compared to the
actual failure load of the strutting system.
Clause 4.7.8 (i) of BS5950 Part 1:2000 states that “The lacings and their connections should be
designed to carry the forces induced by a transverse shear at any point in the length of the member
equal to 2.5% of the axial force in the member, divided equally amongst all the transverse lacing
systems in parallel planes”. At the applied load of 1400 tons, 2.5% of this load would indicate 18
tons of shear force. However, the measured maximum axial forces in the channel and angle section

7/27/2019 Strutting (Preloading test).pdf
http://slidepdf.com/reader/full/strutting-preloading-testpdf 13/49
12
are only 5 and 7.5 tons, respectively. Therefore BS5950 recommendation is found to be too
conservative when compared to the measured forces in the lacing members in the test.
Eurocode 3-1-1:2005, on the other hand, provides a more reasonable interpretation of the transverse
shear force acting on the lacing members. The shear force is depending on the maximum bending
moment (i.e, axial force and lateral deflection) at the mid-length and the length of the strut.
Appendix C.3 provides the derivation of the design shear force formula in Eurocode 3-1-1:2005
based on second-order analysis of built-up compression. The predicted test result is compared with
those obtained from tests in Figure 19. EC3:2005 approach predicts a maximum axial force in the
lacing member as 8.5 tons compared to the test result of 7.5 tons. The comparison is found to be
reasonable.
In summary, the strut capacity predicted by EC3-1-1 and BS5950:Part1 are conservative compared
to the test result because:
(1) Boundary conditions may be partial restrained against rotation rather than pin-ended as
assumed in the design calculation. However, it should be noted that the bolts connecting to
the column base to the concrete pad offered very little resistance against overturning
moment. It is therefore reasonable to assume pin-ended boundary condition.
(2) The actual measured yield strength of grade S355 steel strut section is about 400 MPa which
is greater than the nominal yield strength of 345MPa in BS5950 (16mm<t<40mm) and355MPa in EC3 (t<40mm);
(3) The lacing members are assumed to resist the total shear force in design (bending about Y-Y
axis). Actually, part of shear force was resisted by the I-beam sections. Therefore, the lacing
force is much smaller than that predicted by the codes. The actual lateral deflection of the
strut was very small and therefore the induced second-order moment and the corresponding
shear forces are smaller than those predicted by the codes.
9 Conclusions
The following conclusions may be derived from the full-scale testing of the laced strut system:
1) The predicted failure load of the strut based on BS5950:Part1:2000 is 995 tons. Based on
the design safety factor of 1.4, the working load is 710 tons. The actual collapse load of the
test specimen is 1438 tons. The factor of safety against the design working load is about
2.0. The load capacity predicted by the codes is found to be on the conservative side.
2) The ultimate load was not affected by the age of the strutting modules. Coupon tests show
that old and reused struts do not diminish in strength over the years (it means old struts can

7/27/2019 Strutting (Preloading test).pdf
http://slidepdf.com/reader/full/strutting-preloading-testpdf 14/49
13
continue to be reused, if their thicknesses are not eroded due to sand blasting and
re-painting).
3) All the connections were robust and adequate as the failure was due to the overall buckling
of the main strut about the major axis (X-X axis) with plastic hinge formed at the mid-length
of the members. The load-carrying capacity and the load-displacement relationship of the
modular strutting system was not affected by the splice joint details.
4) Maximum axial force in the lacing members was approximately 0.54% of the applied strut
load. The shear force of 2.5% of axial force assumed in BS5950:Part1:2000 is too high.
Eurocode 3 provides a better estimation of the shear forces for designing the lacing members.
The laced members and their connections to the main struts were found to be adequate.
Failure was due to the buckling of the main struts and was not governed by the buckling of
the lacing member.
References
1. BS5950:Part 1 (2000), Structural use of steelwork in building, Part1: Code of practice for
design – rolled and welded sections, British Standards Institute.
2. Eurocode 3 Part 1-1 (2005), Design of steel structures: Part 1-1 General rules and rules for
building, British Standards Institute.

7/27/2019 Strutting (Preloading test).pdf
http://slidepdf.com/reader/full/strutting-preloading-testpdf 15/49
14
Table 1: Loading intervals and observations
Total Applied Loads (ton) Observations
100
200
300
400
500 Maximum loading for preloading cycles600
700 Design load of struts (750ton), no major deformation
noted
800
900
1000
1050
1100 Visible deflection at mid-span
1150
1200
1250 Adjustment of hydraulic actuators, unitisation of actuatorstroke
1300 observed reduction in strains and displacements
1350
1400
1438 Sudden buckling and collapse of strut, end of test
Table 2: Initial out-of-straightness deflection (downwards deflection) of struts before loading
Distance from the front end 3.8 m 9.8 m 15.8 m
Top flange deflection2 mm 9 mm 21 mm
Bottom flange deflection4 mm 8 mm 16 mm
Average deflection3 mm 8.5 mm 19 mm

7/27/2019 Strutting (Preloading test).pdf
http://slidepdf.com/reader/full/strutting-preloading-testpdf 16/49
15
Table 3: Locations, alignment and direction of sensors Measuring Element Location Position Direction Ref in
Fig.
Ref in
Data file
Axial Front Waler Right of strut Centre line of load pts Outwards, +ve=Comp strut D1 0
// Left of strut Centre line of load pts Outwards, +ve=Comp strut D2 1
Rear Waler Right of strut Centre line of load pts Outwards, +ve=Comp strut D3 2
// Left of strut Centre line of load pts Outwards, +ve=Comp strut D4 3
Vertical Strut Right Joint nearerFront
Top channel of side strut Downward, +ve=Defl down D5 4
Strut Left // Top channel of side strut Downward, +ve=Defl down D6 5
Strut Right Mid-span Top flange of main strut Downward, +ve=Defl down D7 6
Strut Left // Top flange of main strut Downward, +ve=Defl down D8 7
Strut Right Joint nearerRear
Top channel of side strut Downward, +ve=Defl down D9 8
Strut Left // Top channel of side strut Downward, +ve=Defl down D10 9
Lateral Strut Right Mid-span Top Flange, 100mm ext Towards left, +ve=Sway left D11 10
// // Bottom Flange, 100mm ext Towards left, +ve=Sway left D12 11
Strut Left Mid-span Top Flange, 100mm ext Towards right, +ve=Sway right D13 12
// // Bottom Flange, 100mm ext Towards right, +ve=Sway right D14 13
Strain Strut Right Mid-span Top Flange, top surface Middle of right outstand S1-1 14// // Top Flange, top surface Middle of left outstand S1-2 15
// // Bottom Flange, bottom surface Middle of right outstand S2-1 16
// // Bottom Flange, bottom surface Middle of left outstand S2-2 17
Strut Left Mid-span Top Flange, top surface Middle of right outstand S3-1 18
// // Top Flange, top surface Middle of left outstand S3-2 19
// // Bottom Flange, bottom surface Middle of right outstand S4-1 20
// // Bottom Flange, bottom surface Middle of left outstand S4-2 21
Strain Channel #1 Mid section Flange nearer front Top channel C1-1 22
// // Middle of web // C1-2 23
// // Flange nearer rear // C1-3 24
Channel #2 Mid section Flange nearer front Bottom channel C2-1 25// // Middle of web // C2-2 26
// // Flange nearer rear // C2-3 27
Channel #3 Mid section Flange nearer front Top channel C3-1 28
// // Middle of web // C3-2 29
// // Flange nearer rear // C3-3 30
Channel #4 Mid section Flange nearer front Bottom channel C4-1 31
// // Middle of web // C4-2 32
// // Flange nearer rear // C4-3 33
Channel #5 Mid section Flange nearer front Top channel C5-1 34
// // Middle of web // C5-2 35
// // Flange nearer rear // C5-3 36
Channel #6 Mid section Flange nearer front Bottom channel C6-1 37
// // Middle of web // C6-2 38
// // Flange nearer rear // C6-3 39

7/27/2019 Strutting (Preloading test).pdf
http://slidepdf.com/reader/full/strutting-preloading-testpdf 17/49
16
Table 3 (continue): Locations, alignment and direction of sensors
Measuring Element Location Position Direction Ref in
Fig.
Ref in
Data file
Strain Lacing #1 Bolted flange 12mm from edge Top lacing L1-1 40
// // 12mm from other flange // L1-2 41
// Vertical flange 12mm from other flange // L1-3 42
// // 12mm from edge // L1-4 43
Lacing #2 Bolted flange 12mm from edge Bottom lacing L2-1 44
// // 12mm from other flange // L2-2 45
// Vertical flange 12mm from other flange // L2-3 46
// // 12mm from edge // L2-4 47
Lacing #3 Bolted flange 12mm from edge Top lacing L3-1 48
// // 12mm from other flange // L3-2 49
Strain Lacing #3 Vertical flange 12mm from other flange Top lacing L3-3 50
// // 12mm from edge // L3-4 51
Lacing #4 Bolted flange 12mm from edge Bottom lacing L4-1 52
// // 12mm from other flange // L4-2 53
// Vertical flange 12mm from other flange // L4-3 54
// // 12mm from edge // L4-4 55Lacing #5 Bolted flange Middle of flange Top lacing L5-1 56
// Vertical flange // // L5-2 57
Lacing #6 Bolted flange Middle of flange Bottom lacing L6-1 58
// Vertical flange // // L6-2 59
Lacing #7 Bolted flange Middle of flange Top lacing L7-1 60
// Vertical flange // // L7-2 61
Lacing #8 Bolted flange Middle of flange Bottom lacing L8-1 62
// Vertical flange // // L8-2 63
Lacing #9 Bolted flange Middle of flange Top lacing L9-1 64
// Vertical flange // // L9-2 65
Lacing #10 Bolted flange Middle of flange Bottom lacing L10-1 66
// Vertical flange // // L10-2 67
Lacing #11 Bolted flange Middle of flange Top lacing L11-1 68
// Vertical flange // // L11-2 69
Lacing #12 Bolted flange Middle of flange Bottom lacing L12-1 70
// Vertical flange // // L12-2 71
Lacing #13 Bolted flange Middle of flange Top lacing L13-1 72
// Vertical flange // // L13-2 73
Lacing #14 Bolted flange Middle of flange Bottom lacing L14-1 74
// Vertical flange // // L14-2 75
Lacing #15 Bolted flange Middle of flange Top lacing L15-1 76
// Vertical flange // // L15-2 77
Lacing #16 Bolted flange Middle of flange Bottom lacing L16-1 78// Vertical flange // // L16-2 79
Sign convention:
Displacement transducers (D1 to D14) + is extension, -ve is retraction
Strain Gauges (S1 to S4, C1 to C6, L1 to L16) +ve is tension, -ve is compression
Note:
Strain gauges on channels and lacing installed on inner surface, as shown in figure

7/27/2019 Strutting (Preloading test).pdf
http://slidepdf.com/reader/full/strutting-preloading-testpdf 18/49
17
Table 4: Axial load capacity of laced strut -comparison of predicted results with test result
A f y L I Max. Load (tons)Failure
mode (mm2) (MPa) (mm) (mm
4) EC3 BS 5950 Test
X-X Global 49800 S355 19600 3.346E+09984 / 1147 /
1314 *
995 / 1168 /
1320 *Laced
StrutsY-Y Global 49800 S355 19600 1.245E+10
1506 /1582/1656*
1498 /1569/1685*
I-beam y-y Local 24900 S355 2000 1.416E+08 1533** 1726**
x-x/y-y 1230 S355 1414.2 7.24E+05
u-u 1230 S355 1414.2 1.15E+06Lacing
v-v 1230 S355 1414.2 3.00E+05
2467 1131
1438
Notes: * Different values with different effective lengths assumed LEX=1.0L/0.85L/ 0.70L;
** Value obtained based on effective length LEY =1.0L.

7/27/2019 Strutting (Preloading test).pdf
http://slidepdf.com/reader/full/strutting-preloading-testpdf 19/49
Figure 1: Test and instrument layout
19.6m total length consisting of 3.8m + 12m + 3.8m segments
6 m 3.8

7/27/2019 Strutting (Preloading test).pdf
http://slidepdf.com/reader/full/strutting-preloading-testpdf 20/49
19
Figure 2 Load application using hydraulic jacks and high-strength strands

7/27/2019 Strutting (Preloading test).pdf
http://slidepdf.com/reader/full/strutting-preloading-testpdf 21/49
20
Figure 3: Strut with the loading strands in position

7/27/2019 Strutting (Preloading test).pdf
http://slidepdf.com/reader/full/strutting-preloading-testpdf 22/49
21
Figure 4 Base support allowing horizontal movement
7/27/2019 Strutting (Preloading test).pdf
http://slidepdf.com/reader/full/strutting-preloading-testpdf 23/49
22
Figure 5 Base support preventing lateral translations.
Figure 6: Transducer D3 measuring axial displacement at the real end of the strut.

7/27/2019 Strutting (Preloading test).pdf
http://slidepdf.com/reader/full/strutting-preloading-testpdf 24/49
23
Figure 7: Vertical displacement transducers D5 and D6 at the splice joint of strut.

7/27/2019 Strutting (Preloading test).pdf
http://slidepdf.com/reader/full/strutting-preloading-testpdf 25/49
Figure 8: Details of coupon specimens and extracted location

7/27/2019 Strutting (Preloading test).pdf
http://slidepdf.com/reader/full/strutting-preloading-testpdf 26/49
25
Axial displacement at
0
200
400
600
800
1000
1200
1400
1600
0 5 10 15 20 25 30 35 40 45 50
Axial Displacement (mm)
T o t a l A p p l i e d A x i a l L o a d ( t o n s )
Right Strut
Left Strut
Figure 9: Applied load versus axial displacements

7/27/2019 Strutting (Preloading test).pdf
http://slidepdf.com/reader/full/strutting-preloading-testpdf 27/49
26
Vertical deflection at
0
200
400
600
800
1000
1200
1400
1600
0 10 20 30 40 50 60 70 80 90 100
Vertical Deflection (mm)
T o t a l A p p l i e d A x i a l L o a d ( t o n s )
1st splice joint from front end
mid-length
1st splice joint from rear end
Figure 10: Applied load versus vertical deflection

7/27/2019 Strutting (Preloading test).pdf
http://slidepdf.com/reader/full/strutting-preloading-testpdf 28/49
27
Total applied axial load
0
10
20
30
40
50
60
70
80
90
100
0 1 2 3 4 5 6 7 8 9 10 11 12 13 14 15 16 17 18 19 20
Distance from Front to Rear (m)
V
e r t i c a l D e f l e c t i o n ( m m )
700 tons
1000 tons
1200 tons
1400 tons
Figure 11: Vertical deflection profile of the strut
Lateral deflection at
0
200
400
600
800
1000
1200
1400
1600
0 1 2 3 4 5 6 7 8 9 10
Lateral Displacement (mm)
T o t a l A p p l i e d A
x i a l L o a d ( t o n s )
Top flange Right strut
Bottom flange Right strut
Top flange Left strut
Bottom flange Left strut
Figure12: Load versus lateral displacement at mid-length

7/27/2019 Strutting (Preloading test).pdf
http://slidepdf.com/reader/full/strutting-preloading-testpdf 29/49
28
Stresses measured at
0
200
400
600
800
1000
1200
1400
1600
0 50 100 150 200 250 300 350 400
Stress at mid-length section of Struts (N/mm2)
T o t a l A p p l i e d A x i a l L o a d ( t o n s )
Top flange Right strut
Bottom flange Right strutTop flange Left strut
Bottom flange Left strut
+ve indicating compressive stresses
Figure 13: Stresses on top and bottom flanges of the strut sections at mid-length
Forces measured at
0
200
400
600
800
1000
1200
1400
1600
-16 -14 -12 -10 -8 -6 -4 -2 0 2 4 6 8 10 12 14 16
Axial Force on Channels (ton)
T o t a l A p p l i e d A
x i a l L o a d ( t o n )
Channel #1
Channel #2
Channel #3
Channel #4
Channel #5
Channel #6
+ve indicating compressive forces
Figure 14: Axial forces in the Channel Sections

7/27/2019 Strutting (Preloading test).pdf
http://slidepdf.com/reader/full/strutting-preloading-testpdf 30/49
29
Forces measured at
0
200
400
600
800
1000
1200
1400
1600
-16 -14 -12 -10 -8 -6 -4 -2 0 2 4 6 8 10 12 14 16
Axial Force on Lacings (ton)
T o t a l A p p l i e d A x i a l L o a d ( t o n )
Lacing #1
Lacing #2
Lacing #3Lacing #4
Lacing #5
Lacing #6
Lacing #7
Lacing #8
Lacing #9
Lacing #10
Lacing #11
Lacing #12
Lacing #13Lacing #14
Lacing #15
Lacing #16
+ve indicating compressive forces
Figure 15: Applied load versus axial forces in the lacing members

7/27/2019 Strutting (Preloading test).pdf
http://slidepdf.com/reader/full/strutting-preloading-testpdf 31/49
30
Figure 16: Buckling of the main struts and lacing members after collapse

7/27/2019 Strutting (Preloading test).pdf
http://slidepdf.com/reader/full/strutting-preloading-testpdf 32/49
31
Figure 17: Buckling of the mid-length strut section

7/27/2019 Strutting (Preloading test).pdf
http://slidepdf.com/reader/full/strutting-preloading-testpdf 33/49
32
Figure 18: Another view showing the bucking of the laced strut

7/27/2019 Strutting (Preloading test).pdf
http://slidepdf.com/reader/full/strutting-preloading-testpdf 34/49
33
0
200
400
600
800
1000
1200
1400
1600
-6 -4 -2 0 2 4 6 8 10
Predicted by EC3
Lacing #1
Lacing #2
Lacing #3
Lacing #4
Lacing #5
Lacing #6
Lacing #7
Lacing #8
Lacing #9
Lacing #10
Lacing #11
Lacing #12
Lacing #13
Lacing #14
Lacing #15
Lacing #16
Figure 19 Applied force versus lacing forces – comparison with EC3 approach

7/27/2019 Strutting (Preloading test).pdf
http://slidepdf.com/reader/full/strutting-preloading-testpdf 35/49
34
Appendix A: Certificate of Calibration for Digital Pressure Gauge

7/27/2019 Strutting (Preloading test).pdf
http://slidepdf.com/reader/full/strutting-preloading-testpdf 36/49
35
Appendix B Coupon Test Results
Table B.1 Mechanical properties of steel sections from coupon tests
12m strut segment (4 year-old) 3.8m strut segment (6 year-old)Strut Section
UB 610x324x195 kg Flange Web Flange Web
Coupon Sample
Reference 5F1 5F2 5W3 5W4 10F1 10F2 10W3 10W4
Measured Width (mm) 12.60 12.61 12.72 12.67 12.55 12.72 12.57 12.65Measured Thickness
(mm) 23.32 23.24 14.69 14.68 23.06 22.93 15.11 14.78
Cross-sectional Area
(mm2) 293.83 293.06 186.86 186.00 289.40 291.67 189.93 186.97
Yield Load (kN) 116.5 132.6 76.7 76.5 115.7 113.5 78.3 79.6
Yield Strength (N/mm2) 397 453 411 411 400 389 412 426
Maximum Load (kN) 168.8 164.1 108.1 107.2 146.9 144.2 98.4 97.0
Max. Tensile Strength
(N/mm2) 575 560 579 576 508 494 518 519
Elastic Modulus
(kN/mm2) 209.0 211.5 199.8 197.0 214.6 202.9 199.1 202.0
Lacing
Angle 80x80x8
Coupon Sample
Reference 5L1 5L2 10L1 10L2
Measured Width (mm) 12.79 12.50 13.03 12.63
Measured Thickness
(mm) 9.60 9.53 8.20 7.70
Cross-sectional Area
(mm2) 122.78 119.13 106.85 97.25
Yield Load (kN) 38.4 37.2 36.4 37.8
Yield Strength (N/mm2) 313 312 341 389Maximum Load (kN) 55.1 54.7 55.1 57.0
Max. Tensile Strength
(N/mm2) 449 459 516 586
Elastic Modulus
(kN/mm2) 190.7 193.3 168.0** 182.7
Channels 254x76x28.29 kg/m 250x90x25.5kg/m
Coupon Sample
Reference 5C 10C
Measured Width (mm) 12.66 12.68
Measured Thickness(mm) 8.91 6.68
Cross-sectional Area
(mm2) 112.80 84.70
Yield Load (kN) 38.5 30.4
Yield Stress (N/mm2) 341 358
Maximum Load (kN) 56.4 42.3
Tensile Strength
(N/mm2) 500 499
Elastic Modulus
(kN/mm2) 201.4 195.3
Note: ** Low value, this result is ignored
Table B.2 Section Dimensions of Lacing members and Channels
D (mm) B (mm) t (mm) T (mm) Area
(cm2)

7/27/2019 Strutting (Preloading test).pdf
http://slidepdf.com/reader/full/strutting-preloading-testpdf 37/49
36
Lacing members
Measured dimensions 81.0 81.0 8.1 8.1 12.50
From section table -
80x80x9.66kg/m
80.0 80.0 8.0 8.0 12.30
Channels
Measured dimensions for
channel at 3.8m strutsegment
262.0 76.5 7.9 13.1 38.78
From section table
254x76x28.29kg/m
254.0 76.2 8.1 10.9 36.03
Measured dimensions for
channel at 12m strut
segment
251.0 90.2 8.9 14.3 45.67
From section table -
250x90x25.5kg/m
250.0 90.0 8.0 15.0 45.20

7/27/2019 Strutting (Preloading test).pdf
http://slidepdf.com/reader/full/strutting-preloading-testpdf 38/49
37
Appendix C: Design Approaches for Calculating Buckling Resistance of Build-up
members
C.1 BS5950:Part1:2000 Approach
The cross-section UB610×
324×
195 (
9 4 8 4
1.673 10 , 1.416 10 , x yi mm i mm= × = ×
259 , 75.5 x yr mm r mm= =
,
2249ch
A cm= ) is used for chords and section L80×80×8 (5 47.24 10
x yi i mm= = × , 24.3 x yr r mm= = ,
6 4 5 41.15 10 , 3.0 10u vi mm i mm= × = × , 30.6 , 15.6
u vr mm r mm= = ,212.3
d A cm= ) for lacing members;
2. 0 1000 , 2000 , 1000 2h mm a mm d mm= = = ;
d
h
a
0
Ach
Ad
1000
x
L80×80×8
U B 6 1 0 × 3 2 4 × 1 9 5
y
NEd NEd
L=19600mm
Fig. C1 Dimension of laced strut
3. Structural steel grade: S355;
4. Calculation of the overall buckling resistance based on BS 5950-1:2000:(1) Check overall buckling resistance of struts about X-X axis
a) LE=1.0L
/ / 19600 / 259 76 X E X x L R L r λ = = = = (1)
2196( / ) ( , )c p N mm rolled I section buckling curve c= − (2)
, ,
9760.824900 2 196 9760.8( ) ( ) 995( )
9.81b Rd X N kN ton ton= × × = = = (3)
b) LE=0.85L
/ 0.85 / 0.85 19600 / 259 64 X E X x L R L r λ = = = × = (4)
2230( / ) ( , )c p N mm rolled I section buckling curve c= − (5)
NEd /2 NEd /2

7/27/2019 Strutting (Preloading test).pdf
http://slidepdf.com/reader/full/strutting-preloading-testpdf 39/49
38
, ,
1145424900 2 230 11454( ) ( ) 1168( )
9.81b Rd X N kN ton ton= × × = = = (6)
c) LE=0.70L
/ 0.70 / 0.70 19600 / 259 53 X E X x L R L r λ = = = × = (7)
2260( / ) ( , )c p N mm rolled I section buckling curve c= − (8)
, ,
1294824900 2 260 12948( ) ( ) 1320( )
9.81b Rd X N kN ton ton= × × = = = (9)
(2) Check buckling resistance about Y-Y axis
i) Global (check struts member )
a) 1.0 19600 E L L mm= =
2 8 2 10 40 10002 2 ( ) 2 1.416 10 2 24900 ( ) 1.273 10 ( )2 2
Y y ch h I i A mm= + = × × + × × = × (10)
/ 2 505( )Y Y ch R I A mm= = (11)
/ 19600 / 505 39Y E Y L Rλ = = = (12)
2295( / ) ( , )c p N mm rolled I section buckling curve c= − (13)
, , ( )24900 2 295 14691( ) 1498( )
b Rd Y global N kN ton= × × = = (14)
b) 0.85 E L L=
2 8 2 10 40 10002 2 ( ) 2 1.416 10 2 24900 ( ) 1.273 10 ( )
2 2Y y ch
h I i A mm= + = × × + × × = × (15)
/ 2 505( )Y Y ch R I A mm= = (16)
/ 0.85 19600 / 505 33Y E Y L Rλ = = × = (17)
2309( / ) ( , )c p N mm rolled I section buckling curve c= − (18)
, , ( ) 24900 2 309 15388( ) 1569( )b Rd Y global N kN ton= × × = = (19)
c) 0.70 E L L=
2 8 2 10 401000
2 2 ( ) 2 1.416 10 2 24900 ( ) 1.273 10 ( )2 2
Y y ch
h I i A mm= + = × × + × × = × (20)
/ 2 505( )Y Y ch R I A mm= = (21)
/ 0.70 19600 / 505 27Y E Y L Rλ = = × = (22)
2332( / ) ( , )c p N mm rolled I section buckling curve c= − (23)
, , ( )24900 2 332 16534( ) 1685( )
b Rd Y global N kN ton= × × = = (24)

7/27/2019 Strutting (Preloading test).pdf
http://slidepdf.com/reader/full/strutting-preloading-testpdf 40/49
39
ii) Local ( 2000 ,ch L mm check single chord = ):
/ 2000 / 75.5 26.5ch y
L r λ = = = (25)
2340( / ) ( , )c p N mm rolled I section buckling curve b= − (26)
, , 24900 340 8466( ) 863( )b Rd ch N kN ton= × = = (27)
, ,2 1692( ) 1726( )
Ed b Rd ch N N kN ton≤ = = (28)
(3) Check lacing member
/ 58 x y x
d r λ λ = = = , / 46u ud r λ = = , / 91
v vd r λ = = (29)
2
, ,
2,
2
,
252 /
286 / ( , )
160 /
c x c y
c u
c v
p p N mm
p N mm rolled angle buckling curve c
p N mm
⎧ = =⎪
=⎨⎪ =⎩
(30)
, , ( ) , , ( ) ,
, , ( ) ,
, , ( ) ,
310( ) 32( )
352( ) 36( )
197( ) 20( )
b Rd x lacing b Rd y lacing c x d
b Rd u lacing c u d
b Rd v lacing c v d
N N p A kN ton
N p A kN ton
N p A kN ton
⎧ = = = =⎪
= = =⎨⎪ = = =⎩
(31)
, , ( )2 / 21131( )
2.5% 2.5%
b Rd v lacing Ed Ed
N V N ton
×= ≤ = (32)

7/27/2019 Strutting (Preloading test).pdf
http://slidepdf.com/reader/full/strutting-preloading-testpdf 41/49
40
C.2 BS EN1993-1-1:2005 Approach
5. Calculation of the overall buckling resistance based on BS EN1993-1-1:2005:
(1) Check overall buckling resistance of struts about X-X axis
a) 1.0 19600 E L L mm= =
The plastic resistance of the cross-section to compression:
, 24900 355 2 17679( ) pl Rk y N Af kN = = × × = (33)
The Euler buckling load:
2 2 5 9
, 2 2
2.1 10 2 1.673 1018052( )
19600cr X
E
EI N kN
L
π π × × × × ×= = = (34)
The relative slenderness:
, ,/ 0.990 X pl Rk cr X N N λ = = (35)
The slenderness reduction factor:
20.5[1 ( 0.2) ] 1.183 ( ) X X X buckling curve cϕ α λ λ = + − + = (36)
22
10.5460 X
X X X
χ
ϕ ϕ λ
= =+ −
(37)
The overall buckling resistance of the struts about X-X axis:
, , ,
96539653( ) ( ) 984( )
9.81b Rd X X pl Rd N N kN ton ton χ = = = = (38)
b) 0.85 E L L=
2 2 5 9
, 2 2
2.1 10 2 1.673 1024986( )
(0.85 19600)cr X
E
EI N kN
L
π π × × × × ×= = =
× (39)
, ,/ 0.841 X pl Rk cr X N N λ = = (40)
2
0.5[1 ( 0.2) ] 1.011 ( ) X X X buckling curve cϕ α λ λ = + − + = (41)
22
10.6363 X
X X X
χ
ϕ ϕ λ
= =
+ −
(42)
, , , 11250( ) 1147( )b Rd X X pl Rd
N N kN ton χ = = = (43)
c) 0.70 E L L=
2 2 5 9
, 2 2
2.1 10 2 1.673 1036841( )
(0.7 19600)cr X
E
EI N kN
L
π π × × × × ×= = =
× (44)
, ,/ 0.693 X pl Rk cr X N N λ = = (45)
2
0.5[1 ( 0.2) ] 0.861 ( ) X X X buckling curve cϕ α λ λ = + − + = (46)

7/27/2019 Strutting (Preloading test).pdf
http://slidepdf.com/reader/full/strutting-preloading-testpdf 42/49
41
22
10.7292 X
X X X
χ
ϕ ϕ λ
= =+ −
(47)
, , , 12891( ) 1314( )b Rd X X pl Rd
N N kN ton χ = = = (48)
(2)
Check buckling resistance about Y-Y axisi) Global
a) 1.0 19600 E
L L mm= =
The Euler buckling load:
2 2 10 4
00.5 0.5 1000 24900 1.245 10 ( )eff ch I h A mm= = × × = × (49)
(Note: EC3 uses above conservative formula; more accurate formula should be
2 2 8 10 4
00.5 2 0.5 1000 24900 2 1.416 10 1.273 10 ( )
eff ch y I h A i mm= + = × × + × × = × )
2 2 5 10
, 2 22.1 10 1.245 10 67170( )
19600
eff
cr Y
E
EI N kN L
π π × × × ×= = = (50)
The relative slenderness:
, ,/ 0.513Y pl Rk cr Y N N λ = = (51)
The slenderness reduction factor:
2
0.5[1 ( 0.2) ] 0.708 ( )Y Y Y buckling curve cϕ α λ λ = + − + = (52)
22
10.8357
Y
Y Y Y
χ
ϕ ϕ λ
= =
+ −
(53)
The overall buckling resistance of the struts:
, , ( ) , 14774 1506( )b Rd Y global Y pl Rd
N N kN ton χ = = = (54)
b) 0.85 E L L=
2 2 5 10
, 2 2
2.1 10 1.245 1092969( )
(0.85 19600)
eff
cr Y
E
EI N kN
L
π π × × × ×= = =
× (55)
, ,/ 0.436Y pl Rk cr Y N N λ = = (56)
2
0.5[1 ( 0.2) ] 0.653 ( )Y Y Y buckling curve cϕ α λ λ = + − + = (57)
22
10.8781Y
Y Y Y
χ
ϕ ϕ λ
= =+ −
(58)
, , ( ) ,15523 1582( )
b Rd Y global Y pl Rd N N kN ton χ = = = (59)
c) 0.70 E L L=

7/27/2019 Strutting (Preloading test).pdf
http://slidepdf.com/reader/full/strutting-preloading-testpdf 43/49
42
2 2 5 10
, 2 2
2.1 10 1.245 10137082( )
(0.70 19600)
eff
cr Y
E
EI N kN
L
π π × × × ×= = =
× (60)
, ,/ 0.359Y pl Rk cr Y N N λ = = (61)
2
0.5[1 ( 0.2) ] 0.603 ( )Y Y Y buckling curve cϕ α λ λ = + − + = (62)
22
10.9187
Y
Y Y Y
χ
ϕ ϕ λ
= =+ −
(63)
, , ( ) ,16242 1656( )
b Rd Y global Y pl Rd N N kN ton χ = = = (64)
ii) Local ( 2000 ,ch L mm check single chord = ):
The plastic resistance of the cross-section to compression:
, ,24900 355 8839500 8839.5
pl Rk ch ch y N A f N kN = = × = = (65)
The Euler buckling load:
2 2 5 8
, 2 2
2.1 10 1.416 1073371( )
2000cr ch
ch
EI N kN
L
π π × × × ×= = = (66)
The relative slenderness:
, ,
,
0.347 pl Rk ch
ch
cr ch
N
N λ = = (67)
The slenderness reduction factor:
2
0.5[1 ( 0.2) ] 0.585 ( )ch chch buckling curve bϕ α λ λ = + − + = (68)
22
10.9466ch
chch ch
χ
ϕ ϕ λ
= =+ −
(69)
The local buckling resistance of single chord:
, , , , 8367 853( )b Rd ch pl Rd ch
N N kN ton χ = = = (70)
The shear stiffness of the lacings:
2 5 2
03 3
2 2.1 10 1230 2000 1000 182646( )2 2 (1000 2)
d v nEA ahS kN
d × × × × ×= = =
× (71)
The design value of the maximum moment in the middle of the struts considering second order effects
( M I Ed =0):
0
,
1
I
Ed Ed Ed
Ed Ed
cr Y v
N e M M
N N
N S
+=
− − (72)
The design force at the mid-height of single chord should fulfill
0, , ,
853( )2 2
Ed Ed chch Ed b Rd ch
eff
N M h A N N ton I
= + ≤ = (73)
Then the design axial force N Ed should fulfill

7/27/2019 Strutting (Preloading test).pdf
http://slidepdf.com/reader/full/strutting-preloading-testpdf 44/49
43
15035( ) 1533( ) Ed N kN ton≤ = (74)
(3) Check lacing member
Similarly, the buckling resistance of lacing member is calculated:
, ( / )
, ( )
, ( )
326( ) 33( )
364( ) 37( )
212( ) 22( )
b Rd x x y y
b Rd u u
b Rd v v
N kN ton
N kN ton
N kN ton
− −
−
−
⎧ = =
⎪ = =⎨⎪ = =⎩
(75)
The design force N Ed should fulfill
, ( )
0
,
2 / 2 300( )
1
Ed b Rd v v
I
Ed Ed Ed Ed
Ed Ed
cr Y v
V N kN
M N e M V
N N L L
N S
π π
−⎧ ≤ =⎪⎪ +⎨ = =⎪ − −⎪⎩
(76)
24200( ) 2467( ) Ed N kN ton≤ = (77)

7/27/2019 Strutting (Preloading test).pdf
http://slidepdf.com/reader/full/strutting-preloading-testpdf 45/49
44
Table C1: Summary on the buckling resistance of laced strut system
A y L I Max. Load N Ed (ton)Failure mode
(mm2) (MPa) (mm) (mm
4) EC3 BS 5950
X-X
Global49800 S355 19600 3.346E+09 984 /1147/1314
* 995 / 1168 / 1320*
LacedStruts Y-Y
Global 49800 S355 19600 1.245E+10 1506 /1582 /1656 1498 / 1569 / 1685
I-beamy-y
Local 24900 S355 2000 1.416E+08 1533**
1726
x-x/y-y 1230 S355 1414.2 7.24E+05
u-u 1230 S355 1414.2 1.15E+06Lacing
v-v 1230 S355 1414.2 3.00E+05
2467**
1131
Notes:* Different values under different effective lengths LE=1.0L, 0.85L or 0.70L;
** Value under effective length LE=1.0L.
If the built-up member is bent about Y-Y plane, the relationship between the shear force V Ed and the design
compression force N Ed to the built-up member is shown in following Fig. C2 by assuming is the initial bow
imperfection e0 as L/500.
e0=L/500
0.005
0.006
0.007
0.008
0.009
0.01
1000 3000 5000 7000 9000 11000 13000 15000
Fig. C2 The relationship between shear force V Ed and compression force N Ed
Design chart for laced struts showing the relationship between the design capacity and the effective length is shown in
Fig. C3. If BS5950:Part1:2000 approach is adopted the design capacity is limited by the buckling capacity of the
lacing member assuming a maximum shear force of 2.5% axial force. The capacity of the lacing member will
govern the design when the strut length id less than 17 m. However, such limitation does not exist if
BSEN1993:EC3:2005 approach is adopted. This is explained in the following sections.
N Ed (kN)
V E d / N E d

7/27/2019 Strutting (Preloading test).pdf
http://slidepdf.com/reader/full/strutting-preloading-testpdf 46/49
45
0
2
4
6
8
10
12
14
16
10 12 14 16 18 20 22 24
EN 1993
BS 5950
Shear resistance control line
Effective length, Lex (m)
Fig. C3 Design chart for laced struts using 2UB610×324×195 Grade S355 section
S t r u t r e s i s t a n c e ( 1 0 3 k
N )

7/27/2019 Strutting (Preloading test).pdf
http://slidepdf.com/reader/full/strutting-preloading-testpdf 47/49
46
C.3 EC 3 approach to evaluate the shear force of the axially loaded laced struts
An axially loaded column, pinned at the two ends, is showed in Fig C42.
Fig. C4 The shear force of axially loaded column
Assuming the deflection curve is
sin x
y vl
π =
(1)
Then the moment is
sin x
M Ny Nvl
π = = (2)
The shear force is
cosdM N v x
V dx l l
π π = = (3)
Therefore, the maximum shear force at the two ends is
max
N vV
l
π = (4)
The maximum moment is (at middle height)
max M Nv= (5)
Thus, Equation (4) can be expressed as
maxmax
M V
lπ = (6)
Equation (6) is the formula adopted in BSEN1993:EC3:2005 The maximum shear force in the laced strut is
depending on the lateral deflection, the applied axial force (i.e, Mmax) and the strut length.

7/27/2019 Strutting (Preloading test).pdf
http://slidepdf.com/reader/full/strutting-preloading-testpdf 48/49
47
C.4 Example
The cross-section UB610×324×195 (9 4 8 41.673 10 , 1.416 10 , x yi mm i mm= × = × 259 , 75.5
x yr mm r mm= = ,
2249ch A cm= ) is used for chords and section L80×80×8 (
5 47.24 10 x yi i mm= = × , 24.3
x yr r mm= = ,
6 4 5 41.15 10 , 3.0 10u vi mm i mm= × = × , 30.6 , 15.6
u vr mm r mm= = ,212.3
d A cm= ) for lacing members;
0 1000 , 2000 , 1000 2h mm a mm d mm= = = ;
d
h
a
0
Ach
Ad
1000
x
L80×80×8
U B 6 1 0 × 3 2 4 × 1 9 5
y
NEd NEd
L=19600mm
Fig. C5 Dimension
Structural steel grade: S355;
Calculation of lacing force according to EC3 (Y-Y axis):
The maximum shear force in struts is
Ed Ed
E
M V
Lπ = (1)
where LE is the effective length and MEd is maximum moment in the middle of the struts considering second order
effects
0
,
1
Ed Ed
Ed Ed
cr Y v
N e M
N N
N S
=
− −
(2)
where Sv is the shear stiffness of the lacings
NEd /2 NEd /2

7/27/2019 Strutting (Preloading test).pdf
http://slidepdf.com/reader/full/strutting-preloading-testpdf 49/49
48
2 5 2
0
3 3
2 2.1 10 1230 2000 1000
2 2 (1000 2)
182646( ) 18618( )
d v
nEA ahS
d
kN tons
× × × × ×= =
×
= =
(3)
and Ncr,Y is the effective critical force about Y-Y axis of the struts
2
, 2 67170( ) 6847( ) ( 1.00 )
eff
cr Y E E
EI
N kN tons L L L
π
= = = = (4)
Therefore, the maximum axial force in one lacing member is
0
,
2 2
2 21
Ed
lacing Ed Ed Ed E
cr Y v
N e N V
N N L
N S
π = =
− −
(5)
Taking e0=LE/500 according to EC3, it obtains
,
2
1000 1
Ed lacing
Ed Ed
cr Y v
N N
N N
N S
π =
− −
(6)
It can be observed that the maximum axial force in the lacing member is depending on the applied axial load, N Ed, the
shear stiffness, Sv, and the elastic critical load of the laced strut bending about the y-y direction, Ncr,y.


![Loss of preloading in DTI assemblies and criteria for using ......EN 14399-6 [4] and EN 14399-9 [2]). In EN 14399-9, the „Suitability test for preloading with direct tension indicator](https://img.dokumen.tips/doc/110x75/6089f8ac0eda7c46f35530f8/loss-of-preloading-in-dti-assemblies-and-criteria-for-using-en-14399-6-4.jpg)