Embed Size (px)
Citation preview

INVESTIGATION OF THE BEHAVIOR OF EXTERNAL
CFRP-TO-INTERNAL REINFORCING BAR SPLICES
by
Patrick Sheridan Keenan
B.S. in Civil and Environmental Engineering, University of Delaware, 2009
Submitted to the Graduate Faculty of
The Swanson School of Engineering in partial fulfillment
of the requirements for the degree of
Master of Science
University of Pittsburgh
2013

ii
UNIVERSITY OF PITTSBURGH
SWANSON SCHOOL OF ENGINEERING
This thesis was presented
by
Patrick Sheridan Keenan
It was defended on
March 22, 2013
and approved by
Qiang Yu, PhD, Assistant Professor, Department of Civil and Environmental Engineering
John Brigham, PhD, Assistant Professor, Department of Civil and
Environmental Engineering
Thesis Advisor:
Kent A. Harries, PhD, Associate Professor, Department of Civil and
Environmental Engineering

iii
Copyright © by Patrick Sheridan Keenan
2013

iv
The reported study investigates the feasibility and behavior of CFRP-to-reinforcing steel splices
in medium-scale reinforced concrete beams. Six reinforced concrete beams were cast. The
dimensions of the beams tested were 8 x 6 x 84 in. (203 x 152 x 2134 mm), reinforced with a
single #4 bar (12.7 mm) as primary flexural reinforcement. Control specimens having a
continuous bar and a conventional 18 in. (457 mm) contact lap splice serve to define the ‘target
capacity’ for the CFRP-to-reinforcing steel splices. For the CFRP-to-reinforcing steel spliced
beams, the reinforcing bar is terminated near midspan. A CFRP strip, designed to have a capacity
equal to or greater than the bar is applied, lapped with the terminated bar and developed to the
unreinforced end of the beam. The beams are tested in flexure under monotonically increasing
loads to failure. Thus, after cracking, the beam capacity is entirely dependent on the force
redistribution between the reinforcing steel in one half of the span and the CFRP strip in the
other. This transfer occurs over the provided splice. Conventional lap splices between steel
reinforcement are designed to provide enough development length to yield the bars. Therefore
yielding of the primary reinforcing steel in the test specimens is an indication that the CFRP-to-
reinforcing steel lap splice has sufficiently reached its design capacity. The test beams that were
designed to have sufficient development lengths displayed the ability to yield the reinforcing
INVESTIGATION OF THE BEHAVIOR OF EXTERNAL
CFRP-TO-INTERNAL REINFORCING BAR SPLICES
Patrick Sheridan Keenan, M.S.
University of Pittsburgh, 2013

v
steel; an indication that CFRP-to-reinforcing steel lap splices are a viable option. The test beams
that were designed to have insufficient development length failed prior to the steel yielding. This
was the anticipated result, since the purpose of these beams was to investigate the behavior and
probable failure modes of under-designed CFRP-to-reinforcing steel splices.
vi
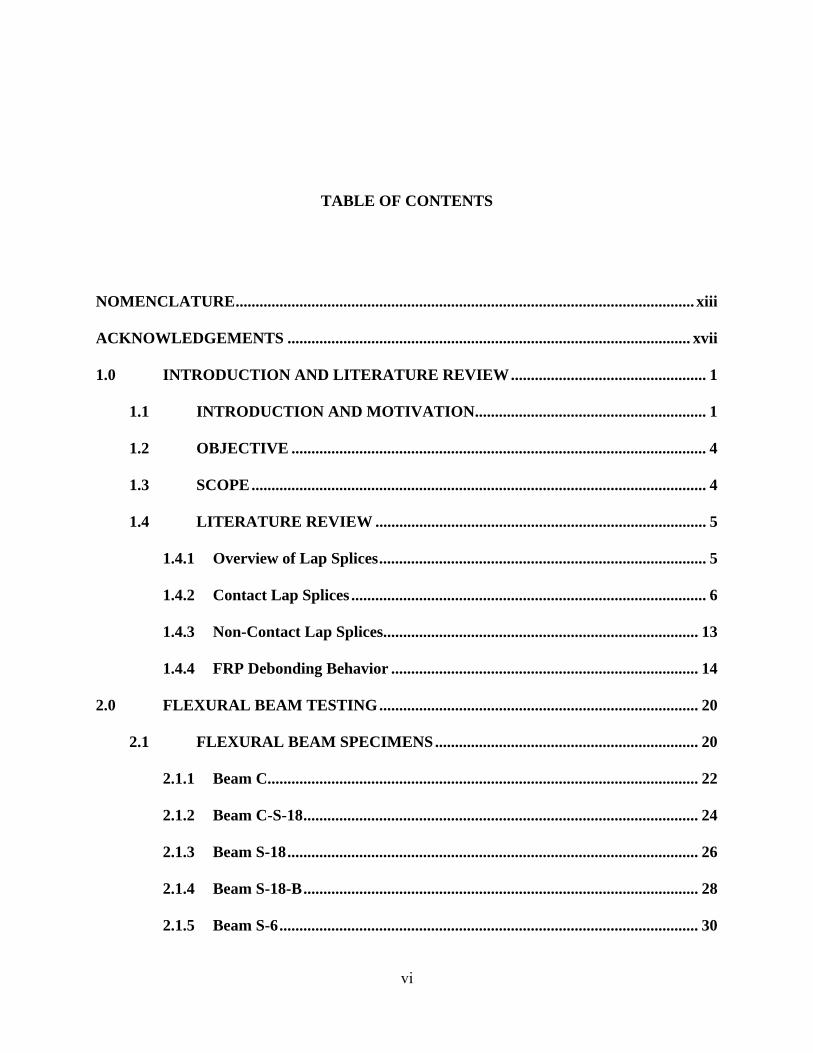
TABLE OF CONTENTS
NOMENCLATURE ................................................................................................................... xiii
ACKNOWLEDGEMENTS ..................................................................................................... xvii
1.0 INTRODUCTION AND LITERATURE REVIEW ................................................. 1
1.1 INTRODUCTION AND MOTIVATION .......................................................... 1
1.2 OBJECTIVE ........................................................................................................ 4
1.3 SCOPE .................................................................................................................. 4
1.4 LITERATURE REVIEW ................................................................................... 5
1.4.1 Overview of Lap Splices .................................................................................. 5
1.4.2 Contact Lap Splices ......................................................................................... 6
1.4.3 Non-Contact Lap Splices............................................................................... 13
1.4.4 FRP Debonding Behavior ............................................................................. 14
2.0 FLEXURAL BEAM TESTING ................................................................................ 20
2.1 FLEXURAL BEAM SPECIMENS .................................................................. 20
2.1.1 Beam C............................................................................................................ 22
2.1.2 Beam C-S-18 ................................................................................................... 24
2.1.3 Beam S-18 ....................................................................................................... 26
2.1.4 Beam S-18-B ................................................................................................... 28
2.1.5 Beam S-6 ......................................................................................................... 30
vii
2.1.6 Beam S-6-B ..................................................................................................... 32
2.2 MATERIAL PROPERTIES ............................................................................. 33
2.2.1 Concrete .......................................................................................................... 33
2.2.2 Reinforcing Steel ............................................................................................ 34
2.2.3 CFRP Strips ................................................................................................... 35
2.2.4 Adhesive .......................................................................................................... 35
2.3 TEST SET-UP .................................................................................................... 36
2.4 TEST RESULTS ................................................................................................ 37
2.4.1 Analytical Predictions ................................................................................... 38
2.4.2 Beam C............................................................................................................ 39
2.4.3 Beam C-S-18 ................................................................................................... 42
2.4.4 Beam S-18 ....................................................................................................... 44
2.4.5 Beam S-18-B ................................................................................................... 46
2.4.6 Beam S-6 ......................................................................................................... 48
2.4.7 Beam S-6-B ..................................................................................................... 50
3.0 INTERPRETATION OF RESULTS ....................................................................... 52
3.1 CONTROL SPECIMEN BEHAVIOR ............................................................ 52
3.2 BEAMS S-18 AND S-18-B ................................................................................ 54
3.3 BEAMS S-6 AND S-6-B .................................................................................... 57
4.0 CONCLUSIONS AND APPLICATIONS ............................................................... 59
4.1 SUMMARY ........................................................................................................ 59
4.2 CONCLUSIONS ................................................................................................ 60
4.3 POTENTIAL APPLICATIONS ....................................................................... 62

viii
APPENDIX A .............................................................................................................................. 66
BIBLIOGRAPHY ....................................................................................................................... 67

ix
LIST OF TABLES
Table 1.1 Current design code provision for development length ............................................... 12
Table 2.1 Experimentally determined concrete material properties ............................................ 34
Table 2.2 Experimentally determined reinforcing bar material properties .................................. 34
Table 2.3 Summary of test results ................................................................................................ 38

x
LIST OF FIGURES
Figure 1.1 FRP anchorage used in West Gate Bridge (adapted from Williams et al., 2011) ........ 3
Figure 1.2 Sequence of West Gate FRP anchorage installation (Williams et al., 2011) ............... 3
Figure 1.3 Stress transfer from anchored bar to surrounding concrete (Orangun et al., 1977) ..... 7
Figure 1.4 Definition of cover spacing in anchored and spliced bars (Orangun et al., 1977) ....... 9
Figure 1.5 Truss analogy for non-contact lap splices (adapted from McLean and Smith, 1997) ............................................................................................................... 14
Figure 1.6 Primary failure modes of FRP-strengthened reinforced concrete beams (Smith and Teng, 2001) ................................................................................................................ 16
Figure 1.7 Stress associated with PE debonding (adapted from Jones et al., 1982) .................... 19
Figure 2.1 Arrangement of forms prior to casting concrete ......................................................... 21
Figure 2.2 Beam C having single continuous reinforcing bar ..................................................... 23
Figure 2.3 Beam C-S-18 having conventional lap splice ............................................................. 25
Figure 2.4 Beam S-18 having non-contact CFRP-rebar splice .................................................... 27
Figure 2.5 Beam S-18-B having contact CFRP-rebar splice ....................................................... 29
Figure 2.6 Beam S-6 having non-contact CFRP-rebar splice ...................................................... 31
Figure 2.7 Beam S-6-B having contact CFRP-rebar splice ......................................................... 32
Figure 2.8 Representative results from reinforcing bar tests ....................................................... 35
Figure 2.9 Beam test set-up .......................................................................................................... 37

xi
Figure 2.10 Beam C load vs. midspan displacement ................................................................... 41
Figure 2.11 Photograph of beam C cracking after failure (collage of two images) ..................... 41
Figure 2.12 Beam C strain response of primary reinforcement ................................................... 41
Figure 2.13 Beam C-S-18 load vs. midspan displacement .......................................................... 43
Figure 2.14 Photograph of beam C-S-18 cracking after failure ................................................... 43
Figure 2.15 Beam C-S-18 strain response of primary reinforcement .......................................... 43
Figure 2.16 Beam S-18 load vs. midspan displacement .............................................................. 45
Figure 2.17 Photograph of beam S-18 cracking after failure ....................................................... 45
Figure 2.18 Beam S-18 strain response of primary reinforcement .............................................. 45
Figure 2.19 Beam S-18-B load vs. midspan displacement .......................................................... 47
Figure 2.20 Photograph of beam S-18-B cracking after failure ................................................... 47
Figure 2.21 Beam S-18-B strain response of primary reinforcement .......................................... 47
Figure 2.22 Beam S-6 load vs. midspan displacement ................................................................ 49
Figure 2.23 Photograph of beam S-6 cracking after failure ......................................................... 49
Figure 2.24 Beam S-6 strain response of primary reinforcement ................................................ 49
Figure 2.25 Beam S-6-B load vs. midspan displacement ............................................................ 51
Figure 2.26 Photograph of beam S-6-B cracking after failure ..................................................... 51
Figure 2.27 Beam S-6-B strain response of primary reinforcement ............................................ 51
Figure 3.1 Load vs. midspan displacement results for all beams ................................................ 53
Figure 3.2 Observed reinforcement strains in beams S-18, S-18-B and C-S-18 ......................... 56
Figure 3.3 Strain profiles along reinforcing bars and CFRP at an applied load of approximately 6.9 kips (31 kN) ........................................................................................ 56
Figure 3.4 Strains and calculated stresses in CFRP-reinforcing steel splice in beam S-18 ......... 57

xii
Figure 4.1 In situ anchorage methods for FRP web reinforcement in T-beams (REM Structural Limited, 2013) .................................................................................................. 63
Figure 4.2 Proposed web reinforcement detail using CFRP-to-reinforcing steel splice .............. 63
Figure 4.3 In situ beam-column CFRP shear reinforcement details (Silva et al., 2009) ............. 65
Figure 4.4 Proposed detail for beam-column joint shear reinforcement using CFRP-to- reinforcing steel splice ...................................................................................................... 65

xiii
NOMENCLATURE
Abbreviations
AASHTO American Association of State Highway and Transportation Officials
ACI American Concrete Institute
ASTM American Society for Testing and Materials
CFRP Carbon Fiber Reinforced Polymer
COV Coefficient of Variation
DWT Draw Wire Transducer
EB Externally Bonded
FRP Fiber Reinforced Polymer
IC Intermediate Crack Induced Interfacial Debonding
MoR Modulus of Rupture
LRFD Load and Resistance Factor Design
PE Plate End Debonding
Notation
a Depth of equivalent stress block
A Cross sectional area
Ab Cross sectional area of reinforcing bar
Atr Cross sectional area of transverse reinforcement

xiv
bp Width of bonded plate
C Compressive stress block resultant force
cb Cover thickness
d Distance from extreme compression fiber to centroid of tension reinforcement db Bar diameter
E Modulus of elasticity
fc’ Concrete compressive strength
fs Stress in reinforcing steel
fu Ultimate stress of steel reinforcement
fy Yield stress of steel reinforcement
fyt Yield stress of transverse reinforcement
g Gap between spliced elements
Ktr Transverse reinforcement factor (ACI 318)
ld Development length
Le Effective bond length of FRP
ls Length of splice
ltot Total required length for non-contact lap splice
n Number of bars being spliced
nt Number of tests performed
P Applied load
s Transverse bar spacing
tf Thickness of bonded plate
T Tensile resultant force

xv
u Tangential stress in reinforcing bar
u’ Radial component of stress transferred from bar to concrete
ucal Calibrated average bond strength
ucal’ Calibrated bond strength including transverse reinforcement
ut Average bond stress
utr Effect of transverse reinforcement on bond strength
α Assumed crack angle
β Angle of rib inclination to bar profile
∆l Additional length required for non-contact lap splice
ε Strain
λ Correction factor for lightweight concrete
σPE Peeling force
τ Transferred bond stress
ψe Correction factor for epoxy coating (ACI 318)
ψs Correction factor for bar size (ACI 318)
ψt Correction factor for top-cast bars (ACI 318)
This thesis was completed using US units throughout except where noted. The following “hard”
conversion factors were used:
1 in. = 25.4 mm
1 kip = 4.448 kN
1 ksi = 6.895 MPa

xvi
Reinforcing bar sizes are given using the designation cited in the appropriate reference. In the
report, a bar designated with a “#” followed by a number refers to a standard inch-pound
designation used in the United States (e.g. #4). The number refers to the diameter of the bar in
eighths of an inch. A bar designated with an “M” after the number refers to the standard metric
designation. The number refers to the nominal bar diameter in mm (e.g. 20M).

xvii
ACKNOWLEDGEMENTS
The author would like to thank his advisor, Dr. Kent A. Harries, whose time, effort,
insight and expertise made this work possible.
The author would also like to thank committee members, Dr. Qiang Yu, and Dr. John
Brigham, for offering their time and guidance; Charles Hager for his laboratory assistance in
performing this study; the Watkins Haggart Structural Engineering Laboratory for providing
resources and equipment for this study; and the Fyfe Company of San Diego, CA, for providing
FRP materials.
Finally the author would like to thank his family and friends for their support and
encouragement throughout his career.

1
1.0 INTRODUCTION AND LITERATURE REVIEW
1.1 INTRODUCTION AND MOTIVATION
There are many applications in the use of fiber reinforced polymer (FRP) for repairing or
strengthening reinforced concrete structures where end anchorage of the FRP can result in
cumbersome and often uncertain details; these may include: shear reinforcement, column base
reinforcement and joint reinforcement. This study investigates the possibility of ‘splicing’ the
external FRP reinforcement to the existing internal reinforcement in a manner analogous to a
conventional lap splice in a reinforced concrete structure. In this approach, stress carried by the
FRP is redistributed to the reinforcing steel (at a distance from the repair) resulting in simpler
anchorage details for the FRP and a more efficient use of FRP material and the underlying
structure.
The concept behind the proposed ‘FRP-rebar lap splice’ stems from a similar detail
developed for the shear and torsional strengthening of the West Gate Bridge in Melbourne
(Williams et al., 2011) shown in Figure 1.1. For this project, it was necessary to provide a CFRP
(carbon FRP) shear repair to a web in which providing anchorage at the top ends of the FRP
would be difficult (if not impossible) and therefore end peel of the FRP was likely, limiting the
effectiveness of the FRP. Recognizing that FRP debonding typically propagates through a thin
region of cover concrete, it was proposed to strengthen the concrete substrate by drilling (Fig.

2
1.2a) a 1.2 in. (30 mm) square chase into the concrete substrate (Fig. 1.2b) and filling this with
epoxy resin immediately prior to installing the FRP as shown in Figure 1.2d (Kalfat and Al-
Mahaidi, 2010). In effect, the chase results in a ‘ribbed’ FRP system embedded into the substrate
rather than simply adhered to the surface. The chase was expected to help to distribute the stress
through the cover concrete and toughen the bonded system. Due to additional design
considerations, a 0.8 in. (20 mm) reinforcing bar was also installed into the chase (Fig. 1.2c) and
the anchorage detail was tested in this arrangement (Kalfat and Al-Mahaidi, 2010). The detail is
reported to have increased the capacity of the bonded FRP system by a factor of two although the
authors clearly indicated that “the reinforcing bar does not actively contribute to the
enhancement of the FRP laminate anchorage.” (Kalfat and Al-Mahaidi, 2010)
The CFRP-rebar splice proposed in this work is based on this previous application,
expanding upon it by suggesting that if bond is enhanced, stress is better transferred to the
substrate and the embedded reinforcement. Thus the question arises: could a similar arrangement
effectively splice FRP to existing reinforcing steel? Going a step further, could a termination
detail involving a drilled and embedded reinforcing bar, similar to that shown in Figure 1.2, be
used to terminate an FRP repair? In the latter case, the embedded bar is bent to lie along the
concrete surface immediately below the FRP resulting in a detail similar to that shown in Figures
1.1 and 1.2. This study examines both questions.

3
Figure 1.1 FRP anchorage used in West Gate Bridge (adapted from Williams et al., 2011).
(a) Drilling chase in inclined concrete web. (b) Completed chases.
(c) 20 mm bar installed in chase. (d) FRP overlaid chases.
Figure 1.2 Sequence of West Gate FRP anchorage installation (Williams et al., 2011).

4
1.2 OBJECTIVE
The objective of this research is to investigate whether an externally mounted FRP strip can
develop internal reinforcing bars similar to an in-situ rebar-to-rebar lap splice. The present
research is focused on the failure mode of the concrete member. It will be shown in the literature
review that the performance of a lap splice is dependent on the bond strength of the
reinforcement to the concrete and the development length of the splice. A conventional lap splice
has a design strength equivalent to the yield strength of a continuous bar. In this study, the splice
is considered adequate if the internal reinforcing steel yields prior to failure due to insufficient
development length. The scope of the study was not to develop a unique design criteria for FRP
applications in lap splices, rather to demonstrate whether the in-situ design criteria for rebar-to-
rebar lap splices is sufficient for FRP-to-rebar applications. Fatigue loading was not examined in
the present research although is acknowledged to be an issue of concern in bonded FRP systems
and therefore is an area for future study for FRP-to-rebar splices.
1.3 SCOPE
This thesis presents the experimental study of the behavior of CFRP-to-reinforcing steel splices
in medium-scale reinforced concrete beams. This thesis is organized as follows:
Chapter 1 presents an introduction and technical background based on related research
concerning the behavior of lap splices, development lengths, and FRP debonding.
Chapter 2 presents the details of the experimental program and test set-up, including
materials and equipment used, dimensions, observations, and raw data.

5
Chapter 3 presents a discussion of the results of the experimental program.
Chapter 4 presents a summary, conclusions, and potential applications.
1.4 LITERATURE REVIEW
The following sections provide a review of available literature regarding the behavior of
conventionally lap-spliced bars, and a brief overview of the nature of FRP debonding. The FRP-
to-rebar splice proposed in the present work is novel; thus there are no previous studies
specifically addressing such a system.
1.4.1 Overview of Lap Splices
Construction of reinforced concrete members often requires the use of lap splices to connect the
ends of steel reinforcement where it is not feasible to provide a continuous rebar. The splice is
designed to have a strength analogous to an equivalent continuous bar. In lap splices, the forces
are transmitted through the concrete which surrounds the bars in the spliced region similar to that
of a single straight-anchored bar embedded in concrete. In a conventional lap splice, the spliced
members may either be in contact (contact lap splice) or separated by a relatively thin layer of
concrete (non-contact lap splice).

6
1.4.2 Contact Lap Splices
Contact lap splices are defined as two reinforcing steel bars, typically tied together with wire to
ensure continuity during concrete placement, in contact with each other. These can be designed
to transmit both tension and compression, however typically observed failure mechanisms are
associated with tension. In a contact lap splice, the stresses in the rebar are not transferred
directly through the contact between bars; rather the stress is transferred through the surrounding
concrete. This phenomenon is related directly to the behavior of a single straight-anchored bar in
concrete, in which the stress at the end of the bar is understood to be zero, and at a distance from
the end, hereafter referred to as the development length, the bar can be fully developed (i.e.: it
can develop 100% of its yield strength).
The development length of a steel reinforcing bar in concrete is dictated by the bond
stress developed along the concrete/steel interface. Although longitudinal friction of the bar
contributes to this bond stress, the primary resistance is provided through the force exerted from
the ribs of the reinforcing steel on the concrete, as shown in Figure 1.3 (Orangun et al., 1977).
From Figure 1.3, it can be seen that the reactions within the surrounding concrete can be broken
down into components, both tangential and radial to the bar. The radial component is based on
the geometry of the ribs. If the angle of the ribs is defined as β, then the radial component of the
stress is defined as follows:
tan' uu (1.1)
Where u is the tangential stress in the reinforcing bar and u’ is the radial component of that stress
transferred to the surrounding concrete. This radial stress will typically dictate the failure mode
seen in anchored bars. The radial stress will result in dilation of the surrounding concrete,

7
eventually leading to longitudinal cracking, typically in the area where the minimum cover is
provided. Longitudinal cracking will result in a loss of bond between the reinforcing steel and
concrete, and hence the rebar is no longer anchored and no longer resists stress. To counteract a
splitting failure, designers can increase the confining pressure applied to the concrete
surrounding the bar by either increasing the amount of cover, or by providing sufficient
transverse reinforcement (Orangun et al., 1977). Development length is therefore based on the
accumulation of bond stress developed between the rebar and the surrounding concrete.
(a) Bond force on bar. (b) Reaction on concrete.
(c) Components on concrete. (d) Tangential and radial components.
Figure 1.3: Stress transfer from anchored bar to surrounding concrete (Orangun et al., 1977).
It can be seen from Figure 1.4 (Orangun et al., 1977) that the behavior of contact lap
splices is similar to the behavior of a single anchored bar. Therefore, the design of contact lap
splices and their failure mode is sensitive to both the clear concrete cover and the spacing
between adjacent spliced bars as both of these affect the confinement of the concrete surrounding

8
the spliced bars. In Figure 1.4, it can be seen that a concrete cylinder surrounding each bar is
defined by the cover distances and spacing. In the case of a contact lap splice, the cylinder takes
the shape of a cross sectional oval (Orangun et al., 1977) but is otherwise the same.
There are two primary failure modes related to lap splices. The first, described
previously, is longitudinal splitting where the radial forces generated by the bar lugs overcome
the ability of the concrete cylinder (in the sense of Fig. 1.4) to resist tension and a longitudinal
crack develops. The second failure mode occurs when the concrete surrounding the bar is
adequately confined to resist the first splitting mode. In this case, the concrete eventually shears
at or near the level of the lugs or crushes, resulting in pull out of the bar. The second mode of
failure is characterized by a relatively smooth cylinder of concrete – completely encasing the
steel bar – pulling out the concrete. Therefore the design must satisfy both failure modes. The
splitting mode is common and relatively easy to control with transverse reinforcement. The pull
out mode is an ultimate behavior of sorts and may only be mitigated by providing a longer
embedment or splice length (Harries et al., 2006).

9
(b)
Spl
iced
bar
s.
Fig
ure
1.4
: D
efin
ition
of
cove
r sp
acin
g in
anc
hore
d an
d sp
liced
bar
s (O
rang
un e
t al.,
197
7).
(a)
Sin
gle
bars
.

10
It has been shown that the bond stresses do not develop linearly along the development
length (Orangun et al., 1977), however from a design stand point it is not necessary to know the
exact value of the bond stress at each location, but rather it is sufficient to consider the average
bond stress along the development length. Calculation of the average bond stress has been
proposed (Orangun et al., 1977; Turk and Yildirim, 2008) which relates the bar size and
development length, as follows:
s
bs
sb
sbt l
df
ld
fAu
4
(1.2)
Where ut is the average bond stress, Ab is the cross sectional area of the bar, fs is the stress to be
developed in the bar, db is the bar diameter, and ls is the length of the splice. The theory being
that the bond stress is directly a result of dividing the total stress carried by the bar by its surface
area (Turk and Yildirim, 2008), and simplifying the equation based on geometry. It can be seen
from this relation that the bond strength is directly proportional to the bar diameter and inversely
proportional to the splice length. The bond strength that may actually be developed is also a
function of the surrounding concrete strength. Conventionally, beam bond tests are carried out
with bars located in the constant moment region. Orangun et al. (1977) showed that the presence
of a moment gradient has little effect on bond stress. As is typical with concrete design, an
empirical equation was deduced based on experimental data as follows (Orangun et al., 1977):
s
b
b
b
c
cal
l
d50
d
c32.1
'f
u (1.3)
Where ucal is the calibrated average bond strength, fc’ is the concrete compressive strength, and
cb is the cover thickness. The relationship in (1.3) is based on a bar embedded in concrete with
no transverse reinforcement. Therefore, additional parameters must be introduced to reflect the
additional confinement pressure provided by transverse reinforcement. The force provided by

11
transverse reinforcement is determined by dividing the stress provided by a transverse tie at the
tie location by the tie spacing and diameter of the spliced bars (Orangun et al., 1977). It was
determined that there is a limit to how much bond strength may be improved by providing
additional confinement; the upper limit was empirically determined to be utr = 3√fc’ (Orangun et
al., 1977). The empirical equation relating the effect of transverse reinforcement on bond
strength is as follows:
3500
1
'
b
yttr
c
tr
sd
fA
f
u (1.4)
Where utr is the effect of transverse reinforcement on bond strength, Atr is the cross sectional area
of transverse reinforcement, fyt is the yield strength of transverse reinforcement, and s is the
spacing of the transverse ties. The calibrated bond strength relationship is therefore a summation
of the embedment (Eq. 1.3) and transverse confinement (Eq. 1.4) components:
'fsd500
fA
l
d50
d
c32.1uu'u c
b
yttr
s
b
b
btrcalcal
(1.5)
Where u’cal is the calibrated bond strength including transverse reinforcement. A relation
between (1.2) and (1.5) will determine the amount of stress which can be resisted by a lap splice
of a specific length for different sized bars and transverse reinforcement, as follows (Orangun et
al., 1977):
b
yttr
b
b
c
yb
d
sd500
fA
d
c32.1
50'f4
fd
l
(1.6)
5.2d
c
b
b (1.7)
Where ld is the development length.

12
As discussed previously, the required lap splice length is equal to the development
length. Equation (1.7) is a limit which reflects the ultimate capacity of the pull out failure mode
as discussed earlier. Additional correction factors are applied to the equation for lap splice length
to reflect other conditions known to effect bond behavior. The work of Orangun et al. has shown
strong correlation with test results and continues to form the basis for North American concrete
practice; nonetheless there are varying design equations for lap splice length in current codes.
Table 1.1 shows current ACI and AASHTO calculations for required reinforcing bar
development lengths (splice lengths).
Table 1.1 Current design code provision for development length.
Source Equation
ACI 318 §12.2.3
.in12d
d
Kc'f
f
40
3l b
b
trb
set
c
yd
(1.8)
5.2d
Kc
b
trb
(1.9)
sn
A40K tr
tr (1.10)
AASHTO LRFD Bridge Design Specifications
§5.11.2.1.1 .in12
'f
fd95.0l
c
ybd (1.11)
In (1.8), Ktr is a term for transverse reinforcement, ψt ψe and ψs are correction factors for
top cast bars, epoxy coating, and bar size, respectively (ψtψe ≤ 1.7), λ is a correction factor for
lightweight concrete, s is the transverse bar spacing, and n is the number of bars being spliced.
The term in (1.9), similar to the work of Orangun et al., is a limit to restrict the likelihood of a
pull out failure. Both ACI 318 (2011) and AASHTO LRFD Bridge Design Specifications (2010)

13
limit the length of the splice to not less than 12 in. (305 mm). This final requirement is a
practical consideration reflecting the tolerance of placed rebar.
1.4.3 Non-Contact Lap Splices
Lap splices, design as described in Table 1.1, are not required to be in contact; non-contact
splices are permitted. In non-contact lap splices, the development length of the anchored bars is
the same as that for contact lap splices, however an additional length should be provided to the
lap splice to ensure that the stresses are transferred through the concrete across the gap between
spliced bars, however current codes only limit the gap length rather than provide this additional
length. Current design codes limit the gap between non-contact spliced reinforcing steel to a
maximum of 6 in. (152 mm) (ACI 318, 2011; McLean and Smith, 1997). It is understood that
this limit is based on the fact that test data for non-contact splices is only available for splices
which had a gap of 6 in. (152 mm) or less. This test data indicates that there is little to no
difference in performance between contact and non-contact lap splices (McLean and Smith,
1997).
The required lap splice length of a non-contact lap splice is the sum of the required
development length and an additional length determined based on assumed concrete crack
angles. If the resulting problem is treated similarly to a strut-and-tie model then geometry can be
used to determine the additional length required (Figure 1.5). The theory was originally proposed
by Orangun et al. (1977) who assumed conservatively a crack angle of α = 40 degrees. Applying
geometry to Figure 1.5, it can be seen that the tangent of the crack angle is equal to the additional
splice length divided by the gap:

14
l
g
)tan( g2.140tangl (1.12)
Therefore the required overall splice length becomes (McLean and Smith, 1997):
g2.1llll ddtot (1.13)
In (1.12), α is the assumed crack angle, g is the gap between spliced reinforcing steel, and ∆l is
the additional length required for non-contact lap splices. In (1.13), ltot is the total required lap
length and ld is the development length of the anchored rebar determined from Table 1.1. It
should be noted that it is highly recommended that transverse reinforcement be provided to
ensure sufficient confining pressure in non-contact lap splices (McLean and Smith, 1997).
Figure 1.5: Truss analogy for non-contact lap splices (adapted from McLean and Smith, 1997).
1.4.4 FRP Debonding Behavior
There is an exceptionally broad spectrum of uses for FRP materials in reinforced concrete
structures. The scope of this study and literature review is directed toward the behavior of FRP
strips adhesively bonded to the soffits of reinforced concrete beams under monotonic flexural
loading. Currently there is no literature on FRP-to-reinforcing steel lap splice applications;

15
however there exists abundant research on FRP debonding. The following is a brief review of
FRP debonding in conventional concrete flexural strengthening applications.
Research has shown there to be six primary limit states for reinforced concrete beams
having externally bonded (EB) FRP as flexural reinforcement (Smith and Teng, 2001); these are
shown schematically in Figure 1.6:
a) Flexural failure by FRP rupture
b) Flexural failure by crushing of compressive concrete
c) Concrete shear failure
d) Concrete cover separation
e) Plate end interfacial debonding (PE)
f) Intermediate crack induced interfacial debonding (IC)
Failure modes a-c are not unique to FRP debonding failures and are indications that the beam has
reached its flexural or shear capacity. Failure modes e-f are considered debonding failures and
will cause the section to rapidly lose significant flexural strength. While mechanistically similar
to e, failure mode d is often associated with heavily reinforced sections and the longitudinal
splitting that develops as a result of longitudinal bar development (as described above). In the
scope of an FRP-to-reinforcing steel lap splice it is preferred to have a failure mode a or b rather
than e or f, since this is an indication that the beam has reached its flexural or shear capacity
prior to the failure of the splice. Modes c and d are both brittle and their occurrence in an FRP-
repaired beam is an indication of a poorly designed repair or a design that did not consider all
aspects of beam behavior.

16
(a) FRP rupture. (b) Crushing of compressive concrete.
(c) Shear failure. (d) Concrete cover separation.
(e) Plate end interfacial debonding (PE). (f) Intermediate crack induced interfacial debonding (IC).
Figure 1.6: Primary failure modes of FRP-strengthened reinforced concrete beams (Smith and Teng, 2001).
The debonding modes can be further classified into two types: plate end debonding (PE)
and intermediate crack induced interfacial debonding (IC). Plate end debonding, which is far
more commonly reported in experimental literature, begins at the plate end and propagates
through the concrete in the direction of increasing moment (i.e.: toward midspan). PE debonding
results from the high shear stress developed at the plate termination. While common in
experimental studies where test beams are often short to the point of being shear critical, PE
debonding is easily mitigated in many cases and is rare in practice where beam (or slab) elements
tend to be longer and less dominated by shear. The second type, IC debonding, initiates at an
intermediate flexural or shear crack and propagates in the direction of decreasing moment (i.e.:
towards the plate end). In most debonding failures, it is common for a thin layer of concrete to

17
break off with the FRP strip during debonding, indicating that the adhesive-to-concrete bond is
stronger than the concrete tensile capacity (Smith and Teng, 2001). Debonding, in general, is
understood to be relatively brittle and therefore undesirable; nonetheless, it is often the critical
failure mode and designs proceed accordingly.
Analogous to development length of reinforcing steel, FRP exhibits an ‘effective bond
length’ defined as the length beyond which no additional force may be transferred to the FRP.
There are a number of proposed calculations for effective bond length (Ouezdou et al., 2009)
although the typically referenced value for effective bond length is (Chen and Teng, 2001):
'f
tEL
c
ff
e (SI units) (1.14)
Generally, values of Le will be substantially less than the development length for steel bars
having similar capacities.
In FRP-to-internal reinforcing steel applications the concern is with PE debonding, since
an IC debonding failure away from the splice is an indication that the splice has not failed.
Additionally, debonding tends to occur in regions of high stress concentrations either due to
changes in beam section or due to the presence of cracks (Buyukozturk et al., 2004), which are
likely to occur within the concrete at the location of a splice. Although the FRP strip is attached
using a thin layer of adhesive, the strain in the FRP is assumed to be equal to the strain at the
corresponding location on the surface of the concrete beam. It is also true that the strain at the
end of the FRP is zero since it has no ability to equilibrate stress at this location. This
combination of behavior causes an out-of plane ‘peeling’ force component to develop in order to
equilibrate the development of the FRP strip as it tries to ‘catch up’ to achieve the same strain as

18
that in the adjacent concrete (Reeve and Harries, 2005). The peeling force is proportional to the
transferred bond stress at the location – τ, in Figure 1.7:
22fpfp
PE
tb
d
dtb
(1.14)
Where, σPE is the peeling force and bp and tf are the breadth and thickness of the bonded plate. To
mitigate such PE debonding, in conventional flexural reinforcement applications, the FRP strip is
terminated as close to the supports as possible to reduce the value of τ. However, in FRP-to-
reinforcing steel applications, the end of the FRP strip is at the location of the splice, making the
flexural behavior of the beam more critical to the debonding mode. The high stress
concentrations in the concrete caused by the splice should have similar effects on the FRP strip
as in conventional flexural reinforcement applications. Ultimately, if the strength of the bond
between the FRP plate and the concrete substrate is greater than that of the internal reinforcing
steel being spliced, then the length of the required FRP-to-rebar splice should be dictated by the
development length of the bar.

19
(a) Externally mounted FRP-to-concrete interaction.
(b) Illustration of PE debonding.
Figure 1.7: Stresses associated with PE debonding (adapted from Jones et al., 1982).

20
2.0 FLEXURAL BEAM TESTING
This chapter presents the flexural beam specimen details and testing setup and a summary of the
test results. To assess the performance of external CFRP-to-internal reinforcing bar splices
(hereafter referred to as CFRP-rebar splices for convenience) in concrete, six beams were cast,
two control beams and four test beams. The control beams do not utilize any CFRP as flexural
reinforcement. All beams had identical loading arrangements, and were subject to monotonically
increasing loads to failure. The only variation between beams were the arrangements of the
flexural reinforcement, thus the results from the CFRP-rebar spliced beams can be compared to
the control beams. Varying splice lengths were used in the test beams to provide evidence that
the development length of a CFRP-rebar splice affects the failure mode of the beam.
It was assumed that a splice successfully transferring shear stresses between externally
applied CFRP and internal reinforcing steel would result in the steel yielding since it has a lower
tension capacity than the CFRP. Any beam that fails prior to steel yielding is an indication of an
ineffective splice.
2.1 FLEXURAL BEAM SPECIMENS
Six reinforced concrete beams were cast simultaneously as shown in Figure 2.1. Each specimen
was 8 in. (203 mm) deep, 6 in. (152 mm) wide, and 84 in. (2134 mm) long. The beams were cast

21
in their inverted position (Figure 2.1), and to ensure that the beams would not be damaged during
handling, each beam had two #3 bars (9.5 mm) in the compression zone (tension zone in casting
position). These bars were provided with 1 in. (25 mm) of concrete cover all around. Each beam
had varying primary flexural reinforcement as described below.
Figure 2.1 Arrangement of forms prior to casting concrete.
No shear reinforcement was provided so as not to be a parameter in the investigated
splice behavior. The beam shear span length was selected to be sufficiently long to permit
development of the nominal flexural capacity of the beam. For the sake of the present work, this
is all that is necessary. Our interest is in the ability to develop the yield strength of the
reinforcing steel; behavior beyond this is not critical to this experimental program. Indeed, the

22
beams are expected to develop their flexural capacities but to eventually fail in the shear mode
due to the lack of transverse reinforcement.
2.1.1 Beam C
Control specimen C had a single straight #4 bar (12.7 mm) located in the tensile zone (Figure
2.2) centered with respect to the width, and embedded with 1.5 in. (38 mm) of concrete cover.
The #4 bar was continuous along the entire length of the member and no CFRP was used. Two
electrical resistance strain gauges were attached to the surface of the #4 bar. These gauges were
spaced at 10 in. (254 mm) centered with respect to the beam tests span (Figure 2.2).

23
(a) Elevation.
(b) Inverted plan (bar-mounted strain gauges shown).
(c) Section A-A
Figure 2.2 Beam C having single continuous reinforcing bar.

24
2.1.2 Beam C-S-18
Spliced control specimen C-S-18 had a single lap spliced #4 bar located in the tensile zone
(Figure 2.3). Two 51 in. (1295 mm) bars were provided with a standard 18 in. (457 mm) long
contact lap splice centered in the test span. The bars were provided with 1.5 in. (38 mm) of
concrete cover. A total of four strain gauges, two on each spliced bar, were attached to the #4
bars spaced at 10 in. (245 mm) centered with respect to the beam test span (Figure 2.3), thus the
gauges were located at coincidental locations on each spliced bar. From these gauges the efficacy
of the lap splice may be determined.
Based on ACI 318 (2011) §12.2.2 development length requirements, the simplified
required splice length to develop a 60 ksi (420 MPa) #4 reinforcing bar in 5000 psi (34.4 MPa)
concrete is 17 in. (432 mm). Using the more refined ACI 318 §12.2.3 (Eq. 1.8), the required
splice length is 7.3 in. (185 mm), although §12.2.1 limits the development length to no less than
12 in. (305 mm). Finally, using AASHTO (2010) §5.11.2.1.1 (Eq. 1.10), the basic required splice
length is 12.7 in. (305 mm). Thus, the 18 in. (457 mm) lap splice provided should be more than
adequate to fully develop the spliced bars and is compliant with both ACI 318 and AASHTO
LRFD requirements. Calculations of required lap lengths are provided in Appendix A.

25
(a) Elevation.
(b) Inverted plan (strain gauges mounted on both bars at locations shown).
(c) Section A-A. (d) Section B-B.
(e) Photograph of lap splice for Beam C-S-18.
Figure 2.3 Beam C-S-18 having conventional lap splice.

26
2.1.3 Beam S-18
Beam S-18 had a single straight #4 bar having 1.5 in. (38 mm) cover. This bar extended
through one end of the beam and only 9 in. (229 mm) beyond midspan (Figure 2.4). Essentially,
this bar is one side of the lap splice tested in beam C-S-18. The primary tension reinforcement on
the other side of midspan was provided by a 4 in. (102 mm) wide strip of CFRP adhesively
attached to the soffit of the beam. The CFRP was centered with respect to the width of the beam
and extended from a distance of 3 in. (76 mm) from the beam support to 9 in. (229 mm) beyond
midspan. This layout results in a CFRP-rebar splice that is 18 in. (457 mm) long, the same length
as the reinforcing bar splice used for beam C-S-18. The effective bond length of the CFRP used
(Eq. 1.14) is 7.8 in. (198 mm), considerably less than the 18 in. splice provided. The calculation
of effective bond length is provided in Appendix A. The CFRP is adhered to the concrete
surface; therefore the splice is affected through 1.5 in. (38 mm) of concrete cover. Both ACI 318
(2011) §12.14.2.3 and AASHTO LFRD (2010) §5.11.2.1.1 permit non-contact rebar-to-rebar
splices having a bar gap of up to 20% of the required development length (but not more than 6
in. (152 mm)). Even taking the shortest permitted splice length, 12 in. (305 mm), the permitted
bar gap would be 2.4 in. (61 mm). Thus for Beam S-18, the resulting non-contact splice, having a
bar gap of 1.5 in. (38 mm), would satisfy the non-contact splice requirements of ACI 318 and
AASHTO LRFD.
Two strain gauges were attached to the #4 bar spaced at 10 in. (254 mm) centered with
respect to the beam test span (Figure 2.4). Four strain gauges were placed in pairs on the CFRP
strip; each pair spaced at 10 in. (254 mm) centered with respect to the beam test span
corresponding the gauges on the embedded #4 bar (Figure 2.4). Each pair consisted of a strain

27
gauge centered with respect to the width of the CFRP strip and a gauge offset 1.5 in. (38 mm)
from the centerline, as shown in Figure 2.4.
(a) Elevation.
(b) Inverted plan (strain gauges on internal steel and CFRP as shown).
(c) Section A-A. (d) Section C-C. (e) Section D-D.
Figure 2.4 Beam S-18 having non-contact CFRP-rebar splice.

28
2.1.4 Beam S-18-B
Beam S-18-B was identical to S-18 except that the #4 bar was bent or ‘cranked’ as shown in
Figure 2.5 such that the bar was aligned along the surface of the concrete. In this way, the 18 in.
(457 mm) long spliced lengths of CFRP and reinforcing steel are in contact.

29
(a) Elevation.
(b) Inverted plan (strain gauges on internal steel and CFRP as shown).
(c) Section A-A. (d) Section D-D. (e) Section E-E.
(f) Photo of cranked bars (S-18-B and S-6-B shown) prior to casting concrete.
Figure 2.5 Beam S-18-B having contact CFRP-rebar splice.

30
2.1.5 Beam S-6
Beam S-6 was similar to S-18 except the CFRP-rebar splice provided was only 6 in. (152 mm)
long (Figure 2.6). This length was selected after testing Beam S-18 in the expectation of
providing a splice that would be inadequate to fully develop the #4 bar. All CFRP was installed
at the same time and thus initially had an 18 in. (457 mm) spliced length. To effectively reduce
the length, the excess CFRP beyond the desired 6 in. splice length was scored across its entire
width and through its depth. In this way, this CFRP no longer contributed to the capacity of the
beam. The shorter splice length of Beam S-6 resulted in only three strain gauges being used on
the CFRP. A pair (one along the centerline and one 1.5 in. (38 mm) from the centerline) of
gauges were located 5 in. (127 mm) from the midspan of the beam, corresponding to the gauge
on the embedded reinforcing bar. The third gauge was located along the centerline of the beam 4
in. (102 mm) from the others at a location that corresponds to the end of the embedded #4 bar
(Figure 2.6).

31
(a) Elevation.
(b) Inverted plan (strain gauges on internal steel and CFRP as shown).
(c) Section A-A. (d) Section C-C. (e) Section D-D.
(f) Photograph of scoring CFRP to result in shorter splice length (S-6 and S-6-B shown).
Figure 2.6 Beam S-6 having non-contact CFRP-rebar splice.
3” (typ.) 6” splice

32
2.1.6 Beam S-6-B
Beam S-6-B was identical to S-6 except that the #4 bar was bent or ‘cranked’ as shown in Figure
2.7 such that the bar was aligned along the surface of the concrete. In this way, the 6 in. (152
mm) long spliced lengths of CFRP and reinforcing steel are in contact.
(a) Elevation.
(b) Inverted plan (strain gauges on internal steel and CFRP as shown).
(c) Section A-A. (d) Section D-D. (e) Section E-E.
Figure 2.7 Beam S-6-B having contact CFRP-rebar splice.
33
2.2 MATERIAL PROPERTIES
2.2.1 Concrete
Concrete for the beams was provided by a commercial ready-mix company. Due to the relatively
small scale of the beams, a mix having maximum 0.5 in. (12.7 mm) stone and a nominal
compressive strength of 4000 psi (27.6 MPa) was ordered. Standard 4 in. (102 mm) diameter
compression cylinder (ASTM C39-12) and 6 in. (152 mm) flexural beam tests (ASTM 78-10)
were conducted at 28 days and ages corresponding to the testing of specimens (61 and 76 days).
Results are tabulated in Table 2.1. The concrete reached a 28 day compressive strength of fc’ =
5100 psi (35.2 MPa) and showed typical strength gain to about 5980 psi (41.2 MPa) at the time
of testing. Modulus of rupture values were good – higher than typically assumed (ACI 318-11)
based on concrete strength. At 28 and 76 days, the modulus of rupture was 600 psi (4.1 MPa)
and 880 psi (6.1 MPa), respectively. These values predict relatively good concrete tensile and
shear strengths which are necessary for the sound performance of the bonded CFRP.

34
Table 2.1 Experimentally determined concrete material properties.
28 day tests 61 day tests1 76 day tests2
4 in. cylinders tested n = 3 n = 3 n = 3
Average Compressive Strength
fc’ = 5103 psi (35.1 MPa)
fc = 5983 psi (41.3 MPa)
fc = 5978 psi (41.2 MPa)
Standard Deviation (COV)
547 psi (10.7%) (3.8 MPa)
722 psi (12.1%) (5.0 MPa)
536 psi (9.0%) (3.7 MPa)
6 in. MoR beams tested n = 4 none n = 2
Modulus of Rupture
603 psi (4.1 MPa)
- 884 psi
(6.1 MPa)
8.4√fc’ - 12.4√fc’
- - 11.4√fc
Standard Deviation (COV)
30 psi (5.0%) (210 kPa)
- 4 psi (0.5%)
(30 kPa)
1Beams C, C-S-18, S-18 and S-18-B were tested at ages of 61, 60, 62 and 62 days, respectively. 2Beams S-6 and S-6-B were tested at 75 days.
2.2.2 Reinforcing Steel
ASTM Standard E8-11 tension tests were conducted on samples of both the #4 and #3
reinforcing steel. Results are shown in Table 2.2. Representative stress-strain results are shown
in Figure 2.8.
Table 2.2 Experimentally determined reinforcing bar material properties.
#4 primary reinforcing bars
#3 compression bars
Samples tested n = 2 n = 2
Yield stress fy = 71 ksi (490 MPa) fy = 75 ksi (517 MPa)
Ultimate stress fu = 112 ksi (772 MPa) fu = 114 ksi (786 MPa)
Experimentally determined modulus
E = 25600 ksi (177 GPa)
E = 29500 ksi (203 GPa)

35
(a) #4 reinforcing bar. (b) #3 reinforcing bar.
Figure 2.8 Representative results from reinforcing bar tests.
2.2.3 CFRP Strips
Commercially available unidirectional carbon fiber reinforcement polymer strips were used.
These strips are 4 in. (102 mm) wide and 0.059 in. (1.5 mm) thick. The manufacturer reported
tensile strength and modulus are 406 ksi (2800 MPa) and 22,480 ksi (155 GPa), respectively.
The material behaves in a linear elastic manner to failure resulting in a rupture strain of 0.018.
2.2.4 Adhesive
Commercially available epoxy adhesive intended for use with CFRP and concrete was used to
attach the CFRP to the concrete substrate. Manufacturer reported tensile strength and modulus
are 3.6 ksi (25 MPa) and 650 ksi (4.5 GPa), respectively. The bond strength is reported to be 3.2
ksi (22 MPa). In the application, an adhesive thickness of approximately (1 mm) was attained.

36
2.3 TEST SET-UP
All beams were subject to four-point flexure to failure The shear spans and constant moment
regions were each 26 in. (660 mm) long as shown in Figure 2.9. Load was applied using a 40 kip
(178 kN) capacity hydraulic ram and spreader beam. The ram was equipped with a ball-joint
connection at the spreader beam and both load points at the beam were 0.5 in. (12.7 mm) radius
steel rollers on 0.5 in. (12.7 mm) thick steel plates. Support conditions had 0.5 in. (12.7 mm)
steel plates resting on 2 in. (50.8 mm) radius rollers. All four steel plates (two load points and
two supports) were ‘capped’ onto the beams using a high-strength plaster compound. Vertical
displacements at midspan were measured using a draw wire transducer (DWT) whose wire was
attached to the beam at its mid-depth at midspan. Load was initially applied in 200 lb (890 N)
intervals until large midspan deflections resulted following apparent yield of the reinforcing
steel. Following yield, data was recorded at deflection increments of 0.1 in. (2.5 mm) until the
end of the test. At each interval, loading was held for approximately 10 seconds to provide time
for manual recording of strain gauge readings and displacement.
Applied load data was obtained from a precision transducer measuring hydraulic pressure
supplied to the ram; the resolution of this system is 0.1% or ±40 lb (178 N) for the ram used. The
DWT has an on-board digital readout with a resolution of 0.1% or 0.02 in. (0.5 mm). Strain data
was collected on dedicated 4-channel digital strain indicators having a resolution of 1 microstrain
(µε). All data was recorded manually at load increments of 200 lb (890 N) or displacement
increments of 0.1 in. (2.5 mm) as described above.

37
(a) Schematic diagram of beam test set-up.
(b) Photograph of beam tests set-up.
Figure 2.9 Beam test set-up.
2.4 TEST RESULTS
A summary of key results is presented in Table 2.3. A description of the behavior of each beam
is provided in the following sections. In all cases, the ‘load’ indicates the total load resisted by
the beam. For an applied load P, the maximum moment in the beam is 13P kip-in or 1.08P kip-ft
(0.33P kN-m) and the shear is P/2. In all cases, ‘displacement’ refers to the midspan
displacement measured by the DWT.

38
Table 2.3 Summary of test results.
test result C
C-S-18 S-18 S-18-B S-6 S-6-B RESPONSE prediction
test
Load at initial cracking
kips (kN)
2.5 (11.1)
2.64 (11.7)
2.69 (12.0)
5.54 (24.6)
2.64 (11.7)
2.84 (12.6)
-
Yield of reinforcing steel
kips (kN)
6.4 (28.5)
6.64 (29.5)
6.68 (29.7)
6.24 (27.8)
6.69 (29.8)
- -
…Corresponding displacement
in. (mm)
- 0.35 (8.9)
0.33 (8.4)
0.19 (4.8)
0.19 (4.8)
- -
Ultimate capacity kips (kN)
8.2 (36.5)
8.84 (39.3)
9.25 (41.1)
9.54 (42.4)
8.84 (39.3)
6.84 (30.4)
5.24 (23.3)
…Corresponding displacement
in. (mm)
- 1.54
(39.1) 1.48
(37.6) 1.14
(29.0) 0.90
(22.9) 0.28 (7.1)
0.14 (3.6)
Ultimate failure mode
shear shear following flexural yield; shear initiating at load point
CFRP debond
slip of cranked bar
2.4.1 Analytical Predictions
In order to establish a baseline behavior against which the experimental results may be assessed,
a plane sections model of control specimen C was developed using the program RESPONSE
(Bentz 2000). RESPONSE is a well-documented plane sections analysis program which uses a
layer-by-layer section discretization and strain compatibility to calculate section response.
Essentially, a RESPONSE model of a section is a two-dimensional fiber element of the
reinforced concrete section. RESPONSE utilizes the modified compression theory for predicting
shear behavior. Using measured material properties (Tables 2.1 and 2.2), the predicted flexural
capacity of beam C is found to be 8.8 k-ft (11.9 kN-m), corresponding to an applied load of 8.2
kips (36.5 kN). The applied loads to cause cracking and initial reinforcing bar yield are 2.5 kips
(11.1 kN) and 6.4 kips (28.5 kN), respectively. Considering shear-moment interaction, the

39
predicted shear capacity of the beam is found to be 3.6 kips (16.0 kN), corresponding to an
applied load of 7.2 kips (32.0 kN). However, the short shear span of the tested beams (a/d =
3.25) will develop some degree of arching action, in which case the sections analysis prediction
is expected to be a low-bound for shear capacity. RESPONSE-predicted values correspond well
with the observed behavior of beam C (Table 2.3).
2.4.2 Beam C
The load-displacement response of Beam C is shown in Figure 2.10. Initial cracking of the beam
occurred at a total applied load of 2.64 kips (11.7 kN). General yielding of the specimen
occurred at a total applied load of 6.64 kips (29.5 kN) and at a corresponding displacement of
0.35 in. (8.9 mm). The specimen failed due to shear outside of the constant moment region at a
total applied load of 8.84 kips (39.3 kN) at a corresponding midspan displacement of 1.54 in.
(39.1 mm). Figure 2.11 shows the crack pattern following shear failure of the beam. The
formation of flexural cracks was generally uniform in the constant moment region, having a
spacing of approximately 6 in. (152 mm) and was developing in the shear spans. Because the
beam was not reinforced for shear and has a relatively short shear span, a single catastrophic
shear crack developed resulting in failure. As seen in Figure 2.11, this crack extends from the
applied load point to very near the support at a relatively shallow angle indicating the formation
of a single compression strut indicative of arching behavior. This should be expected for these
beams. Relative to the embedded strain gauges, one crack occurred almost exactly at the location
of the East strain gauge, while the West gauge fell between two cracks. The strain response of
the primary #4 reinforcing bar is shown in Figure 2.12. As expected, the strains track each other
until cracking and then the East gauge (closer to a crack) exhibits a greater strain increase and

40
yields at a lower applied load. The West gauge, located between cracks, exhibits a greater load at
yield illustrating the effect of ‘tension stiffening’ (Collins and Mitchell, 1997). Strain data clearly
indicates that the primary reinforcing bar yielded. The theoretical yield strain is 2400 µε while
the measured yield strain based on tension tests (Table 2.2) is 2800 µε.

41
Figure 2.10 Beam C load vs. midspan displacement.
Figure 2.11 Photograph of beam C cracking after failure (collage of two images).
Figure 2.12 Beam C strain response of primary reinforcement.

42
2.4.3 Beam C-S-18
The load-displacement response of beam C-S-18 is shown in Figure 2.13. Initially cracking of
the beam occurred at a total applied load of 2.69 kips (12.0 kN). General yielding of the
specimen occurred at a total applied load of 6.68 kips (29.7 kN) at a corresponding midspan
displacement of 0.33 in. (8.4 mm). Similar to beam C, the specimen failed due to a single
catastrophic shear crack outside of the constant moment region at a total applied load of 9.25
kips (41.1 kN) at a corresponding midspan displacement of 1.48 in. (37.6 mm). Figure 2.14
shows the beam cracking following failure. The presence of the two bars in the lap splice tends
to stiffen the splice region and result in crack formation at the ends of the splice. This behavior is
evident in Figure 2.14 where no significant cracks are visible over the splice length and two
dominate flexural cracks approximately located symmetrically at the splice ends. The strain
response of the primary reinforcing bars is shown in Figure 2.15. All gauges track together well
until just following cracking. At this point the splices must develop the tension forces in the
section. Matching gauges (i.e.: the two East gauges and two West gauges) begin to diverge as the
strain on the developed bar increases and that near the end of the bar is limited by the short
development length of 4 in. (102 mm) leading up to the gauge. The developed bars (2-West and
1-East) both demonstrate yield of the bar (the 2-West gauge failed very near the yield strain)
very similar to the gauges in Beam C (Figure 2.12). Both gauges near the ends of the spliced bars
(1-West and 2-East) show a limited development strain. This behavior is indicative of
undeveloped bars and indicates slip of the splice. The limiting strains were well below yield as
expected for locations having only 4 in. (102 mm) development length.

43
Figure 2.13 Beam C-S-18 load vs. midspan displacement.
Figure 2.14 Photograph of beam C-S-18 cracking after failure.
Figure 2.15 Beam C-S-18 strain response of primary reinforcement.

44
2.4.4 Beam S-18
The load-displacement response of Beam S-18 is shown in Figure 2.16. Initial cracking of the
beam occurred at a total applied load of 5.54 kips (24.6 kN). General yielding of the specimen
occurred at a total applied load of 6.24 kips (27.9 kN) corresponding to a midspan displacement
of 0.19 in. (4.8 mm). The specimen failed due to shear outside of the constant moment region at
a total applied load of 9.54 kips (42.4 kN) and a corresponding midspan displacement of 1.14 in.
(29.0 mm). Figure 2.17 shows the beam following failure. The higher cracking load and stiffness
(reduced displacements exhibited in this beam test) are attributed to the fully bonded CFRP
reinforcement spanning most of the constant moment region. Such externally bonded CFRP
controls major cracking and affects the stiffness of the sections (Ceroni and Pecce, 2008).
However, based on the pre-cracking softening behavior evident in Figure 2.16, it is likely that
very small hairline cracks were forming along this region. Most significant damage occurred
under the West support and in the West shear span, in the conventionally reinforced region (i.e.
Section A-A in Figure 2.4). The strain response of the primary reinforcing bar and CFRP is
shown in Figure 2.18. Reinforcing bar strains are similar to those in the control specimens C and
C-S-18. The West reinforcing bar gauge clearly yielded and the East was limited due to its short
4 in. (102 mm) development length. Post-cracking CFRP strains were approximately 42% of
those on the internal steel despite having similar axial stiffness (AEsteel = 0.2 x 29000 = 5800
kips; AECFRP = 4 x 0.059 x 22480 = 5305 kips) to the reinforcing bars. This will be discussed
further in Chapter 3.

45
Figure 2.16 Beam S-18 load vs. midspan displacement.
Figure 2.17 Photograph of beam S-18 cracking after failure.
Figure 2.18 Beam S-18 strain response of primary reinforcement.
46
2.4.5 Beam S-18-B
The load-displacement response of Beam S-18-B is shown in Figure 2.19. Initial cracking of the
beam occurred at a total applied load of 2.64 kips (11.7 kN). General yielding of the specimen
occurred at a total applied load of 6.69 kips (29.8 kN) at a corresponding displacement of 0.19
in. (4.8 mm). The specimen failed due to shear outside of the constant moment region at a total
applied load of 8.84 kips (39.3 kN) and a corresponding midspan displacement of 0.90 in. (22.9
mm). Figure 2.20 shows the arrangements of cracking after failure. The specimen behaved
similarly to beam S-18 as should be expected. There were no outward differences attributable to
the presence of the cranked bar. Like beam S-18, due to the stiffening effect of the CFRP, all of
the flexural cracking occurred on the West end of the beam beyond the CFRP (i.e. Section A-A
in Figure 2.5). Unlike in beam S-18, the presence of the CFRP did not retard the initial cracking.
This may simply represent the expected scatter in cracking data or be related to the geometry of
the cranked bar. This will be discussed further in Chapter 3. The strain response of the primary
reinforcing bar and CFRP is shown in Figure 2.21. Reinforcing bar strains are similar to those in
the control specimens C and C-S-18 as well as S-18. The West reinforcing bar gauge clearly
yielded and the East was limited due to its short 4 in. (102 mm) development length. Like beam
S-18, post-cracking CFRP strains were approximately 45% of those on the internal steel.

47
Figure 2.19 Beam S-18-B load vs. midspan displacement.
(a) Schematic diagram of S-18-B cracking after failure. (b) Photograph of S-18-B cracking after failure.
Figure 2.20 Photograph of beam S-18-B cracking after failure.
Figure 2.21 Beam S-18-B strain response of primary reinforcement.

48
2.4.6 Beam S-6
The load-displacement response of Beam S-6 is shown in Figure 2.22. Initial cracking of the
beam occurred at a total applied load of 2.84 kips (12.6 kN). Due to the short CFRP-rebar lap
length, the specimen did not exhibit any yielding of the reinforcing steel prior to failure. The
specimen failed due to debonding of the CFRP within the constant moment region at a total
applied load of 6.84 kips (30.4 kN) at a corresponding midspan displacement of 0.28 in. (7.1
mm). Figure 2.23 shows beam cracking following failure. There were two small flexural cracks
beyond the CFRP splice, and one large crack, approximately at the location of the reinforcing bar
termination, that led to the initiation of CFRP debonding as seen in Figure 2.23b. The failure
itself was the shear failure of the concrete ‘tooth’ adjacent the critical debonding crack. Such
failures are driven by the out of plane forces balancing the high shear stress along the FRP-
concrete interface. In a typical bonded FRP application this is a case of plate end debonding (or
PE) failure (Oehlers, 2006). The strain response of the primary reinforcing bar and CFRP is
shown in Figure 2.24. Until debonding failure, the specimen strains were similar to those of
previous specimens. The reinforcing bar strain was approaching yield at debonding failure.

49
Figure 2.22 Beam S-6 load vs. midspan displacement.
(a) Photograph of S-6 cracking. (b) Photograph of debonding failure.
Figure 2.23 Photograph of beam S-6 cracking after failure.
Figure 2.24 Beam S-6 strain response of primary reinforcement.
Reinforcing bar location see figure b
debonding

50
2.4.7 Beam S-6-B
The load-displacement response of beam S-6-B is shown in Figure 2.25. There was no observed
initial cracking or reinforcing bar yield prior to the beam failing. The specimen failed at a total
applied load of 5.24 kips (23.3 kN) at a corresponding midspan displacement of 0.14 in. (3.6
mm). Figure 2.26 shows the beam after failure. Failure was characterized by a single flexural
crack at midspan. The beam appears to fail as an unreinforced section. The strain behavior of the
reinforcing steel shown in Figure 2.27 shows a ‘soft’ region where the load increases from about
4 to 4.7 kips (17.8 to 20.9 kN) and the strain remains approximately constant. This is indicative
of bar slip. The photo of the failure region shown in Figure 2.26b clearly shows the failure in a
region, away from the splice. The cranked bar can be barely seen spanning the failure crack. It is
proposed that because the cranked bar resides at the concrete surface, it is very poorly developed
and thus the bar slipped into the concrete resulting in failure. This will be discussed further in
Chapter 3.

51
Figure 2.25 Beam S-6-B load vs. midspan displacement.
(a) Photograph of S-6-B cracking. (b) Photograph of S-6-b failure.
Figure 2.26 Photograph of beam S-6-B cracking after failure.
Figure 2.27 Beam S-6-B strain response of primary reinforcement.
see figure b
Reinforcing bar location
Cranked bar CFRP- Rebar lap

52
3.0 INTERPRETATION OF RESULTS
3.1 CONTROL SPECIMEN BEHAVIOR
Beam C-S-18 was designed to have an equal capacity to beam C. This was observed in the test
data as the beams demonstrated essentially identical behavior. Strain gauge data for beam C-S-18
illustrates the theoretical behavior of lapped bars well. The observed strains near the bar ends
(Figure 2.15; bar 1 West and bar 2 East) appear to plateau with increasing loads, indicating that
the bar has a limited ability to develop stress at the strain gauge location due to the bar’s limited
development length at this location. The strain gauges farther from the bar ends (bar 1 East and
bar 2 West) observed higher strains and corresponded well with strains observed in beam C
(Figure 2.12). The results from beam C-S-18 indicate that the 18 in. (457 mm) conventional lap
splice behaved as expected and was adequate to fully develop the #4 bar provided. As shown in
Figure 3.1, beam C-S-18 exhibited slightly stiffer behavior and had an ultimate capacity 4.4%
higher than beam C. Generally speaking this is an anticipated variation, which is likely due to the
marginally stiffer region in the area of the splice. Although the bars are not necessarily fully
developed within the spliced region, the provided splice was longer than the required
development length of the bars. This means that there are regions along the splice where the
lapped bars have greater ability to resist flexure than that of a single continuous bar, hence the
marginally stiffer behavior. The first observed cracking in both beams occurred at relatively

53
similar loads and coincided with increases in observed strain on the reinforcement. This was
anticipated as the cracked concrete sections no longer resist tension, relying only on the primary
flexural reinforcement to equilibrate the concrete compression couple. Cracking in beam C was
generally uniform in the constant moment region, having a spacing of approximately 6 in. (152
mm). As the test progressed, additional cracks developed in both shear spans. In beam C-S-18,
flexural cracks occurred away from midspan near the ends of the spliced bars. These cracks
become dominant as the splice slips resulting in little flexural cracking over the length of the
splice itself. Both beams experienced yielding of the primary reinforcement, followed by failure
due to a single catastrophic shear crack propagating from the point of loading and extending into
the shear span. This was essentially how the beams were expected to fail since they had
relatively short shear spans and no shear reinforcement. Beam C-S-18 serves as a basis for the
desired behavior of beams S-18 and S-18-B, as discussed below. Figure 3.1 displays load vs.
displacement results between the two control beams and the four test beams.
Figure 3.1 Load vs. midspan displacement results for all beams.

54
3.2 BEAMS S-18 AND S-18-B
Beams S-18 and S-18-B failed due to a single catastrophic shear crack initiating at the point of
loading and extending into the shear span, as did the control beams. These beams exhibited the
capability of yielding the reinforcing steel through an 18 in. (457 mm) CFRP-to-reinforcing steel
splice (Figures 2.18 and 2.21; bar West), thus demonstrating their ability to reach their design
strength. The load-displacement behavior of these beams was stiffer than the control beams,
although their capacities were similar (Figure 3.1). The fully bonded CFRP is known to control
major cracking (Ceroni and Pecce, 2008), as observed on the CFRP reinforced ends of these
beams (Figures 2.17 and 2.20). Small flexural cracks initially began to form at the end of the
effective CFRP, which corresponded well with increased strains observed in the bars. Most of
the damage occurred under the West support and into the conventionally reinforced shear span
(i.e. Section A-A in Figure 2.2). Although the CFRP controlled cracking, the bar strains in the
West end of beams S-18, S-18-B and C-S-18 each exceed their yield strain and track relatively
closely with one another as shown in Figure 3.2. There were no outward differences attributable
to the presence of the cranked bar.
CFRP strain data for beam S-18 shown in Figure 3.2 is marginally greater than the steel
strain data prior to concrete cracking (in the region of the reinforcing steel) indicating typical
uncracked plane-sections behavior. Essentially, the embedded rebar is closer to the neutral axis
than the externally bonded CFRP plate and therefore has a lower strain. Conversely, the strain
data for beam S-18-B tracks closer to the bar data (in the region of the reinforcing steel) since the
surface of the bar and the CFRP are nearly equidistant from the neutral axis in this case. Post
cracking CFRP strains were less than those on the internal steel despite the CFRP having similar
axial stiffness to the reinforcing bars. In this study, the axial stiffness (AE) of the #4 steel bar is

55
about 8.5% greater than that of the CFRP. Considering their respective contribution to moment
capacity (AE x approximate lever arm), the CFRP contribution is about 20% greater due to its
greater lever arm. One of the most significant observations in this study is the different section
behavior between the East (CFRP reinforced) and West (steel reinforced) ends of the CFRP-to
reinforcing steel splice, as illustrated in Figure 3.3. The West end of the splice is clearly
behaving as a fully cracked concrete section (confirmed in Figures 2.17 and 2.20) in which
moment is resisted by the concrete compression-steel/CFRP tension couple as shown in Figure
3.4a. The fully bonded CFRP plate results in essentially an uncracked section at the East end of
the splice. This means that the uncracked concrete in the East end of the beam is contributing to
the tensile resistance (indicated by T in Figure 3.4b) while the cracked concrete in the West end
of the splice has no contribution, hence greater observed post cracking strains in the steel in the
West end compared to the CFRP in the East end. At the East end of the splice, only the steel and
CFRP strains are known, therefore the calculation of section equilibrium remains indeterminate.
Nonetheless, the stiffer section behavior under the same applied moment is evident (Figure 3.1).
The resulting reduced curvature can be seen in Figures 2.17 and 2.20, in which the otherwise
symmetric beam fails near the West support resulting in a small region of high curvature.

56
Figure 3.2 Observed reinforcement strains in beams S-18, S-18-B and C-S-18.
Figure 3.3 Strain profiles along reinforcing bars and CFRP at an applied load of approximately 6.9 kips (31 kN).

57
(a) West end of splice. (b) East end of splice.
Figure 3.4 Strains and calculated stresses in CFRP-reinforcing steel splice in beam S-18.
3.3 BEAMS S-6 AND S-6-B
Both beams S-6 and S-6-B failed prior to observed yielding of the steel reinforcement (Figures
2.24 and 2.27). These beams were designed to have a shorter splice than the development length
of the bar to investigate failure mechanisms of inadequate CFRP-to-reinforcing steel splices; in
this sense they behaved as anticipated. Beam S-6 failed due to debonding of the CFRP within the
constant moment region. Debonding initiated at a large crack located approximately at the
reinforcing bar termination (Figure 2.23). The failure itself was the shear failure of the concrete
‘tooth’ adjacent to the critical debonding crack. Such failures are driven by the out of plane
forces balancing the high shear stress along the FRP-concrete interface. In a typical bonded FRP
application, this is the case of plate end (PE) debonding (see Section 1.4.4). Until debonding
failure, the specimen strains were similar to those of all previous specimens (Figure 3.1). The
reinforcing bar strain was approaching yield at the time of debonding failure indicating a short
development. Recall that the basic development calculated using the rigorous ACI 12.2.3
equation (Eq. 1.8 and Appendix A) did yield a required development length of only 7.3 in.

58
Failure of beam S-6-B was characterized by a single flexural crack at midspan. The beam
appears to fail as an unreinforced section (Figure 2.26). Strain data for the bar (Figure 2.27)
displays regions of softening (in both gauges). This is believed to be indicative of bar slip. No
cracking was observed prior to failure. The failure occurred in a region away from the splice,
propagating from the approximate location of the end of the effective CFRP. The cranked bar
can be seen spanning the failure crack in Figure 2.26b. It is proposed that because the cranked
bar resides at the concrete surface, is very poorly developed. This is due primarily to the
reduction in interfacial area between the bar and concrete, limiting the available bond stress.
Additionally, unlike a rebar-to-rebar contact splice, there is essentially no mechanical interaction
between the steel and CFRP. Significantly, the lack of rib-to-rib contact which can help to arrest
bar slip in a rebar-to-rebar splice, may make a contact rebar-CFRP splice undesirable. The failure
was a result of the bar slipping in the concrete.

59
4.0 CONCLUSIONS AND APPLICATIONS
4.1 SUMMARY
The objective of this study was to investigate the feasibility of a CFRP-to-reinforcing steel lap
splice in reinforced concrete structures. Six medium scale beams were cast and tested in four
point flexure under monotonically increasing loads. Strains of the primary flexural
reinforcement, bonded CFRP strips, and midspan deflections were recorded. Two control beams
were cast: beam C with a single continuous #4 bar and beam C-S-18 with two lapped #4 bars
forming an in situ 18 in. (457 mm) contact lap splice for primary flexural reinforcement. Four
test beams were cast: beams S-18 and S-18-B utilized an 18 in. (457 mm) CFRP-to-reinforcing
steel lap splice, and beams S-6 and S-6-B utilized a 6 in. (152 mm) CFRP-to-reinforcing steel lap
splice. In beams S-18 and S-6, the splice was tested as a non-contact lap splice having a gap
equal to the concrete cover. In beams S-18-B and S-6-B the #4 bar was bent in order to place the
bar at the concrete surface along the splice length, effectively creating a contact lap splice
between the reinforcing steel and CFRP.
In theory, the control beams should experience similar behavior as long as sufficient
development length is provided along the splice, since the splice has a design strength equal to or
greater than the individual spliced bars or that of a single continuous bar. Two different splice
lengths were used for the four test beams. The 18 in. (457 mm) spliced beams were designed

60
with sufficient development length to yield the reinforcing steel prior to failure, with the
intention of demonstrating the applicability of a CFRP-to-internal reinforcing steel splice. The 6
in. (152 mm) spliced beams were designed to have insufficient development length in order to
investigate the failure mode and overall behavior of an inadequately designed splice.
4.2 CONCLUSIONS
This study has demonstrated that the concept of a CFRP-to-reinforcing steel lap splice is viable.
The results from the control beams provided consistent and reliable data to serve as a basis of
comparison for the test beams. The test beams having 18 in. (457 mm) CFRP-to-reinforcing bar
splices were sufficient to develop the yield strength of the steel reinforcement in the
conventionally reinforced end of the splice. The capacity of these beams was similar to that of
the control beams, and exhibited slightly stiffer load-displacement behavior. The observed stiffer
behavior is a result of the CFRP’s greater contribution to moment capacity due its having a
greater lever arm but similar axial stiffness to the #4 bar. Additionally, bonded CFRP systems
are known to provide excellent crack control which also improves the effective stiffness over the
region to which it is bonded. There was no significant observed difference between beams S-18
and S-18-B, indicating that both contact and non-contact CFRP-to-reinforcing steel lap splices
are viable provided the splice length was long enough to develop the internal reinforcing steel.
The test beams cast with 6 in. (152 mm) splices failed prior to steel yielding, demonstrating the
failure modes of inadequate CFRP-to-reinforcing steel splices. Beam S-6 exhibited a debonding
failure, initiated by the shear failure of the concrete ‘tooth’ adjacent to the debonding crack.
Beam S-6-B appears to have failed as an unreinforced section, indicative of reinforcing bar slip.

61
It is proposed that since the bar is located at the concrete surface in the S-6-B case, it was poorly
developed. The behavior of beams S-18 and S-18-B confirm the viability of a CFRP-to-
reinforcing steel lap splice. The behavior of beams S-6 and S-6-B establish potential failure
modes for inadequately designed CFRP-to-reinforcing steel lap splices: debonding of CFRP
similar to the end peel mode of debonding and slip of inadequately anchored reinforcing steel.
The requirements for conventional steel reinforcing bar lap splices appear to be
applicable to CFRP-to-reinforcing steel splices. Provided the externally bonded CFRP strip has
been designed to have similar axial stiffness (AE) to the lapped steel reinforcement, then the
length of the lap splice should be governed by the development length of the steel bar. This is
due to the facts that: a) CFRP does not yield prior to rupture; b) the rupture strain of the CFRP
strip is greater than the yield strain of the steel reinforcement; and c) the effective bond length of
the CFRP is shorter than the development length of the steel bar. This study finds that contact
CFRP-to-reinforcing steel splices may be undesirable due to the fact that the steel bar is located
the concrete surface, providing little cover concrete to develop the bond stress to the bar. The
West Gate Bridge example, introduced in chapter 1, essentially utilized a contact lap splice, but
strengthened the bond by drilling a chase into the concrete substrate and filling it with epoxy
resin to form a stronger bond to the steel reinforcement.
The test program used flexural beam specimens to demonstrate splice behavior. These
tests illustrated the stiffening effect external CFRP has on concrete section behavior. In particular
the ability to engage the concrete tensile strength in an uncracked or partially cracked section is
shown to be significant. Nonetheless, this is not the application envisioned for such a splice.

62
4.3 POTENTIAL APPLICATIONS
There are a number of potential CFRP repair applications in which the termination of the CFRP
must be anchored in order to ensure adequate bond stresses are developed. Often these
anchorages result in complex or impractical details. The West Gate Bridge example (Figure 1.1)
provides one application of anchoring the top of CFRP web reinforcement in a flanged beam.
This application is not limited to box girders, but can be applied to any concrete beam where the
geometry allows for a CFRP strip to be placed on the web to act as shear reinforcement.
Splicing the CFRP to existing or post-installed internal reinforcing steel may provide an
alternative anchorage detail that is less cumbersome and more familiar to practitioners. Figure
4.1 shows two proposed in situ anchorages for externally bonded CFRP-strip web shear
reinforcement for T-beams. Figure 4.1a shows the strips anchored using through bolts. For this
detail it is recommended (REM Structural Limited, 2013) to drill anchorage bolts through the
entire compression zone (rather than using wedge or adhesive anchor bolts). Figure 4.1b shows a
U-anchor strategy, in which a groove is cut into either the top of the web or the bottom of the
flange, in which the CFRP strip is anchored around an embedded FRP or steel bar placed in the
groove.
Figure 4.2 shows a comparable detail implementing the CFRP-to-reinforcing steel splice
for shear reinforcement of a T-beam. The advantage of the CFRP-to-reinforcing steel splice
detail over the in situ details is the simplicity, ease of constructability, and the reduced concrete
volume removed. This can result in cost savings due to the reduction in construction efforts
needed to implement the anchorage as well as a relatively simplified design. For example, the
bolted anchorage shown in Figure 4.1a may require the removal of the asphalt wearing surface
on a bridge deck, to be replaced after construction. The U-anchor shown in Figure 4.1b would

63
require a significant effort to drill the groove and anchor the splice. The proposed anchorage
using a CFRP-to-reinforcing steel splice in Figure 4.2 would be simpler to construct and design;
only a drilling operation is required.
(a) Anchorage bolts drilled into compression zone. (b) U-wrap anchorage.
Figure 4.1 In situ anchorage methods for FRP web reinforcement in T-beams (REM Structural Limited, 2013).
(a) Proposed non-contact splice for T-beam. (b) Proposed contact lap splice for T-beam.
Figure 4.2 Proposed web reinforcement detail using CFRP-to-reinforcing steel splice.
Another potential application for CFRP-to-reinforcing steel applications is for beam-
column joints. An example of an in situ detail for CFRP reinforced beam-column joints is shown
in Figure 4.3. This detail has several disadvantages compared to the proposed comparable CFRP-
to-reinforcing steel detail in Figure 4.4. The in situ detail requires drilling through the entire

64
thickness of the overlaying slab in order to wrap the CFRP strips around the entire beam (Figure
4.3b), or even removal of the entire slab to expose the beam to be retrofitted. The proposed detail
(Figure 4.4) eliminates the need to drill through the slab or remove any significant volume of
concrete to construct, once again reducing construction and design efforts. An additional
disadvantage of the in situ details shown in Figure 4.3 is that they may increase the stiffness of
the beam-column joint, which may affect stress distribution and performance of the structure
particularly under seismic loading conditions. Such reinforcement may require additional retrofit
elsewhere along the load path.

65
(a) Shear reinforced beam-column joint. (b) Wrapping CFRP strips through slab.
(c) Removal of concrete volume.
Figure 4.3 In situ beam-column CFRP shear reinforcement details (Silva et al., 2009).
(a) Proposed non-contact lap splice for beam-column joint.
(b) Proposed contact lap splice for beam-column joint.
(c) Section F-F.
Figure 4.4 Proposed detail for beam-column joint shear reinforcement using CFRP-to-reinforcing steel splice.
The use of CFRP-to-reinforcing steel splices in reinforced concrete members has been
shown to be a viable option, where appropriate. This is advantageous due to the fact that
anchorage details in various applications can be significantly simplified, reducing both design
and construction efforts, resulting in reduced construction time and cost savings. With further
research and design provisions, CFRP-to-reinforcing steel splices are an attractive alternative for
shear reinforcement applications where in situ anchorage details are cumbersome and difficult to
construct.

66
APPENDIX A
EXAMPLE CALCULATIONS
The following are calculations for the in-situ requirements for minimum lap length for the #4 bar
used in this experiment.
ACI 318 §12.2.2
.in..
..d
'f
fb
c
ety 175050000125
010160000
25
ACI 318 §12.2.3
.in..in..
..
...
.d
dKc'f
fb
b
trb
set
c
y 0123750
50
0751
800101
500001
60000
40
3
40
3
AASHTO LRFD Bridge Design Specifications §5.11.2.1.1
.in..in.
..
'f
fd.
c
yb 0127125
6050950950
Effective bond length of CFRP (Chen and Teng, 2001):
.in.mm.x,
'f
tEL
c
ff
e 8719835
51000155

67
BIBLIOGRAPHY
American Concrete Institute (ACI) Committee 318 (2011) ACI 318-11 Building Code Requirements for Structural Concrete. ACI, Farmington Hills MI.
American Association of State Highway and Transportation Officials (AASHTO) (2010) AASHTO LFRD Bridge Design Specifications 5th edition. AASHTO, Washington DC.
Buyukozturk, O., Gunes, O. and Karaca, E. (2004) “Progress on Understanding Debonding Problems in Reinforced Concrete and Steel Members Strengthened Using FRP Composites.” Journal of Construction and Building Materials, Vol 18, pp 9-19.
Ceroni, F., and M. Pecce. (2008) Evaluation of Crack Spacing in RC Elements Externally Bonded with FRP. Fourth International Conference on FRP Composite in Civil Engineering, Zurich, Switzerland.
Chen, J.F., Teng, J.G. (2001) Anchorage Strength Models for FRP and Steel Plates Bonded to Concrete, ASCE Journal of Structural Engineering , Vol. 127, No.7, pp. 784-791.
Collins, Michael P., and Denis Mitchell. Prestressed Concrete Structures. Toronto: Response Publications, 1997.
"FRP Composite Technology." Remyapisal.com. REM Structural Limited, Web. Mar. 2013. http://www.remyapisal.com/index/frp.htm.
Harries, K.A., Ricles, J.M., Pessiki, S.P., and Sause, R. 2006. Seismic Retrofit of Lap-Splices in Non-Ductile Square Columns Using Carbon fiber-Reinforced Jackets, ACI Structures Journal. Vol. 103, No. 6 pp 874-884.
Jones, R, R N Swamy, and T H Ang. “Strengthening of under-reinforced concrete beams with mechanically attached steel plates.” International Journal of Cement Composites and Lightweight Concrete 4.1 (1982) : 21.
Kalfat, R. and Al-Mahaidi, R. (2010) Investigation into Bond Behaviour of a New CFRP Anchorage System for Concrete Utilizing a Mechanically Strengthened Substrate, Composite Structures Vol. 92, pp 2738-2746.
68
McLean, David I., and Smith, Carol L., Noncontact Lap Splices in Bridge Column-Shaft Connections, Research Report, WA-RD 417.1, Washington State Department of Transportation, 1997.
Oehlers, Deric John (2006). "FRP plates adhesively bonded to reinforced concrete beams: Generic debonding mechanisms". Advances in Structural Engineering (1369-4332)
Orangun, C.O., Jirsa, J.O., and Breen, J.E. (1977) A Reevaluation of Test Data on Development Length and Splices, ACI Journal Vol. 74-11, pp 114-122.
Ouezdou, M.B., Belarbi, A., Bae, S-W. (2009) Effective Bond Length of FRP Sheets Externally Bonded to Concrete, International Journal of Concrete Structures and Materials, Vol. 3, No. 2, pp 127-131.
Reeve, Benjamin Z., and Kent A. Harries. "Effect of Adhesive Stiffness and CFRP Geometry on the Behavior of Externally Bonded CFRP Retrofit Measures Subject to Monotonic Loads." Thesis. University of Pittsburgh, 2005.
Silva, Pedro F., Ayman S. Mosallam, and Chris Pantelides. "Seismic Strengthening of Concrete Buildings Using FRP Composites." ACI 440-F Subcommittee (2009).
Smith, S.T., and Teng, J.G. (2001). “FRP-Strengthened RC Beams. I: Review of Debonding Strength Models.” Engineering Structures 24 (2002), pp 385-395.
United States of America. U.S. Department of Transportation. Washington State Transportation Commission. Noncontact Lap Splices in Bridge Column-Shaft Connections. By David I. McLean and Carol L. Smith. Vol. 417.1. Pullman, WA: Washington State Transportation Commission, 1997.
Williams, G., Al-Mahaidi, R. and Kalfat, R. (2011) The West Gate Bridge: Strengthening of a 20th Century Bridge for 21st Century Loading, ACI Special Publication 275: Proceedings to the Tenth International Symposium on Fiber-Reinforced Polymer Reinforcement for Concrete Structures, Tampa, FL. Paper 275-72.