Embed Size (px)
Citation preview
Research Project Number: RES2020-20
FINAL REPORT
Investigating the Service of App-Based Rideshare and Transportation Network Companies
in Tennessee
Authored by: Cassidy Crossland, Graduate Student Research Assistant
Candace Brakewood, PhD, Principal Investigator Christopher Cherry, PhD, Co-Principal Investigator
Research Agency: University of Tennessee, Knoxville
Submission Date: June 25, 2021

i
DISCLAIMER
This research was funded through the State Planning and Research (SPR) Program by the Tennessee Department of Transportation and the Federal Highway Administration under RES2020-20: Investigating the Service of App-Based Rideshare and Transportation Network Companies in Tennessee. This document is disseminated under the sponsorship of the Tennessee Department of Transportation and the United States Department of Transportation in the interest of information exchange. The State of Tennessee and the United States Government assume no liability of its contents or use thereof. The contents of this report reflect the views of the author(s) who are solely responsible for the facts and accuracy of the material presented. The contents do not necessarily reflect the official views of the Tennessee Department of Transportation or the United States Department of Transportation.
ii
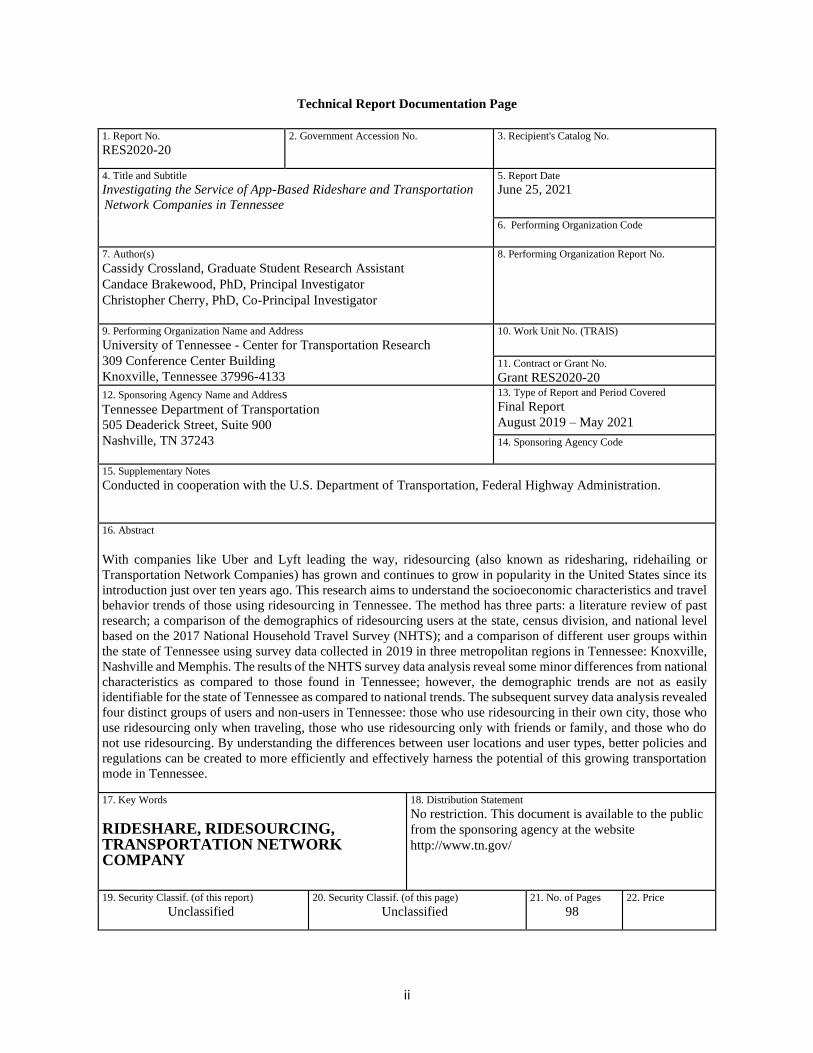
Technical Report Documentation Page
1. Report No.
RES2020-20 2. Government Accession No.
3. Recipient's Catalog No.
4. Title and Subtitle
Investigating the Service of App-Based Rideshare and Transportation
Network Companies in Tennessee
5. Report Date
June 25, 2021
6. Performing Organization Code
7. Author(s)
Cassidy Crossland, Graduate Student Research Assistant
Candace Brakewood, PhD, Principal Investigator
Christopher Cherry, PhD, Co-Principal Investigator
8. Performing Organization Report No.
9. Performing Organization Name and Address
University of Tennessee - Center for Transportation Research
309 Conference Center Building
Knoxville, Tennessee 37996-4133
10. Work Unit No. (TRAIS)
11. Contract or Grant No.
Grant RES2020-20 12. Sponsoring Agency Name and Address
Tennessee Department of Transportation
505 Deaderick Street, Suite 900
Nashville, TN 37243
13. Type of Report and Period Covered
Final Report
August 2019 – May 2021
14. Sponsoring Agency Code
15. Supplementary Notes
Conducted in cooperation with the U.S. Department of Transportation, Federal Highway Administration.
16. Abstract
With companies like Uber and Lyft leading the way, ridesourcing (also known as ridesharing, ridehailing or
Transportation Network Companies) has grown and continues to grow in popularity in the United States since its
introduction just over ten years ago. This research aims to understand the socioeconomic characteristics and travel
behavior trends of those using ridesourcing in Tennessee. The method has three parts: a literature review of past
research; a comparison of the demographics of ridesourcing users at the state, census division, and national level
based on the 2017 National Household Travel Survey (NHTS); and a comparison of different user groups within
the state of Tennessee using survey data collected in 2019 in three metropolitan regions in Tennessee: Knoxville,
Nashville and Memphis. The results of the NHTS survey data analysis reveal some minor differences from national
characteristics as compared to those found in Tennessee; however, the demographic trends are not as easily
identifiable for the state of Tennessee as compared to national trends. The subsequent survey data analysis revealed
four distinct groups of users and non-users in Tennessee: those who use ridesourcing in their own city, those who
use ridesourcing only when traveling, those who use ridesourcing only with friends or family, and those who do
not use ridesourcing. By understanding the differences between user locations and user types, better policies and
regulations can be created to more efficiently and effectively harness the potential of this growing transportation
mode in Tennessee.
17. Key Words
RIDESHARE, RIDESOURCING, TRANSPORTATION NETWORK COMPANY
18. Distribution Statement
No restriction. This document is available to the public
from the sponsoring agency at the website
http://www.tn.gov/
19. Security Classif. (of this report)
Unclassified 20. Security Classif. (of this page)
Unclassified 21. No. of Pages
98 22. Price

iii
Acknowledgements We are very grateful to the Tennessee Department of Transportation staff who provided input on this research project, particularly Brianna Benson from the Air Quality Office and Melanie Murphy from the Research Office. We would also like to acknowledge the U.S. Department of Transportation Federal Highway Administration (US DOT FHWA) for providing a 2020-2021 Dwight David Eisenhower Transportation Fellowship to Cassidy Crossland, the graduate student research assistant who co-authored this report. Thanks to Regina Clewlow and Stephanie Seki at Populus Technologies, Inc. for collecting the detailed survey data for Knoxville, Memphis and Nashville used in this report. Last, we would like to recognize University of Tennessee undergraduate research assistant Jonathan West, who assisted with assembling and analyzing data from the National Household Travel Survey.

iv
Executive Summary Ridesourcing, ridesharing, ridehailing, and transportation network companies are the terms used to describe companies that provide prearranged and on-demand transportation services in which drivers and passengers connect using smartphone applications. The two most common ridesourcing companies in the United States are Uber and Lyft. Over the past decade, these companies have experienced dramatic growth, and there is currently limited understanding of how people are using ridesourcing services and how they are affecting urban transportation systems. In particular, most prior research to date has focused on large metropolitan areas where ridesourcing has been in service the longest. Research to understand users in and the impacts of ridesourcing in smaller cities and states is not as extensive. This report begins to address this research need by conducting a detailed study of ridehailing users in the state of Tennessee. To do this, three research objectives were set forth, which are as follows:
• Objective 1: Understand the use of ridesourcing in Tennessee and capture overall adoption rates of ridesourcing in the state.
• Objective 2: Investigate the demographics and choices of ridesourcing users.
• Objective 3: Assess the effects of ridesourcing on existing urban transportation systems. To fulfill these objectives, a three-part method was used, and the results are briefly described in the following paragraphs. 1. Comprehensive Literature Review on Ridesourcing in North America
First, a comprehensive literature review was conducted of 44 studies from North America. The results of the literature review reveal six main ridesourcing user-focused categories in the prior research: demographics; frequency and time of use; trip purpose; reason for using ridesourcing services; relationship between ridesourcing and other modes; and transportation system impacts. The prior research pertaining to demographics revealed that ridesourcing users are likely younger with higher incomes and education levels, are full-time students or employed, and live in urban areas. Similarly, most ridesourcing trips occur on weekends and at night, with the most common trip purpose being for social events. Additional findings are summarized in Chapter 2 of this report.
2. Analysis of the 2017 National Household Travel Survey (NHTS)
Next, statistical analysis of the demographics of ridesharing users was conducted at the state, census division, and national level using the 2017 National Household Travel Survey (NHTS). The results of the NHTS analysis revealed that those who have purchased a ride with a rideshare app in Tennessee tend to have higher income levels, live in urban areas, be from smaller households, and are employed. While these results generally align with the findings in the previous literature, there were fewer statistically significant socioeconomic characteristics at the state level as compared to the regional and national level, making trends somewhat more difficult to identify for Tennessee. Additional findings are summarized in Chapter 3 of this report.
3. Survey of Ridehailing Users and Non-Users in Tennessee Detailed survey data about ridehailing were collected in 2019 for three metropolitan regions in Tennessee: Knoxville, Nashville and Memphis. The survey results were used to propose a ridehailing user typology based on socioeconomic, attitudinal, and neighborhood preference variables. Four distinct user and non-user types were identified: young urban local users, wealthy travelers, tagalong users, and non-users. The first type is comprised of those who use ridehailing locally; they

v
are typically younger, have higher incomes, and use ridesourcing primarily for social purposes. The second type includes those who use ridehailing when traveling; these users tend to be slightly older and have higher education and income levels. The third type includes those who ride with friends/family; they tend to be younger, female, and/or black, and we coined the term “tagalong users” to describe this group. The fourth and largest group is non-users; they tend to be older, live in rural areas, and have lower income levels. Additional findings from this survey can be found in Chapter 4 of this report.
Based on the results of this research, the following three recommendations were made. 1. Assess and standardize ridesourcing terminology
As is evident from this report, many different terms are currently being used to describe on-demand ride services provided by companies such as Uber and Lyft. Recently, the Society of Automotive Engineers International (SAE) set forth guidance that recommends using the term ridesourcing. However, this term does not appear to have widespread recognition from users. Assessing which term is most recognizable to users (particularly in Tennessee) and then consistently using that terminology is recommended.
2. Collect, compare, and improve ridesourcing survey questions Another recommendation is to collect, compare, and improve ridesourcing survey questions, particularly within the state of Tennessee. To more easily compare national surveys such as NHTS with local surveys conducted in Tennessee, there should be consistent question wording. If numerous existing questionnaires asking about ridesourcing are assembled, they could be used to create a ridesourcing survey question database. This has been done at the national level for bikeshare survey questions, which could be used as a model.
3. Apply good curb space management principles in targeted locations Based on the user and non-user typology proposed in this report, there are two primary markets of ridesourcing users in Tennessee that should be considered in local curb space management decisions. Young, urban local users are likely to make trips to locations with lots of restaurants, bars and other social venues, which are often concentrated in downtown areas. Similarly, the wealthy travelers group will likely make trips to the airport, convention centers, and hotels. Higher volumes of ridesourcing pick-ups and drop-offs will be experienced at these locations, which necessitates good curb space management principles, such as dedicated loading zones and increased signage.

vi
List of Acronyms The following is a list of acronyms used in this report.
• ACS: American Community Survey
• COVID-19: Coronavirus Disease 2019 • MADD: Mothers Against Drunk Driving • NACTO: National Association of City Transportation Officials • NHTS: National Household Travel Survey • TNC: Transportation Network Company • SAE: Society of Automotive Engineers • VMT: Vehicle Miles Traveled • VHD: Vehicle Hours of Delay

vii
Dissemination Plan
An important part of research is dissemination of the methods and results to other researchers and practitioners. The following is a list of research products that are associated with this project. Additional venues for dissemination of the research findings will be added in the future as appropriate. Posters and Presentations
• Crossland and Brakewood (2021). A Literature Review on Ridesourcing in North America. Poster presentation at the 100th Annual Meeting of the Transportation Research Board, Virtual event on January 25, 2021.
o Description: Poster can be found in Appendix 1.
• Crossland and Brakewood (2021). Marketing Mobility as a Service: Insights from the National Household Travel Survey. Poster presentation at the 100th Annual Meeting of the Transportation Research Board, Virtual event on January 25, 2021.
o Description: Poster can be found in Appendix 2.
• Crossland, Brakewood and Cherry (2021). Investigating the Service of App-based Rideshare and Transportation Network Companies in Tennessee, Poster Presentation at the TDOT Innovation to Implementation Forum, Virtual event on March 31, 2021.
o Description: Poster can be found in Appendix 3. Journal Papers and Conference Proceedings
• Crossland and Brakewood. Literature Review on Ridesourcing Users’ Travel Behavior in North America. Journal paper under review.
o Description: Paper adapted from the results of Chapter 2.
• Crossland and Brakewood (2021). Marketing Mobility as a Service. Insights from the National Household Travel Survey. Proceedings of the 100th Annual Meeting of the Transportation Research Board, National Academies of Science, Engineering and Medicine, Washington, DC.
o Description: Paper expanding the analysis found in Chapter 3.
• Crossland, Brakewood, and Cherry. Four Types of Ridesourcing Users? A Proposed Typology for Ridesourcing Using Survey Data from Tennessee. Journal paper under review.
o Description: Paper adapted from the results of Chapter 4. Theses and Dissertations
• Crossland (2021). Using Survey Data to Understand Ridesourcing in Tennessee: Who, Where, When, and Why? Master’s Thesis, The University of Tennessee, Knoxville.
o Description: Master’s thesis adapted from all chapters in this report.

viii
Table of Contents
Acknowledgements .............................................................................................................................................. iii
Executive Summary .............................................................................................................................................. iv
List of Acronyms ................................................................................................................................................... vi
Dissemination Plan .............................................................................................................................................. vii
List of Tables .......................................................................................................................................................... x
List of Figures ........................................................................................................................................................ xi
1 Introduction .................................................................................................................................................. 1
1.1 Background .................................................................................................................................................. 1
1.2 Objectives ..................................................................................................................................................... 1
1.3 Scope of Work .............................................................................................................................................. 2
1.4 Structure of the Report ................................................................................................................................. 2
2 Literature Review .......................................................................................................................................... 4
2.1 Method for the Literature Review ................................................................................................................ 4
2.2 Results of the Literature Review ................................................................................................................... 4 2.2.1 Theme 1: Demographics of Ridesourcing Users ....................................................................................... 7 2.2.2 Theme 2: Frequency and Time of Use of Ridesourcing ............................................................................ 7 2.2.3 Theme 3: Ridesourcing Trip Purpose ........................................................................................................ 7 2.2.4 Theme 4: Reasons for Using Ridesourcing ............................................................................................... 8 2.2.5 Theme 5: Ridesourcing Relationship with Other Transportation Modes ................................................. 8 2.2.6 Theme 6: Ridesourcing Trip Purpose ........................................................................................................ 8
2.3 Conclusions and Future Research from the Literature Review ..................................................................... 9
3 National Household Travel Survey (NHTS) Ridesharing Analysis .................................................................. 12
3.1 NHTS Data and Methodology..................................................................................................................... 12 3.1.1 Assemble 2017 NHTS Data..................................................................................................................... 12 3.1.2 Calculate Statistics ................................................................................................................................. 13 3.1.3 Binary Logit Analysis .............................................................................................................................. 14
3.2 NHTS Results .............................................................................................................................................. 14 3.2.1 NHTS Summary Statistics (Unweighted) ................................................................................................ 14 3.2.2 NHTS Cross Tabulations (Unweighted) .................................................................................................. 15 3.2.3 NHTS Logit Model Results (Unweighted) ............................................................................................... 22
3.3 Conclusions and Future Research from the NHTS Analysis ........................................................................ 25
4 Survey of Ridehailing Users and Non-Users in Tennessee ............................................................................ 26
4.1 Tennessee Survey Data and Methodology ................................................................................................. 26
4.2 Results of the Survey for Tennessee ........................................................................................................... 27
ix
4.2.1 Results of the Ridehailing Familiarity and Adoption Survey Question ................................................... 27 4.2.2 Results of the Socioeconomic Survey Questions .................................................................................... 29 4.2.3 Results of the Attitudinal Survey Questions ........................................................................................... 35 4.2.4 Results of the Neighborhood Preference Survey Questions ................................................................... 37 4.2.5 Results of the Last Ridehailing Trip Survey Questions ............................................................................ 39 4.2.6 Results of the Reasons for Not Using Ridehailing Survey Questions ...................................................... 41 4.2.7 Results of the Multinomial Logit Models ............................................................................................... 42
4.3 Conclusions and Future Research from the Survey for Tennessee ............................................................. 44 4.3.1 Type 1: Young Urban Local Users ........................................................................................................... 44 4.3.2 Type 2: Wealthy Travelers...................................................................................................................... 44 4.3.3 Type 3: Tagalong Users .......................................................................................................................... 44 4.3.4 Type 4: Non-Users .................................................................................................................................. 44
5 Conclusions, Future Research and Recommendations ................................................................................. 47
5.1 Comparison and Conclusions...................................................................................................................... 47
5.2 Areas for Improvement and Future Research ............................................................................................ 48
5.3 Recommendations ...................................................................................................................................... 49
References ........................................................................................................................................................... 51
A1 Poster Presentation at the 2021 TRB Annual Meeting (TRBAM-21-20400) .............................................. 56
A2 Poster Presentation at the 2021 TRB Annual Meeting (TRBAM-21-01661) .............................................. 57
A3 Poster Presentation at the 2021 TDOT Innovation to Implementation Forum ......................................... 58
A4 Tables from Literature Review ................................................................................................................ 59
A5 Additional NHTS Results (Weighted) ....................................................................................................... 68
NHTS Summary Statistics (Weighted) ..................................................................................................................... 68 Taxi or Ridesharing Frequency of Use Summary Statistics (Weighted) ............................................................... 68 Ridesharing App Usage Summary Statistics (Weighted) ..................................................................................... 68
NHTS Cross Tabulations (Weighted) ........................................................................................................................ 69 Taxi or Ridesharing Frequency of Use Cross Tabulation (Weighted) .................................................................. 69 Ridesharing App Usage Cross Tabulation (Weighted) ........................................................................................ 73
A6 Additional Survey Results for Tennessee ................................................................................................. 77
Results of Additional Ridehailing Survey Questions ................................................................................................ 77
Results of Ridehailing Impacts on Vehicle Ownership and Mode Choice Survey Questions .................................... 79
Results of Ridehailing Driver Survey Questions ....................................................................................................... 82

x
List of Tables Table 1-1: Summary of Data, Dates, Terminology, Location and Methods in this Report (Chapters 2-4) ... 3 Table 2-1: Distribution of Papers and Reports by Year and Topic ................................................................ 5 Table 3-1: How Often Do You Use Taxi Services or Rideshare to Get from Place to Place? NHTS Cross Tabulation (Unweighted) ............................................................................................................................ 17 Table 3-2: In the Past 30 Days, How Many Times have you Purchased a Ride with a Smartphone Rideshare App? NHTS Cross Tabulation (Unweighted) .............................................................................. 20 Table 3-3: NHTS Taxi or Ridesharing Use Question Binary Logit Models ................................................... 23 Table 3-4: NHTS Ridesharing App Usage Question Binary Logit Models .................................................... 24 Table 3-5: Comparison of NHTS Model Results with Literature Review Results ........................................ 25 Table 4-1: Last Ridehailing Trip for Those Using Ridehailing in/Around the City and Only When Traveling .................................................................................................................................................................... 40 Table 4-2: Multinomial Model Results ........................................................................................................ 43 Table 5-1: Comparison of the Data, Dates, Terminology, Location, Methods and Findings from this Report ......................................................................................................................................................... 48 Table A4-1: Literature Review Findings on Demographics ......................................................................... 59 Table A4-2: Literature Review Findings on Frequency and Time of Use .................................................... 61 Table A4-3: Literature Review Findings on Trip Purpose ............................................................................ 63 Table A4-4: Literature Review Findings on Reasons for Using Ridesourcing .............................................. 64 Table A4-5: Literature Review Findings on Ridesourcing Relationship with Other Modes ........................ 65 Table A4-6: Literature Review Findings on Transportation System Impacts .............................................. 66 Table A5-1: How Often do you use Taxi Services or Rideshare to get from Place to Place? Cross Tabulation (Weighted) ................................................................................................................................ 70 Table A5-2: In the Past 30 Days, How Many Times have you Purchased a Ride with a Smartphone Rideshare App? Cross Tabulation (Weighted) ............................................................................................ 74

xi
List of Figures Figure 2-1: Summary of Literature Review Findings by Theme .................................................................. 10 Figure 3-1: Taxi or Ridesharing Frequency of Use Question from NHTS Recruitment Survey (USDOT, 2018) ........................................................................................................................................................... 12 Figure 3-2: Ridesharing App Usage over the Past 30 Days from NHTS Retrieval Survey (Westat, 2018) .. 13 Figure 3-3: Taxi and Ridesharing Frequency of Use, Unweighted NHTS Responses .................................. 14 Figure 3-4: Rideshare App Usage Over the Past 30 Days, Unweighted NHTS Responses .......................... 15 Figure 4-1: Survey Respondents by Metro Area ......................................................................................... 26 Figure 4-2: Ridehailing Familiarity and Adoption Question ........................................................................ 28 Figure 4-3: Ridehailing Familiarity and Adoption Question by Metro Area ............................................... 28 Figure 4-4: Ridehailing User Socioeconomic Questions Part 1 ................................................................... 30 Figure 4-5: Ridehailing User Socioeconomic Questions Part 2 ................................................................... 32 Figure 4-6: Ridehailing User Socioeconomic Questions Part 3 ................................................................... 34 Figure 4-7: Ridehailing User Attitudinal Questions ..................................................................................... 36 Figure 4-8: Ridehailing User Neighborhood Preference Questions ............................................................ 38 Figure 4-9: Reasons for Not Using Ridehailing ............................................................................................ 41 Figure 4-10: Summary of the Four Ridehailing User Types......................................................................... 45 Figure A5-1: Taxi and Rideshare Frequency of Use Responses (Weighted) ............................................... 68 Figure A5-2: Rideshare App Usage Over the Past 30 Days Responses (Weighted) .................................... 68 Figure A6-1: Results of Additional Ridehailing Questions........................................................................... 78 Figure A6-2: Impact of Ridehailing on Vehicle Ownership Decisions ......................................................... 80 Figure A6-3: Impact of Ridehailing on Personal Driving ............................................................................. 80 Figure A6-4: Impact of Ridehailing on Other Modes of Transportation Questions .................................... 81 Figure A6-5: Has Been a Driver For … ......................................................................................................... 83 Figure A6-6: Average Number of Days Driven for Uber, Lyft, or Other on-Demand Ride Service in the Past Three Months .............................................................................................................................................. 83 Figure A6-7: Ridehailing Driver Time Related Questions ............................................................................ 84 Figure A6-8: Active Driver Survey Questions .............................................................................................. 85 Figure A6-9: Non-Active Driver Survey Questions ...................................................................................... 86
1 Introduction
1.1 Background Ridesourcing, ridesharing, ridehailing, and transportation network companies are the terms used to describe companies that provide “prearranged (services) and on-demand transportation services for compensation in which drivers and passengers connect via digital applications” (SAE, 2018). These on-demand services “add flexibility to rideshare arrangements by allowing drivers and passengers to arrange occasional shared rides ahead of time or on short notice” (Amey, Attanucci, & Mishalani, 2011). Per guidance from Society of Automotive Engineers International (SAE), the term ridesourcing will be used throughout this report, except when describing results from a study or describing responses to survey questions that use one of the other terms previously listed.
The two most common ridesourcing companies in the United States are Uber and Lyft, which launched in 2009 and 2012, respectively (Blystone, 2019; Greiner, McFarland, Sherman, & Tse, 2019). Ridesourcing is rapidly growing in popularity across not only the United States, but the entire world, with both Uber and Lyft completing one billion rides within their first six years of service (Lyft, 2018; Uber, 2018). Given the dramatic growth of these companies over a very short time, there is currently limited understanding of how people are using ridesourcing services and how they are affecting urban transportation systems. In particular, most prior research to date has focused on large metropolitan areas where ridesourcing has been in service the longest. Research to understand users in and the impacts of ridesourcing in smaller cities and states is not as extensive. This report begins to fill this gap in the research by conducting a detailed study of ridehailing users in the state of Tennessee.
As noted in the previous paragraph, ridesourcing services are provided by privately-operated transportation network companies (TNCs), such Uber and Lyft. These companies are often reluctant to share their data with external organizations. While some limited progress has been made to facilitate data sharing, there are currently very few publicly available ridesourcing datasets outside of a small number of large metropolitan areas like New York City and Chicago (Chicago 2021; TLC 2021). In light of the limited availability of ridesourcing data, this study investigates ridesourcing in the state of Tennessee using new, survey-based datasets. The specific objectives of this report are discussed in the following section.
1.2 Objectives The overarching goal of this project was to inform the Tennessee Department of Transportation (TDOT) about use of ridesourcing throughout the state. To achieve this goal, three specific objectives were set forth, which are as follows:
• Objective 1: The first objective was to understand the use of ridesourcing in Tennessee and capture overall adoption rates of ridesourcing in the state. A special emphasis was placed on understanding utilization levels in large metropolitan areas (i.e., Nashville, Memphis and Knoxville), since ridesourcing services have been available for longer in these areas.
• Objective 2: The second objective was to understand the demographics and choices of ridesourcing users. This included identifying (a) the demographics of ridesourcing users; (b) the purposes/reasons they are traveling (e.g., to the airport, to social activities); and (c) why they are choosing ridesourcing (e.g., attitudinal factors).
• Objective 3: The third objective was to assess the effects of ridesourcing on existing urban transportation systems. For example, survey data were used to assess which mode(s) of transportation ridesourcing users have replaced (e.g., taking a ridesourcing trip instead of transit).

2
1.3 Scope of Work The scope of work for this project was divided into five parts, which are briefly described below.
• Part 1: Review of ridesourcing related literature and reports First, a review of prior work related to ridesourcing was conducted. Because ridesourcing is a rapidly growing transportation mode, new studies and reports are published on a regular basis, both in academia and in industry. In light of this fast-paced environment, a comprehensive literature review was conducted, and the results are presented in Chapter 2.
• Part 2: Analyze new National Household Travel Survey (NHTS) rideshare questions In the second part of the project, the most recent (2017) National Household Travel Survey (NHTS) was used to assess rideshare usage in the state of Tennessee. In the latest NHTS questionnaire, two new survey questions were added that pertain to ridesharing; notably, these survey questions specifically used the term ridesharing (not ridesourcing). These new questions provide baseline data about rideshare use across Tennessee and were compared to NHTS regional and nationwide statistics. The results are presented in Chapter 3.
• Part 3: Collect and analyze detailed ridehailing survey data for Tennessee While the NHTS provides baseline data, it does not include highly detailed information about ridesourcing users, which was necessary to fulfill the project objectives. To conduct a deeper dive, detailed survey data were collected in three metropolitan areas (Nashville, Knoxville, and Memphis) by a San Francisco-based company called Populus Technologies, Inc., which has experience conducting similar surveys throughout the country. The raw survey data were purchased by the research team and analyzed to conduct a detailed assessment for Tennessee. Notably, this survey used the term ridehailing (not ridesourcing). The results are presented in Chapter 4.
• Part 4: Compare the two survey datasets for Tennessee The findings for Tennessee from the two datasets (the NHTS in Part 2 and the Populus survey data in Part 3) were summarized and compared. This is presented in Chapter 5.
• Part 5: Write summary and recommendations The results of all parts of this project were compiled into this final report, and important areas for future research and recommendations for TDOT were identified. This is presented in Chapter 5.
1.4 Structure of the Report The report is organized as follows. Chapter 2 provides an extensive literature review on ridesourcing in North America. Chapter 3 presents the results of the 2017 National Household Travel Survey analysis for Tennessee. Chapter 4 describes the results of Populus Technologies, Inc. survey analysis. Chapter 5 presents conclusions, areas for future research and recommendations. Additional analyses are included in the Appendices.
The structure of the body of the report is summarized in Table 1 on the following page. This presents a high-level comparison of the different data sources, dates, terminology (ridesourcing vs. ridesharing vs. ridehailing), location and methods used in each chapter.

3
Table 1-1: Summary of Data, Dates, Terminology, Location and Methods in this Report (Chapters 2-4)
Chapter Data Source Collection Date Terminology Location Methodology
Chapter 2 Previous Literature
Studies published between 2015 and 2020
Ridesourcing (whichever term used in each study is used)
Varied from study to study; mostly national, state, and large metropolitan areas
Literature Review
Chapter 3
National Household Travel Survey (NHTS)
2016-2017 Ridesharing National, Census Division, State
Summary Statistics Binary Logit Model
Chapter 4
Survey from Populus Technologies, Inc.
2019 Ridehailing Knoxville, Memphis, and Nashville, Tennessee
Summary Statistics Multinomial Logit Model

4
2 Literature Review This chapter provides a systematic review of the studies and reports about the travel behavior of ridesourcing users focusing on studies published in North America. The chapter is organized as follows: first, the review methodology is laid out, then an overview of the results of the comprehensive review are described followed by an in-depth description of the six main categories relating to ridesourcing users. These include demographics; frequency and time of use; trip purpose; reason for choosing ridesourcing; relationship between ridesourcing and other transportation modes; and transportation system impacts. This chapter concludes with areas for future research and a summary.
2.1 Method for the Literature Review This section provides a brief description of the method used to conduct the literature review. The primary search engine was Google Scholar. The key words searched to find articles included ridehailing, ridesourcing, ridesharing, transportation network companies, Uber, and Lyft. This resulted in roughly 250 papers. The selection was narrowed further by only including papers published after 2009 when ridesourcing companies entered the American market. Only sources with a study area in the United States or Canada were then selected, since these were deemed most relevant to TDOT. The studies also had to pertain to the users of the ridesourcing services or the transportation system usage impacts. Studies that focused on regulation, environmental impacts, and business models were not selected because this paper is focused on traveler demographics and behaviors. It should be noted that the research team identified one relevant published literature on ridesourcing (Tirachini, 2019). This prior study had some overlap with the literature review that follows; however, it considered many international studies and some topics beyond the scope of this report.
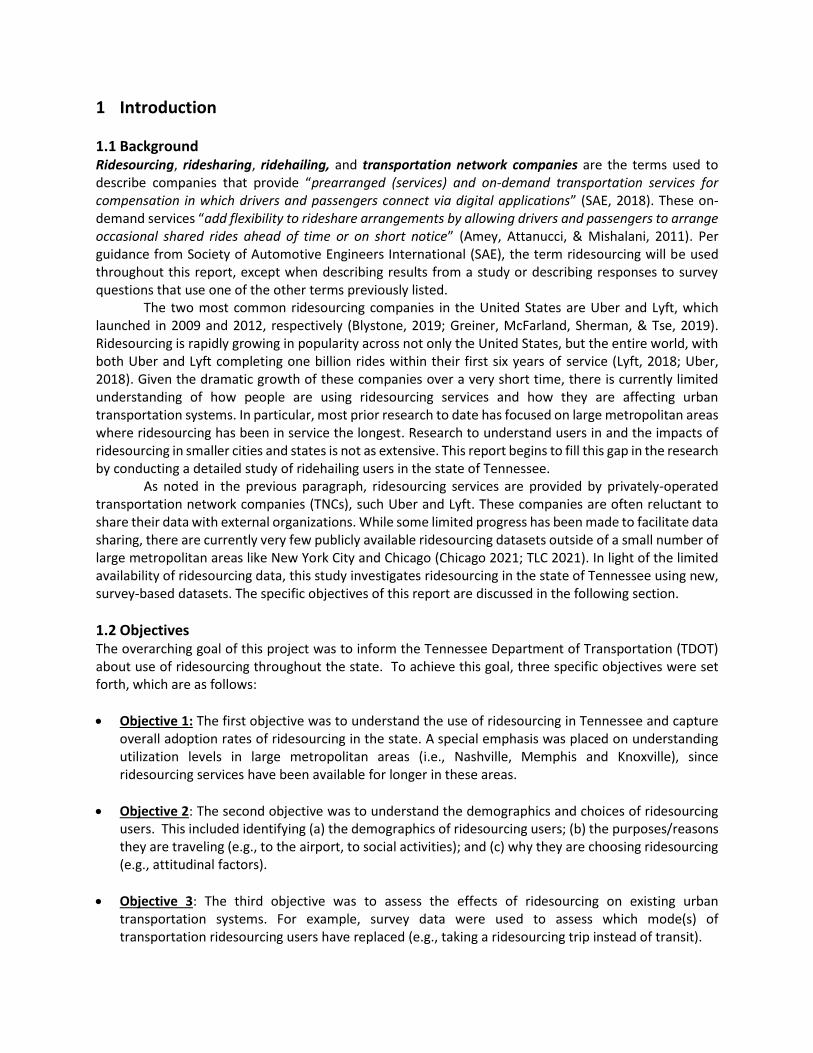
2.2 Results of the Literature Review A total of 44 journal articles and reports from 2015 to 2020 were included in this review, and the results are summarized in Table 2-1. As shown in Table 2-1, one article was published in 2015, three were published in 2016, four were published in 2017, 15 were published in 2018, 14 were published in 2019, and eight were published in 2020 (through May 2020). The increasing frequency of publications reflects the growing interest of researchers in this important and expanding field.
The location of each study is also provided in Table 2-1. Of the 44 articles and reports, 16 had a study area of the United States or multiple major cities across the United States. Nine studies used state-level data, with four of these being in California. The remaining 19 studies focused on specific cities. Seven studies investigated cities in California; specifically, five in San Francisco and two in Los Angeles. New York City was the focus of five studies while Toronto was used for two additional studies. Denver, Chicago, Philadelphia, and Dallas were each the subject for one study. The final report looked at many cities around the world; however, for the purpose of this literature review, only the cities in the United States and Canada were used in the findings.
Next, the studies were categorized based on key topics pertaining to the travel behavior of ridesourcing users. The categories that were identified included demographics; frequency and time of use; trip purpose; reason for using ridesourcing; relationship between ridesourcing and other modes; and transportation system impacts. The most frequently studied category within the literature was demographics, and results relating to ridesourcing user demographics were reported in 23 studies, as seen in Table 2-1. Frequency and time of use results were reported in 14 studies. Nine studies included trip purpose. Reasons for using ridesourcing was analyzed in six studies. The relationship between ridesourcing and other modes of transportation was investigated in 16 studies. Transportation system impacts were discussed in 18 studies. Each category is discussed in more detail in the following sections.

5
Table 2-1: Distribution of Papers and Reports by Year and Topic
Yr Author Location Demographics Frequency
and Use Trip
Purpose Reasons
Other Modes
System Impacts
Total Studied
20
15
(MADD, 2015) United States
3
20
16
(Circella, Tiedeman, Handy, Alemi, & Mokhtarian, 2016)
California 2
(Rayle, Dai, Chan, Cervero, & Shaheen, 2016)
San Francisco 4
(Smith, 2016) United States 2
20
17
(Clewlow & Mishra, 2017) United States 3
(Henao, 2017) Denver 2
(Mahmoudifard, Kermanshah, Shabanpour, & Mohammadian, 2017)
Chicago 4
(Schaller, 2017) New York 2
20
18
(Alemi, Circella, Handy, & Mokhtarian, 2018)
California 2
(Brodeur & Nield, 2018) New York 1
(Castiglione et al., 2018) San Francisco 1
(Chu, Hamza, & Laberteaux, 2018)
United States 2
(Circella, Alemi, Tiedeman, Handy, & Mokhtarian, 2018)
California 3
(Cooper, Castiglione, Mislove, & Wilson, 2018)
San Francisco 2
(Feigon & Murphy, 2018) United States 4
(Gehrke & Reardon, 2018) Massachusetts 1
(Gehrke, Felix, & Reardon, 2018)
Massachusetts 4
(Gerte, Konduri, & Eluru, 2018)
New York 3
(Hall, Palsson, & Price, 2018) United States 2
(Lahkar, 2018) Virginia 1
(Lee, Jin, Animesh, & Ramaprasad, 2018)
United States 2
(Schaller, 2018) United States 3
20
19
(Bischak, 2019) Texas 2
(Brown, 2019) Los Angeles 2
(Deka & Fei, 2019) United States 2
(Erhardt et al., 2019) San Francisco 2
(Felix & Pollack, 2019) Massachusetts 1
(Grahn, Harper, Hendrickson, Qian, & Matthews, 2019)
United States 1
(Habib, 2019) Toronto 2
(Joshi, Cowan, Limone, McGuinness, & Rao, 2019)
Major Cities Worldwide
1
(Lavieri & Bhat, 2019) Dallas 3
(Mitra, Bae, & Ritchie, 2019) United States 1
(Sikder, 2019) United States 1
(Sturgeon, 2019) San Francisco 1
(Young & Farber, 2019) Toronto 1
(Zheng, 2019) New York 2
6
Table 2-1 (continued…): Distribution of Papers and Reports by Year and Topic 2
02
0*
(Bansal, Sinha, Dua, & Daziano, 2020)
United States 1
(Brown, 2020) Los Angeles 2
(Dong, 2020) Philadelphia 2
(Fulton, Brown, & Compostella, 2020)
California 1
(Jiao, Bischak, & Hyden, 2020) United States 2
(Qian, Lei, Xue, Lei, & Ukkusuri, 2020)
Manhattan 1
(Sabouri, Brewer, & Ewing, 2020)
United States 1
(Sabouri, Park, Smith, Tian, & Ewing, 2020)
United States 1
Total Number of Studies per Topic 23 14 9 6 16 18 86**
*Studies published through May 2020; does not include June to December 2020. **Studies counted more than once.
Note: Adapted from “Literature Review on Ridesourcing Users’ Travel Behavior in North America” by Crossland & Brakewood.

7
2.2.1 Theme 1: Demographics of Ridesourcing Users The demographics of ridesourcing users was one of the six topics identified in numerous prior studies. Of the 44 studies, 23 (52%) contained results pertaining to the demographics of ridesourcing users (Alemi et al., 2018; Bansal et al., 2020; Brown, 2019, 2020; Chu et al., 2018; Circella et al., 2018; Circella et al., 2016; Clewlow & Mishra, 2017; Deka & Fei, 2019; Dong, 2020; Feigon & Murphy, 2018; Felix & Pollack, 2019; Gehrke et al., 2018; Gerte et al., 2018; Grahn et al., 2019; Jiao et al., 2020; Lahkar, 2018; Mahmoudifard et al., 2017; Mitra et al., 2019; Sabouri, Park, et al., 2020; Schaller, 2018; Smith, 2016; Young & Farber, 2019). These studies are summarized in Table A4-1 in the Appendix.
Commonly considered demographic characteristics include age, household income, education level, location of home, employment status, race, and gender. Age was evaluated in 18 of the 23 studies (78%), and the results revealed that the most common generation using ridesourcing was millennials. People born between 1981 and 1996 are considered millennials; currently this generation is between the ages of 24 and 39 (Dimock, 2019). Household income was addressed in 14 studies; the results indicated that ridesourcing users generally had higher income levels. Nine studies considered education level among ridesourcing users, and eight of those concluded that ridesourcing users were likely to have a higher level of education. The eight studies relating to location found ridesourcing usage occurred more frequently in dense, urban areas. Six studies evaluated the employment status of ridesourcing users, and the findings generally indicated that users were employed (either full- or part-time) or were students. Six studies presented findings related to race, with several of the studies concluding that many ridesourcing users were white. Gender was a focus in just four studies; these concluded that males were more likely to use ridesourcing services than females.
2.2.2 Theme 2: Frequency and Time of Use of Ridesourcing Frequency and time of use of ridesourcing was evaluated in 14 (32%) studies (Bischak, 2019; Brown, 2019, 2020; Circella et al., 2018; Cooper et al., 2018; Deka & Fei, 2019; Feigon & Murphy, 2018; Gehrke et al., 2018; Gerte et al., 2018; Lavieri & Bhat, 2019; MADD, 2015; Rayle et al., 2016; Schaller, 2017; Smith, 2016). These studies are summarized in Table A4-2 in the Appendix.
Commonly considered frequency and time of use characteristics include time of day, day of week, how often ridesourcing was used, trip length, and time of year. Eight of these studies contained findings related to the time of day that ridesourcing was used; the two most common times were during commute hours and late at night. Six studies considered which day of the week ridesourcing was used most frequently; five of those studies found that the weekends were the days with the highest demand for ridesourcing services. Five studies looked at how frequently ridesourcing services were used; these studies found different percentages, which makes it difficult to draw consistent conclusions. While one study found that 66% of respondents used ridesourcing at least once a week, another found that 84% of respondents used it a few times a month or even less frequently. These disparities may be due to the studies being completed in different areas of the country or for different geographic areas, such as a city versus a state. Two studies considered trip length. One found the average ridesourcing trip length to be between 2.2 and 3.1 miles while the other found that shared ridesourcing trips were one mile shorter on average than regular ridesourcing trips. Finally, one study reported on seasonal changes in ridesourcing use and found ridesourcing to be used more in the winter and less in the summer, as compared to spring and autumn.
2.2.3 Theme 3: Ridesourcing Trip Purpose The next category identified in the literature review pertained to the trip purpose of ridesourcing. Five typical trip purposes were found in the literature: going out or social events, to from the home, work trips and commuting, other, and to and from the airport. These studies are summarized in Table A4-3 in the

8
Appendix. Table A4-3 reveals that nine studies (20%) contain conclusions broadly related to ridesourcing trip
purpose (Bischak, 2019; Erhardt et al., 2019; Gehrke et al., 2018; Habib, 2019; Henao, 2017; Lavieri & Bhat, 2019; MADD, 2015; Mahmoudifard et al., 2017; Rayle et al., 2016). Five of the studies found that ridesourcing was commonly used for non-work or social events. Three studies focused on trips to and from the home; two of these studies reported that ridesourcing was more likely to be used to return home while the third study found that more ridesourcing trips were used to leave rather than return home. Two studies considered ridesourcing for travel to/from the workplace and found that between 13 and 17 percent of ridesourcing trips were associated with this type of travel. Two studies had findings related to trip purpose that were categorized as other. The first found that ridesourcing trips were concentrated in the downtown area while the other found that women were less likely to use ridesourcing to run errands than males. One study revealed that 12% of trips ended at an airport.
2.2.4 Theme 4: Reasons for Using Ridesourcing Six studies (14% of the 44 total studies) considered the motivations that led a traveler to choose ridesourcing (Circella et al., 2018; Clewlow & Mishra, 2017; Feigon & Murphy, 2018; MADD, 2015; Mahmoudifard et al., 2017; Rayle et al., 2016). These studies are summarized in Table A4-4 in the Appendix.
Table A4-4 identifies commonly considered reasons for choosing ridesourcing: not having to pay or search for parking, faster travel times, not driving while under the influence, ease of payment, wait time, and other. Difficulty finding parking or the expense of parking was the primary reason for selecting ridesourcing in three studies. Three additional studies found the important reason for selecting ridesourcing was shorter travel times since users were picked up and dropped off directly at their destinations. Three studies concluded that not driving while under the influence of alcohol or drugs was the main motivation when travelers opted for ridesourcing. Shorter wait times were an important aspect of choosing to use ridesourcing services in two other studies. Ease of payment on ridesourcing applications was a top consideration when choosing this mode of transportation for travelers in one study.
2.2.5 Theme 5: Ridesourcing Relationship with Other Transportation Modes A total of 16 studies (36%) compared ridesourcing services to other modes of transportation to identify complementary or substitutionary relationships (Chu et al., 2018; Clewlow & Mishra, 2017; Dong, 2020; Feigon & Murphy, 2018; Fulton et al., 2020; Gehrke et al., 2018; Gerte et al., 2018; Habib, 2019; Hall et al., 2018; Lavieri & Bhat, 2019; Lee et al., 2018; Mahmoudifard et al., 2017; Schaller, 2018; Sikder, 2019; Sturgeon, 2019; Zheng, 2019). These studies are summarized in Table A4-5 in the Appendix.
As seen in Table A4-5, the other modes of transportation compared to ridesourcing were taxi, public transit, personal car, and other. Eleven studies examined the relationship between ridesourcing and public transit. Of the 11 studies, 5 found a complementary relationship, 5 found a substitutionary relationship, and the final study found no clear relationship. Five studies investigated the relationship to personal vehicles, and three of them found the relationship to be substitutionary. One study found that ridesourcing was a substitute for taxis.
2.2.6 Theme 6: Ridesourcing Trip Purpose A total of 18 studies (41% of the 44 total studies) had findings related to transportation system impacts (Alemi et al., 2018; Brodeur & Nield, 2018; Castiglione et al., 2018; Circella et al., 2016; Cooper et al., 2018; Erhardt et al., 2019; Gehrke & Reardon, 2018; Hall et al., 2018; Henao, 2017; Jiao et al., 2020; Joshi et al., 2019; Lee et al., 2018; Qian et al., 2020; Rayle et al., 2016; Sabouri, Brewer, et al., 2020; Schaller, 2017, 2018; Zheng, 2019). As ridesourcing continues to grow in popularity and presence around the United
9
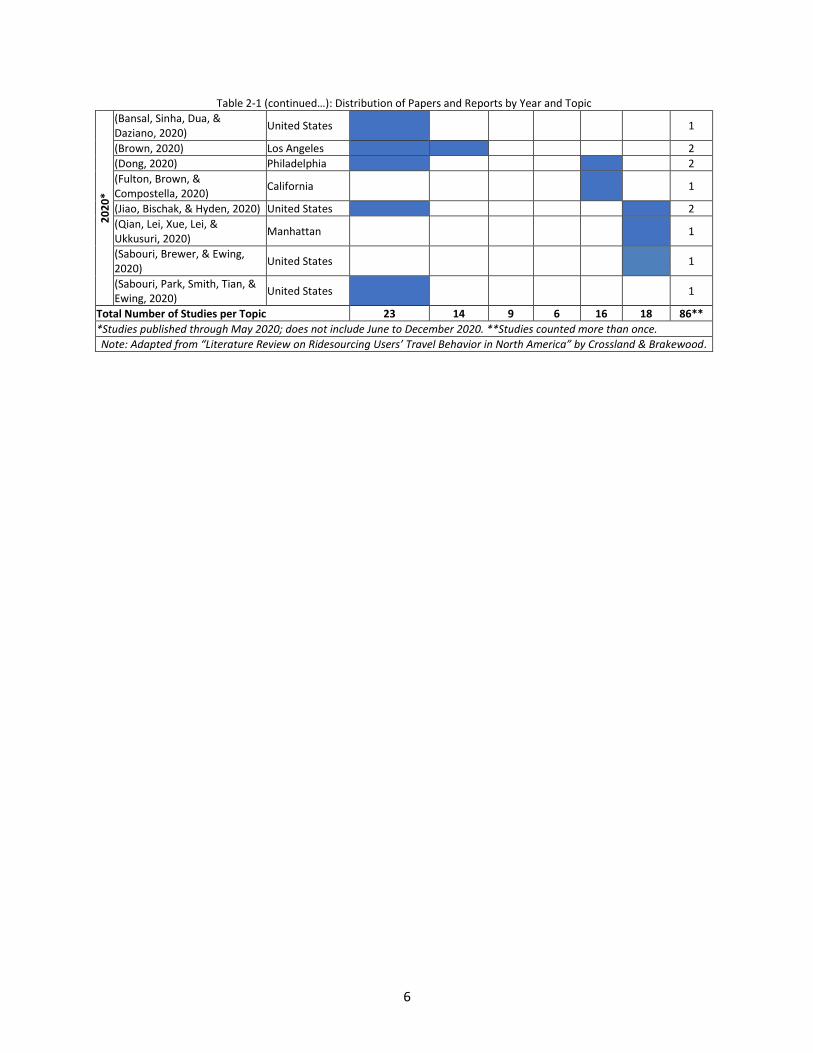
States, it is important to understand how it is impacting the current conditions of roadways. These studies are summarized in Table A4-6 in the Appendix.
Table A4-6 delineates the most considered impacts, including vehicle miles traveled (VMT) or additional miles, additional trips or total trips, additional vehicles on the roadway or congestion, vehicles hours of delay or changes in speed, and other. Eight of the studies contained findings broadly related to vehicle miles traveled. Two of these VMT-related studies analyzed additional miles added by ridesourcing; these two studies found that ridesourcing could account for an additional 600 million to 5.7 billion miles every year across the United States. Five studies examined additional or total trips taken by ridesourcing users; one noteworthy study from New York City-based Schaller Consulting found that there was a net 31 million trip increase after accounting for decreases in other cab and car services over a 3-year period in New York City (Schaller, 2017). Six studies looked at additional vehicles on the road and/or the congestion impacts of ridesourcing. In general, most of these studies found that ridesourcing vehicles increased the number of vehicles on the road and had the potential to increase congestion. Similarly, four studies examined vehicle hours of delay (VHD) and the speed impacts of ridesourcing; notably, all four studies found that ridesourcing resulted in congestion and a decrease in speeds in their respective study areas. Three studies considered “other” transportation system impacts of ridesourcing including deadheading, vehicle hours traveled, and parking availability.
2.3 Conclusions and Future Research from the Literature Review The rapid growth of ridesourcing services in North America over the past ten years has led to a large research focus on the services provided as well as the travelers using them. Since this area of research is constantly changing, the objective of this chapter was to provide a comprehensive literature review of the latest research and summarize findings relating to ridesourcing users and their travel behavior. Forty-four studies on ridesourcing were reviewed for this paper. After reviewing the papers, six common categories of research were identified: demographics; frequency and time of use; trip purpose; reason for using ridesourcing services; ridesourcing versus other modes of transportation; and transportation system impacts. While there were some differing results in these studies, general trends can be summarized and are shown in Figure 2-1.

10
Note: Adapted from “Literature Review on Ridesourcing Users’ Travel Behavior in North America” by Crossland & Brakewood
Figure 2-1: Summary of Literature Review Findings by Theme
In terms of demographics, numerous studies found that ridesourcing users were often those who were younger (17 of 19), had higher incomes (12 of 16), and had obtained some higher education (10 of 10). In terms of frequency and time use, ridesourcing trips were commonly taken on the weekends (7 of 9), especially at night (6 of 6). Social activities were the most common trip purpose for ridesourcing users. The most common reasons for using ridesourcing were to avoid driving under the influence, to avoid expensive or difficult parking situations, and to have shorter travel times. The most common modes to be compared to ridesourcing usage were public transit, personal vehicles, and taxi; however, there were mixed results on whether these were substitutes or complements, especially for public transit. Lastly, some transportation system related studies found ridesourcing increased VMT and number of vehicles on the roadways; however, there were too few studies to have conclusive finding regarding the impacts.
These six main categories related to ridesourcing user travel behavior are interrelated. For example, this can be seen with the frequency and time of use, trip purpose, and reasons categories. Most trips were taken on weekends and at night, which is a common time for social events and going out to restaurants and bars. It is common for alcohol to be consumed during these types of social events, which could result in ridesourcing travelers wanting to avoid driving under the influence. There is also a relationship between transportation system impacts and the relationship between ridesourcing and other modes. VMT could increase when examining the substitutive relationship between ridesourcing and personal vehicles, especially when considering deadheading.
It is important for transportation system planners and policy makers to understand who is using ridesourcing and how they are using it. For example, if planners and policy makers are looking at trip purpose and find that most people are using ridesourcing to travel downtown to go to bars and restaurants, they may want to implement curb space management strategies. Further understanding of when these trips are being made (e.g., primarily on weekends) could potentially change curb space management decisions, since ridesourcing loading zones may only be needed on weekends rather than
•Ridesourcing users tend to be younger, have higher incomes, higher education levels, and are urban dwellers.
Theme 1: Demographics
•Most ridesourcing trips are taken on weekends at night.
Theme 2: Frequency and Time of Use
•Most common ridesourcing trip type is for social purposes/going out.
Theme 3: Trip Purpose
•Ridesourcing users do not want to drive under the influence, have difficulty with parking, or long travel times.
Theme 4: Reason
•Ridesourcing can substitute for both taxis and personal vehicles.
Theme 5: Relationship with Other Modes
•Ridesourcing can increase VMT and potentially add additional vehicles to the roadways.
Theme 6: Transportation System Impacts

11
all week. Similarly, if planning and policy makers are in an area with an airport and find that many of the ridesourcing trips are to and from the airport, they may want to work with airport authorities to create better curb space manage pick up and drop off locations for ridesourcing, as well as allocate space for ridesourcing vehicles waiting to pick up users (Mandle & Box, 2017).
Based on this research, general trends are emerging about the travel behavior of ridesourcing users. These trends help form a clearer image of who is using ridesourcing and how their behaviors are impacting transportation systems. This review finds substantial evidence for both demographics and the frequency and use of ridesourcing. However, some of the six categories are not as commonly researched and, therefore, present areas for future research. The two categories with the fewest number of studies are the reason behind selecting ridesourcing and the trip purpose when using ridesourcing. Although the relationship between ridesourcing and other modes is more commonly studied, the results do not show a clear trend, especially for public transit. Future research should be conducted in this area to clarify the relationship between ridesourcing and public transit. Another area for future research should be an increase in studies regarding transportation system impacts so that results may be comparable. Last, the majority of the studies focused on the United States as a whole or individual large American cities, most of which are on the coast. Focusing research on smaller cities as well as more rural areas may render different results than those for national studies and major cities. For planners, policy makers and transportation system managers in Tennessee, it is important to understand who is using ridesourcing services in their region, which will be the focus of the following chapters in this report.
12
3 National Household Travel Survey (NHTS) Ridesharing Analysis In the most recent National Household Travel Survey (NHTS), administered in 2017, there were two questions asked for the first time that pertain to ridesharing. The objective of this chapter is to use the new 2017 NHTS questions about rideshare to evaluate if there are significant differences between Tennessee and national ridesharing socioeconomic characteristics. It should be noted that the term “rideshare” was used on the NHTS questionnaire, and subsequently, that term is used throughout this chapter. This chapter proceeds as follows. First, a description of the data and method of analysis is provided next. Next, the results of the NHTS analysis are presented. This is followed by conclusions and areas for future research.
3.1 NHTS Data and Methodology
3.1.1 Assemble 2017 NHTS Data The 2017 National Household Travel Survey (NHTS) data consists of four datasets: household, person, vehicle, and trip. These datasets, along with the NHTS codebook, were downloaded from the NHTS website (ORNL, n.d.). The questions used in the two-phase survey were downloaded from the Recruitment Survey and the Retrieval Questionnaire files. The NHTS took 14 months to collect all responses beginning March 31, 2016 and ending May 8, 2017 (Westat, 2019). The survey was given in two parts, the first being the household recruitment survey and the second being the retrieval questionnaire. The household recruitment survey was filled out by a single member of the household while the retrieval questionnaire required responses from all members of the household.
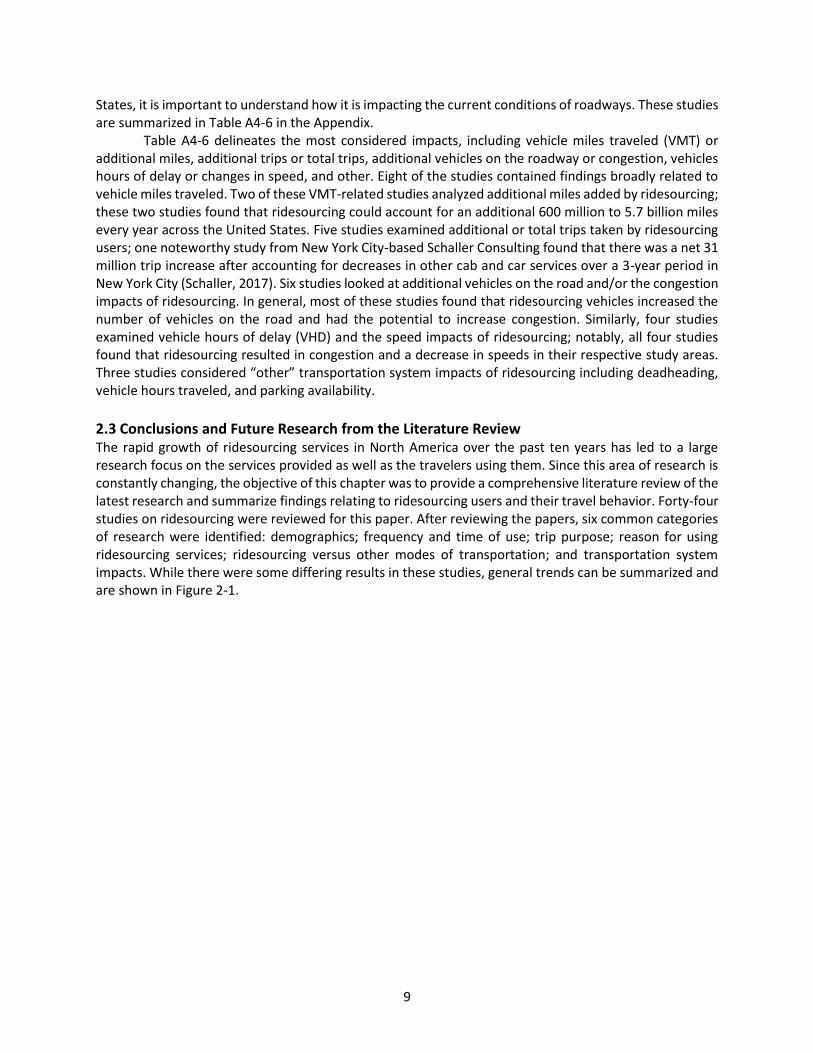
There were two questions related to ridesourcing in the 2017 NHTS. The first question was found in the recruitment survey: “How often do you use taxi service or rideshare such as Uber/Lyft to get from place to place?” with potential responses being daily, a few times a week, a few times a month, a few times a year, or never (USDOT, 2018). This question is shown in Figure 3-1. Since this question was asked in the household recruitment survey, this question was only answered by one person in the household resulting in 129,696 responses nationwide.
Figure 3-1: Taxi or Ridesharing Frequency of Use Question from NHTS Recruitment Survey (USDOT,
2018) The second question found in the retrieval questionnaire was: “In the past 30 days, how many
times have you purchased a ride with a smartphone rideshare app (e.g. Uber, Lyft, Sidecar)?” with responses of I don’t know, I prefer not to answer, or a number (Westat, 2018). This question was asked for each member of the household resulting in 264,234 responses nationwide. It is shown in Figure 3-2.
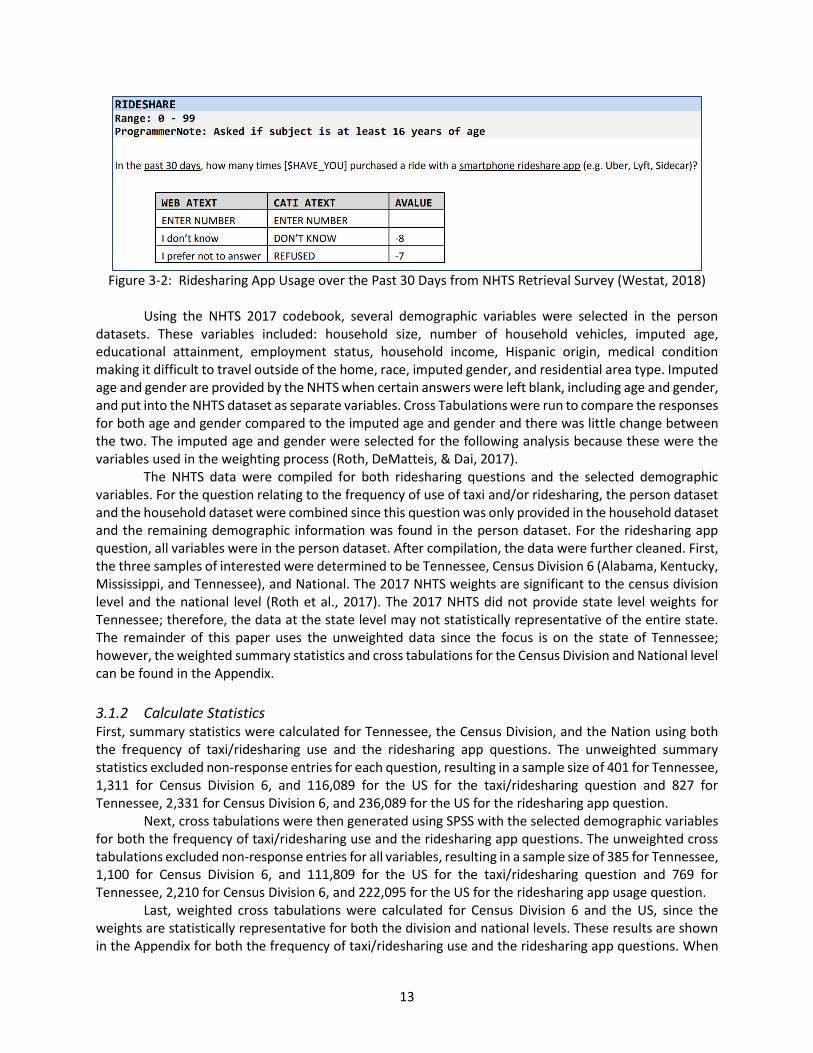
13
Figure 3-2: Ridesharing App Usage over the Past 30 Days from NHTS Retrieval Survey (Westat, 2018)
Using the NHTS 2017 codebook, several demographic variables were selected in the person
datasets. These variables included: household size, number of household vehicles, imputed age, educational attainment, employment status, household income, Hispanic origin, medical condition making it difficult to travel outside of the home, race, imputed gender, and residential area type. Imputed age and gender are provided by the NHTS when certain answers were left blank, including age and gender, and put into the NHTS dataset as separate variables. Cross Tabulations were run to compare the responses for both age and gender compared to the imputed age and gender and there was little change between the two. The imputed age and gender were selected for the following analysis because these were the variables used in the weighting process (Roth, DeMatteis, & Dai, 2017).
The NHTS data were compiled for both ridesharing questions and the selected demographic variables. For the question relating to the frequency of use of taxi and/or ridesharing, the person dataset and the household dataset were combined since this question was only provided in the household dataset and the remaining demographic information was found in the person dataset. For the ridesharing app question, all variables were in the person dataset. After compilation, the data were further cleaned. First, the three samples of interested were determined to be Tennessee, Census Division 6 (Alabama, Kentucky, Mississippi, and Tennessee), and National. The 2017 NHTS weights are significant to the census division level and the national level (Roth et al., 2017). The 2017 NHTS did not provide state level weights for Tennessee; therefore, the data at the state level may not statistically representative of the entire state. The remainder of this paper uses the unweighted data since the focus is on the state of Tennessee; however, the weighted summary statistics and cross tabulations for the Census Division and National level can be found in the Appendix.
3.1.2 Calculate Statistics First, summary statistics were calculated for Tennessee, the Census Division, and the Nation using both the frequency of taxi/ridesharing use and the ridesharing app questions. The unweighted summary statistics excluded non-response entries for each question, resulting in a sample size of 401 for Tennessee, 1,311 for Census Division 6, and 116,089 for the US for the taxi/ridesharing question and 827 for Tennessee, 2,331 for Census Division 6, and 236,089 for the US for the ridesharing app question.
Next, cross tabulations were then generated using SPSS with the selected demographic variables for both the frequency of taxi/ridesharing use and the ridesharing app questions. The unweighted cross tabulations excluded non-response entries for all variables, resulting in a sample size of 385 for Tennessee, 1,100 for Census Division 6, and 111,809 for the US for the taxi/ridesharing question and 769 for Tennessee, 2,210 for Census Division 6, and 222,095 for the US for the ridesharing app usage question.
Last, weighted cross tabulations were calculated for Census Division 6 and the US, since the weights are statistically representative for both the division and national levels. These results are shown in the Appendix for both the frequency of taxi/ridesharing use and the ridesharing app questions. When

14
using the weights, the data included non-response entries to keep the results statistically representative. This resulted in a sample size of 7,683,303 for Census Division 6 and 126,322,007 at the national level for the taxi/ridesharing question and 17,730,127 for Census Division 6 and 301,599,169 at the national level for the ridesharing app usage question.
3.1.3 Binary Logit Analysis Six binary logit models were created using STATA. Two models were run for Tennessee (one for the taxi/ridesharing question and one for the rideshare app usage question), two models for Census Region 6 (again, one for the taxi/ridesharing question and one for the rideshare app usage question), and two models for the US. First, a binary variable was created for the frequency of use of taxi and ridesharing question. This variable had values of zero for those who never used taxi or ridesharing services and one for anyone who used taxi or ridesharing services, regardless of frequency of use. Similarly, for the ridesharing app question, a ridesharing variable was created. This variable has values of zero for those who reported not buying a ride from a ridesharing app in the past 30 days and one for those who had.
In these models, household size and number of household vehicles were the only continuous independent variables, ranging from one to thirteen and zero to twelve, respectively. All remaining independent variables were binary; when the respondent fell into a given category, the value was set equal to one. For all categories that used binary variables, a reference variable was defined and used as the reference when interpreting the coefficients. The data used in the models was unweighted, excludes the non-response entries, and has the same sample sizes as the unweighted cross tabulations. Models were also run using the weighted data for Census Division 6 and the national level; these results are not included in this report, but they are available upon request.
3.2 NHTS Results
3.2.1 NHTS Summary Statistics (Unweighted) In Tennessee, a total of 24.9% of respondents use taxi or rideshare with 20.2% using a few times a year, 4.0% using a few times a month, 0.7% using a few times a week, and 0.0% using daily, as seen in Figure 3-3. Tennessee has a greater use of taxi and rideshare than its neighboring states in Census Division 6 but is below the national figures. At the national level, a total of 32.9% of respondents use taxi or ridesharing services with 25.6% using a few times a year, 5.6% using a few times a month, 1.4% using a few times a week, and 0.3% using daily.
Figure 3-3: Taxi and Ridesharing Frequency of Use, Unweighted NHTS Responses
4.0%
3.0%
5.6%
20.2%
18.4%
25.6%
75.1%
78.0%
67.1%
0% 10% 20% 30% 40% 50% 60% 70% 80% 90% 100%
TN Unweighted(n=401)
Census Division 6 Unweighted (n=1131)
USA Unweighted (n=116089)
"How often do you use taxi services or rideshare such as Uber/Lyft to get from place to place?"
Daily
A few times aweek
A few times amonth
A few times ayear
Never

15
As seen Figure 3-4, 5.1% of Tennessee respondents purchased a ride using a smartphone rideshare app in the past 30 days. More respondents in Tennessee purchased rideshare rides compared to neighboring states in Census Division 6 (3.9%). Fewer people in Tennessee purchased rideshare rides than the United States as a whole; at the national level, 7.4% of respondents purchased a ride in the past 30 days.
Figure 3-4: Rideshare App Usage Over the Past 30 Days, Unweighted NHTS Responses
3.2.2 NHTS Cross Tabulations (Unweighted) Before completing the cross tabulations for the taxi/ridesharing frequency of use and ridesharing app usage, the data was further cleaned and manipulated. All respondents under the age of 18 were removed from the dataset because Uber does not allow those under the age of 18 to create an account (Uber, 2020). Ages were then grouped into five categories: 18 to 24, 25 to 34, 35 to 44, 45 to 54, and 55 and older. Once the respondents under the age of 18 were removed, the number of responses for the educational attachment question (specifically, less than high school and high school graduate) decreased. These two educational attainment categories were then combined. The NHTS has 11 income brackets that were further combined into six brackets: less than $25,000; $25,000-$49,999; $50,000 to $74,999; $75,000 to $99,999; $100,000 to $149,999; and $150,000 or greater. Due to the small number of responses in some race categories, American Indian or Alaska Native, Native Hawaiian or other Pacific Islander, and multiple responses were combined with the Other race category. Last, the sample was cleaned to remove non-response entries in the dataset. The non-response entries included: appropriate skip; I don’t know; I prefer not to answer; and not ascertained.
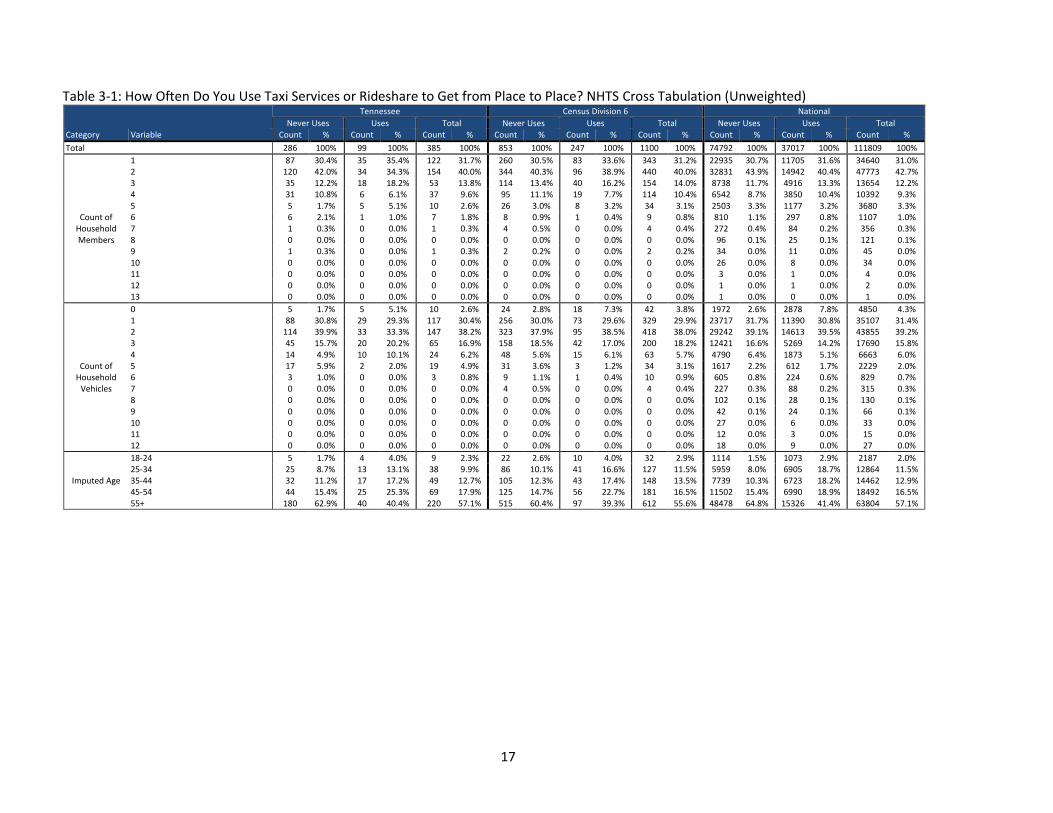
As seen in Table 3-1, the unweighted cross tabulations for the question “How often do you use Taxi service or ridesharing to get from place to place?” were calculated for Tennessee, Census Division 6, and National.
Of those who reported using taxi or ridesharing services, one- or two-person households were most frequent. In Tennessee, 35.4% of those who use these services were from one-person households while only 30.4% of those who never use these services were from one-person households. Households with one or two vehicles were found to have the highest percentages amongst those who use taxi or ridesharing.
The data suggest that people under the age of 55 were more likely to use taxi or ridesharing services. In Tennessee, 25.3% of those who use these services were 45 to 54 years old whereas this group represents just 15.4% of non-users. This trend continues in Tennessee for the younger age groups as well: 35 to 44 years old (17.2% use and 11.2% do not use); 25 to 34 years old (13.1% use and 8.7% do not use);
94.9%
96.1%
92.6%
5.1%
3.9%
7.4%
0% 10% 20% 30% 40% 50% 60% 70% 80% 90% 100%
TN Unweighted(n=827)
Census Division 6Unweighted (n=2331)
USA Unweighted(n=236089)
"In the past 30 days, how many times have you purchased a ride with a smartphone rideshare app (e.g. Uber, Lyft, Sidecar)?"
0
1+

16
and 18 to 24 years old (4.0% use and 1.7% do not use). Similar trends appear in both the census division and national cross tabulations.
Of those who reported using taxi services or ridesharing, the majority had some form of higher education. In Tennessee, the most common education level among users of taxi or ridesharing was a bachelor’s degree, while a graduate degree or professional degree was most common for users at the census division and national level. In Tennessee, Census Division 6, and the nation, the most common education level for those who never use these services was some college or an associate degree.
The taxi and rideshare users were more frequently employed, with Tennessee having the largest portion of employed users at 74.7% and the lowest portion of employed non-users at 48.3%.
High incomes were common for those using taxi or ridesharing. In Tennessee, 46.5% (sum of $100,000 to $149,999 and $150,000 or more) of those who use taxi or rideshare have an annual household income of at least $100,000 compared to 16.1% of non-users in Tennessee in these income brackets.
Within the Hispanic category, the data show a greater percentage of users than non-users at the Tennessee and National levels (2.0% users compared to 1.7% non-users and 7.4% users compared to 6.5% non-users, respectively).
Similarly, almost 93% of all respondents using taxis or ridesharing do not have a medical condition that makes it difficult to travel. Those who do not have a medical condition account for 85 to 90% of all non-users.
Results showed that the majority of taxi or rideshare users were white. In Tennessee, 89.9% of people using these services were white and 89.5% of non-users were white.
Gender was almost evenly split between taxi and ridesharing users. When comparing users versus non-users in Tennessee, males tend to use these services more than females (48.5% of males use compared to 46.5% do not use, while 51.5% of females use these services compared to 53.5% who do not).
People living in an urban setting were more likely to use taxi or ridesharing than those in a rural setting. In Tennessee, 81.8% of people who reported using these services were in an urban setting while 60.1% of people who reported not using taxi or rideshare services were in an urban setting.
17
Table 3-1: How Often Do You Use Taxi Services or Rideshare to Get from Place to Place? NHTS Cross Tabulation (Unweighted)
Tennessee Census Division 6 National
Never Uses Uses Total Never Uses Uses Total Never Uses Uses Total Category Variable Count % Count % Count % Count % Count % Count % Count % Count % Count %
Total 286 100% 99 100% 385 100% 853 100% 247 100% 1100 100% 74792 100% 37017 100% 111809 100%
Count of Household Members
1 87 30.4% 35 35.4% 122 31.7% 260 30.5% 83 33.6% 343 31.2% 22935 30.7% 11705 31.6% 34640 31.0% 2 120 42.0% 34 34.3% 154 40.0% 344 40.3% 96 38.9% 440 40.0% 32831 43.9% 14942 40.4% 47773 42.7% 3 35 12.2% 18 18.2% 53 13.8% 114 13.4% 40 16.2% 154 14.0% 8738 11.7% 4916 13.3% 13654 12.2% 4 31 10.8% 6 6.1% 37 9.6% 95 11.1% 19 7.7% 114 10.4% 6542 8.7% 3850 10.4% 10392 9.3% 5 5 1.7% 5 5.1% 10 2.6% 26 3.0% 8 3.2% 34 3.1% 2503 3.3% 1177 3.2% 3680 3.3% 6 6 2.1% 1 1.0% 7 1.8% 8 0.9% 1 0.4% 9 0.8% 810 1.1% 297 0.8% 1107 1.0% 7 1 0.3% 0 0.0% 1 0.3% 4 0.5% 0 0.0% 4 0.4% 272 0.4% 84 0.2% 356 0.3% 8 0 0.0% 0 0.0% 0 0.0% 0 0.0% 0 0.0% 0 0.0% 96 0.1% 25 0.1% 121 0.1% 9 1 0.3% 0 0.0% 1 0.3% 2 0.2% 0 0.0% 2 0.2% 34 0.0% 11 0.0% 45 0.0% 10 0 0.0% 0 0.0% 0 0.0% 0 0.0% 0 0.0% 0 0.0% 26 0.0% 8 0.0% 34 0.0% 11 0 0.0% 0 0.0% 0 0.0% 0 0.0% 0 0.0% 0 0.0% 3 0.0% 1 0.0% 4 0.0% 12 0 0.0% 0 0.0% 0 0.0% 0 0.0% 0 0.0% 0 0.0% 1 0.0% 1 0.0% 2 0.0% 13 0 0.0% 0 0.0% 0 0.0% 0 0.0% 0 0.0% 0 0.0% 1 0.0% 0 0.0% 1 0.0%
Count of Household
Vehicles
0 5 1.7% 5 5.1% 10 2.6% 24 2.8% 18 7.3% 42 3.8% 1972 2.6% 2878 7.8% 4850 4.3% 1 88 30.8% 29 29.3% 117 30.4% 256 30.0% 73 29.6% 329 29.9% 23717 31.7% 11390 30.8% 35107 31.4% 2 114 39.9% 33 33.3% 147 38.2% 323 37.9% 95 38.5% 418 38.0% 29242 39.1% 14613 39.5% 43855 39.2% 3 45 15.7% 20 20.2% 65 16.9% 158 18.5% 42 17.0% 200 18.2% 12421 16.6% 5269 14.2% 17690 15.8% 4 14 4.9% 10 10.1% 24 6.2% 48 5.6% 15 6.1% 63 5.7% 4790 6.4% 1873 5.1% 6663 6.0% 5 17 5.9% 2 2.0% 19 4.9% 31 3.6% 3 1.2% 34 3.1% 1617 2.2% 612 1.7% 2229 2.0% 6 3 1.0% 0 0.0% 3 0.8% 9 1.1% 1 0.4% 10 0.9% 605 0.8% 224 0.6% 829 0.7% 7 0 0.0% 0 0.0% 0 0.0% 4 0.5% 0 0.0% 4 0.4% 227 0.3% 88 0.2% 315 0.3% 8 0 0.0% 0 0.0% 0 0.0% 0 0.0% 0 0.0% 0 0.0% 102 0.1% 28 0.1% 130 0.1% 9 0 0.0% 0 0.0% 0 0.0% 0 0.0% 0 0.0% 0 0.0% 42 0.1% 24 0.1% 66 0.1% 10 0 0.0% 0 0.0% 0 0.0% 0 0.0% 0 0.0% 0 0.0% 27 0.0% 6 0.0% 33 0.0% 11 0 0.0% 0 0.0% 0 0.0% 0 0.0% 0 0.0% 0 0.0% 12 0.0% 3 0.0% 15 0.0% 12 0 0.0% 0 0.0% 0 0.0% 0 0.0% 0 0.0% 0 0.0% 18 0.0% 9 0.0% 27 0.0%
Imputed Age
18-24 5 1.7% 4 4.0% 9 2.3% 22 2.6% 10 4.0% 32 2.9% 1114 1.5% 1073 2.9% 2187 2.0% 25-34 25 8.7% 13 13.1% 38 9.9% 86 10.1% 41 16.6% 127 11.5% 5959 8.0% 6905 18.7% 12864 11.5% 35-44 32 11.2% 17 17.2% 49 12.7% 105 12.3% 43 17.4% 148 13.5% 7739 10.3% 6723 18.2% 14462 12.9% 45-54 44 15.4% 25 25.3% 69 17.9% 125 14.7% 56 22.7% 181 16.5% 11502 15.4% 6990 18.9% 18492 16.5% 55+ 180 62.9% 40 40.4% 220 57.1% 515 60.4% 97 39.3% 612 55.6% 48478 64.8% 15326 41.4% 63804 57.1%
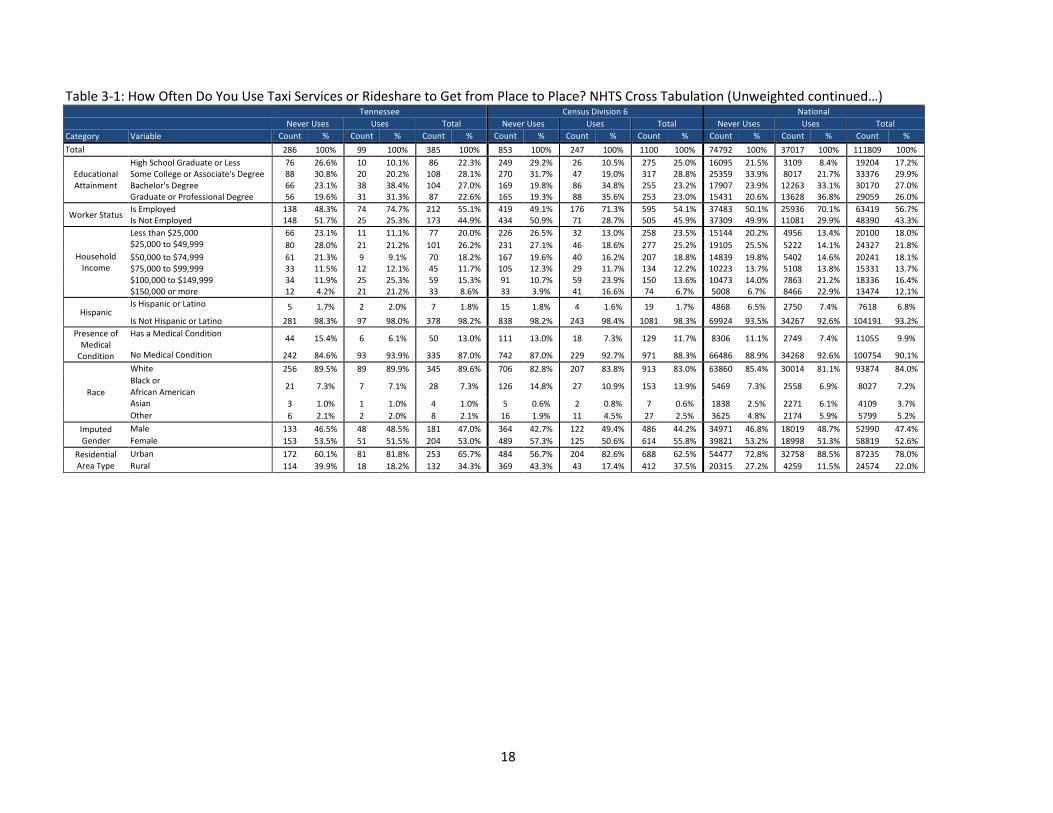
18
Table 3-1: How Often Do You Use Taxi Services or Rideshare to Get from Place to Place? NHTS Cross Tabulation (Unweighted continued…) Tennessee Census Division 6 National
Never Uses Uses Total Never Uses Uses Total Never Uses Uses Total
Category Variable Count % Count % Count % Count % Count % Count % Count % Count % Count %
Total 286 100% 99 100% 385 100% 853 100% 247 100% 1100 100% 74792 100% 37017 100% 111809 100%
Educational Attainment
High School Graduate or Less 76 26.6% 10 10.1% 86 22.3% 249 29.2% 26 10.5% 275 25.0% 16095 21.5% 3109 8.4% 19204 17.2% Some College or Associate's Degree 88 30.8% 20 20.2% 108 28.1% 270 31.7% 47 19.0% 317 28.8% 25359 33.9% 8017 21.7% 33376 29.9% Bachelor's Degree 66 23.1% 38 38.4% 104 27.0% 169 19.8% 86 34.8% 255 23.2% 17907 23.9% 12263 33.1% 30170 27.0% Graduate or Professional Degree 56 19.6% 31 31.3% 87 22.6% 165 19.3% 88 35.6% 253 23.0% 15431 20.6% 13628 36.8% 29059 26.0%
Worker Status Is Employed 138 48.3% 74 74.7% 212 55.1% 419 49.1% 176 71.3% 595 54.1% 37483 50.1% 25936 70.1% 63419 56.7% Is Not Employed 148 51.7% 25 25.3% 173 44.9% 434 50.9% 71 28.7% 505 45.9% 37309 49.9% 11081 29.9% 48390 43.3%
Household Income
Less than $25,000 66 23.1% 11 11.1% 77 20.0% 226 26.5% 32 13.0% 258 23.5% 15144 20.2% 4956 13.4% 20100 18.0% $25,000 to $49,999 80 28.0% 21 21.2% 101 26.2% 231 27.1% 46 18.6% 277 25.2% 19105 25.5% 5222 14.1% 24327 21.8%
$50,000 to $74,999 61 21.3% 9 9.1% 70 18.2% 167 19.6% 40 16.2% 207 18.8% 14839 19.8% 5402 14.6% 20241 18.1% $75,000 to $99,999 33 11.5% 12 12.1% 45 11.7% 105 12.3% 29 11.7% 134 12.2% 10223 13.7% 5108 13.8% 15331 13.7% $100,000 to $149,999 34 11.9% 25 25.3% 59 15.3% 91 10.7% 59 23.9% 150 13.6% 10473 14.0% 7863 21.2% 18336 16.4% $150,000 or more 12 4.2% 21 21.2% 33 8.6% 33 3.9% 41 16.6% 74 6.7% 5008 6.7% 8466 22.9% 13474 12.1%
Hispanic Is Hispanic or Latino 5 1.7% 2 2.0% 7 1.8% 15 1.8% 4 1.6% 19 1.7% 4868 6.5% 2750 7.4% 7618 6.8%
Is Not Hispanic or Latino 281 98.3% 97 98.0% 378 98.2% 838 98.2% 243 98.4% 1081 98.3% 69924 93.5% 34267 92.6% 104191 93.2%
Presence of Medical
Condition
Has a Medical Condition 44 15.4% 6 6.1% 50 13.0% 111 13.0% 18 7.3% 129 11.7% 8306 11.1% 2749 7.4% 11055 9.9%
No Medical Condition 242 84.6% 93 93.9% 335 87.0% 742 87.0% 229 92.7% 971 88.3% 66486 88.9% 34268 92.6% 100754 90.1%
Race
White 256 89.5% 89 89.9% 345 89.6% 706 82.8% 207 83.8% 913 83.0% 63860 85.4% 30014 81.1% 93874 84.0%
Black or African American
21 7.3% 7 7.1% 28 7.3% 126 14.8% 27 10.9% 153 13.9% 5469 7.3% 2558 6.9% 8027 7.2%
Asian 3 1.0% 1 1.0% 4 1.0% 5 0.6% 2 0.8% 7 0.6% 1838 2.5% 2271 6.1% 4109 3.7%
Other 6 2.1% 2 2.0% 8 2.1% 16 1.9% 11 4.5% 27 2.5% 3625 4.8% 2174 5.9% 5799 5.2%
Imputed Gender
Male 133 46.5% 48 48.5% 181 47.0% 364 42.7% 122 49.4% 486 44.2% 34971 46.8% 18019 48.7% 52990 47.4%
Female 153 53.5% 51 51.5% 204 53.0% 489 57.3% 125 50.6% 614 55.8% 39821 53.2% 18998 51.3% 58819 52.6%
Residential Area Type
Urban 172 60.1% 81 81.8% 253 65.7% 484 56.7% 204 82.6% 688 62.5% 54477 72.8% 32758 88.5% 87235 78.0%
Rural 114 39.9% 18 18.2% 132 34.3% 369 43.3% 43 17.4% 412 37.5% 20315 27.2% 4259 11.5% 24574 22.0%

19
Table 3-2 presents the results of the unweighted cross tabulations for the question “In the past 30 days, how many times have you purchased a ride with a smartphone rideshare app?” for Tennessee, Census Division 6, and National.
Of those who reported buying a rideshare ride, one- or two-person households were most frequent. In Tennessee, 31.0% of those who purchased a ride were from one-person households while 17.5% of all those who have not purchased a ride were from one-person households.
Similarly, households with fewer vehicles (i.e., zero, one, or two vehicles per household) had higher percentages who had reported buying a rideshare ride compared to those households that had not purchased a rideshare ride. For example, in Tennessee, 42.9% of all respondents who have purchased a ride had two vehicles in their household while 40.3% of those who did not purchase a ride had two vehicles.
The data suggest that people under the age of 55 were more likely to purchase a ride using a smartphone ridesharing app. In Tennessee, 23.8% of those who purchased a ride were 45 to 54 years old whereas this group represents 17.1% of non-users. This trend continues in Tennessee for the younger age groups as well: 35 to 44 years old (19.0% have and 11.4% have not purchased a ride); 25 to 34 years old (21.4% have and 9.9% have not purchased a ride); and 18 to 24 years old (7.1% have and 5.6% have not purchased a ride). Similar trends appear in both the census division and national cross tabulations.
Of those who reported purchasing a ride through a smartphone application, the majority had some form of higher education. In Tennessee, the most common education levels for those who had purchased a rideshare ride were bachelor’s degree and graduate or professional degree (both 40.5%), while a graduate degree or professional degree was most common for the census division and bachelor’s degree was the most common for the National level. For both Tennessee and Census Division 6, the most common education level for those who did not purchase a ride was high school graduate or less, and for the National level, the most common was some college or associate degree.
Between 80% and 86% of those who reported purchasing a ride were employed. Tennessee had the highest percentage of employed with 85.7% and had the lowest percentage of employed workers who did not purchase a ride with 50.9%.
High incomes were common for those purchasing rides through smartphones. In Tennessee, 57.2% (sum of $100,000 to $149,999 and $150,000 or more) of those who purchased a ride have an annual household income of at least $100,000 compared to 24.2% of those who did not purchase a ride in Tennessee in these income brackets.
For both Tennessee and Census Division 6, 0.0% Hispanic or Latino respondents reported purchasing a ridesharing ride. For the National level, 9.6% of those who reported purchasing a ride were Hispanic while 7.9% of those who did not purchase a ride were Hispanic.
Almost all respondents who purchased a ride with a smartphone did not have a medical condition that makes it difficult to travel. In Tennessee, 95.2% of those who purchased a ride reported not having a medical condition while 85.8% of those who did not purchase a ride did not have a medical condition.
In Tennessee, the majority of those purchasing a ride were white: 90.5% of people purchasing a ride were white and 89.0% of people who did not purchase a ride were white.
Gender was almost evenly split for those whose who purchased a ride with a smartphone app. When comparing those who have and have not purchased a ride in Tennessee, males purchase rides more than females (44.4% of males have not purchased a ride while 55.6% have not purchased a ride).
People living in an urban setting were more likely to purchase a ride than those in a rural setting. In Tennessee, 90.5% of people who reported purchasing a ride were from an urban setting while 61.6% of people who reported purchasing a ride were from an urban setting.

20
Table 3-2: In the Past 30 Days, How Many Times have you Purchased a Ride with a Smartphone Rideshare App? NHTS Cross Tabulation (Unweighted)
Tennessee Census Division 6 US
0 Trips 1+ Trips Total 0 Trips 1+ Trips Total 0 Trips 1+ Trips Total
Category Variable Count % Count % Count % Count % Count % Count % Count % Count % Count %
Count of Household Members
1 127 17.5% 13 31.0% 140 18.2% 376 17.8% 25 26.6% 401 18.1% 36241 17.7% 3573 21.1% 39814 17.9%
2 323 44.4% 17 40.5% 340 44.2% 939 44.4% 36 38.3% 975 44.1% 96812 47.2% 7418 43.9% 104230 46.9%
3 130 17.9% 8 19.0% 138 17.9% 370 17.5% 21 22.3% 391 17.7% 32522 15.8% 2767 16.4% 35289 15.9%
4 89 12.2% 2 4.8% 91 11.8% 282 13.3% 9 9.6% 291 13.2% 24623 12.0% 2277 13.5% 26900 12.1%
5 31 4.3% 2 4.8% 33 4.3% 99 4.7% 3 3.2% 102 4.6% 9689 4.7% 625 3.7% 10314 4.6%
6 23 3.2% 0 0.0% 23 3.0% 35 1.7% 0 0.0% 35 1.6% 3290 1.6% 160 0.9% 3450 1.6%
7 2 0.3% 0 0.0% 2 0.3% 10 0.5% 0 0.0% 10 0.5% 1212 0.6% 45 0.3% 1257 0.6%
8 0 0.0% 0 0.0% 0 0.0% 0 0.0% 0 0.0% 0 0.0% 472 0.2% 15 0.1% 487 0.2%
9 2 0.3% 0 0.0% 2 0.3% 5 0.2% 0 0.0% 5 0.2% 160 0.1% 13 0.1% 173 0.1%
10 0 0.0% 0 0.0% 0 0.0% 0 0.0% 0 0.0% 0 0.0% 145 0.1% 1 0.0% 146 0.1%
11 0 0.0% 0 0.0% 0 0.0% 0 0.0% 0 0.0% 0 0.0% 19 0.0% 0 0.0% 19 0.0%
12 0 0.0% 0 0.0% 0 0.0% 0 0.0% 0 0.0% 0 0.0% 11 0.0% 0 0.0% 11 0.0%
13 0 0.0% 0 0.0% 0 0.0% 0 0.0% 0 0.0% 0 0.0% 5 0.0% 0 0.0% 5 0.0%
Total 727 100.0% 42 100.0% 769 100.0% 2116 100.0% 94 100.0% 2210 100.0% 205201 100.0% 16894 100.0% 222095 100.0%
Count of Household
Vehicles
0 20 2.8% 2 4.8% 22 2.9% 68 3.2% 8 8.5% 76 3.4% 6417 3.1% 998 5.9% 7415 3.3%
1 148 20.4% 10 23.8% 158 20.5% 451 21.3% 22 23.4% 473 21.4% 46674 22.7% 4509 26.7% 51183 23.0%
2 293 40.3% 18 42.9% 311 40.4% 855 40.4% 39 41.5% 894 40.5% 85341 41.6% 7248 42.9% 92589 41.7%
3 147 20.2% 9 21.4% 156 20.3% 442 20.9% 17 18.1% 459 20.8% 40161 19.6% 2583 15.3% 42744 19.2%
4 56 7.7% 2 4.8% 58 7.5% 153 7.2% 7 7.4% 160 7.2% 16846 8.2% 1049 6.2% 17895 8.1%
5 57 7.8% 1 2.4% 58 7.5% 99 4.7% 1 1.1% 100 4.5% 5962 2.9% 323 1.9% 6285 2.8%
6 6 0.8% 0 0.0% 6 0.8% 31 1.5% 0 0.0% 31 1.4% 2272 1.1% 108 0.6% 2380 1.1%
7 0 0.0% 0 0.0% 0 0.0% 17 0.8% 0 0.0% 17 0.8% 843 0.4% 43 0.3% 886 0.4%
8 0 0.0% 0 0.0% 0 0.0% 0 0.0% 0 0.0% 0 0.0% 341 0.2% 11 0.1% 352 0.2%
9 0 0.0% 0 0.0% 0 0.0% 0 0.0% 0 0.0% 0 0.0% 158 0.1% 8 0.0% 166 0.1%
10 0 0.0% 0 0.0% 0 0.0% 0 0.0% 0 0.0% 0 0.0% 80 0.0% 7 0.0% 87 0.0%
11 0 0.0% 0 0.0% 0 0.0% 0 0.0% 0 0.0% 0 0.0% 42 0.0% 0 0.0% 42 0.0%
12 0 0.0% 0 0.0% 0 0.0% 0 0.0% 0 0.0% 0 0.0% 64 0.0% 7 0.0% 71 0.0%
Total 727 100.0% 42 100.0% 769 100.0% 2116 100.0% 94 100.0% 2210 100.0% 205201 100.0% 16894 100.0% 222095 100.0%
Imputed Age 18-24 41 5.6% 3 7.1% 44 5.7% 135 6.4% 9 9.6% 144 6.5% 11298 5.5% 1663 9.8% 12961 5.8%
25-34 72 9.9% 9 21.4% 81 10.5% 230 10.9% 27 28.7% 257 11.6% 22073 10.8% 5204 30.8% 27277 12.3%
35-44 83 11.4% 8 19.0% 91 11.8% 254 12.0% 20 21.3% 274 12.4% 24532 12.0% 3585 21.2% 28117 12.7%
45-54 124 17.1% 10 23.8% 134 17.4% 364 17.2% 17 18.1% 381 17.2% 32316 15.7% 2781 16.5% 35097 15.8%
55+ 407 56.0% 12 28.6% 419 54.5% 1133 53.5% 21 22.3% 1154 52.2% 114982 56.0% 3661 21.7% 118643 53.4%
Total 727 100.0% 42 100.0% 769 100.0% 2116 100.0% 94 100.0% 2210 100.0% 205201 100.0% 16894 100.0% 222095 100.0%
Educational Attainment
High School Graduate or Less
254 34.9% 3 7.1% 257 33.4% 744 35.2% 9 9.6% 753 34.1% 53148 25.9% 1146 6.8% 54294 24.4%
Some College or Associate's Degree
207 28.5% 5 11.9% 212 27.6% 609 28.8% 13 13.8% 622 28.1% 63543 31.0% 3205 19.0% 66748 30.1%
Bachelor's Degree 149 20.5% 17 40.5% 166 21.6% 393 18.6% 33 35.1% 426 19.3% 47367 23.1% 6445 38.1% 53812 24.2%
Graduate or Professional Degree
117 16.1% 17 40.5% 134 17.4% 370 17.5% 39 41.5% 409 18.5% 41143 20.1% 6098 36.1% 47241 21.3%
Total 727 100.0% 42 100.0% 769 100.0% 2116 100.0% 94 100.0% 2210 100.0% 205201 100.0% 16894 100.0% 222095 100.0%
Worker Status Is Employed 370 50.9% 36 85.7% 406 52.8% 1077 50.9% 77 81.9% 1154 52.2% 109899 53.6% 13625 80.6% 123524 55.6%
Is Not Employed 357 49.1% 6 14.3% 363 47.2% 1039 49.1% 17 18.1% 1056 47.8% 95302 46.4% 3269 19.4% 98571 44.4%
Total 727 100.0% 42 100.0% 769 100.0% 2116 100.0% 94 100.0% 2210 100.0% 205201 100.0% 16894 100.0% 222095 100.0%

21
Table 3-2: In the Past 30 Days, How Many Times have you Purchased a Ride with a Smartphone Rideshare App? Cross Tab (Unweighted - continued…)
Tennessee Census Division 6 US
0 Trips 1+ Trips Total 0 Trips 1+ Trips Total 0 Trips 1+ Trips Total
Category Variable Count % Count % Count % Count % Count % Count % Count % Count % Count %
Household Income
Less than $25,000 132 18.2% 4 9.5% 136 17.7% 452 21.4% 12 12.8% 464 21.0% 33567 16.4% 1355 8.0% 34922 15.7%
$25,000 to $49,999 181 24.9% 5 11.9% 186 24.2% 502 23.7% 10 10.6% 512 23.2% 43757 21.3% 1756 10.4% 45513 20.5%
$50,000 to $74,999 151 20.8% 7 16.7% 158 20.5% 410 19.4% 22 23.4% 432 19.5% 37971 18.5% 2064 12.2% 40035 18.0%
$75,000 to $99,999 87 12.0% 2 4.8% 89 11.6% 292 13.8% 2 2.1% 294 13.3% 29778 14.5% 2194 13.0% 31972 14.4%
$100,000 to $149,999 120 16.5% 11 26.2% 131 17.0% 310 14.7% 28 29.8% 338 15.3% 35971 17.5% 3870 22.9% 39841 17.9%
$150,000 or more 56 7.7% 13 31.0% 69 9.0% 150 7.1% 20 21.3% 170 7.7% 24157 11.8% 5655 33.5% 29812 13.4%
Total 727 100.0% 42 100.0% 769 100.0% 2116 100.0% 94 100.0% 2210 100.0% 205201 100.0% 16894 100.0% 222095 100.0%
Hispanic Is Hispanic or Latino 10 1.4% 0 0.0% 10 1.3% 40 1.9% 0 0.0% 40 1.8% 16212 7.9% 1623 9.6% 17835 8.0%
Is Not Hispanic or Latino
717 98.6% 42 100.0% 759 98.7% 2076 98.1% 94 100.0% 2170 98.2% 188989 92.1% 15271 90.4% 204260 92.0%
Total 727 100.0% 42 100.0% 769 100.0% 2116 100.0% 94 100.0% 2210 100.0% 205201 100.0% 16894 100.0% 222095 100.0%
Presence of Medical
Condition
Has a Medical Condition
103 14.2% 2 4.8% 105 13.7% 290 13.7% 5 5.3% 295 13.3% 23022 11.2% 518 3.1% 23540 10.6%
No Medical Condition 624 85.8% 40 95.2% 664 86.3% 1826 86.3% 89 94.7% 1915 86.7% 182179 88.8% 16376 96.9% 198555 89.4%
Total 727 100.0% 42 100.0% 769 100.0% 2116 100.0% 94 100.0% 2210 100.0% 205201 100.0% 16894 100.0% 222095 100.0%
Race White 647 89.0% 38 90.5% 685 89.1% 1777 84.0% 78 83.0% 1855 83.9% 170257 83.0% 13378 79.2% 183635 82.7%
Black or African American
56 7.7% 2 4.8% 58 7.5% 270 12.8% 10 10.6% 280 12.7% 14780 7.2% 1044 6.2% 15824 7.1%
Asian 8 1.1% 2 4.8% 10 1.3% 17 0.8% 3 3.2% 20 0.9% 8648 4.2% 1321 7.8% 9969 4.5%
Other 16 2.2% 0 0.0% 16 2.1% 52 2.5% 3 3.2% 55 2.5% 11516 5.6% 1151 6.8% 12667 5.7%
Total 727 100.0% 42 100.0% 769 100.0% 2116 100.0% 94 100.0% 2210 100.0% 205201 100.0% 16894 100.0% 222095 100.0%
Imputed Gender
Male 323 44.4% 21 50.0% 344 44.7% 951 44.9% 50 53.2% 1001 45.3% 95265 46.4% 8601 50.9% 103866 46.8%
Female 404 55.6% 21 50.0% 425 55.3% 1165 55.1% 44 46.8% 1209 54.7% 109936 53.6% 8293 49.1% 118229 53.2%
Total 727 100.0% 42 100.0% 769 100.0% 2116 100.0% 94 100.0% 2210 100.0% 205201 100.0% 16894 100.0% 222095 100.0%
Residential Area Type
Urban 448 61.6% 38 90.5% 486 63.2% 1223 57.8% 86 91.5% 1309 59.2% 154178 75.1% 15803 93.5% 169981 76.5%
Rural 279 38.4% 4 9.5% 283 36.8% 893 42.2% 8 8.5% 901 40.8% 51023 24.9% 1091 6.5% 52114 23.5%
Total 727 100.0% 42 100.0% 769 100.0% 2116 100.0% 94 100.0% 2210 100.0% 205201 100.0% 16894 100.0% 222095 100.0%
22
3.2.3 NHTS Logit Model Results (Unweighted) Binary logit models for both the taxi/ridesharing use and ridesharing app usage questions were estimated. First, three models were run for the use of taxi and ridesharing services NHTS question. The responses to this question were formulated as a binary variable (1 = use taxi/ridesharing services and 0 = does not use taxi/ridesharing services). Model 1 used Tennessee respondents, Model 2 used respondents from Census Division 6, and Model 3 used all respondents (National). The results are shown in Table 3-3.
For all three models, household size has a negative, significant coefficient, suggesting that as the household size increases, the probability that the person will use taxi or ridesharing services will decrease.
For number of household vehicles, the coefficient is negative for all three models (TN, Census Division, and US) but is only significant at the census division and national level.
The imputed age variable was evaluated with a reference group of 18 to 24 years old. The preliminary results show that all other age groups are less likely to use taxi or ridesharing services. However, all age variables are significant for Model 3 (US) while the only significant age group for Model 2 (Census Division) is 55 and older.
The coefficients for the educational attainment variables were all positive when a reference group of high school graduate or less was used. This suggests that higher education results in a higher probability of using taxi or ridesharing services. The coefficients for all education levels were found to be significant in Model 3 (US) and the coefficients for a bachelor’s degree and a graduate/professional degree were found to be significant in Model 2 (Census Division).
The employment variable was found to be positive and significant in all three models. This suggests that being employed will increase the probability that someone will use a taxi or ridesharing.
For household income, a reference of less than $25,000 annual income was used. In Tennessee (Model 1), incomes of $100,000 to $149,999 and $150,000 or more were found to be positive (1.4314 and 2.3986, respectively) and significant. Similarly, these income groups and $75,000 to $99,999 were found to be positive and significant in Model 2 (Census Division). In Model 3 (US), all income groups greater than $50,000 were positive and significant. These results suggest that as income level increases, the probability that someone will use a taxi or ridesharing service increases.
Being of Hispanic or Latino origin was found to be significant and slightly positive with a value of 0.0692 in Model 3. Likewise, the coefficient for those who have a medical condition which makes travelling difficult was found to be positive and significant for Model 3.
Using “other” as a reference for the race category, the models suggest that being white or black will decrease the probability of using taxi or ridesharing services. This is significant for white in Model 3 and for black in Models 2 and 3.
The imputed gender variable suggests that females are slightly less likely to use taxi or ridesharing than males but is only significant for Model 3.
For all three levels, an urban setting was positive (ranging from 0.7220 to 0.9855) and significant. This suggests that people living in an urban area are more likely to use taxi or ridesharing compared to those living in a rural setting.
The goodness of fit in these models is moderate; the pseudo rho-squared values range from 0.1552 to 0.1992.
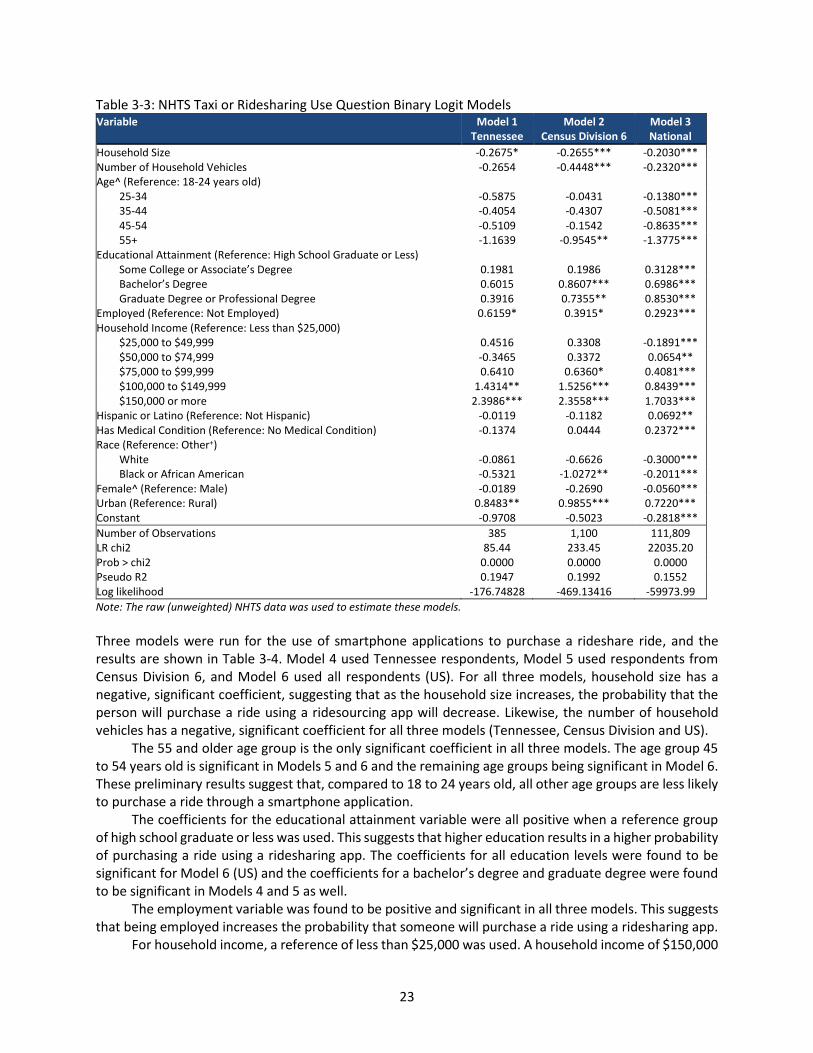
23
Table 3-3: NHTS Taxi or Ridesharing Use Question Binary Logit Models Variable
Model 1 Tennessee
Model 2 Census Division 6
Model 3 National
Household Size -0.2675* -0.2655*** -0.2030*** Number of Household Vehicles -0.2654 -0.4448*** -0.2320*** Age^ (Reference: 18-24 years old)
25-34 -0.5875 -0.0431 -0.1380*** 35-44 -0.4054 -0.4307 -0.5081*** 45-54 -0.5109 -0.1542 -0.8635*** 55+ -1.1639 -0.9545** -1.3775***
Educational Attainment (Reference: High School Graduate or Less) Some College or Associate’s Degree 0.1981 0.1986 0.3128*** Bachelor’s Degree 0.6015 0.8607*** 0.6986*** Graduate Degree or Professional Degree 0.3916 0.7355** 0.8530***
Employed (Reference: Not Employed) 0.6159* 0.3915* 0.2923*** Household Income (Reference: Less than $25,000)
$25,000 to $49,999 0.4516 0.3308 -0.1891*** $50,000 to $74,999 -0.3465 0.3372 0.0654** $75,000 to $99,999 0.6410 0.6360* 0.4081*** $100,000 to $149,999 1.4314** 1.5256*** 0.8439*** $150,000 or more 2.3986*** 2.3558*** 1.7033***
Hispanic or Latino (Reference: Not Hispanic) -0.0119 -0.1182 0.0692** Has Medical Condition (Reference: No Medical Condition) -0.1374 0.0444 0.2372*** Race (Reference: Other+)
White -0.0861 -0.6626 -0.3000*** Black or African American -0.5321 -1.0272** -0.2011***
Female^ (Reference: Male) -0.0189 -0.2690 -0.0560*** Urban (Reference: Rural) 0.8483** 0.9855*** 0.7220*** Constant -0.9708 -0.5023 -0.2818***
Number of Observations 385 1,100 111,809 LR chi2 85.44 233.45 22035.20 Prob > chi2 0.0000 0.0000 0.0000 Pseudo R2 0.1947 0.1992 0.1552 Log likelihood -176.74828 -469.13416 -59973.99
Note: The raw (unweighted) NHTS data was used to estimate these models.
Three models were run for the use of smartphone applications to purchase a rideshare ride, and the results are shown in Table 3-4. Model 4 used Tennessee respondents, Model 5 used respondents from Census Division 6, and Model 6 used all respondents (US). For all three models, household size has a negative, significant coefficient, suggesting that as the household size increases, the probability that the person will purchase a ride using a ridesourcing app will decrease. Likewise, the number of household vehicles has a negative, significant coefficient for all three models (Tennessee, Census Division and US).
The 55 and older age group is the only significant coefficient in all three models. The age group 45 to 54 years old is significant in Models 5 and 6 and the remaining age groups being significant in Model 6. These preliminary results suggest that, compared to 18 to 24 years old, all other age groups are less likely to purchase a ride through a smartphone application.
The coefficients for the educational attainment variable were all positive when a reference group of high school graduate or less was used. This suggests that higher education results in a higher probability of purchasing a ride using a ridesharing app. The coefficients for all education levels were found to be significant for Model 6 (US) and the coefficients for a bachelor’s degree and graduate degree were found to be significant in Models 4 and 5 as well.
The employment variable was found to be positive and significant in all three models. This suggests that being employed increases the probability that someone will purchase a ride using a ridesharing app.
For household income, a reference of less than $25,000 was used. A household income of $150,000
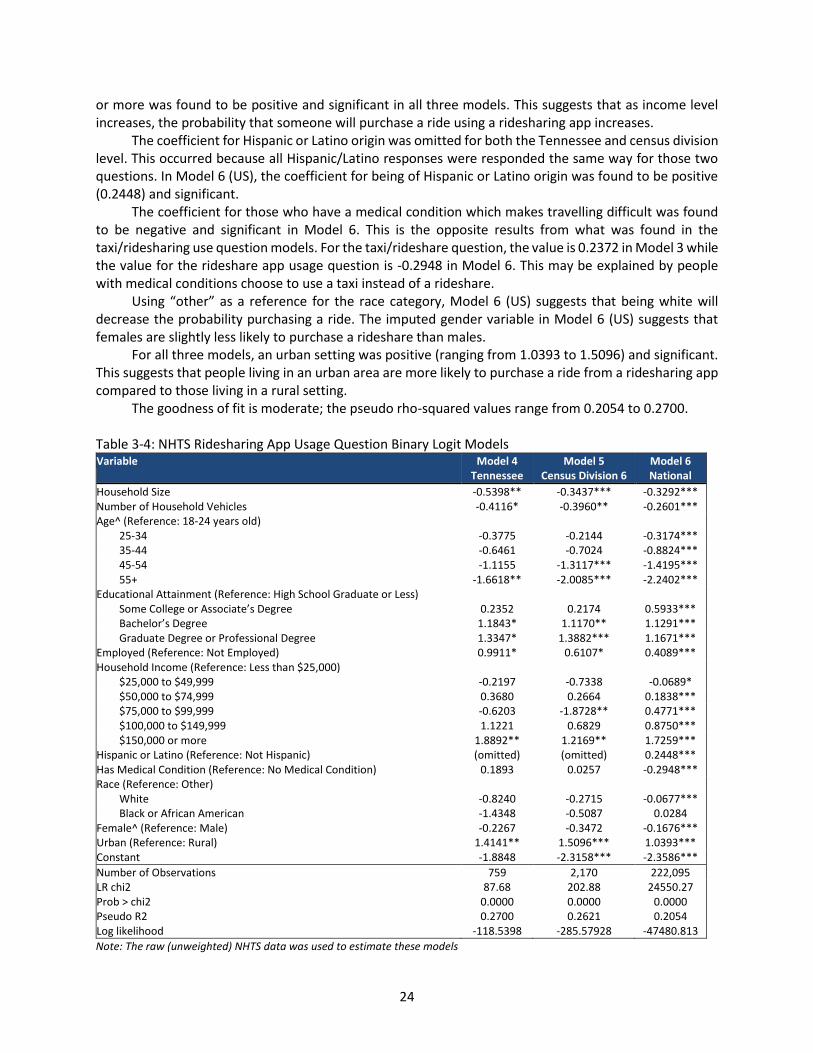
24
or more was found to be positive and significant in all three models. This suggests that as income level increases, the probability that someone will purchase a ride using a ridesharing app increases.
The coefficient for Hispanic or Latino origin was omitted for both the Tennessee and census division level. This occurred because all Hispanic/Latino responses were responded the same way for those two questions. In Model 6 (US), the coefficient for being of Hispanic or Latino origin was found to be positive (0.2448) and significant.
The coefficient for those who have a medical condition which makes travelling difficult was found to be negative and significant in Model 6. This is the opposite results from what was found in the taxi/ridesharing use question models. For the taxi/rideshare question, the value is 0.2372 in Model 3 while the value for the rideshare app usage question is -0.2948 in Model 6. This may be explained by people with medical conditions choose to use a taxi instead of a rideshare.
Using “other” as a reference for the race category, Model 6 (US) suggests that being white will decrease the probability purchasing a ride. The imputed gender variable in Model 6 (US) suggests that females are slightly less likely to purchase a rideshare than males.
For all three models, an urban setting was positive (ranging from 1.0393 to 1.5096) and significant. This suggests that people living in an urban area are more likely to purchase a ride from a ridesharing app compared to those living in a rural setting.
The goodness of fit is moderate; the pseudo rho-squared values range from 0.2054 to 0.2700.
Table 3-4: NHTS Ridesharing App Usage Question Binary Logit Models Variable Model 4
Tennessee Model 5
Census Division 6 Model 6 National
Household Size -0.5398** -0.3437*** -0.3292*** Number of Household Vehicles -0.4116* -0.3960** -0.2601*** Age^ (Reference: 18-24 years old)
25-34 -0.3775 -0.2144 -0.3174*** 35-44 -0.6461 -0.7024 -0.8824*** 45-54 -1.1155 -1.3117*** -1.4195*** 55+ -1.6618** -2.0085*** -2.2402***
Educational Attainment (Reference: High School Graduate or Less) Some College or Associate’s Degree 0.2352 0.2174 0.5933*** Bachelor’s Degree 1.1843* 1.1170** 1.1291*** Graduate Degree or Professional Degree 1.3347* 1.3882*** 1.1671***
Employed (Reference: Not Employed) 0.9911* 0.6107* 0.4089*** Household Income (Reference: Less than $25,000)
$25,000 to $49,999 -0.2197 -0.7338 -0.0689* $50,000 to $74,999 0.3680 0.2664 0.1838*** $75,000 to $99,999 -0.6203 -1.8728** 0.4771*** $100,000 to $149,999 1.1221 0.6829 0.8750*** $150,000 or more 1.8892** 1.2169** 1.7259***
Hispanic or Latino (Reference: Not Hispanic) (omitted) (omitted) 0.2448*** Has Medical Condition (Reference: No Medical Condition) 0.1893 0.0257 -0.2948*** Race (Reference: Other)
White -0.8240 -0.2715 -0.0677*** Black or African American -1.4348 -0.5087 0.0284
Female^ (Reference: Male) -0.2267 -0.3472 -0.1676*** Urban (Reference: Rural) 1.4141** 1.5096*** 1.0393*** Constant -1.8848 -2.3158*** -2.3586***
Number of Observations 759 2,170 222,095 LR chi2 87.68 202.88 24550.27 Prob > chi2 0.0000 0.0000 0.0000 Pseudo R2 0.2700 0.2621 0.2054 Log likelihood -118.5398 -285.57928 -47480.813
Note: The raw (unweighted) NHTS data was used to estimate these models

25
3.3 Conclusions and Future Research from the NHTS Analysis To summarize the results, Table 3-5 compares the findings of the literature review with the significant socioeconomic variables of the taxi and ridesharing frequency of use question and the ridesharing app usage question from the 2017 NTHS dataset. The results of the models generally align with the literature for six significant socioeconomic variables (age, income, educational attainment, employment status, number of household vehicles, and residential area type) at all three levels (state, division and national). However, there are some variables that are only significant at the national level in some of the models, such as some age groups, education, and number of vehicles in the household. A key finding of this analysis is that the demographic trends are not as easily identifiable for the state of Tennessee as compared to the Census Division or National model results. Therefore, additional analysis of rideshare users in Tennessee is deemed necessary to better understand demographics trends, which will be the focus of the next chapter.
Table 3-5: Comparison of NHTS Model Results with Literature Review Results Demographic
Variable Literature Review
Results Taxi/Ridesharing Frequency of Use
Model Results Ridesharing App Usage
Model Results
Age Ridesourcing users tend to be younger.
Age is not significant in Tennessee. 55 and older is negative and significant for Census Division 6 and US.
55 and older is negative and significant for all models. Additional age groups are significant for Census Division 6 and US.
Income Ridesourcing users tend to have a higher income.
Positive and significant coefficients for $100,000 to $149,999 and $150,000 or more for all models.
Positive and significant coefficient for $150,000 or more for all models.
Educational Attainment
Ridesourcing users tend to have a higher education.
Education is not significant in Tennessee. Bachelor's and Graduate Degrees are positive and significant for Census Division 6. All are significant for US.
Bachelor's and Graduate Degrees are positive and significant for all models.
Employment Status
Ridesourcing users tend to be employed.
Employed coefficient is positive and significant for all models.
Employed coefficient is positive and significant for all models.
Household Vehicles
Ridesourcing users tend to have fewer vehicles.
Households vehicles is not significant in Tennessee. Number of household vehicles coefficient is negative and significant for Census Division 6 and US.
Number of household vehicles coefficient is negative and significant for all models.
Residential Area Type
Ridesourcing users tend to be urban dwellers.
Urban area coefficient is positive and significant for all models.
Urban area coefficient is positive and significant for all models.
Notes: Models 1 and 4 represent Tennessee, Models 2 and 5 represent Census Division 6, and Models 3 and 6 are for the US. Bold denotes significant differences.
Last, there are some areas for improvement and future research that emerged from this chapter.
In order to improve the summary statistics for the state level, it would be necessary to create weights that represent the population as a whole, since the NHTS data only weighted to the Census Division level. The weighted summary statistics for Census Division 6 and National level data can be found in the Appendix. For future research, weights could be estimated for Tennessee or any other state. It would also be interesting to compare the responses of the 2017 NHTS to future NHTS data to see if there are changes in who is using ridesharing or if there is an increase in frequency of use of ridesharing in which case this model would not have to be binary (use or not use).

26
4 Survey of Ridehailing Users and Non-Users in Tennessee This chapter provides a detailed analysis of survey data collected in four major metropolitan areas of Tennessee for this research project in partnership with the company Populus Technologies, Inc. Before proceeding, it should be noted that the survey discussed in this chapter used the term ridehailing on the questionnaire, and therefore, this chapter uses the term ridehailing for consistency. The chapter is organized as follows: first, the survey data and methodology are described. Then, the detailed results of the survey are presented. Based on these results, a “typology” to describe different types of ridehailing users and non-users is proposed. This chapter ends with conclusions and areas for future research.
4.1 Tennessee Survey Data and Methodology The dataset for this project comes from a survey administered by the company Populus Technologies, Inc. between May and September of 2019, prior to the COVID-19 pandemic (Populus Technologies, 2020). In total, 1,000 people from the three largest metropolitan areas in Tennessee (Knoxville, Memphis, and Nashville) were surveyed. The dataset was weighted based on age, income, gender, race, and Hispanic/Latino origin based on 2017 American Community Survey (ACS) 5-year counts to be representative at the metropolitan level. In total, 996 respondents were weighted; the remaining four did not answer all these socioeconomic questions and were therefore excluded from the weighting process. The remainder of this chapter focuses on these 996 weighted responses, and the breakdown by metro area can be seen in the following Figure 4-1. Of the 996 respondents, 207 were from Knoxville (21%), 330 (33%) were from Memphis, and 459 respondents were from Nashville (46%).
Figure 4-1: Survey Respondents by Metro Area
The survey dataset included 494 different variables, with the majority relating to socioeconomic
characteristics of the respondents, attitudes of the respondents, ridehailing travel behavior characteristics, reasons for not using ridehailing, and a few other topics that can be found in the Appendix, such as questions asking if respondents had ever driven for a ridehailing company. Much of the subsequent analysis focuses on a single survey question that assesses ridehailing familiarity and adoption and was used to categorize respondents into groups. This ridehailing familiarity and adoption question was posed as follows: “Are you aware of app-based on-demand ride services such as Uber or Lyft? Please select the option that best applies to you.” There were five potential answers that could be selected:
21%
33%
46%
Metro Areas (Weighted, N=996)
Knoxville Memphis NashvilleData Source: Populus
Technologies, Inc.

27
1. Yes, I use them while traveling in/around the city 2. Yes, I use them only when traveling away for business or vacation 3. Yes, have ridden in them with friends or family, but don’t have the apps on my phone 4. Yes, heard of them, but haven’t used them 5. No, never heard of them.
The methodology used to analyze the survey data is briefly described in the following paragraphs. First, summary statistics were calculated for the survey questions pertaining to three categories: socioeconomics, attitudinal questions, and neighborhood questions. Socioeconomic questions included things such as age, race, income, and household size. Attitudinal questions explored topics such as willingness to adopt new technologies, the desire to drive less, and opinions about transit service. Neighborhood preference questions considered topics such as the importance of having restaurants within walking distance of home, limited traffic on the streets near the home, and personal outdoor space. Summary statistics were calculated for the entire sample (N=996) as well as for the five ridehailing adoption and familiarity groups.
Next, two additional sets of survey questions were explored to provide additional insights into different market segments. The first of these was a series of travel behavior survey questions for the user groups about their most recent ridehailing trip. The second questions were asked of the non-user group to explore their reasons for not using ridehailing.
Last, some of the survey data were used in a multivariate analysis. Numerous multinomial logit models were estimated, and one of the preferred model specifications is presented in this report. The dependent variable for this model was the familiarity and adoption of ridehailing question. While the original question had five groups for the ridehailing familiarity and adoption question, this was condensed into four groups for the analysis by combining those who have heard of but never used ridehailing and those who have never heard of ridehailing, since the latter group had a very small sample size (N=18). The independent variables that were considered for this model included socioeconomic variables, attitudinal variables, and neighborhood preferences. All models were estimated using STATA16 (StataCorp, 2019). The results are presented in the following section.
4.2 Results of the Survey for Tennessee This section presents the results of the survey data analysis for Tennessee. It is divided into seven subsections, beginning with the results of the ridehailing familiarity and adoption survey question.
4.2.1 Results of the Ridehailing Familiarity and Adoption Survey Question As seen in Figure 4-2, 20% (205 respondents) used ridehailing when traveling in/around the city, and 14% (141 respondents) used ridehailing only when traveling away for business or vacation. Another 13% (126 respondents) used ridehailing before, but only with friends or family. Additionally, 51%, or 505 respondents, had heard of ridehailing but never used it and 2%, or 17 respondents, had never heard of ridehailing. This question will be the basis of the subsequent analyses in this paper to explore the different demographic and travel behavior characteristics of these groups.
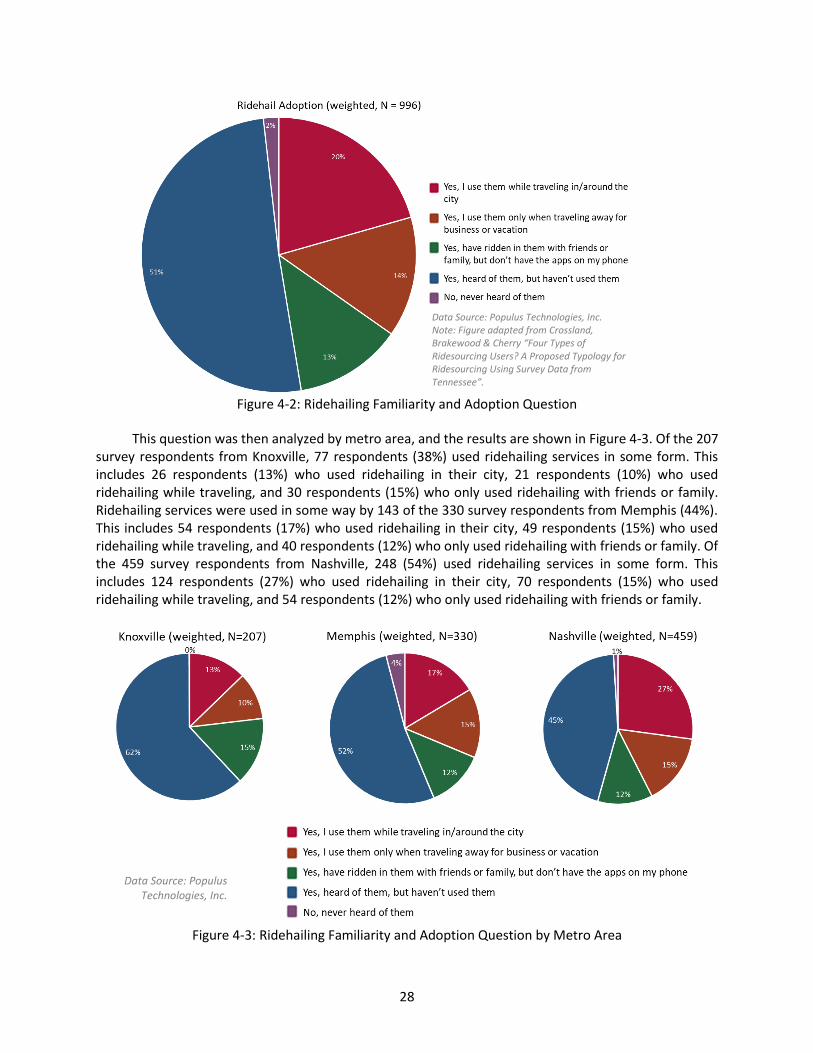
28
Figure 4-2: Ridehailing Familiarity and Adoption Question
This question was then analyzed by metro area, and the results are shown in Figure 4-3. Of the 207 survey respondents from Knoxville, 77 respondents (38%) used ridehailing services in some form. This includes 26 respondents (13%) who used ridehailing in their city, 21 respondents (10%) who used ridehailing while traveling, and 30 respondents (15%) who only used ridehailing with friends or family. Ridehailing services were used in some way by 143 of the 330 survey respondents from Memphis (44%). This includes 54 respondents (17%) who used ridehailing in their city, 49 respondents (15%) who used ridehailing while traveling, and 40 respondents (12%) who only used ridehailing with friends or family. Of the 459 survey respondents from Nashville, 248 (54%) used ridehailing services in some form. This includes 124 respondents (27%) who used ridehailing in their city, 70 respondents (15%) who used ridehailing while traveling, and 54 respondents (12%) who only used ridehailing with friends or family.
Figure 4-3: Ridehailing Familiarity and Adoption Question by Metro Area
Data Source: Populus Technologies, Inc.
Data Source: Populus Technologies, Inc. Note: Figure adapted from Crossland, Brakewood & Cherry “Four Types of Ridesourcing Users? A Proposed Typology for Ridesourcing Using Survey Data from Tennessee”.

29
4.2.2 Results of the Socioeconomic Survey Questions As seen in the following three figures, the survey respondents were asked a series of socioeconomic questions. Each of the socioeconomic questions is shown for the entire sample (N=996), and then broken into smaller groups based on the responses to the ridehailing familiarity and adoption question discussed in the previous section.
Figure 4-4 includes responses to socioeconomic questions relating to the respondent alone while the questions in
Figure 4-5 pertain to the household. Figure 4-6 shows results of questions pertaining to the
respondent’s banking and smartphone usage. The first question in Figure 4-4 pertains to age. The results reveal that 45% of those who used ridehailing in their city were 34 years old or younger, 17% (34 of 205) were in the 18 to 24 years old age range, and another 28% (58 of 205) were 25 to 34 years old. At the other end of the spectrum, 45% (226 of 506) of those who had heard of but never used ridehailing were 55 years old or older. The second question asks about race. Sixty-nine percent (141 of 205) of those who used ridehailing in their city identified as white. Meanwhile 53% of those who have used ridehailing with friends or family identified as a minority; 36% (45 of 126) were black or African American and an additional 17% (21 of 126) identified as another minority. In the overall sample, gender was fairly evenly split; 51% of respondents were female and the remaining 49% were male. Males were more likely to use ridehailing only when traveling (61% of this group, or 86 of 141). Sixty-two percent (77 of 126) of those who only used ridehailing with friends or family were female. Respondents were asked to specify the highest education level they completed, and the results were relatively evenly distributed overall. The group with largest proportion of higher education was those who used ridehailing when traveling (58% overall); this included 35% (49 of 141) with a bachelor’s degree and 23% (33 of 141) with a graduate or professional degree. For the overall sample and many of the sub-groups, about two-thirds of the sample size was employed while the remaining third was not. However, for those who had heard of but never used ridehailing, 50% (253 of 506) of respondents were employed and the other 50% (253 of 256) were not employed.
The last question pertains to the disability status of the respondent. For all groups, the majority of respondents claimed not to have a disability. The group with the largest amount of disabled people was those who have heard of but never used ridehailing with 22% (111 of 506). This may be a result of respondents feeling that a ridehailing vehicle would not be equipped to transport them properly.
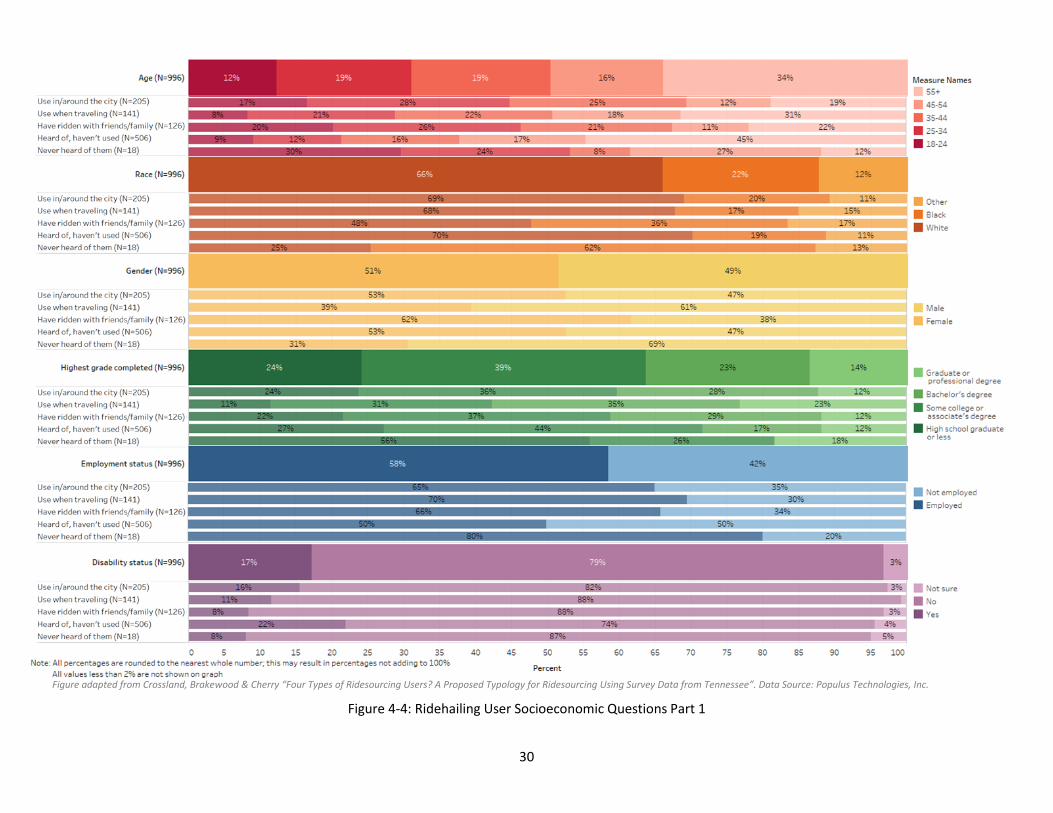
30
Figure 4-4: Ridehailing User Socioeconomic Questions Part 1
Figure adapted from Crossland, Brakewood & Cherry “Four Types of Ridesourcing Users? A Proposed Typology for Ridesourcing Using Survey Data from Tennessee”. Data Source: Populus Technologies, Inc.

31
The first question pertaining to household characteristics in Figure 4-5 was about the size of the household. Sixty-two percent of those who used ridehailing in their city either lived alone (21%, 44 of 205) or with one other person (41%, 84 of 205). Respondents were also asked about their annual household income. Thirty-eight percent of those who used ridehailing in their city had an annual household income of $75,000 or more, with 9% (19 of 205) having an income of $75,000 to $99,999, 17% (35 of 205) having an income of $100,000 to $149,999, and 12% (25 of 205) having an income of $150,000 or more. Fifty-two percent of those who used ridehailing when traveling have an annual household income of $75,000 or more, with 9% (13 of 141) having an income of $75,000 to $99,999, 23% (32 of 141) having an income of $100,000 to $149,999, and 20% (28 of 141) having an income of $150,000 or more. Of those who had heard of but never used ridehailing, just 26% of respondents had an annual household income of $75,000 or more with 9% (48 of 506) having an income of $75,000 to $99,999, 11% (58 of 506) having an income of $100,000 to $149,999, and 6% (32 of 506) having an income of $150,000 or more. Ten percent (20 of 205) of those who used ridehailing in their city reported that they do not have a car, which is higher than the four percent of the overall sample size. Of those who used ridehailing when traveling, 66% had at least two vehicles with 40% (57 of 141) having two vehicles, 21% (30 of 141) having three cars, and the remaining 5% (8 of 141) having four or more vehicles in their household. Respondents were also asked how many other members of their household had a license. The responses were fairly similar across the different groups. The final question relating to household factors pertained to location. Respondents were asked for their zip code, and this was then used to group them by urban versus rural areas. The urban classification was created by the authors based on the zip code provided by the respondent and comparing it to the TIGER 2010 Shapefile (Westat, 2020). If there was an urbanized area or urban cluster within the zip code, the entire zip code was considered urban. In all groups, the large majority of respondents live in an urban area. However, the highest number of rural respondents were in the group that had heard of but never used ridehailing with 11% (57 of 506).

32
Figure 4-5: Ridehailing User Socioeconomic Questions Part 2
Figure adapted from Crossland, Brakewood & Cherry “Four Types of Ridesourcing Users? A Proposed Typology for Ridesourcing Using Survey Data from Tennessee”. Data Source: Populus Technologies, Inc.

33
Figure 4-6 shows the responses to several questions pertaining to the respondent’s banking and smartphone usage. The first question asked respondents if they use a credit card, and about two-thirds of the entire sample said they used a credit card. Eighty-one percent (114 of 141) of those who used ridehailing when traveling use a credit card. Respondents were also asked if they use a debit card. This was the most popular banking type for the overall sample with 82% of all respondents indicating that they use a debit card. This was most common among the group that used ridehailing when traveling (91%, 129 of 141) and those who used ridehailing in their city (87%, 179 of 205).
Prepaid cards were most popular among those who used ridehailing in their city (19%, 38 of 205), although this was a relatively small percentage compare to the previously mentioned credit card and debit card utilization percentages. Almost everyone in the sample (95%) responded that they use a smartphone. Eight percent (41 of 506) of those who had heard of but never used ridehailing did not use a smartphone. This may be a contributing factor as to why they do not use ridehailing since ridehailing services are typically booked via a smartphone application.
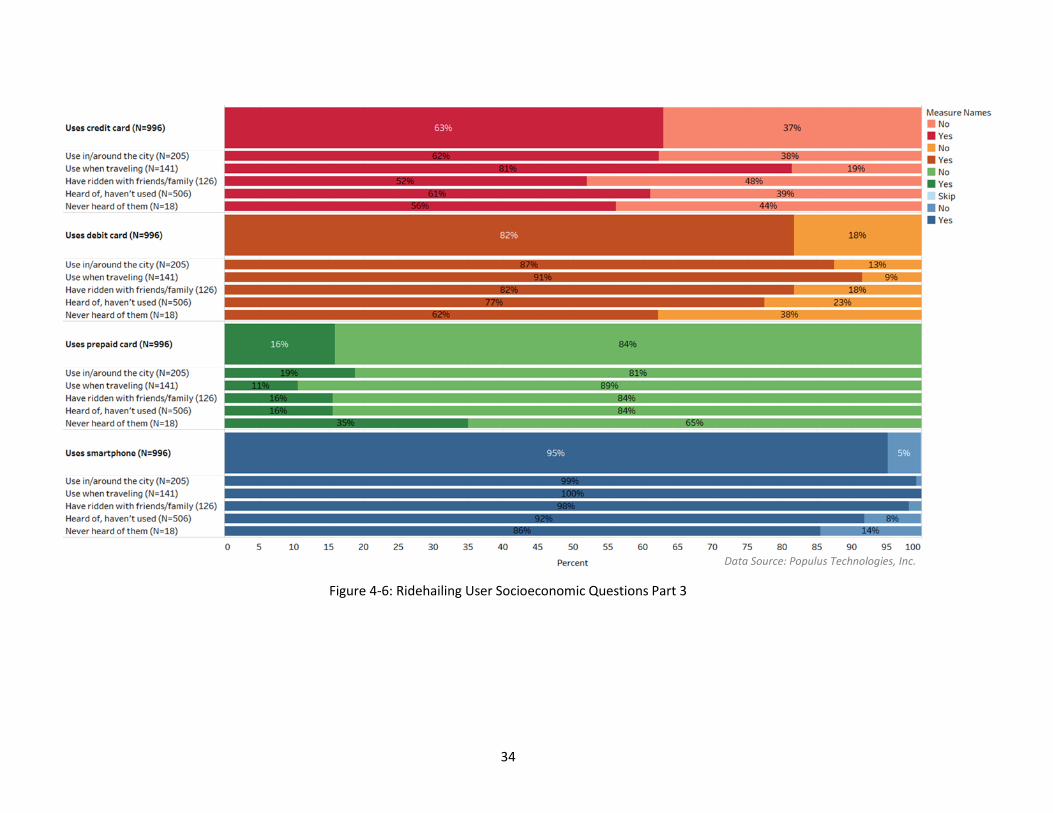
34
Figure 4-6: Ridehailing User Socioeconomic Questions Part 3
Data Source: Populus Technologies, Inc.
35
4.2.3 Results of the Attitudinal Survey Questions Figure 4-7 provides the survey results for seven attitudinal questions. Again, the responses are shown for the entire sample and then broken down into groups based on the response to the ridehailing familiarity and adoption question. The first attitudinal question asked how strongly you agree or disagree that, “I am generally among the first to try a new technology”. Fifty-three percent of those who used ridehailing in their city agreed with this statement (15%, or 31 of 205, strongly agreeing and 38%, or 77 of 205, agreeing). Forty-nine percent of those who used ridehailing while traveling agreed with this statement; this included 15% (21 of 141) strongly agreeing and 34% (48 of 141) agreeing. Just 31% of those who had heard of but never used ridehailing agreed; there were 6% (32 of 506) strongly agreeing and 25% (128 of 506) agreeing. The second statement shown in the figure is, “It takes too much time and effort to do things that are environmentally friendly”. Seventeen percent of those who used ridehailing in their city agreed with this statement, and this included 3% (7 of 205) strongly agreeing and 14% (28 of 205) agreeing. Twenty-eight percent of those who used ridehailing while traveling agreed; there were 7% (10 of 141) strongly agreeing and 21% (30 of 141) agreeing. The responses to both of the following statements, “If I had more money, I’d buy a nicer car” and “Owning and maintaining a car is a pain” were fairly evenly distributed for the different groups. Respondents were asked how strongly they agreed or disagreed with the following statement: “If I could, I’d like to drive less”. Of those who used ridehailing in their city, 47% agreed with this statement, including 19% (38 of 205) strongly agreeing and 28% (57 of 205) agreeing. Fifty percent of those who used ridehailing when traveling agreed (sum of 21%, or 30 of 141, strongly agreeing and 29%, or 41 of 141, agreeing). Of those who only used ridehailing with friends or family, 46% agreed with this statement, including 12% (15 of 126) strongly agreeing and 34% (43 of 126) agreeing. The final two statements concerned public transportation. Those who use ridehailing in their city were most likely to agree (46%) with the first statement, “Public transit can get me to many of the place I go”. This included 18% (36 of 205) strongly agreeing and 28% (57 of 205) agreeing. Those who had heard of but never use ridehailing were least likely to agree (21%), including 7% (37 of 506) strongly agreeing and 14% (73 of 506) agreeing. For the second transit related attitudinal question, “Taking public transit just isn’t for me”, those who used ridehailing in their city were the least likely (40%) to agree; this was comprised of 14% (28 of 205) strongly agreeing and 26% (53 of 205) agreeing. Those who had heard of but never use ridehailing were most likely (59%) to agree with this statement, including 38% (194 of 506) strongly agreeing and 21% (107 of 506) agreeing.

36
Figure 4-7: Ridehailing User Attitudinal Questions
Figure adapted from Crossland, Brakewood & Cherry “Four Types of Ridesourcing Users? A Proposed Typology for Ridesourcing Using Survey Data from Tennessee”. Data Source: Populus Technologies, Inc.

37
4.2.4 Results of the Neighborhood Preference Survey Questions Six neighborhood preference questions were posed to survey respondents. Respondents were asked to indicate the relative importance of each of these neighborhood-related statements, and the results are shown in Figure 4-8. Again, the responses are shown for the entire sample and then broken down into groups based on the response to the ridehailing familiarity and adoption question. The first neighborhood preference question asked the relative importance of the, “Ability to commute to work or school by public transit”. Twenty-three percent of those who used ridehailing in their city found this to be essential (7%, 14 of 205) or very important (16%, 32 of 205). Fourteen percent of those who had heard of but never used ridehailing found commuting by public transit to be essential (4%, 22of 506) or very important (10%, 52 of 506). The second question shown in the figure asked the importance of having, “Shops and restaurants are within walking distance of my home”. Thirty-two percent of those who used ridehailing in their city found this to be essential (5%, 10 of 205) or very important (27%, 56 of 205), while 15% of those who used ridehailing when traveling found this to be essential (3%, 5 of 141) or very important (12%, 17 of 141). Sixteen percent of those who had heard of but never used ridehailing found this to be essential (5%, 28 of 506) or very important (11%, 58 of 506). Thirty-one percent of those who used ridehailing in their city found that having “Safe routes for biking” was essential (10%, 20 of 205) or very important (21%, 44 of 205), whereas just 25% of those who had heard of but never used ridehailing found this to be essential (7%, 34 of 506) or very important (18%, 90 of 506). Responses for the statement “Limited car traffic on streets near my home” were fairly even amongst the groups. The statement “Having a driveway or garage to park a car” was found to be the most important to those who used ridehailing when traveling, including 39% (55 of 141) stating this was essential and another 35% (49 of 141) choosing very important. The final neighborhood preference question asked how important is “Having my own outdoor space”. Twenty-five percent (51 of 205) of those who used ridehailing in their city and 23% (30 of 126) of those who used ridehailing with friends and family found this to be essential, which is lower than the total survey sample of 33%.
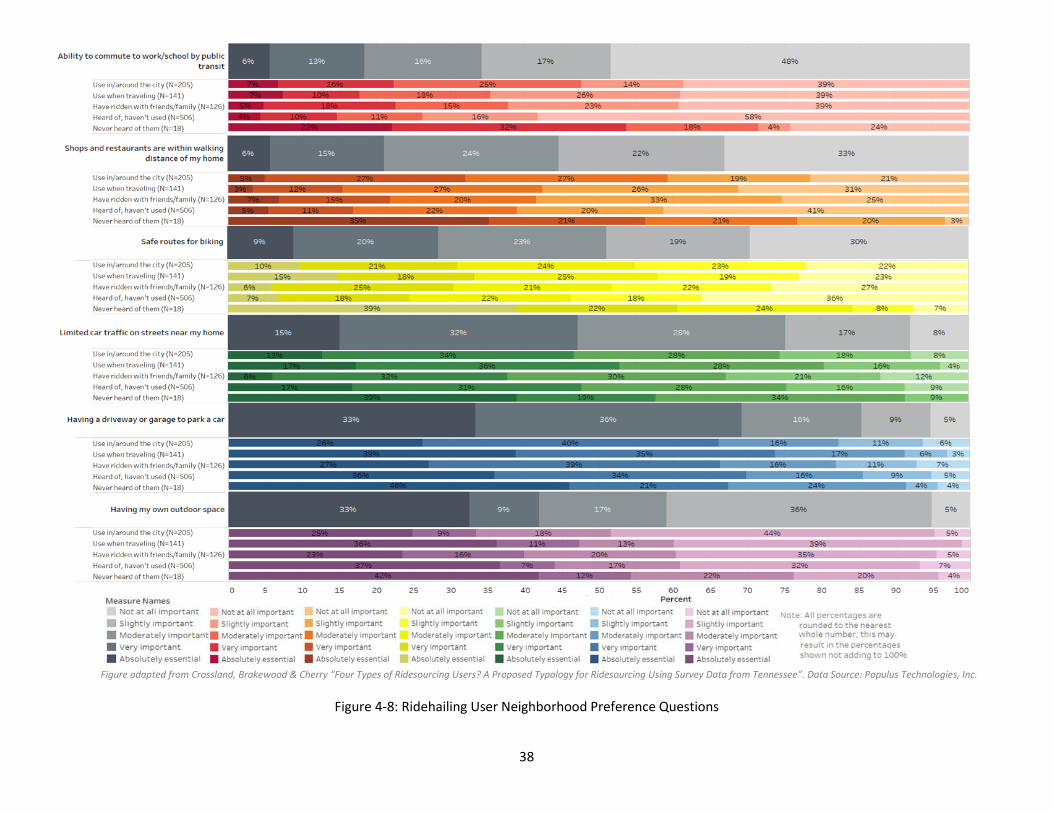
38
Figure 4-8: Ridehailing User Neighborhood Preference Questions
Figure adapted from Crossland, Brakewood & Cherry “Four Types of Ridesourcing Users? A Proposed Typology for Ridesourcing Using Survey Data from Tennessee”. Data Source: Populus Technologies, Inc.
39
4.2.5 Results of the Last Ridehailing Trip Survey Questions As part of the survey, respondents who previously stated that they use ridehailing in/around the city or when traveling were then asked several questions about their last ridehailing trip. Table 4-1 compares the responses for those who use ridehailing in/around the city with those who use ridehailing only when traveling. Two hundred and fifty-five people (158 that use ridehailing in/around the city and 97 that use ridehailing only when traveling) responded to this series of questions. The first question involved trip purpose. The most common trip purposes for those who use in/around the city were social events (45.6%, 72 of 158) and shopping or other personal errands (22.2%, 35 of 158) while the most common trip purposes for those who use ridehailing only when traveling were social events (34.0%, 33 of 97) and going to and from the airport (26.8%, 28 of 97). These results are highly significant (p=7.1E-5). Respondents were also asked about the time of day of their latest trip. The most common time periods for those who use ridehailing in/around the city were 9 a.m. to 4 p.m. (43 of 158, or 27.2%) and 7 p.m. to midnight (42 of 158, or 26.6%) compared to the most common time periods for who use ridehailing only when traveling being 9 a.m. to 4 p.m. (27 of 97, or 27.8%) and 4 p.m. to 7 p.m. (23.7%). The largest difference between the groups occurs between midnight and 7 a.m. when 15.8% (25 of 158) those who use ridehailing in/around the city took their last ridehailing trip compared to only 8.2% (8 of 97) of those who use ridehailing when traveling. These results are somewhat significant (p-value =0.087).
Respondents were asked what day of the week their trip was made with the option to select weekday, Saturday, Sunday, or don’t know. Fifty percent of trips made by those who use ridehailing in/around the city (79 of 158) occurred on a weekday and 31% (49 of 158) occurred on Saturday. For those who use ridehailing while traveling, 48.5% of trips (47 of 97) occurred on a weekday and 22.7% (22 of 97) occurred on Saturday. These results are weakly significant (p=0.099). Total cost of the most recent trip taken was another point of inquiry. Forty-two percent of those who use ridehailing in/around the city (67 of 158) said that their last trip cost $10 or less compared to just 27.8% (27 of 97) of those who use ridehailing only when traveling paying that amount. The second most common price range for those who use ridehailing only when traveling to pay for their last trip was between $11 and $15 (25.8%, 25 of 97). These results are weakly significant (p=0.089).
Respondents were asked how many people were in their Uber or Lyft during their last trip. For both those who use ridehailing in/around the city and those who use ridehailing only when traveling, it was most common to ride alone. However, these results were not significant (p=0.287).
Respondents were also asked which service they used on their last trip. For both groups, Uber was the most used ridehailing service with 61.8% (97 of the 157) of those who use ridehailing in/around the city and 74.0% (71 of 96) of those who use ridehailing only when traveling. These results were significant (p=0.047). The final question pertaining to the last trip was which mode the respondent would have used if Uber or Lyft had not been an option. The most common alternative modes for those who use ridehailing in/around the city were to drive (47.1%, 74 of 157) or to not make the trip (21.7%, 34 of 157). The most common alternative modes for those who use ridehailing only when traveling was to drive (43.2%, 41 of 95) or to use a taxi (35.8%, 34 of 95). These results were highly significant with a p-value of 0.001.

40
Table 4-1: Last Ridehailing Trip for Those Using Ridehailing in/Around the City and Only When Traveling
In/Around the City Only When Traveling Total
# % # % # % Total 158 100.0% 97 100.0% 255 100.0%
Trip Purpose
Commute 22 13.9% 8 8.2% 30 11.8%
Going to/ from airport 12 7.6% 26 26.8% 38 14.9%
Shopping/Personal Errands 35 22.2% 12 12.4% 47 18.4%
Social events 72 45.6% 33 34.0% 105 41.2%
Other 17 10.8% 18 18.8% 35 13.7%
Pearson chi2=24.2567, p=7.1E-5***
Time of Day
Morning (7 a.m. to 9 a.m.) 16 10.1% 10 10.3% 26 10.2%
Midday (9 a.m. to 4 p.m.) 43 27.2% 27 27.8% 70 27.5%
Evening (4 p.m. to 7 p.m.) 26 16.5% 23 23.7% 49 19.2%
Late evening (7 p.m. to midnight) 42 26.6% 19 19.6% 61 23.9%
Overnight (midnight to 7 a.m.) 25 15.8% 8 8.2% 33 12.9%
Don't know/ can't remember 6 3.8% 10 10.3% 16 6.3%
Pearson chi2=9.6131, p=0.087*
Day of Week
Weekday 79 50.0% 47 48.5% 126 49.4%
Saturday 49 31.0% 22 22.7% 71 27.8%
Sunday 13 8.2% 7 7.2% 20 7.8%
Don't know/can't remember 17 10.8% 21 21.6% 38 14.9%
Pearson chi2=6.3891, p=0.099*
Cost of Trip
Less than $10 67 42.4% 27 27.8% 94 36.9%
$11-$15 32 20.3% 25 25.8% 57 22.4%
$16-$20 19 12.0% 20 20.6% 39 15.3%
$21-$30 27 17.1% 14 14.4% 41 16.1%
$30 or more 13 8.2% 11 11.3% 24 9.4%
Pearson chi2=8.0645, p=0.089*
Vehicle Occupancy
Total 157 100.0% 97 100.0% 254 100.0%
None, just me 84 53.5% 44 45.4% 128 50.4%
1 other person who I know 48 30.6% 39 40.2% 87 34.3%
2 or more people who I know 25 15.9% 14 14.4% 39 15.4%
Pearson chi2=3.9582, p=0.287
Service Used
Total 157 100.0% 96 100.0% 253 100.0%
Lyft 60 38.2% 25 26.0% 85 33.6%
Uber 97 61.8% 71 74.0% 168 66.4%
Pearson chi2=3.9582, p=0.047**
Alternative Mode
Total 157 100.0% 95 100.0% 252 100.0%
Drive 74 47.1% 41 43.2% 115 45.6%
Transit 15 9.6% 6 6.3% 21 8.3%
Taxi 22 14.0% 34 35.8% 56 22.2%
Walk 12 7.6% 6 6.3% 18 7.1%
Wouldn't have made trip 34 21.7% 8 8.4% 42 16.7%
Pearson chi2=19.9468, p=0.001***
* p<0.1; ** p<0.05; *** p<0.01. Data source: Populus Technologies, Inc. Notes: Some questions had minor differences in the response rate. Table adapted from Crossland, Brakewood and Cherry “Four Types of Ridesourcing Users? A Proposed Typology for Ridesourcing Using Survey Data from Tennessee”.
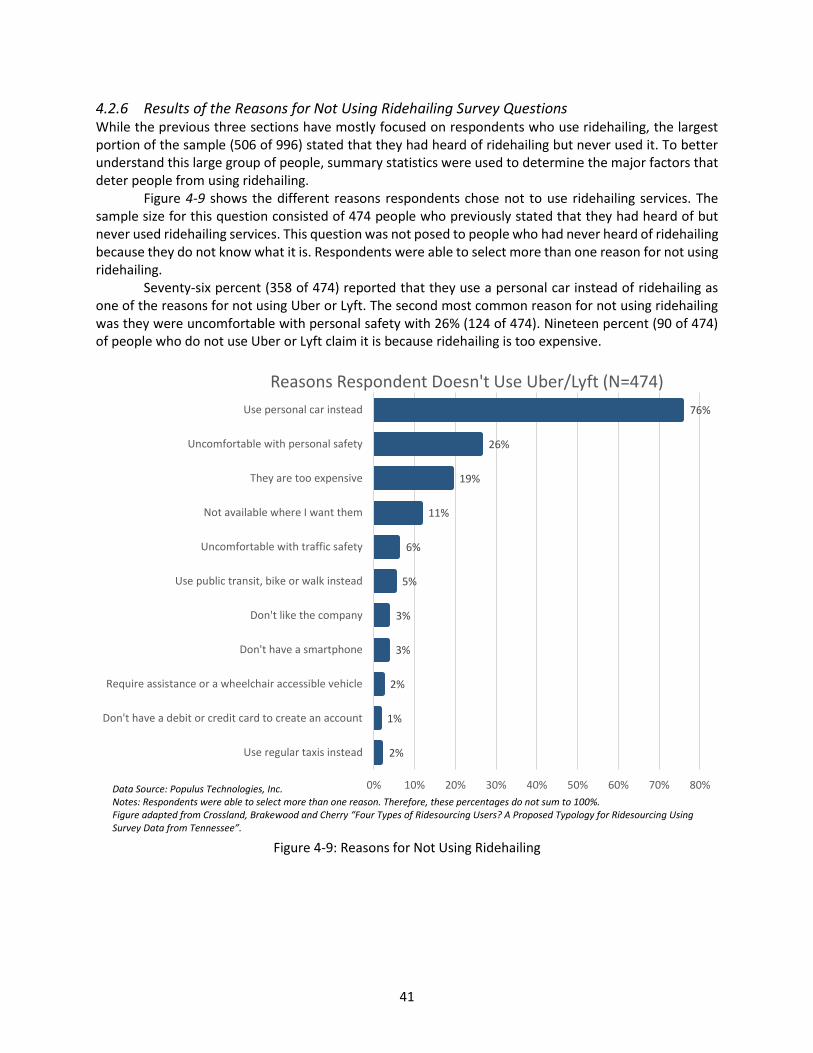
41
4.2.6 Results of the Reasons for Not Using Ridehailing Survey Questions While the previous three sections have mostly focused on respondents who use ridehailing, the largest portion of the sample (506 of 996) stated that they had heard of ridehailing but never used it. To better understand this large group of people, summary statistics were used to determine the major factors that deter people from using ridehailing.
Figure 4-9 shows the different reasons respondents chose not to use ridehailing services. The sample size for this question consisted of 474 people who previously stated that they had heard of but never used ridehailing services. This question was not posed to people who had never heard of ridehailing because they do not know what it is. Respondents were able to select more than one reason for not using ridehailing.
Seventy-six percent (358 of 474) reported that they use a personal car instead of ridehailing as one of the reasons for not using Uber or Lyft. The second most common reason for not using ridehailing was they were uncomfortable with personal safety with 26% (124 of 474). Nineteen percent (90 of 474) of people who do not use Uber or Lyft claim it is because ridehailing is too expensive.
Figure 4-9: Reasons for Not Using Ridehailing
2%
1%
2%
3%
3%
5%
6%
11%
19%
26%
76%
0% 10% 20% 30% 40% 50% 60% 70% 80%
Use regular taxis instead
Don't have a debit or credit card to create an account
Require assistance or a wheelchair accessible vehicle
Don't have a smartphone
Don't like the company
Use public transit, bike or walk instead
Uncomfortable with traffic safety
Not available where I want them
They are too expensive
Uncomfortable with personal safety
Use personal car instead
Reasons Respondent Doesn't Use Uber/Lyft (N=474)
Data Source: Populus Technologies, Inc. Notes: Respondents were able to select more than one reason. Therefore, these percentages do not sum to 100%. Figure adapted from Crossland, Brakewood and Cherry “Four Types of Ridesourcing Users? A Proposed Typology for Ridesourcing Using Survey Data from Tennessee”.
42
4.2.7 Results of the Multinomial Logit Models Table 4-2 presents the results of one of the preferred multinomial logit models.
The age variable was evaluated with a reference group of 18 to 24 years old, and the model results show that all other age groups were less likely to use ridehailing in some capacity. Being between the ages of 35 and 44 was only significant for those who use ridehailing with friends or family and the coefficient was negative. For ages 45 to 54, the values for all three groups were negative but was only significant for those who use ridehailing in/around the city and those who use ridehailing with their friends or family. Being 55 years or older was significant and negative for all three groups. This age group was most negative and significant for those who use ridehailing in/around the city while it was least negative and less significant for those who use ridehailing only when traveling.
Using White/Caucasian as the reference, there was significant differences between the three ridehailing user groups for race. Those who are black were less likely to use ridehailing in/around the city but were more likely to use ridehailing with friends or family. Both of these findings were significant. Being black was not significant for those who use ridehailing while traveling; however, being of another race (i.e., not white or black) was found to increase the likelihood that a person would use ridehailing when traveling. This is less significant than the findings for the other two groups.
A significant finding for gender was those who use ridehailing with friends or family were more likely to be female.
The education variable was evaluated with a reference group high school graduate or less, and the table shows that all other education levels were more likely to use ridehailing in some capacity. Having completed some college or having an associate’s degree was only significant for those who use ridehailing only when traveling and was positive. Having a bachelor’s degree was significant and positive for all three groups. This was largest in magnitude for those who use ridehailing when traveling. Having a graduate or professional degree was only significant for those who use ridehailing when traveling.
While living in a rural area had a negative value compared to living in an urban area for all three groups, this was only significant for those who use ridehailing in/around the city and those who use ridehailing when traveling.
For household income, a reference of less than $25,000 annual income was used. In all three groups, the coefficients for household incomes of $75,000 and above were positive and significant. These results suggest that as income level increases, the probability that someone will use ridehailing also increases.
Using zero household vehicles as a reference, all coefficients for one or more household vehicles were large, negative values and highly significant for those of who use ridehailing in/around the city. Meanwhile, number of household vehicles was not significant for those who use ridehailing only when traveling or for those who use ridehailing with friends or family.
For the neighborhood preference “limited car traffic on streets near my home”, the reference category was “not at all important”. Compared to those who think that it is not at all important to have limited car traffic on the streets near their home, those who find this to be absolutely essential were significantly less likely to use ridehailing with friends or family.
For the neighborhood preference “shops and restaurants are within walking distance of my home”, the reference category was “not at all important”. For those who use ridehailing in/around the city, the coefficients for moderately important and very important were positive and significant. While all responses were positive for those who use ridehailing with friends or family, only the coefficient for slightly important was significant. For those who use ridehailing when traveling, the only significant coefficient was absolutely essential and this was negative.
The goodness of fit for this model is moderate; the pseudo rho-squared value is 0.1455.

43
Table 4-2: Multinomial Model Results In/Around the City Only When Traveling With Friends/Family
Age
18-24 (Reference) - - - 25-34 -0.00838 (0.296) 0.103 (0.416) -0.331 (0.328) 35-44 -0.394 (0.313) -0.129 (0.433) -0.661* (0.356) 45-54 -1.484*** (0.365) -0.616 (0.450) -1.548*** (0.418) 55+ -1.727*** (0.325) -0.839** (0.420) -1.653*** (0.361)
Race White or Caucasian (Reference) - - - Black or African American -0.574** (0.249) -0.0447 (0.313) 0.598** (0.276) Other -0.437 (0.295) 0.610* (0.328) 0.282 (0.238)
Gender Female (Reference) - - - Male -0.339* (0.197) 0.355 (0.229) -0.543** (0.238)
Education
High School Graduate or Less (Ref.) - - - Some College or Associate’s Degree 0.297 (0.235) 0.817** (0.350) -0.00013 (0.273) Bachelor's Degree 0.801*** (0.279) 1.332*** (0.379) 0.726** (0.314) Graduate or Professional Degree 0.318 (0.355) 1.065** (0.425) -0.0573 (0.433)
Urban or Rural Urban (Reference) - - - Rural -0.888** (0.441) -0.954* (0.558) -0.289 (0.450)
Annual Household Income
Under $25,000 (Reference) - - - $25,000 to $49,999 0.499** (0.253) 0.830** (0.373) 0.341 (0.297) $50,000 to $74,999 0.672** (0.312) 1.258*** (0.409) 0.438 (0.377) $75,000 to $99,999 0.954** (0.398) 1.014* (0.519) 1.441*** (0.409) $100,000 to $149,999 1.233*** (0.370) 1.804*** (0.456) 1.477*** (0.420) $150,000 or more 1.696*** (0.438) 2.244*** (0.518) 1.337** (0.551)
Number of Household Vehicles
0 vehicles (Reference) - - - 1 vehicle -1.150*** (0.388) 1.026 (1.067) -0.301 (0.512) 2 vehicles -1.699*** (0.410) 0.618 (1.076) -0.736 (0.533) 3 vehicles -1.709*** (0.476) 0.787 (1.099) -0.773 (0.603) 4 or more vehicles -1.972*** (0.585) -0.0171 (1.193) -0.577 (0.676)
I am generally among the first to try a new
technology
Disagree (Reference) - - - Neither agree nor disagree -0.0722 (0.257) 0.217 (0.298) -0.208 (0.303) Agree 0.318 (0.218) 0.424 (0.261) 0.167 (0.252)
Public transit can get me to many of the
places I go
Disagree (Reference) - - - Neither agree nor disagree 0.105 (0.270) -0.691* (0.369) 0.302 (0.288) Agree 0.787*** (0.215) 0.391 (0.257) 0.303 (0.260)
Limited car traffic on streets near my home
Not at all important (Reference) - - - Slightly important 0.115 (0.378) 0.915 (0.560) -0.157 (0.419) Moderately important -0.306 (0.360) 0.744 (0.538) -0.352 (0.391) Very important -0.344 (0.356) 0.843 (0.533) -0.462 (0.389) Absolutely essential -0.497 (0.405) 0.914 (0.567) -1.355*** (0.505)
Shops and restaurants are within walking
distance of my home
Not at all important (Reference) - - - Slightly important 0.329 (0.274) 0.214 (0.290) 0.667** (0.294) Moderately important 0.576** (0.263) 0.265 (0.295) 0.169 (0.315) Very important 1.003*** (0.290) -0.192 (0.380) 0.356 (0.369) Absolutely essential -0.199 (0.444) -1.455** (0.699) 0.271 (0.458)
Constant 0.119 (0.574) -4.927*** (1.256) -0.746 (0.691)
Observations 996 Likelihood Ratio Chi2 342.54
Pseudo R2 0.1455 Log Likelihood -1006.1456
* p<0.1; ** p<0.05; *** p<0.01 Data Source: Populus Technologies, Inc. Notes: Standard error is in the parentheses. Model uses “Never Used” as reference group. Table adapted from Crossland, Brakewood and Cherry “Four Types of Ridesourcing Users? A Proposed Typology for Ridesourcing Using Survey Data from Tennessee”.

44
4.3 Conclusions and Future Research from the Survey for Tennessee The results of the previous analyses reveal that there appear to be four distinct ridehailing user types. The first type of ridehailing user is comprised of those using ridehailing in/around the city; these respondents are likely to be young urban local users. The second type is those using ridehailing primarily when traveling, and this group will be referred to as wealthy travelers. The third type only uses ridehailing with friends or family, and this type will be called tagalong users. Finally, those who have never used or never heard of ridehailing are the non-user type. Each of these types is described in more detail below.
4.3.1 Type 1: Young Urban Local Users The young urban local user group is the largest user group with a sample size of 205 respondents (20%); it is second largest in overall sample size when compared to the non-user group. These users are typically millennials who are living in the city and have higher incomes. Because these people are often living in the city, they tend not to own a vehicle. In terms of their attitudes, they generally agree that public transit is able to get them to where they need to go; since they are in urban areas, public transit is likely more frequent and available. This group tends to use ridehailing services to go out to social events or to go shopping. Consequently, if these people were not able to use ridehailing, they would either drive or would not make the trip at all. In summary, the young urban local users are using ridehailing for non-essential trips meaning that ridehailing is a convenient mode that allows them to do extra things. This group encompasses the majority of the socioeconomics stated in the previous literature, likely because this is the largest group of ridehailing users.
4.3.2 Type 2: Wealthy Travelers The wealthy traveler type makes up about 14% (141 of 996) of all survey respondents, making it the third largest group overall and the second largest user group. The wealthy travelers group tends to be slightly older than young urban local users but still younger than 55 years old. These users are highly educated and have high incomes. These users make most of their trips to and from airports or for social purposes, such as restaurants. From the survey questions, it is unclear whether the trips to and from the airport were for business or leisure travel. Due to the nature of when the wealthy travelers are using ridehailing (when they are not in their home city), these users will either drive, most likely a rental car, or take a taxi if ridehailing services are not available. Last, this group has not been well studied in the past, which is likely due to the nature of most travel surveys being household based.
4.3.3 Type 3: Tagalong Users The tagalong users are the smallest group of people using ridehailing, with 126 respondents (13%) in this group. Like young urban local users, tagalong users tend to be millennials or younger. It is also more likely that these users are female and/or black/African American. The reasons for only using ridehailing when with friends or family could be a result of safety concerns. While this group is overall similar to the young urban local users, the significance of race and gender are key differentiating factors. Similar to the wealthy travelers, this group has not been frequently studied in previous literature. Since this group had not been studied before, we coined the term tagalong users for this group since they only use ridehailing with other people.
4.3.4 Type 4: Non-Users This group is the largest group of survey respondents, making up 53% of the entire sample (524 of 996). Compared to the three other groups, non-users tend to be older, live in rural areas, and/or have lower income. When non-users were asked why they choose to not use ridehailing services, the most common reasons, in descending order, were they could use their own car, they felt their personal safety would be at risk, and they found ridehailing to be too expensive. Non-users have often been studied in previous
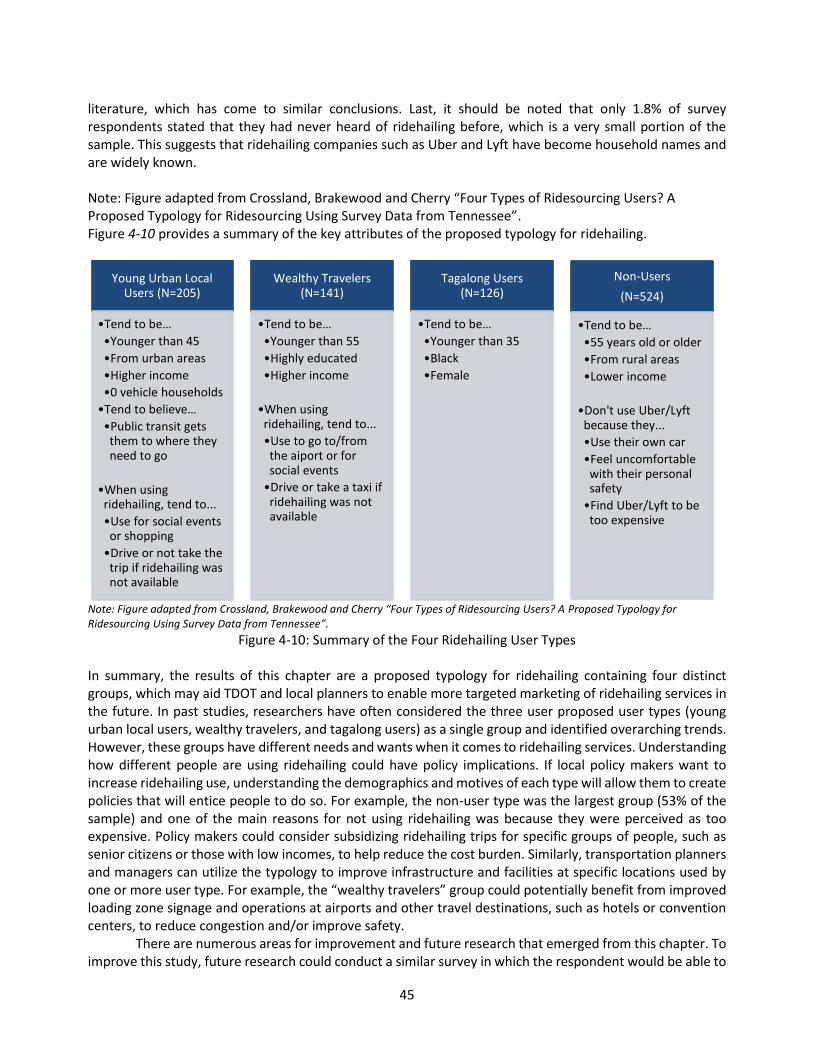
45
literature, which has come to similar conclusions. Last, it should be noted that only 1.8% of survey respondents stated that they had never heard of ridehailing before, which is a very small portion of the sample. This suggests that ridehailing companies such as Uber and Lyft have become household names and are widely known. Note: Figure adapted from Crossland, Brakewood and Cherry “Four Types of Ridesourcing Users? A Proposed Typology for Ridesourcing Using Survey Data from Tennessee”. Figure 4-10 provides a summary of the key attributes of the proposed typology for ridehailing.
Note: Figure adapted from Crossland, Brakewood and Cherry “Four Types of Ridesourcing Users? A Proposed Typology for Ridesourcing Using Survey Data from Tennessee”.
Figure 4-10: Summary of the Four Ridehailing User Types In summary, the results of this chapter are a proposed typology for ridehailing containing four distinct groups, which may aid TDOT and local planners to enable more targeted marketing of ridehailing services in the future. In past studies, researchers have often considered the three user proposed user types (young urban local users, wealthy travelers, and tagalong users) as a single group and identified overarching trends. However, these groups have different needs and wants when it comes to ridehailing services. Understanding how different people are using ridehailing could have policy implications. If local policy makers want to increase ridehailing use, understanding the demographics and motives of each type will allow them to create policies that will entice people to do so. For example, the non-user type was the largest group (53% of the sample) and one of the main reasons for not using ridehailing was because they were perceived as too expensive. Policy makers could consider subsidizing ridehailing trips for specific groups of people, such as senior citizens or those with low incomes, to help reduce the cost burden. Similarly, transportation planners and managers can utilize the typology to improve infrastructure and facilities at specific locations used by one or more user type. For example, the “wealthy travelers” group could potentially benefit from improved loading zone signage and operations at airports and other travel destinations, such as hotels or convention centers, to reduce congestion and/or improve safety. There are numerous areas for improvement and future research that emerged from this chapter. To improve this study, future research could conduct a similar survey in which the respondent would be able to
Young Urban Local Users (N=205)
•Tend to be…
•Younger than 45
•From urban areas
•Higher income
•0 vehicle households
•Tend to believe…
•Public transit gets them to where they need to go
•When using ridehailing, tend to...
•Use for social events or shopping
•Drive or not take the trip if ridehailing was not available
Wealthy Travelers (N=141)
•Tend to be…
•Younger than 55
•Highly educated
•Higher income
•When using ridehailing, tend to...
•Use to go to/from the aiport or for social events
•Drive or take a taxi if ridehailing was not available
Tagalong Users (N=126)
•Tend to be…
•Younger than 35
•Black
•Female
Non-Users
(N=524)
•Tend to be…
•55 years old or older
•From rural areas
•Lower income
•Don't use Uber/Lyft because they...
•Use their own car
•Feel uncomfortable with their personal safety
•Find Uber/Lyft to be too expensive

46
select multiple responses to the ridehailing familiarity and adoption question. The current form of the question only allows the respondent to select the answer they find is most applicable even if they use ridehailing in several ways. By changing the question, it could be possible to learn how people are using ridehailing when in their home city and if/how they also use it when traveling. This could potentially identify overlap between the proposed user types. A further expansion of this research would be to investigate the two newer ridehailing user types that were identified: the wealthy travelers who use ridehailing only when away from home and the tagalong users who only use ridehailing with friends or family. Many previous studies have used household-based surveys that asked about travel patterns around the respondent’s own city. Creating surveys that specifically ask how one travels when they are not in their own city would be a way to capture more information about the wealthy travelers user group. To best target travelers, intercept surveys could be administered at airports or hotels. If using an intercept survey at an airport, it could be of value to ask whether the person is flying for business or leisure purposes since this could further define the wealthy traveler group. Another question for intercept surveys at the airport could be about the duration of the trip; are they going for a one-day meeting where renting a vehicle is not as essential or are they going to be on the trip for a week or two? This would start to look at how ridehailing is impacting the car rental industry. Survey questions to better understand the tagalong group could include ascertaining why respondents in this group will not use their own smartphone to request ridehailing service. Is it because someone else purchased the trip for the respondent and was willing to pay for it? Is the respondent part of a group traveling in a single ridehailing vehicle? What is the typical trip purpose for someone in this group? Last, typologies evolve over time. One way to further understand these typologies would be to examine how frequently each type uses ridehailing over time. In summary, this chapter proposed an initial typology for ridehailing that can be used to facilitate transportation planning and policy making in Tennessee to better serve these groups.

47
5 Conclusions, Future Research and Recommendations This chapter presents a comparison and conclusions, areas for future research, and recommendations for Tennessee Department of Transportation based on the research findings.
5.1 Comparison and Conclusions This section presents a summary and conclusions from each chapter of this report, beginning with the literature review. The objective of Chapter 2 was to provide a comprehensive literature review of the latest research and summarize findings relating to ridesourcing users’ traveler behavior. In total, 44 studies were reviewed, and six main traveler-focused categories were identified: demographics; frequency and time of use; trip purpose; reason for using ridesourcing services; relationship between ridesourcing and other modes; and transportation system impacts. The results pertaining to demographics revealed that ridesourcing users are likely younger with higher incomes and education levels, are full-time students or employed, and live in urban areas. Most ridesourcing trips occur on weekends and at night, with the most common trip purpose being for social events. Common reasons for using ridesourcing were to avoid driving under the influence, parking difficulties, and faster travel and wait times. Ridesourcing was found to substitute for taxis and personal vehicles; however, the results were mixed for public transit. Some studies suggest that ridesourcing can increase both vehicle miles travelled and the number of vehicles on the road; however, more research is needed in this area to have conclusive findings. Additional areas for future research were also identified; in particular, most prior studies focused on major urban areas along the east or west coasts. Additional research in other regions of the country, like Tennessee, is needed.
Since prior research on ridesharing has largely focused on large metropolitan areas along the coasts, Chapter 3 aimed to assess the demographics of who might be using ridesharing specifically for Tennessee. This chapter used the 2017 National Household Travel Survey (NHTS) to determine if there were any significant socioeconomics differences between state (Tennessee), regional, and national levels of ridesharing users. In the 2017 NHTS, there were two questions that asked about ridesharing (that specifically used the term ridesharing, not ridesourcing). Binary logit models were estimated to compare these two questions at the state, regional, and national levels. The most relevant model results to TDOT are for the state-level; these rideshare users tend to have higher income levels, live in urban areas, be from smaller households, and are employed. While these model results generally align with the findings in the previous literature, there were fewer statistically significant socioeconomic characteristics at the state level as compared to the regional and national level. Therefore, more detailed survey data – like that used in the subsequent chapter – was deemed necessary to better understand user characteristics in Tennessee.
Chapter 4 presents the results of a comprehensive ridehailing survey conducted in 2019 for residents of three metropolitan areas in Tennessee (Knoxville, Memphis and Nashville); notably, the term ridehailing (not ridesourcing) was used on the survey. The results were used to propose a ridehailing user typology based on socioeconomic, attitudinal, and neighborhood preference variables. Four distinct ridehailing user and non-user types were identified: young urban local users, wealthy travelers, tagalong users, and non-users. The first type is comprised of those who use ridehailing locally and made up 20% of the survey sample. This type is typically younger, has higher incomes, and uses ridehailing primarily for social purposes, which aligns with the findings of the literature review. The second type includes those who use ridehailing when traveling; these users tend to be slightly older and have higher education and income levels. The third type includes those who ride with friends/family; they tend to be younger, female, and/or black, and we coined the term “tagalong users” to describe this group. Notably, this type of ridehailing user has largely been excluded from prior research and was not clearly identified in the NHTS analysis conducted in Chapter 3. The fourth and largest (53%) type is non-users. They tend to be older, live in rural areas, and have lower income levels; this is generally consistent with the prior literature and the findings from the NHTS analysis in Chapter 3. The most common reasons why this group does not use ridehailing were car ownership, safety concerns, and cost.
A comparison of the methods and key findings from these three chapter is shown in Table 5-1.

48
Table 5-1: Comparison of the Data, Dates, Terminology, Location, Methods and Findings from this Report
Chapter Number
Data Source Collection Date
Terminology Location Method Key Findings
Chapter 2 Previous Literature
Studies published between 2015 and 2020
Ridesourcing (whichever term used in each study is used)
Varied from study to study; mostly national, state, and large metropolitan areas
Literature Review
Ridesourcing users tend to: - be younger - have higher income and education levels - live in urban areas - use to go to social events/activities - substitute for taxi trips
Chapter 3
National Household Travel Survey (NHTS)
2016-2017
Ridesharing
National, Census Division, State (Tennessee)
Summary Statistics Binary Logit Model
Those who have purchased a ride with a rideshare app in Tennessee tend to: - have higher income levels - live in urban areas - be from smaller households - are employed
Chapter 4
Survey from Populus Technologies, Inc.
2019 Ridehailing
Knoxville, Memphis, and Nashville, Tennessee
Summary Statistics Multinomial Logit Model
Ridehailing users and non-users in Tennessee can be categorized into four types: - young urban local users - wealthy travelers - tagalong users - non-users
5.2 Areas for Improvement and Future Research Specific areas for improvement and future research were included in each of the chapters of this report pertaining to the literature review, NHTS analysis, and Tennessee survey data analysis. A few overarching, important areas for future research and improvement are discussed here.
• Area for Future Research 1: Analyze the impact of COVID-19 on ridesourcing An important caveat to the research presented in this report is that all of the survey data was gathered prior to the onset of the COVID-19 pandemic. During the pandemic, passenger travel across all modes of transportation in the United States experienced declines, and this included ridesourcing. Therefore, an important avenue for future research is to assess the impacts of the COVID-19 pandemic on ridesourcing travel behavior and identify new trends that may emerge in a post-COVID world. This is recommended both within the state of Tennessee and across the country.
• Area for Future Research 2: Conduct focus groups, interviews or surveys of “tagalong users” In Chapter 4, the typology of ridesourcing users included a new group, which we refer to as “tagalong users”. This group has been understudied in past research, and based on the findings of Chapter 4, they appear to have significantly different demographic characteristics from the other two groups. Therefore, additional research targeting this group is recommended. This could take the form of focus groups, interviews, and/or surveys that aim to better understand why tagalong users do not request ridehailing services on their own. Is it because someone else purchased the trip for the respondent and was willing to pay for it? Is the respondent part of a group traveling in a single ridehailing vehicle? What is the typical trip purpose for someone in this group?
• Area for Future Research 3: Conduct an intercept survey of the wealthy travelers group In Chapter 4, the typology of ridesourcing users identified a sizable group of ridesourcing users who typically use these services when traveling. However, most previous studies have used household-based surveys that asked about travel patterns around the respondent’s own city. Creating surveys that specifically ask how one travels when they are not in their own city would be a way to capture more information about this user group. To best target travelers, intercept surveys could be administered at

49
airports or hotels. If using an intercept survey at an airport, it could be of value to ask whether the person is flying for business or leisure purposes since this could further define the wealthy traveler group. Another question for intercept surveys at the airport could be about the duration of the trip; are they going for a one-day meeting where renting a vehicle is not as essential or are they going to be on the trip for a week or two? This would start to look at how ridehailing is impacting the car rental industry.
5.3 Recommendations This section presents recommendations for Tennessee Department of Transportation based on the research findings.
• Recommendation 1: Assess and standardize ridesourcing terminology As is evident throughout this report, there are many different terms that are currently being used to describe on-demand ride services provided by companies such as Uber and Lyft. In the literature review, four common terms were identified: ridesharing, ridehailing, ridesourcing, and transportation network companies. Recently, the Society of Automotive Engineers International (SAE) set forth guidance that recommends using the term ridesourcing, since it most accurately describes these “prearranged (services) and on-demand transportation services for compensation in which drivers and passengers connect via digital applications” (SAE, 2018). However, this term does not appear to have widespread recognition from users of these services. For example, the 2017 National Household Travel Survey used the term rideshare on the questionnaire, and the company Populus Technology, Inc., which has conducted similar surveys across the country, used the term ridehailing. Standardizing terminology is important for surveys, for marketing these services, and for infrastructure such as signage in passenger pick-up areas. In light of this, assessing which of these terms is most commonly recognized by ridesourcing users in Tennessee users and then consistently using that terminology is recommended.
• Recommendation 2: Collect, compare, and improve ridesourcing survey questions Another recommendation is to collect, compare, and improve ridesourcing survey questions, particularly within the state of Tennessee. To more easily compare national surveys such as NHTS with local surveys conducted in Tennessee, there should be consistent questions, including the time periods of questions (such as use over the past month or past year, etc.). It would also be beneficial to ensure that survey questions focus on a single mode; this was an issue when interpreting results of one of the NHTS questions (ridesharing and taxi were combined). It is also important that questions are asked for people who may use ridesourcing in multiple ways, including those who use ridesourcing locally as well as when they travel. This could further help to differentiate the user types discussed in Chapter 4. One way to incorporate these suggestions into future research would be to create a ridesourcing survey question database. The National Association of City Transportation Officials (NACTO) created an intercept survey toolkit as well as a question bank with over 100 different questions for bikeshare, which could be used as a model. Additional information on the bikeshare survey toolkit can be found here: o NACTO’s Bike Share Intercept Survey Toolkit: https://nacto.org/interceptsurveytoolkit/
• Recommendation 3: Apply good curb space management principles in targeted locations Based on the user typology developed in Chapter 4, there are two main markets of ridesourcing users that should be considered in local curb space management decisions. Young, urban local users are likely to make trips to locations with lots of restaurants, bars and other social venues, which are often concentrated in downtown areas. Similarly, the wealthy travelers group likely make most trips to the airport, convention centers, and hotels. Higher volumes of ridesourcing pick-ups and drop-offs will be experienced at these locations, which necessitates good curb space management principles. For example, some of these locations may benefit from dedicated ridesourcing loading zones and increased signage. Additional information on curb space management, including in urban areas and at airports,
50
can be found in the following reports: o Institute for Transportation Engineers (ITE)’s Curbside Management Practitioner's Resource Guide:
https://www.ite.org/pub/?id=C75A6B8B-E210-5EB3-F4A6-A2FDDA8AE4AA o International Transportation Forum. The Shared-Use City: Managing the Curb: https://www.itf-
oecd.org/sites/default/files/docs/shared-use-city-managing-curb_5.pdf o Airport Cooperative Research Program Report (ACRP) Research Report 215: Transportation
Network Companies (TNCs): Impacts to Airport Revenues and Operations—Reference Guide. http://www.trb.org/Publications/Blurbs/180473.aspx
o Airport Cooperative Research Program Report (ACRP) Synthesis 84: Transportation Network Companies: Challenges and Opportunities for Airport Operators: http://www.trb.org/Publications/Blurbs/176493.aspx
51
References Alemi, F., Circella, G., Handy, S., & Mokhtarian, P. (2018). What influences travelers to use Uber? Exploring
the factors affecting the adoption of on-demand ride services in California. Travel Behaviour and Society, 13, 88-104.
Amey, A., Attanucci, J., & Mishalani, R. (2011). Real-time ridesharing: opportunities and challenges in using mobile phone technology to improve rideshare services. Transportation research record, 2217(1), 103-110.
Bansal, P., Sinha, A., Dua, R., & Daziano, R. A. (2020). Eliciting preferences of TNC users and drivers: Evidence from the United States. Travel Behaviour and Society, 20, 225-236.
Bischak, C. A. (2019). The impact of transportation network companies on urban transportation systems. (Master of Science in Community and Regional Planning). The University of Texas at Austin, Retrieved from https://repositories.lib.utexas.edu/handle/2152/75052
Blystone, D. (2019, June 25, 2019). The Story of Uber. Retrieved from https://www.investopedia.com/articles/personal-finance/111015/story-uber.asp
Brodeur, A., & Nield, K. (2018). An empirical analysis of taxi, Lyft and Uber rides: Evidence from weather shocks in NYC. Journal of Economic Behavior & Organization, 152, 1-16.
Brown, A. (2019). Redefining car access: ride-hail travel and use in Los Angeles. Journal of the American Planning Association, 85(2), 83-95.
Brown, A. (2020). Who and where rideshares? Rideshare travel and use in Los Angeles. Transportation Research Part A: Policy and Practice, 136, 120-134.
Castiglione, J., Cooper, D., Sana, B., Tischler, D., Chang, T., Erhardt, G. D., . . . Mucci, A. (2018). TNCs & Congestion. Retrieved from https://uknowledge.uky.edu/ce_reports/1
Chicago. (2021). Transportation Network Providers-Trips. Retrieved from https://data.cityofchicago.org/Transportation/Transportation-Network-Providers-Trips/m6dm-c72p
Chu, K.-C., Hamza, K., & Laberteaux, K. P. (2018). An Analysis of Attitudinal and Socio-geographic Factors on Commute Mode Choice and Ride-Hailing Adoption. Paper presented at the Transportation Research Board 97th Annual Meeting, Washington DC, United States.
Circella, G., Alemi, F., Tiedeman, K., Handy, S., & Mokhtarian, P. (2018). The adoption of shared mobility in California and its relationship with other components of travel behavior. Retrieved from
Circella, G., Tiedeman, K., Handy, S., Alemi, F., & Mokhtarian, P. (2016). What Affects Millennials’ Mobility? PART I: Investigating the Environmental Concerns, Lifestyles, Mobility-Related Attitudes and Adoption of Technology of Young Adults in California. Retrieved from
Clewlow, R. R., & Mishra, G. S. (2017). Disruptive transportation: The adoption, utilization, and impacts of ride-hailing in the United States. Retrieved from
Cooper, D., Castiglione, J., Mislove, A., & Wilson, C. (2018). Profiling Transport Network Company Activity using Big Data. Transportation research record, 2672(42), 192-202.
Deka, D., & Fei, D. (2019). A comparison of the personal and neighborhood characteristics associated with ridesourcing, transit use, and driving with NHTS data. Journal of Transport Geography, 76, 24-33.
Dimock, M. (2019). Defining generations: Where Millennials end and Generation Z begins. Retrieved from https://www.pewresearch.org/fact-tank/2019/01/17/where-millennials-end-and-generation-z-begins/
Dong, X. (2020). Trade Uber for the Bus? An Investigation of Individual Willingness to Use Ride-Hail Versus Transit. Journal of the American Planning Association, 86(2), 222-235.
Erhardt, G. D., Roy, S., Cooper, D., Sana, B., Chen, M., & Castiglione, J. (2019). Do transportation network companies decrease or increase congestion? Science advances, 5(5), 12. doi:10.1126/sciadv.aau2670

52
Feigon, S., & Murphy, C. (2018). TCRP Research Report 188: Broadening Understanding of the Interplay Among Public Transit, Shared Mobility, and Personal Automobiles (0309390370). Retrieved from http://www.trb.org/Main/Blurbs/174653.aspx
Felix, A., & Pollack, T. (2019). Potential Impacts of Ride-Hailing on the Brockton Area Transit Authority (BAT). Retrieved from http://www.mapc.org/wp-content/uploads/2019/08/Aug2019_BAT-Ride-Hail_REDUCED.pdf
Fulton, L., Brown, A., & Compostella, J. (2020). Generalized Costs of Travel by Solo and Pooled Ridesourcing vs. Privately Owned Vehicles, and Policy Implications (UC-ITS-2018-14). Retrieved from https://escholarship.org/uc/item/6vz5q4mc
Gehrke, S., Felix, A., & Reardon, T. (2018). Fare Choices: A Survey of Ride-Hailing Passengers in Metro Boston Report #1. Retrieved from https://www.mapc.org/farechoices/
Gehrke, S., & Reardon, T. (2018). Share of Choices: Further Evidence of the ride-hailing effect in Metro Boston and Massachussetts. Retrieved from http://www.mapc.org/wp-content/uploads/2018/06/Share-of-Choices-PDF_Edited.pdf
Gerte, R., Konduri, K. C., & Eluru, N. (2018). Is there a limit to adoption of dynamic ridesharing systems? Evidence from analysis of Uber demand data from New York City. Transportation research record, 2672(42), 127-136.
Grahn, R., Harper, C. D., Hendrickson, C., Qian, Z., & Matthews, H. S. (2019). Socioeconomic and usage characteristics of transportation network company (TNC) riders. Transportation, 1-21.
Greiner, A., McFarland, M., Sherman, I., & Tse, J. (2019, April 2, 2019). A History of Lyft, From Fuzzy Pink Mustaches to Global Ride Share Giant. Retrieved from https://www.cnn.com/interactive/2019/03/business/lyft-history/index.html
Habib, K. N. (2019). Mode choice modelling for hailable rides: An investigation of the competition of Uber with other modes by using an integrated non-compensatory choice model with probabilistic choice set formation. Transportation Research Part A: Policy and Practice, 129, 205-216.
Hall, J. D., Palsson, C., & Price, J. (2018). Is Uber a substitute or complement for public transit? Journal of Urban Economics, 108, 36-50.
Henao, A. (2017). Impacts of Ridesourcing - Lyft and Uber- on Transportation Including VMT, Mode Replacement, Parking, and Travel Behavior. (Doctor of Philosophy). University of Colorado Boulder,
Jiao, J., Bischak, C., & Hyden, S. (2020). The impact of shared mobility on trip generation behavior in the US: Findings from the 2017 National Household Travel Survey. Travel Behaviour and Society, 19, 1-7.
Joshi, M., Cowan, N., Limone, O., McGuinness, K., & Rao, R. (2019). E-Hail Regulation in Global Cities. Retrieved from https://wagner.nyu.edu/files/faculty/publications/RUDIN_EHAIL_REPORT_0.pdf
Lahkar, P. (2018). Understanding Use of Transport Network Companies (TNC) in Virginia. (Master of Science in Civil Engineering). Virginia Tech,
Lavieri, P. S., & Bhat, C. R. (2019). Investigating objective and subjective factors influencing the adoption, frequency, and characteristics of ride-hailing trips. Transportation Research Part C: Emerging Technologies, 105, 100-125.
Lee, K., Jin, Q., Animesh, A., & Ramaprasad, J. (2018). Are Ride-Hailing Platforms Sustainable? Impact of Uber on Public Transportation and Traffic Congestion: Impact of Uber on Public Transportation and Traffic Congestion. 51. Retrieved from http://dx.doi.org/10.2139/ssrn.3244207
Lyft. (2018, September 18, 2018). One billion rides. One billion connections. Retrieved from https://blog.lyft.com/posts/one-billion-rides
MADD, U. a. (2015). More Options. Shifting Mindsets. Driving Better Choices. Retrieved from https://newsroom.uber.com/wp-content/uploads/2015/01/UberMADD-Report.pdf
Mahmoudifard, S. M., Kermanshah, A., Shabanpour, R., & Mohammadian, A. (2017). Assessing public opinions on Uber as a ridesharing transportation system: explanatory analysis and results of a survey in Chicago area. Paper presented at the Transportation Research Board 96th Annual Meeting, Washington DC, United States.

53
Mandle, P., & Box, S. (2017). Transportation network companies: Challenges and opportunities for airport operators.
Mitra, S. K., Bae, Y., & Ritchie, S. G. (2019). Use of ride-hailing services among older adults in the United States. Transportation research record, 2673(3), 700-710.
ORNL. (n.d.). National Household Travel Survey. Retrieved from https://nhts.ornl.gov/ Populus Technologies, I. (2020). Populus. Retrieved from https://www.populus.ai/ Qian, X., Lei, T., Xue, J., Lei, Z., & Ukkusuri, S. V. (2020). Impact of transportation network companies on
urban congestion: Evidence from large-scale trajectory data. Sustainable Cities and Society, 55, 102053.
Rayle, L., Dai, D., Chan, N., Cervero, R., & Shaheen, S. (2016). Just a better taxi? A survey-based comparison of taxis, transit, and ridesourcing services in San Francisco. Transport Policy, 45, 168-178.
Roth, S. B., DeMatteis, J., & Dai, Y. (2017). 2017 NHTS Weighting Report. Retrieved from https://nhts.ornl.gov/assets/2017%20NHTS%20Weighting%20Report.pdf
Sabouri, S., Brewer, S., & Ewing, R. (2020). Exploring the relationship between ride-sourcing services and vehicle ownership, using both inferential and machine learning approaches. Landscape and Urban Planning, 198. Retrieved from https://doi.org/10.1016/j.landurbplan.2020.103797
Sabouri, S., Park, K., Smith, A., Tian, G., & Ewing, R. (2020). Exploring the influence of built environment on Uber demand. Transportation Research Part D: Transport and Environment, 81.
SAE. (2018). Taxonomy and Definitions for Terms Related to Shared Mobility and Enabling Technologies. (J3163). Retrieved from https://www.sae.org/standards/content/j3163_201809/
Schaller, B. (2017). Unsustainable? The growth of app-based ride services and traffic, travel and the future of New York City. Retrieved from http://www.schallerconsult.com/rideservices/unsustainable.pdf
Schaller, B. (2018). The New Automobility: Lyft, Uber and the Future of American Cities. Retrieved from http://www.schallerconsult.com/rideservices/automobility.pdf
Sikder, S. (2019). Who Uses Ride-Hailing Services in the United States? Transportation research record, 15. doi:10.1177/0361198119859302
Smith, A. (2016). On-demand: Ride-hailing apps. Retrieved from https://www.pewresearch.org/internet/2016/05/19/on-demand-ride-hailing-apps/
StataCorp. (2019). Stata 16 User Manual. Retrieved from https://www.stata.com/manuals/u.pdf Sturgeon, L. R. (2019). The Impact of Transportation Network Companies on Public Transit: A Case Study at
the San Francisco International Airport. (Bachelor of Arta). Scripps College, Retrieved from https://scholarship.claremont.edu/scripps_theses/1318
Tirachini, A. (2019). Ride-hailing, travel behaviour and sustainable mobility: an international review. Transportation. doi:10.1007/s11116-019-10070-2
TLC, N. Y. C. (2021). Aggregated Reports. Retrieved from https://www1.nyc.gov/site/tlc/about/aggregated-reports.page
Uber. (2018). 10 Billion. Retrieved from https://www.uber.com/newsroom/10-billion/ Uber. (2020). Requests from Underage Riders. Retrieved from https://help.uber.com/driving-and-
delivering/article/requests-from-underage-riders---?nodeId=43b84de6-758b-489e-b088-7ee69c749ccd
USDOT. (2018). National Household Travel Survey: Understanding How People Get from Place to Place. Retrieved from https://nhts.ornl.gov/assets/2016/NHTS2017_RecruitSurvey_Final.pdf
Westat. (2018). Main Study Retrieval Questionnaire. Retrieved from https://nhts.ornl.gov/assets/2016/NHTS_Retrieval_Instrument_20180228.pdf
Westat. (2019). 2017 NHTS Data User Guide. Retrieved from https://nhts.ornl.gov/assets/NHTS2017_UsersGuide_04232019_1.pdf
Westat. (2020, August 2020). Derived Variables. Retrieved from https://nhts.ornl.gov/assets/DerivedVariables_V1.2.pdf

54
Young, M., & Farber, S. (2019). The who, why, and when of Uber and other ride-hailing trips: An examination of a large sample household travel survey. Transportation Research Part A: Policy and Practice, 119, 383-392.
Zheng, Q. (2019). Would Uber Help to Reduce Traffic Congestion? (Bachelor of Arts). Skidmore College, Retrieved from https://creativematter.skidmore.edu/econ_studt_schol/129

55
APPENDICES
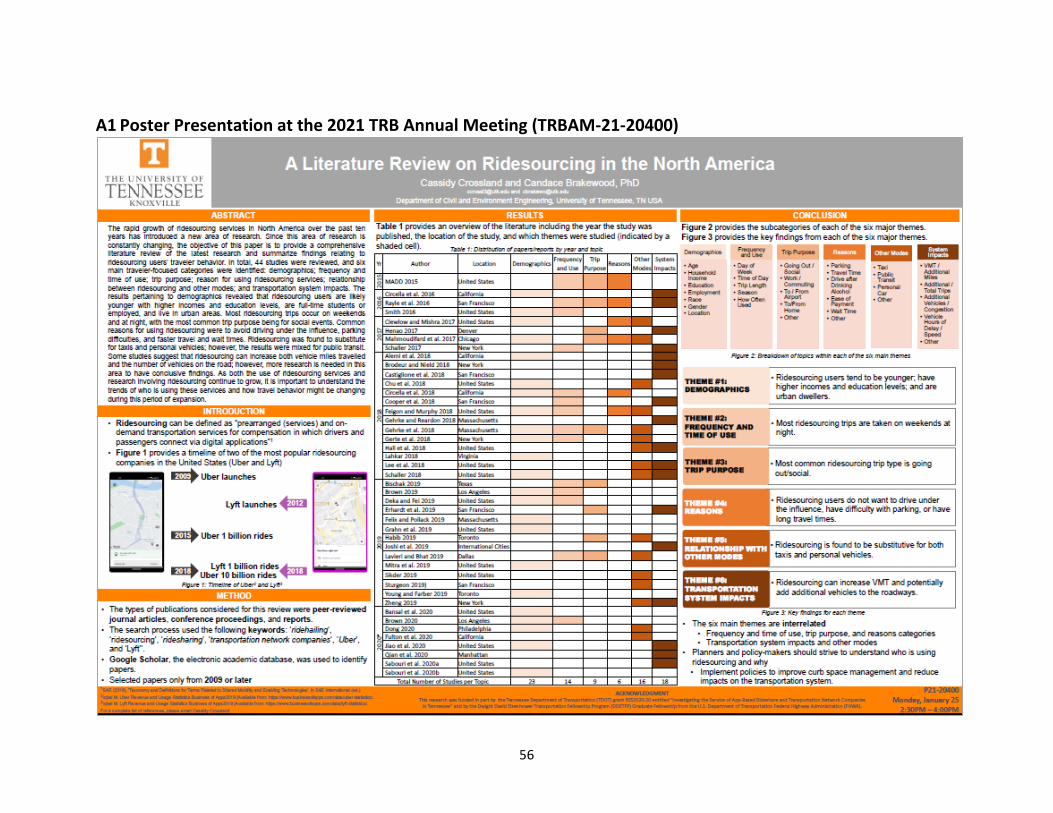
56
A1 Poster Presentation at the 2021 TRB Annual Meeting (TRBAM-21-20400)
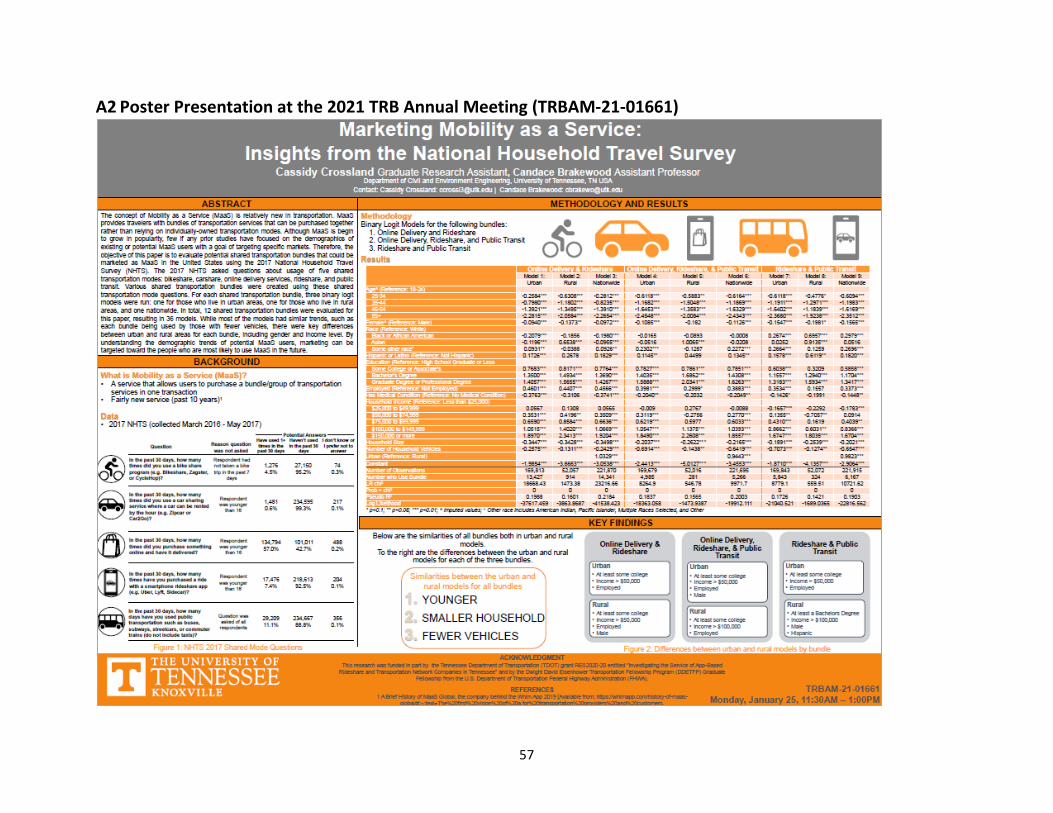
57
A2 Poster Presentation at the 2021 TRB Annual Meeting (TRBAM-21-01661)

58
A3 Poster Presentation at the 2021 TDOT Innovation to Implementation Forum

59
A4 Tables from Literature Review Table A4-1: Literature Review Findings on Demographics
Author Age Household Income Education Employment Race Gender Location
(Circella et al., 2016)
Millennials had higher adoption rates
(Smith, 2016) Median age of adult ride-hailing users was 33 years
(Clewlow & Mishra, 2017)
Average age of ride-hailing users was 37
Ride-hailing users were likely to be urban dwellers
(Mahmoudifard et al., 2017)
Age influenced mode choice decision
23% of high, 6% average, and 9% low-income used regularly
Race influenced mode choice decision
Gender influenced mode choice decision
(Alemi et al., 2018)
31.8% of millennials have adopted on-demand ride services
Users had a higher income
Users had a bachelor’s degree or higher
Users were students or workers
Users were urban dwellers
(Chu et al., 2018) Ride-hailing adopters were younger in age
Ride-hailing adopters had a higher income
(Circella et al., 2018)
Ridehailing users were more likely to be millennials
Ridehailing users tended to have a higher education
Ridehailing users tended to live in an urban setting
(Feigon & Murphy, 2018)
TNC usage took place in communities of all income levels
(Gehrke et al., 2018)
64% of ride-hailing users were 22-34 years old
Ride-hailing users’ yearly income: 26% <$38,000; 22% $38,000-$60,000; 52% >60,000
70% of users had a college degree; 25% had an advanced degree
74% of ride-hailing users had at least part time employment
67% of ride-hailing users were white; 10% Hispanic; 13% Asian; 7% black
(Gerte et al., 2018)
Pickup demand increased with people under 19 and decreased with people over 65
Pickup demand increased with people having some college education
Pickup demand decreased with more African Americans in the population
Pickup demand increases with more males in the population
(Lahkar, 2018) Older ages decreased familiarity by 2.6% and use frequency by 4.9%
Higher income level increased familiarity and frequency of use by 0.7%
Just a bachelor’s degree decreased odds of use frequency by 24.27%
Students had a 93.9% increase in odds of familiarity with TNCs
Identifying as white increased odds of frequency of use by 47.25%
Notes: Ridesourcing is referred to with the same terminology as the prior study (e.g. TNC, ride-hailing). Table is adapted from “Literature Review on Ridesourcing Users’ Travel Behavior in North America” by Crossland & Brakewood.

60
Table A4-1: Literature Review Findings on Demographics (continued) Author Age Household Income Education Employment Race Gender Location
(Schaller, 2018) Users were likely to be between 25 and 34
Users’ income was likely over $50,000
TNC users were likely to have a bachelor’s degree
Concentrated in large, densely populated areas
(Felix & Pollack, 2019)
Generational differences in ride-hailing adoption
(Deka & Fei, 2019)
Young people used ridesourcing more than others
People with higher incomes used more than others
People with a higher education used more often
Workers used more than those without a job
Women had a lower frequency of use
Areas with larger population used more frequently
(Mitra et al., 2019)
Of users 65+, those 65-74 were more likely to use
More likely to use if they had a higher income
Those with higher education were more likely to use
Males were more likely to use
(Brown, 2019) Lower income neighborhoods used Lyft more per month
Asians/Hispanics used pooled more than Whites/Blacks
(Grahn et al., 2019)
Younger people were more willing to adopt
Users had a higher income than non-users
Users had a higher education than non-users
TNC use was higher in urban areas
(Young & Farber, 2019)
74.44% of users were 20 to 39
42.18% of users’ household income was >$125,000
73.41% of ride-hailing respondents worked full-time
(Jiao et al., 2020) Income was not significant on weekend
Females created more trips
(Sabouri, Park, et al., 2020)
Uber demand was positively correlated with employment
Demand was correlated with population and land use mix
(Bansal et al., 2020)
Younger people were more likely to use TNCs
People from affluent families were more likely to use TNCs
Those with higher education were more likely to use
Metropolitan areas had more use
(Dong, 2020) People over 30 were more likely to use ridehail over transit
As income increased, willingness to use ridehail also increased
Females were likely to use ridehail over transit
(Brown, 2020) People 15-34 were more likely to share rides
Lower income neighborhoods were more likely to share rides
Racial/ethnically diverse areas were less likely to have shared rides
Most shared trips were in the urban core
Notes: Ridesourcing is referred to with the same terminology as the prior study (e.g. TNC, ride-hailing). Table is adapted from “Literature Review on Ridesourcing Users’ Travel Behavior in North America” by Crossland & Brakewood.
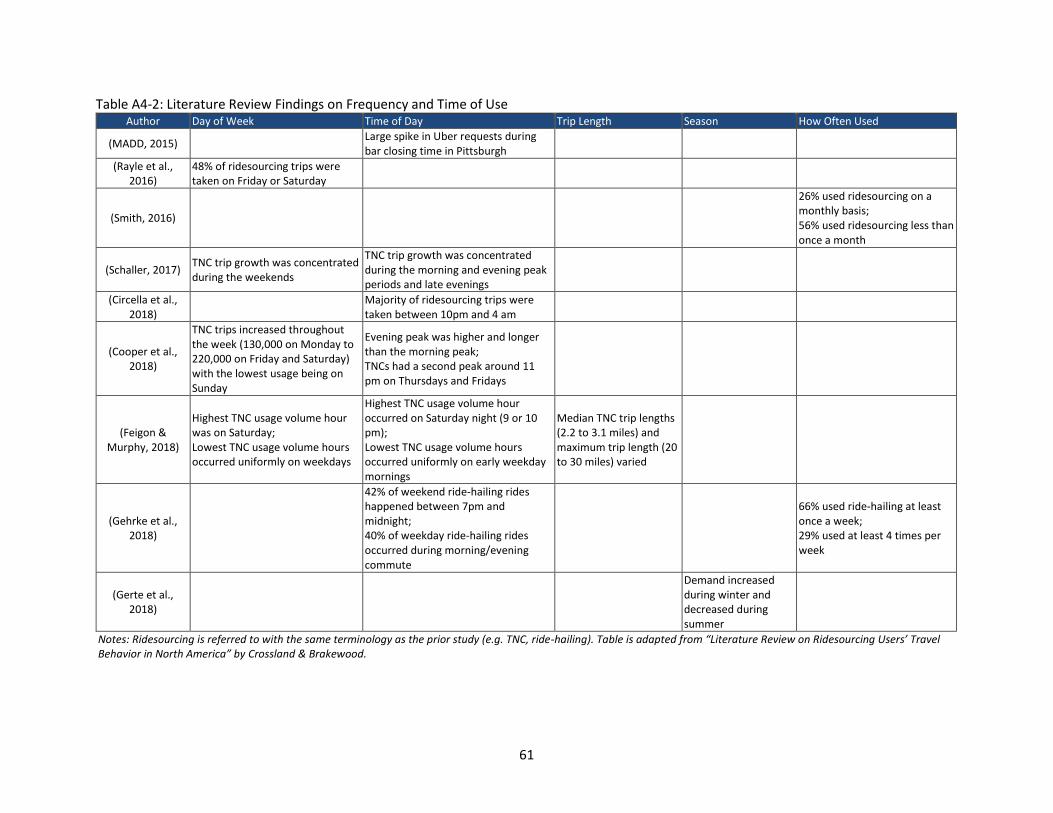
61
Table A4-2: Literature Review Findings on Frequency and Time of Use Author Day of Week Time of Day Trip Length Season How Often Used
(MADD, 2015) Large spike in Uber requests during bar closing time in Pittsburgh
(Rayle et al., 2016)
48% of ridesourcing trips were taken on Friday or Saturday
(Smith, 2016)
26% used ridesourcing on a monthly basis; 56% used ridesourcing less than once a month
(Schaller, 2017) TNC trip growth was concentrated during the weekends
TNC trip growth was concentrated during the morning and evening peak periods and late evenings
(Circella et al., 2018)
Majority of ridesourcing trips were taken between 10pm and 4 am
(Cooper et al., 2018)
TNC trips increased throughout the week (130,000 on Monday to 220,000 on Friday and Saturday) with the lowest usage being on Sunday
Evening peak was higher and longer than the morning peak; TNCs had a second peak around 11 pm on Thursdays and Fridays
(Feigon & Murphy, 2018)
Highest TNC usage volume hour was on Saturday; Lowest TNC usage volume hours occurred uniformly on weekdays
Highest TNC usage volume hour occurred on Saturday night (9 or 10 pm); Lowest TNC usage volume hours occurred uniformly on early weekday mornings
Median TNC trip lengths (2.2 to 3.1 miles) and maximum trip length (20 to 30 miles) varied
(Gehrke et al., 2018)
42% of weekend ride-hailing rides happened between 7pm and midnight; 40% of weekday ride-hailing rides occurred during morning/evening commute
66% used ride-hailing at least once a week; 29% used at least 4 times per week
(Gerte et al., 2018)
Demand increased during winter and decreased during summer
Notes: Ridesourcing is referred to with the same terminology as the prior study (e.g. TNC, ride-hailing). Table is adapted from “Literature Review on Ridesourcing Users’ Travel Behavior in North America” by Crossland & Brakewood.
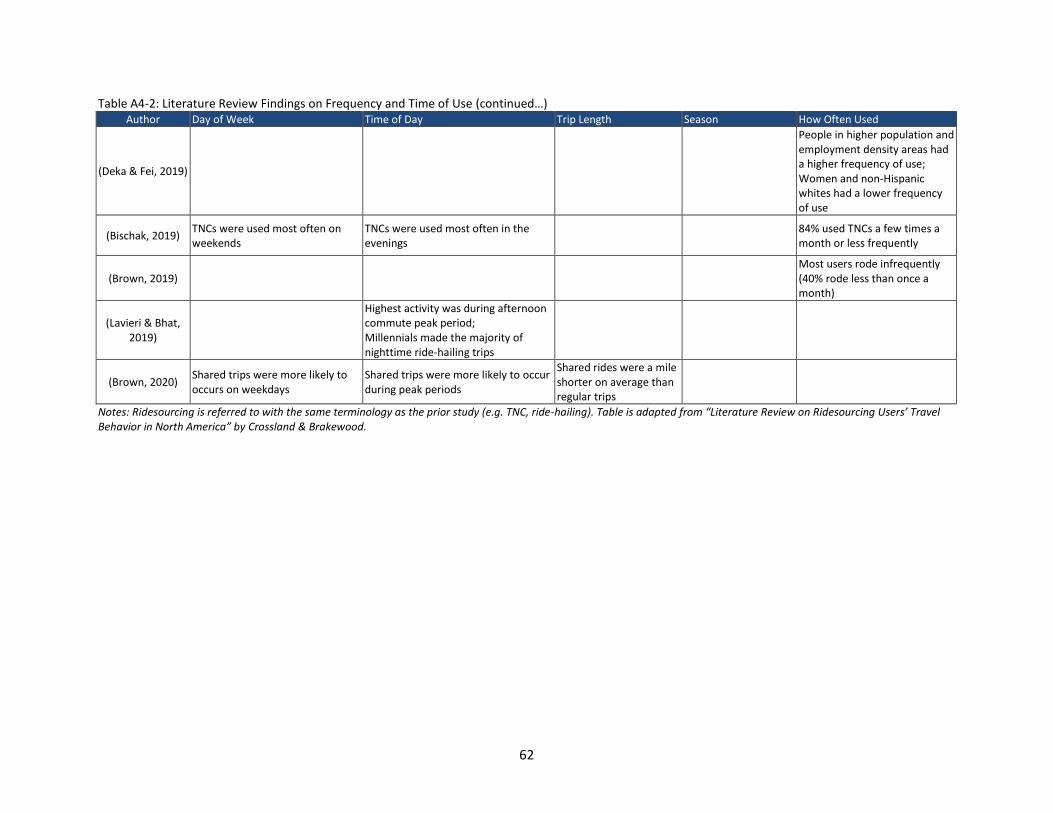
62
Table A4-2: Literature Review Findings on Frequency and Time of Use (continued…) Author Day of Week Time of Day Trip Length Season How Often Used
(Deka & Fei, 2019)
People in higher population and employment density areas had a higher frequency of use; Women and non-Hispanic whites had a lower frequency of use
(Bischak, 2019) TNCs were used most often on weekends
TNCs were used most often in the evenings
84% used TNCs a few times a month or less frequently
(Brown, 2019) Most users rode infrequently (40% rode less than once a month)
(Lavieri & Bhat, 2019)
Highest activity was during afternoon commute peak period; Millennials made the majority of nighttime ride-hailing trips
(Brown, 2020) Shared trips were more likely to occurs on weekdays
Shared trips were more likely to occur during peak periods
Shared rides were a mile shorter on average than regular trips
Notes: Ridesourcing is referred to with the same terminology as the prior study (e.g. TNC, ride-hailing). Table is adapted from “Literature Review on Ridesourcing Users’ Travel Behavior in North America” by Crossland & Brakewood.
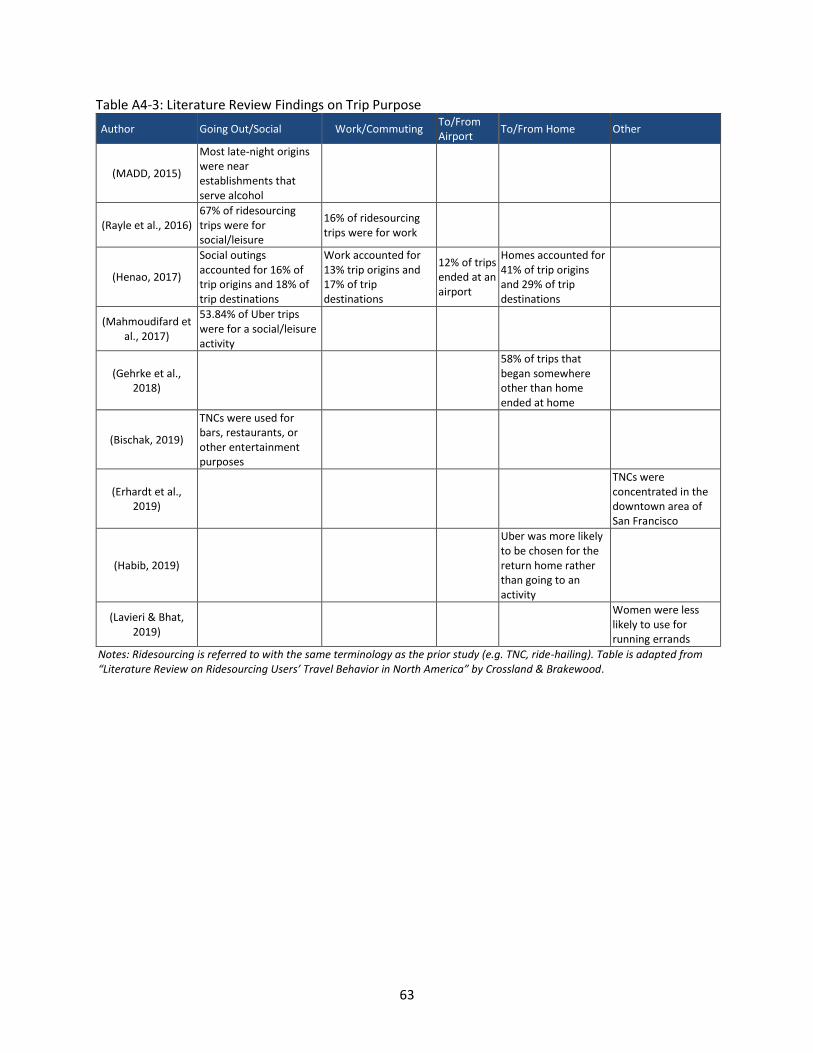
63
Table A4-3: Literature Review Findings on Trip Purpose
Author Going Out/Social Work/Commuting To/From Airport
To/From Home Other
(MADD, 2015)
Most late-night origins were near establishments that serve alcohol
(Rayle et al., 2016) 67% of ridesourcing trips were for social/leisure
16% of ridesourcing trips were for work
(Henao, 2017)
Social outings accounted for 16% of trip origins and 18% of trip destinations
Work accounted for 13% trip origins and 17% of trip destinations
12% of trips ended at an airport
Homes accounted for 41% of trip origins and 29% of trip destinations
(Mahmoudifard et al., 2017)
53.84% of Uber trips were for a social/leisure activity
(Gehrke et al., 2018)
58% of trips that began somewhere other than home ended at home
(Bischak, 2019)
TNCs were used for bars, restaurants, or other entertainment purposes
(Erhardt et al., 2019)
TNCs were concentrated in the downtown area of San Francisco
(Habib, 2019)
Uber was more likely to be chosen for the return home rather than going to an activity
(Lavieri & Bhat, 2019)
Women were less likely to use for running errands
Notes: Ridesourcing is referred to with the same terminology as the prior study (e.g. TNC, ride-hailing). Table is adapted from “Literature Review on Ridesourcing Users’ Travel Behavior in North America” by Crossland & Brakewood.
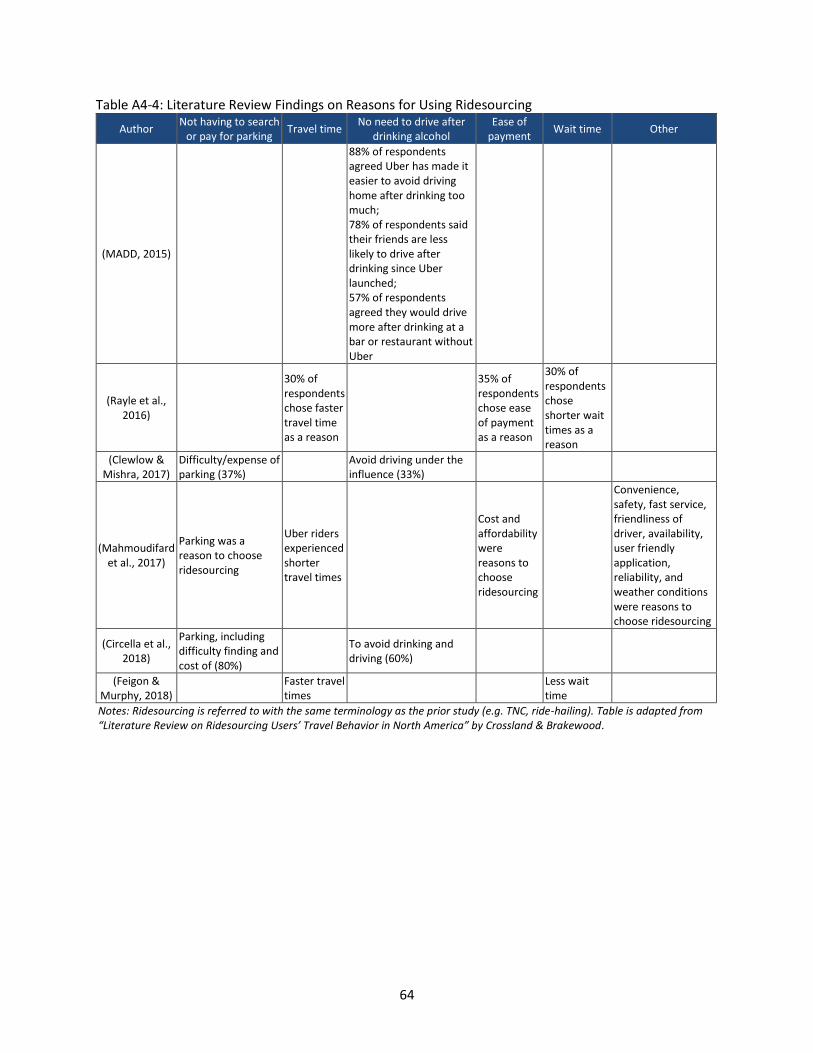
64
Table A4-4: Literature Review Findings on Reasons for Using Ridesourcing
Author Not having to search
or pay for parking Travel time
No need to drive after drinking alcohol
Ease of payment
Wait time Other
(MADD, 2015)
88% of respondents agreed Uber has made it easier to avoid driving home after drinking too much; 78% of respondents said their friends are less likely to drive after drinking since Uber launched; 57% of respondents agreed they would drive more after drinking at a bar or restaurant without Uber
(Rayle et al., 2016)
30% of respondents chose faster travel time as a reason
35% of respondents chose ease of payment as a reason
30% of respondents chose shorter wait times as a reason
(Clewlow & Mishra, 2017)
Difficulty/expense of parking (37%)
Avoid driving under the influence (33%)
(Mahmoudifard et al., 2017)
Parking was a reason to choose ridesourcing
Uber riders experienced shorter travel times
Cost and affordability were reasons to choose ridesourcing
Convenience, safety, fast service, friendliness of driver, availability, user friendly application, reliability, and weather conditions were reasons to choose ridesourcing
(Circella et al., 2018)
Parking, including difficulty finding and cost of (80%)
To avoid drinking and driving (60%)
(Feigon & Murphy, 2018)
Faster travel times
Less wait time
Notes: Ridesourcing is referred to with the same terminology as the prior study (e.g. TNC, ride-hailing). Table is adapted from “Literature Review on Ridesourcing Users’ Travel Behavior in North America” by Crossland & Brakewood.

65
Table A4-5: Literature Review Findings on Ridesourcing Relationship with Other Modes Author Taxi Public Transportation Personal Car Other
(Clewlow & Mishra, 2017)
Ride-hailing was a substitute for bus but complement for some rail
(Mahmoudifard et al., 2017)
Higher income riders would drive or use taxi
44-55% would use transit if Uber was not available
Higher income riders would drive or use taxi
(Chu et al., 2018)
Primary commute mode did not have a significant influence on ride-hailing adoption
(Feigon & Murphy, 2018)
No clear relationship between the level of peak-hour TNC use and longer-term changes in public transit usage
TNC use was associated with decreases in respondents’ vehicle ownership
(Gehrke et al., 2018)
41% of ride-hailing users would have used their own vehicle or a taxi
42% of ride-hailing users would have used public transit
41% of ride-hailing users would have used their own vehicle or a taxi
(Gerte et al., 2018) Bikeshare infrastructure increased demand for rideshare
(Hall et al., 2018)
Complement for lower ridership systems; Substitute for higher ridership systems
(Lee et al., 2018)
Complementary effect of Uber was stronger than its substitution effect for public transit
Uber and public transit were a substitute for personal vehicles
Uber allowed walkers as well as non-commuters to travel more conveniently
(Schaller, 2018) TNCs compete with public transportation
TNCs compete with biking and walking
(Habib, 2019) Complement for public transit
Complement for private automobiles
(Lavieri & Bhat, 2019) Women substitute transit for ride-hailing more than men
(Sikder, 2019) People that used transit had a positive association with ridehail use
People who also used bikeshare and carshare were more likely to adopt ride-hailing
(Sturgeon, 2019) TNCs were a substitute for rail
(Zheng, 2019) Transit trips increased by 3.28% from 2013 to 2018
(Dong, 2020) Females and those over the age of 30 were willing to use ridehail over transit
(Fulton et al., 2020) Personal vehicles were cheaper than ridesourcing overall
Notes: Ridesourcing is referred to with the same terminology as the prior study (e.g. TNC, ride-hailing). Table is adapted from “Literature Review on Ridesourcing Users’ Travel Behavior in North America” by Crossland & Brakewood.

66
Table A4-6: Literature Review Findings on Transportation System Impacts
Author VMT or Additional Miles Additional or Total Trips Additional Vehicles or Congestion
Vehicle Hours of Delay or Speed
Other
(Circella et al., 2016)
Millennials had lower vehicle miles traveled
(Rayle et al., 2016)
Impact on vehicle miles traveled was unclear
(Henao, 2017)
If Denver results were true for the entire country, 1 billion rides per year could create an additional 5.5 billion miles in the US
Approximately 69 miles of deadheading per 100 passenger miles
(Schaller, 2017)
TNCs accounted for the addition of 600 million miles of vehicular travel over the past three years
TNCs generated net increases of 31 million trips over the past three years
TNC growth added nearly 50,000 vehicles
(Alemi et al., 2018)
Net vehicle miles traveled impacts still uncertain
(Brodeur & Nield, 2018)
10% increase in Uber rides on rainy days
(Castiglione et al., 2018)
47% of the increase for daily vehicle miles traveled between 2010 and 2016 was due to TNCs
TNCs caused 51% of the increase in vehicle hours of delay and 55% of the decrease in average speed
(Cooper et al., 2018)
Vehicle miles traveled per trip is lowest during typical rush hours
(Gehrke & Reardon,
2018)
Ride-hailing trips comprised 1.3% of all trips taken in the region and 2.4% of all trips downtown
(Hall et al., 2018)
Increased congestion
(Lee et al., 2018)
May lead to increased traffic congestion
(Schaller, 2018)
TNCs added 5.7 billion of miles of driving annually in the nation’s largest metro areas
Notes: Ridesourcing is referred to with the same terminology as the prior study (e.g. TNC, ride-hailing). Table is adapted from “Literature Review on Ridesourcing Users’ Travel Behavior in North America” by Crossland & Brakewood.

67
Table A4-6: Literature Review Findings on Transportation System Impacts (continued…)
Author VMT or Additional Miles Additional or Total Trips Additional Vehicles or Congestion
Vehicle Hours of Delay or Speed
Other
(Erhardt et al., 2019)
1 TNC vehicle is the reduction of 0.31 non-TNC vehicles
Vehicle hours of delay increased and speed decreased
Vehicle hours traveled increased as a result of TNCs
(Joshi et al., 2019)
Total trips on a monthly (8.8 million trips in Chicago) or daily basis (6 cities, Max: 700,000 trips in New York City, Min: 170,000 trips in San Francisco)
New York City and Toronto number of vehicles per day was 60,000 and 90,453, respectively
(Zheng, 2019) Had trivial effects on number of vehicles
Average travel speed decreased by 0.122 mph
(Jiao et al., 2020)
Ridehailing may be inducing people to make more trips
(Qian et al., 2020)
Weekday speeds decreased by 22.5%
(Sabouri, Brewer, et al.,
2020)
Ride-sourcing can help reduce the number of cars in a household and open up parking
Notes: Ridesourcing is referred to with the same terminology as the prior study (e.g. TNC, ride-hailing). Table is adapted from “Literature Review on Ridesourcing Users’ Travel Behavior in North America” by Crossland & Brakewood.

68
A5 Additional NHTS Results (Weighted) NHTS Summary Statistics (Weighted)
Taxi or Ridesharing Frequency of Use Summary Statistics (Weighted) In Census Division 6, a total of 20.2% of respondents use taxi or rideshare with 15.7% using a few times a year, 3.9% using a few times a month, 0.7% using a few times a week, and 0.0% using daily, as seen in the figure below. At the national level, 34.0% of respondents use taxi or ridesharing services with 24.1% using a few times a year, 7.4% using a few times a month, 2.0% using a few times a week, and 0.5% using daily. In both Census Division 6 and the US, at least 10.5% of respondents gave a non-response answer (I don’t know, I prefer not to answer, or not ascertained).
Figure A5-1: Taxi and Rideshare Frequency of Use Responses (Weighted)
Ridesharing App Usage Summary Statistics (Weighted) As seen in the figure below, 3.6% of respondents in Census Division 6 purchased a ride using a smartphone rideshare app in the past 30 days. At the national level, 8.3% of respondents purchased a ride in the past 30 days. The non-response percent was higher for the ridesharing app question compared to the taxi/ridesharing frequency questions at 15-16%.
Figure A5-2: Rideshare App Usage Over the Past 30 Days Responses (Weighted)
3.9%
7.4%
15.7%
24.1%
69.1%
55.5%
10.7%
10.5%
0% 10% 20% 30% 40% 50% 60% 70% 80% 90% 100%
Census Division 6(N=1,282)
US(N=129,696)
"How often do you use taxi services or rideshare such as Uber/Lyft to get from place to place?"
Daily
A few times aweekA few times amonthA few times ayearNever
No Answer
80.4%
76.5%
3.6%
8.3%
16.0%
15.2%
0% 10% 20% 30% 40% 50% 60% 70% 80% 90% 100%
Census Division 6(N=2,641)
US(N=264,234)
"In the past 30 days, how many times have you purchased a ride with a smartphone rideshare app (e.g. Uber, Lyft, Sidecar)?"
0 Trips
1+ Trips
No Answer

69
NHTS Cross Tabulations (Weighted)
Taxi or Ridesharing Frequency of Use Cross Tabulation (Weighted) As seen in the table on the following page, the weighted cross tabulations for the question “How often do you use Taxi service or ridesharing to get from place to place?” was completed for Census Division 6 and the US.
Of those who reported using taxi or ridesharing services, one- or two-person households were most frequent. In the US, 29.1% of those who use these services were from one-person households while 25.6% of those who never use these services were from one-person households.
Similarly, households with zero or one vehicles were more likely to use taxis or ridesharing. In the US, 14.5% of those who use these services were from zero vehicle households while 5.1% of those who did not use these services were from zero vehicle households. Likewise, in the US, 34.0% of those who use these services had one vehicle in their household while 32.5% of those who reported not using these services were from one vehicle households.
The data suggest that people under the age of 55 were more likely to use taxi or ridesharing services. In the US, 18.7% of those who use these services were 45 to 54 years old whereas this group represents 17.6% of non-users. This trend continues in nationwide data for the younger age groups as well: 35 to 44 years old (22.4% use and 16.3% do not use); 25 to 34 years old (23.6% use and 13.1% do not use); and 18 to 24 years old (5.6% use and 3.9% do not use). Similar trends appear in the census division as well.
For Census Division 6, the most common education level for users of taxi/rideshare was a Bachelor’s Degree, while a Graduate Degree or Professional Degree was most common for users of taxi/rideshare in the US data. The most common education level for those who do not use taxi or ridesharing services for both the census division and the US was Some College or Associate’s Degree.
Taxi and rideshare users were more frequently employed. In the US, 73.7% of those who reported using taxi or ridesharing services were employed while 59.4% of those who do not use these services were employed.
High incomes were common for those using taxi or ridesharing. In the US, 37.2% (sum of $100,000 to $149,999 and $150,000 or more) of those who use taxi or rideshare have an annual household income of at least $100,000 compared to 18.9% of non-users in the US in these income brackets.
The data show a greater percentage of taxi/rideshare users than non-users at the census division and US levels (4.5% users compared to 2.8% non-users and 16.3% users compared to 14.1% non-users, respectively).
Similarly, almost 92% of all respondents using taxis or ridesharing do not have a medical condition that makes it difficult to travel. Those who do not have a medical condition account for 87-89% of all non-users.
It was found that the majority of users were white. In the US, 70.6% of users were white while 76.6% of non-users were white. Notably, although Asians are a small number of respondents nationwide (4.6%), there are more users (7.0%) compared to non-users (3.0%).
Gender was almost evenly split between taxi and ridesharing users. When comparing users versus non-users in the US, males tend to use these services more than females (47.4% of males use compared to 44.3% do not use, while 52.6% of females use these services compared to 55.7% who do not).
People living in an urban setting were more likely to use taxi or ridesharing than those in a rural setting. In the US, 93.0% of people who reported using these services were in an urban setting while 78.1% of people who reported not using taxi or rideshare services were in an urban setting.
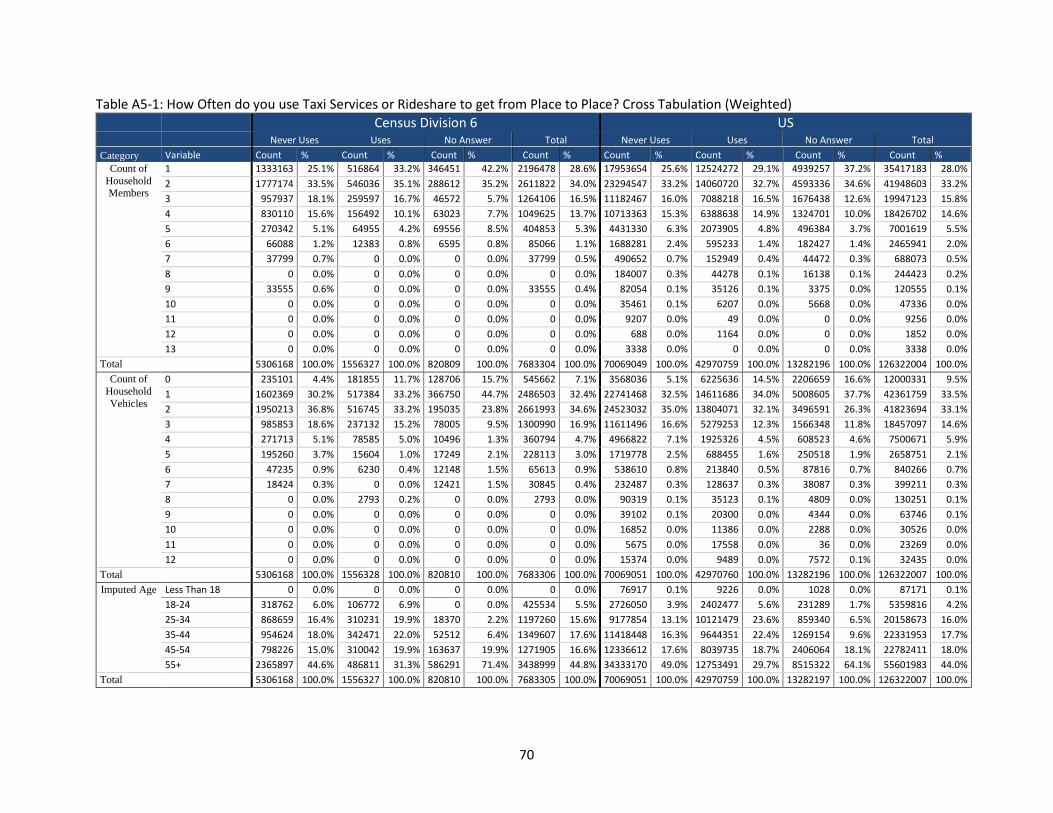
70
Table A5-1: How Often do you use Taxi Services or Rideshare to get from Place to Place? Cross Tabulation (Weighted)
Census Division 6 US
Never Uses Uses No Answer Total Never Uses Uses No Answer Total
Category Variable Count % Count % Count % Count % Count % Count % Count % Count %
Count of
Household Members
1 1333163 25.1% 516864 33.2% 346451 42.2% 2196478 28.6% 17953654 25.6% 12524272 29.1% 4939257 37.2% 35417183 28.0%
2 1777174 33.5% 546036 35.1% 288612 35.2% 2611822 34.0% 23294547 33.2% 14060720 32.7% 4593336 34.6% 41948603 33.2%
3 957937 18.1% 259597 16.7% 46572 5.7% 1264106 16.5% 11182467 16.0% 7088218 16.5% 1676438 12.6% 19947123 15.8%
4 830110 15.6% 156492 10.1% 63023 7.7% 1049625 13.7% 10713363 15.3% 6388638 14.9% 1324701 10.0% 18426702 14.6%
5 270342 5.1% 64955 4.2% 69556 8.5% 404853 5.3% 4431330 6.3% 2073905 4.8% 496384 3.7% 7001619 5.5%
6 66088 1.2% 12383 0.8% 6595 0.8% 85066 1.1% 1688281 2.4% 595233 1.4% 182427 1.4% 2465941 2.0%
7 37799 0.7% 0 0.0% 0 0.0% 37799 0.5% 490652 0.7% 152949 0.4% 44472 0.3% 688073 0.5%
8 0 0.0% 0 0.0% 0 0.0% 0 0.0% 184007 0.3% 44278 0.1% 16138 0.1% 244423 0.2%
9 33555 0.6% 0 0.0% 0 0.0% 33555 0.4% 82054 0.1% 35126 0.1% 3375 0.0% 120555 0.1%
10 0 0.0% 0 0.0% 0 0.0% 0 0.0% 35461 0.1% 6207 0.0% 5668 0.0% 47336 0.0%
11 0 0.0% 0 0.0% 0 0.0% 0 0.0% 9207 0.0% 49 0.0% 0 0.0% 9256 0.0%
12 0 0.0% 0 0.0% 0 0.0% 0 0.0% 688 0.0% 1164 0.0% 0 0.0% 1852 0.0%
13 0 0.0% 0 0.0% 0 0.0% 0 0.0% 3338 0.0% 0 0.0% 0 0.0% 3338 0.0%
Total 5306168 100.0% 1556327 100.0% 820809 100.0% 7683304 100.0% 70069049 100.0% 42970759 100.0% 13282196 100.0% 126322004 100.0%
Count of
Household
Vehicles
0 235101 4.4% 181855 11.7% 128706 15.7% 545662 7.1% 3568036 5.1% 6225636 14.5% 2206659 16.6% 12000331 9.5%
1 1602369 30.2% 517384 33.2% 366750 44.7% 2486503 32.4% 22741468 32.5% 14611686 34.0% 5008605 37.7% 42361759 33.5%
2 1950213 36.8% 516745 33.2% 195035 23.8% 2661993 34.6% 24523032 35.0% 13804071 32.1% 3496591 26.3% 41823694 33.1%
3 985853 18.6% 237132 15.2% 78005 9.5% 1300990 16.9% 11611496 16.6% 5279253 12.3% 1566348 11.8% 18457097 14.6%
4 271713 5.1% 78585 5.0% 10496 1.3% 360794 4.7% 4966822 7.1% 1925326 4.5% 608523 4.6% 7500671 5.9%
5 195260 3.7% 15604 1.0% 17249 2.1% 228113 3.0% 1719778 2.5% 688455 1.6% 250518 1.9% 2658751 2.1%
6 47235 0.9% 6230 0.4% 12148 1.5% 65613 0.9% 538610 0.8% 213840 0.5% 87816 0.7% 840266 0.7%
7 18424 0.3% 0 0.0% 12421 1.5% 30845 0.4% 232487 0.3% 128637 0.3% 38087 0.3% 399211 0.3%
8 0 0.0% 2793 0.2% 0 0.0% 2793 0.0% 90319 0.1% 35123 0.1% 4809 0.0% 130251 0.1%
9 0 0.0% 0 0.0% 0 0.0% 0 0.0% 39102 0.1% 20300 0.0% 4344 0.0% 63746 0.1%
10 0 0.0% 0 0.0% 0 0.0% 0 0.0% 16852 0.0% 11386 0.0% 2288 0.0% 30526 0.0%
11 0 0.0% 0 0.0% 0 0.0% 0 0.0% 5675 0.0% 17558 0.0% 36 0.0% 23269 0.0%
12 0 0.0% 0 0.0% 0 0.0% 0 0.0% 15374 0.0% 9489 0.0% 7572 0.1% 32435 0.0%
Total 5306168 100.0% 1556328 100.0% 820810 100.0% 7683306 100.0% 70069051 100.0% 42970760 100.0% 13282196 100.0% 126322007 100.0%
Imputed Age
Less Than 18 0 0.0% 0 0.0% 0 0.0% 0 0.0% 76917 0.1% 9226 0.0% 1028 0.0% 87171 0.1%
18-24 318762 6.0% 106772 6.9% 0 0.0% 425534 5.5% 2726050 3.9% 2402477 5.6% 231289 1.7% 5359816 4.2%
25-34 868659 16.4% 310231 19.9% 18370 2.2% 1197260 15.6% 9177854 13.1% 10121479 23.6% 859340 6.5% 20158673 16.0%
35-44 954624 18.0% 342471 22.0% 52512 6.4% 1349607 17.6% 11418448 16.3% 9644351 22.4% 1269154 9.6% 22331953 17.7%
45-54 798226 15.0% 310042 19.9% 163637 19.9% 1271905 16.6% 12336612 17.6% 8039735 18.7% 2406064 18.1% 22782411 18.0%
55+ 2365897 44.6% 486811 31.3% 586291 71.4% 3438999 44.8% 34333170 49.0% 12753491 29.7% 8515322 64.1% 55601983 44.0%
Total 5306168 100.0% 1556327 100.0% 820810 100.0% 7683305 100.0% 70069051 100.0% 42970759 100.0% 13282197 100.0% 126322007 100.0%
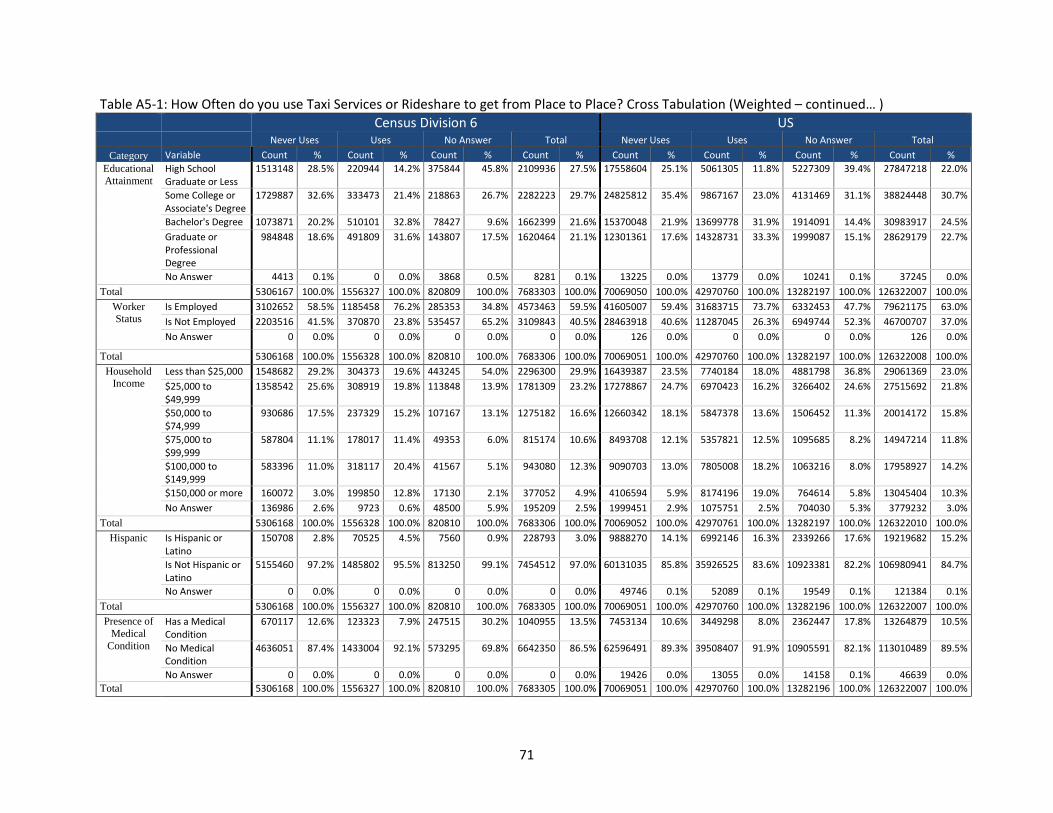
71
Table A5-1: How Often do you use Taxi Services or Rideshare to get from Place to Place? Cross Tabulation (Weighted – continued… ) Census Division 6 US
Never Uses Uses No Answer Total Never Uses Uses No Answer Total
Category Variable Count % Count % Count % Count % Count % Count % Count % Count %
Educational
Attainment
High School Graduate or Less
1513148 28.5% 220944 14.2% 375844 45.8% 2109936 27.5% 17558604 25.1% 5061305 11.8% 5227309 39.4% 27847218 22.0%
Some College or Associate's Degree
1729887 32.6% 333473 21.4% 218863 26.7% 2282223 29.7% 24825812 35.4% 9867167 23.0% 4131469 31.1% 38824448 30.7%
Bachelor's Degree 1073871 20.2% 510101 32.8% 78427 9.6% 1662399 21.6% 15370048 21.9% 13699778 31.9% 1914091 14.4% 30983917 24.5%
Graduate or Professional Degree
984848 18.6% 491809 31.6% 143807 17.5% 1620464 21.1% 12301361 17.6% 14328731 33.3% 1999087 15.1% 28629179 22.7%
No Answer 4413 0.1% 0 0.0% 3868 0.5% 8281 0.1% 13225 0.0% 13779 0.0% 10241 0.1% 37245 0.0%
Total 5306167 100.0% 1556327 100.0% 820809 100.0% 7683303 100.0% 70069050 100.0% 42970760 100.0% 13282197 100.0% 126322007 100.0%
Worker Status
Is Employed 3102652 58.5% 1185458 76.2% 285353 34.8% 4573463 59.5% 41605007 59.4% 31683715 73.7% 6332453 47.7% 79621175 63.0%
Is Not Employed 2203516 41.5% 370870 23.8% 535457 65.2% 3109843 40.5% 28463918 40.6% 11287045 26.3% 6949744 52.3% 46700707 37.0%
No Answer 0 0.0% 0 0.0% 0 0.0% 0 0.0% 126 0.0% 0 0.0% 0 0.0% 126 0.0%
Total 5306168 100.0% 1556328 100.0% 820810 100.0% 7683306 100.0% 70069051 100.0% 42970760 100.0% 13282197 100.0% 126322008 100.0%
Household Income
Less than $25,000 1548682 29.2% 304373 19.6% 443245 54.0% 2296300 29.9% 16439387 23.5% 7740184 18.0% 4881798 36.8% 29061369 23.0%
$25,000 to $49,999
1358542 25.6% 308919 19.8% 113848 13.9% 1781309 23.2% 17278867 24.7% 6970423 16.2% 3266402 24.6% 27515692 21.8%
$50,000 to $74,999
930686 17.5% 237329 15.2% 107167 13.1% 1275182 16.6% 12660342 18.1% 5847378 13.6% 1506452 11.3% 20014172 15.8%
$75,000 to $99,999
587804 11.1% 178017 11.4% 49353 6.0% 815174 10.6% 8493708 12.1% 5357821 12.5% 1095685 8.2% 14947214 11.8%
$100,000 to $149,999
583396 11.0% 318117 20.4% 41567 5.1% 943080 12.3% 9090703 13.0% 7805008 18.2% 1063216 8.0% 17958927 14.2%
$150,000 or more 160072 3.0% 199850 12.8% 17130 2.1% 377052 4.9% 4106594 5.9% 8174196 19.0% 764614 5.8% 13045404 10.3%
No Answer 136986 2.6% 9723 0.6% 48500 5.9% 195209 2.5% 1999451 2.9% 1075751 2.5% 704030 5.3% 3779232 3.0%
Total 5306168 100.0% 1556328 100.0% 820810 100.0% 7683306 100.0% 70069052 100.0% 42970761 100.0% 13282197 100.0% 126322010 100.0%
Hispanic
Is Hispanic or Latino
150708 2.8% 70525 4.5% 7560 0.9% 228793 3.0% 9888270 14.1% 6992146 16.3% 2339266 17.6% 19219682 15.2%
Is Not Hispanic or Latino
5155460 97.2% 1485802 95.5% 813250 99.1% 7454512 97.0% 60131035 85.8% 35926525 83.6% 10923381 82.2% 106980941 84.7%
No Answer 0 0.0% 0 0.0% 0 0.0% 0 0.0% 49746 0.1% 52089 0.1% 19549 0.1% 121384 0.1%
Total 5306168 100.0% 1556327 100.0% 820810 100.0% 7683305 100.0% 70069051 100.0% 42970760 100.0% 13282196 100.0% 126322007 100.0%
Presence of
Medical
Condition
Has a Medical Condition
670117 12.6% 123323 7.9% 247515 30.2% 1040955 13.5% 7453134 10.6% 3449298 8.0% 2362447 17.8% 13264879 10.5%
No Medical Condition
4636051 87.4% 1433004 92.1% 573295 69.8% 6642350 86.5% 62596491 89.3% 39508407 91.9% 10905591 82.1% 113010489 89.5%
No Answer 0 0.0% 0 0.0% 0 0.0% 0 0.0% 19426 0.0% 13055 0.0% 14158 0.1% 46639 0.0%
Total 5306168 100.0% 1556327 100.0% 820810 100.0% 7683305 100.0% 70069051 100.0% 42970760 100.0% 13282196 100.0% 126322007 100.0%

72
Table A5-1: How Often do you use Taxi Services or Rideshare to get from Place to Place? Cross Tabulation (Weighted - continued…) Census Division 6 US
Never Uses Uses No Answer Total Never Uses Uses No Answer Total
Category Variable Count % Count % Count % Count % Count % Count % Count % Count %
Race
White 3972341 74.9% 1177123 75.6% 509644 62.1% 5659108 73.7% 53644705 76.6% 30340990 70.6% 8404497 63.3% 92390192 73.1%
Black or African American
1183823 22.3% 265841 17.1% 257399 31.4% 1707063 22.2% 8888765 12.7% 5608201 13.1% 2948856 22.2% 17445822 13.8%
Asian 37855 0.7% 15573 1.0% 13600 1.7% 67028 0.9% 2129857 3.0% 3018216 7.0% 646215 4.9% 5794288 4.6%
Other 107222 2.0% 92799 6.0% 36298 4.4% 236319 3.1% 5009505 7.1% 3603031 8.4% 1174569 8.8% 9787105 7.7%
No Answer 4927 0.1% 4991 0.3% 3868 0.5% 13786 0.2% 396219 0.6% 400323 0.9% 108060 0.8% 904602 0.7%
Total 5306168 100.0% 1556327 100.0% 820809 100.0% 7683304 100.0% 70069051 100.0% 42970761 100.0% 13282197 100.0% 126322009 100.0%
Imputed
Gender
Male 2085832 39.3% 777985 50.0% 307633 37.5% 3171450 41.3% 31048942 44.3% 20351400 47.4% 5680481 42.8% 57080823 45.2%
Female 3220336 60.7% 778342 50.0% 513177 62.5% 4511855 58.7% 39020109 55.7% 22619360 52.6% 7601715 57.2% 69241184 54.8%
Total 5306168 100.0% 1556327 100.0% 820810 100.0% 7683305 100.0% 70069051 100.0% 42970760 100.0% 13282196 100.0% 126322007 100.0%
Residential Area Type
Urban 3111067 58.6% 1280985 82.3% 489377 59.6% 4881429 63.5% 54748987 78.1% 39966944 93.0% 10716786 80.7% 105432717 83.5%
Rural 2195101 41.4% 275342 17.7% 331432 40.4% 2801875 36.5% 15320064 21.9% 3003816 7.0% 2565410 19.3% 20889290 16.5%
Total 5306168 100.0% 1556327 100.0% 820809 100.0% 7683304 100.0% 70069051 100.0% 42970760 100.0% 13282196 100.0% 126322007 100.0%
73
Ridesharing App Usage Cross Tabulation (Weighted) As seen in the table on the next page, the weighted cross tabulations for the question “In the past 30 days, how many times have you purchased a ride with a smartphone rideshare app?” was created for Census Division 6 and the US.
Of those who reported buying a ride, households with fewer people were most common. In the US, 18.0% of those who purchased a ride were from one-person households while 13.4% of all those who have not purchased a ride were from one-person households. Likewise, in the US, 36.2% of those who purchased a ride were from two-person households while 32.0% of all those who have not purchased a ride were from two-person households.
Similarly, households with fewer vehicles were more likely to purchase ridesharing rides. For example, in the US, 12.3% of those who purchased a ride had no vehicles in their household while just 6.0% of those who did not purchase a ride were from a zero-vehicle household.
The data suggest that people under the age of 45 were more likely to purchase a ride using a smartphone ridesharing app. In the US, 21.1% of those who purchased a ride were 35 to 44 years old whereas this group represents 16.0% of non-users. This trend continues for the younger age groups as well: 25 to 34 years old (34.6% have and 14.6% have not purchased a ride) and 18 to 24 years old (16.9% have and 11.7% have not purchased a ride). Similar trends appear in the census division.
Of those who reported purchasing a ride through a smartphone application, the majority had some form of higher education. In Census Division 6, the most common education level for those who had purchased a rideshare ride was a Graduate Degree or Professional Degree while a Bachelor’s Degree was most common for the US. For both Census Division 6 and the US, the most common education level for those who did not purchase a ride was High School Graduate or Less.
Between 80 and 83% of those who reported purchasing a ride were employed. Census Division 6 had a higher percentage of employed with 82.2% and lowest percentage of employed workers who did not purchase a ride with 59.1%.
High incomes were common for those purchasing rides through smartphones. In the US, 48.5% (sum of $100,000 to $149,999 and $150,000 or more) of those who purchased a ride have an annual household income of at least $100,000 compared to 26.6% of those who did not purchase a ride in these income brackets.
In Census Division 6, there were no Hispanic or Latino respondents that reported purchasing a ridesharing ride. For the US, 18.2% of those who reported purchasing a ride were Hispanic while 15.9% of those who did not purchase a ride were Hispanic.
More than 90% of all respondents who purchased a ride with a smartphone do not have a medical condition that makes it difficult to travel. In the US, 96.9% of those who purchased a ride reported not having a medical condition while 89.5% of those who did not purchase a ride did not have a medical condition.
It was found that the majority of those purchasing a ride were white. In the US, 71.2% of people purchasing a ride were white and 73.0% of people who did not purchase a ride were white. Notably, although Asians are a small number of respondents nationwide (5.3%), there are more users (8.3%) compared to non-users (5.1%).
Gender was almost evenly split for those whose who purchased a ride with a smartphone app. When comparing those who have and have not purchased a ride in the US, males purchase rides more than females (52.3% of males have compared to 48.4% have not purchased a ride while 47.7% of females have compared to 51.6% have not purchased a ride).
People living in an urban setting were more likely to purchase a ride than those in a rural setting. In the US, 96.5% of people who reported purchasing a ride were from an urban setting while 80.6% of people who reported purchasing a ride were from an urban setting.

74
Table A5-2: In the Past 30 Days, How Many Times have you Purchased a Ride with a Smartphone Rideshare App? Cross Tabulation (Weighted)
Census Division 6 US 0 Trips 1+ Trips No Answer Total 0 Trips 1+ Trips No Answer Total
Category Variable Count % Count % Count % Count % Count % Count % Count % Count %
Count of Household Members
1 2065971 14.5% 130508 20.4% 0 0.0% 2196479 12.4% 30872663 13.4% 4512022 18.0% 32498 0.1% 35417183 11.7%
2 4922382 34.5% 224786 35.1% 91261 3.2% 5238429 29.5% 73750462 32.0% 9070708 36.2% 1775909 3.9% 84597079 28.0%
3 3045622 21.4% 171215 26.7% 529153 18.6% 3745990 21.1% 46736657 20.3% 4882122 19.5% 7281651 15.9% 58900430 19.5%
4 2618740 18.4% 93478 14.6% 1098261 38.6% 3810479 21.5% 46276401 20.1% 4619395 18.4% 17691824 38.7% 68587620 22.7%
5 1050872 7.4% 20120 3.1% 671744 23.6% 1742736 9.8% 20344597 8.8% 1547628 6.2% 10497312 23.0% 32389537 10.7%
6 347490 2.4% 0 0.0% 153889 5.4% 501379 2.8% 8457761 3.7% 324286 1.3% 4945243 10.8% 13727290 4.6%
7 104838 0.7% 0 0.0% 135693 4.8% 240531 1.4% 2377775 1.0% 79015 0.3% 2013580 4.4% 4470370 1.5%
8 0 0.0% 0 0.0% 0 0.0% 0 0.0% 1195540 0.5% 36353 0.1% 722524 1.6% 1954417 0.6%
9 91406 0.6% 0 0.0% 162700 5.7% 254106 1.4% 450085 0.2% 15329 0.1% 510078 1.1% 975492 0.3%
10 0 0.0% 0 0.0% 0 0.0% 0 0.0% 214771 0.1% 1552 0.0% 205901 0.5% 422224 0.1%
11 0 0.0% 0 0.0% 0 0.0% 0 0.0% 58403 0.0% 0 0.0% 35470 0.1% 93873 0.0%
12 0 0.0% 0 0.0% 0 0.0% 0 0.0% 14729 0.0% 0 0.0% 10127 0.0% 24856 0.0%
13 0 0.0% 0 0.0% 0 0.0% 0 0.0% 25627 0.0% 0 0.0% 13170 0.0% 38797 0.0%
Total 14247321 100.0% 640107 100.0% 2842701 100.0% 17730129 100.0% 230775471 100.0% 25088410 100.0% 45735287 100.0% 301599168 100.0%
Count of Household
Vehicles
0 698203 4.9% 119699 18.7% 93543 3.3% 911445 5.1% 13864427 6.0% 3088610 12.3% 2067830 4.5% 19020867 6.3%
1 3200439 22.5% 131204 20.5% 754306 26.5% 4085949 23.0% 55512900 24.1% 7496633 29.9% 10247684 22.4% 73257217 24.3%
2 5370414 37.7% 201818 31.5% 1046669 36.8% 6618901 37.3% 80065427 34.7% 8672505 34.6% 20056396 43.9% 108794328 36.1%
3 2868514 20.1% 140358 21.9% 695378 24.5% 3704250 20.9% 45565903 19.7% 3339055 13.3% 8750126 19.1% 57655084 19.1%
4 1085667 7.6% 45179 7.1% 96977 3.4% 1227823 6.9% 22138661 9.6% 1649252 6.6% 3079172 6.7% 26867085 8.9%
5 717223 5.0% 1848 0.3% 125376 4.4% 844447 4.8% 8580839 3.7% 589523 2.3% 1072877 2.3% 10243239 3.4%
6 214853 1.5% 0 0.0% 26644 0.9% 241497 1.4% 2985389 1.3% 127955 0.5% 266153 0.6% 3379497 1.1%
7 86420 0.6% 0 0.0% 3809 0.1% 90229 0.5% 1204451 0.5% 62251 0.2% 117633 0.3% 1384335 0.5%
8 5588 0.0% 0 0.0% 0 0.0% 5588 0.0% 451797 0.2% 23922 0.1% 41243 0.1% 516962 0.2%
9 0 0.0% 0 0.0% 0 0.0% 0 0.0% 189844 0.1% 11243 0.0% 28801 0.1% 229888 0.1%
10 0 0.0% 0 0.0% 0 0.0% 0 0.0% 54043 0.0% 11539 0.0% 3042 0.0% 68624 0.0%
11 0 0.0% 0 0.0% 0 0.0% 0 0.0% 75300 0.0% 0 0.0% 844 0.0% 76144 0.0%
12 0 0.0% 0 0.0% 0 0.0% 0 0.0% 86489 0.0% 15923 0.1% 3487 0.0% 105899 0.0%
Total 14247321 100.0% 640106 100.0% 2842702 100.0% 17730129 100.0% 230775470 100.0% 25088411 100.0% 45735288 100.0% 301599169 100.0%
Imputed Age
Less than 18 351522 2.5% 0 0.0% 2842702 100.0% 3194224 18.0% 8019494 3.5% 362343 1.4% 45458245 99.4% 53840082 17.9%
18-24 1719232 12.1% 119807 18.7% 0 0.0% 1839039 10.4% 27047449 11.7% 4237281 16.9% 40310 0.1% 31325040 10.4%
25-34 2188394 15.4% 180128 28.1% 0 0.0% 2368522 13.4% 33689309 14.6% 8683491 34.6% 54213 0.1% 42427013 14.1%
35-44 2319436 16.3% 140050 21.9% 0 0.0% 2459486 13.9% 36958115 16.0% 5295743 21.1% 33948 0.1% 42287806 14.0%
45-54 2261820 15.9% 102019 15.9% 0 0.0% 2363839 13.3% 37072178 16.1% 3339454 13.3% 50842 0.1% 40462474 13.4%
55+ 5406918 38.0% 98102 15.3% 0 0.0% 5505020 31.0% 87988926 38.1% 3170097 12.6% 97730 0.2% 91256753 30.3%
Total 14247322 100.0% 640106 100.0% 2842702 100.0% 17730130 100.0% 230775471 100.0% 25088409 100.0% 45735288 100.0% 301599168 100.0%
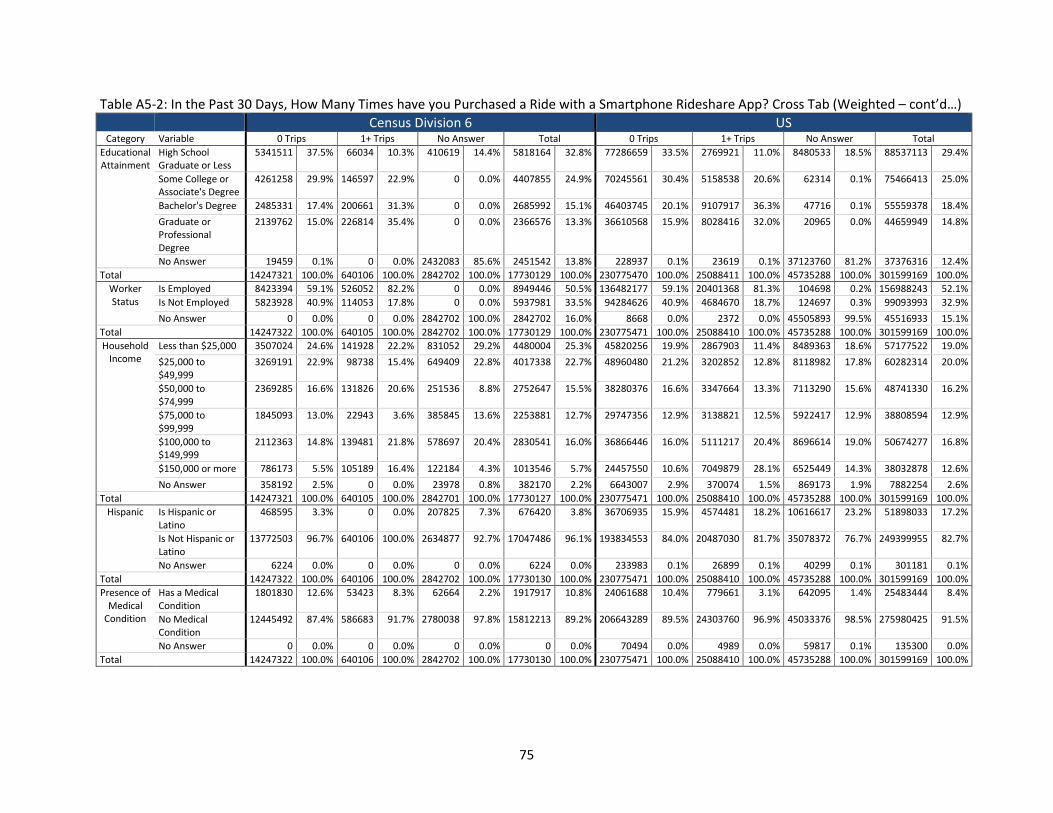
75
Table A5-2: In the Past 30 Days, How Many Times have you Purchased a Ride with a Smartphone Rideshare App? Cross Tab (Weighted – cont’d…)
Census Division 6 US Category Variable 0 Trips 1+ Trips No Answer Total 0 Trips 1+ Trips No Answer Total
Educational Attainment
High School Graduate or Less
5341511 37.5% 66034 10.3% 410619 14.4% 5818164 32.8% 77286659 33.5% 2769921 11.0% 8480533 18.5% 88537113 29.4%
Some College or Associate's Degree
4261258 29.9% 146597 22.9% 0 0.0% 4407855 24.9% 70245561 30.4% 5158538 20.6% 62314 0.1% 75466413 25.0%
Bachelor's Degree 2485331 17.4% 200661 31.3% 0 0.0% 2685992 15.1% 46403745 20.1% 9107917 36.3% 47716 0.1% 55559378 18.4%
Graduate or Professional Degree
2139762 15.0% 226814 35.4% 0 0.0% 2366576 13.3% 36610568 15.9% 8028416 32.0% 20965 0.0% 44659949 14.8%
No Answer 19459 0.1% 0 0.0% 2432083 85.6% 2451542 13.8% 228937 0.1% 23619 0.1% 37123760 81.2% 37376316 12.4%
Total 14247321 100.0% 640106 100.0% 2842702 100.0% 17730129 100.0% 230775470 100.0% 25088411 100.0% 45735288 100.0% 301599169 100.0%
Worker Status
Is Employed 8423394 59.1% 526052 82.2% 0 0.0% 8949446 50.5% 136482177 59.1% 20401368 81.3% 104698 0.2% 156988243 52.1%
Is Not Employed 5823928 40.9% 114053 17.8% 0 0.0% 5937981 33.5% 94284626 40.9% 4684670 18.7% 124697 0.3% 99093993 32.9%
No Answer 0 0.0% 0 0.0% 2842702 100.0% 2842702 16.0% 8668 0.0% 2372 0.0% 45505893 99.5% 45516933 15.1%
Total 14247322 100.0% 640105 100.0% 2842702 100.0% 17730129 100.0% 230775471 100.0% 25088410 100.0% 45735288 100.0% 301599169 100.0%
Household Income
Less than $25,000 3507024 24.6% 141928 22.2% 831052 29.2% 4480004 25.3% 45820256 19.9% 2867903 11.4% 8489363 18.6% 57177522 19.0%
$25,000 to $49,999
3269191 22.9% 98738 15.4% 649409 22.8% 4017338 22.7% 48960480 21.2% 3202852 12.8% 8118982 17.8% 60282314 20.0%
$50,000 to $74,999
2369285 16.6% 131826 20.6% 251536 8.8% 2752647 15.5% 38280376 16.6% 3347664 13.3% 7113290 15.6% 48741330 16.2%
$75,000 to $99,999
1845093 13.0% 22943 3.6% 385845 13.6% 2253881 12.7% 29747356 12.9% 3138821 12.5% 5922417 12.9% 38808594 12.9%
$100,000 to $149,999
2112363 14.8% 139481 21.8% 578697 20.4% 2830541 16.0% 36866446 16.0% 5111217 20.4% 8696614 19.0% 50674277 16.8%
$150,000 or more 786173 5.5% 105189 16.4% 122184 4.3% 1013546 5.7% 24457550 10.6% 7049879 28.1% 6525449 14.3% 38032878 12.6%
No Answer 358192 2.5% 0 0.0% 23978 0.8% 382170 2.2% 6643007 2.9% 370074 1.5% 869173 1.9% 7882254 2.6%
Total 14247321 100.0% 640105 100.0% 2842701 100.0% 17730127 100.0% 230775471 100.0% 25088410 100.0% 45735288 100.0% 301599169 100.0%
Hispanic Is Hispanic or Latino
468595 3.3% 0 0.0% 207825 7.3% 676420 3.8% 36706935 15.9% 4574481 18.2% 10616617 23.2% 51898033 17.2%
Is Not Hispanic or Latino
13772503 96.7% 640106 100.0% 2634877 92.7% 17047486 96.1% 193834553 84.0% 20487030 81.7% 35078372 76.7% 249399955 82.7%
No Answer 6224 0.0% 0 0.0% 0 0.0% 6224 0.0% 233983 0.1% 26899 0.1% 40299 0.1% 301181 0.1%
Total 14247322 100.0% 640106 100.0% 2842702 100.0% 17730130 100.0% 230775471 100.0% 25088410 100.0% 45735288 100.0% 301599169 100.0%
Presence of Medical
Condition
Has a Medical Condition
1801830 12.6% 53423 8.3% 62664 2.2% 1917917 10.8% 24061688 10.4% 779661 3.1% 642095 1.4% 25483444 8.4%
No Medical Condition
12445492 87.4% 586683 91.7% 2780038 97.8% 15812213 89.2% 206643289 89.5% 24303760 96.9% 45033376 98.5% 275980425 91.5%
No Answer 0 0.0% 0 0.0% 0 0.0% 0 0.0% 70494 0.0% 4989 0.0% 59817 0.1% 135300 0.0%
Total 14247322 100.0% 640106 100.0% 2842702 100.0% 17730130 100.0% 230775471 100.0% 25088410 100.0% 45735288 100.0% 301599169 100.0%

76
Table A5-2: In the Past 30 Days, How Many Times have you Purchased a Ride with a Smartphone Rideshare App? Cross Tab (Weighted – cont’d…)
Census Division 6 US Category Variable 0 Trips 1+ Trips No Answer Total 0 Trips 1+ Trips No Answer Total
Race White 10876760 76.3% 487457 76.2% 1803034 63.4% 13167251 74.3% 168420446 73.0% 17873955 71.2% 30726608 67.2% 217021009 72.0%
Black or African American
2766167 19.4% 99538 15.6% 729199 25.7% 3594904 20.3% 29187487 12.6% 2730312 10.9% 6138414 13.4% 38056213 12.6%
Asian 133141 0.9% 12485 2.0% 40755 1.4% 186381 1.1% 11699724 5.1% 2077738 8.3% 2172729 4.8% 15950191 5.3%
Other 451825 3.2% 40625 6.3% 269714 9.5% 762164 4.3% 19785624 8.6% 2202684 8.8% 6350586 13.9% 28338894 9.4%
No Answer 19428 0.1% 0 0.0% 0 0.0% 19428 0.1% 1682189 0.7% 203721 0.8% 346952 0.8% 2232862 0.7%
Total 14247321 100.0% 640105 100.0% 2842702 100.0% 17730128 100.0% 230775470 100.0% 25088410 100.0% 45735289 100.0% 301599169 100.0%
Imputed Gender
Male 6830368 47.9% 361585 56.5% 1416147 49.8% 8608100 48.6% 111661613 48.4% 13109644 52.3% 23267836 50.9% 148039093 49.1%
Female 7416954 52.1% 278521 43.5% 1426555 50.2% 9122030 51.4% 119113858 51.6% 11978766 47.7% 22467452 49.1% 153560076 50.9%
Total 14247322 100.0% 640106 100.0% 2842702 100.0% 17730130 100.0% 230775471 100.0% 25088410 100.0% 45735288 100.0% 301599169 100.0%
Residential Area Type
Urban 8474901 59.5% 592245 92.5% 1964277 69.1% 11031423 62.2% 186016395 80.6% 24204060 96.5% 37042213 81.0% 247262668 82.0%
Rural 5772420 40.5% 47860 7.5% 878424 30.9% 6698704 37.8% 44759076 19.4% 884350 3.5% 8693075 19.0% 54336501 18.0%
Total 14247321 100.0% 640105 100.0% 2842701 100.0% 17730127 100.0% 230775471 100.0% 25088410 100.0% 45735288 100.0% 301599169 100.0%

77
A6 Additional Survey Results for Tennessee This appendix provides additional summary statistics based on survey data collected by the company Populus Technologies, Inc. used in Chapter 4 of this report. The first section includes the results of additional ridehailing questions such as wait times and cancellations. The second section pertains to the impact ridehailing has on personal vehicle ownership and mode choice decisions. The final section presents information about ridehailing drivers.
Results of Additional Ridehailing Survey Questions Several survey questions pertained to other aspects of ridehailing, and the results are shown in Figure A6-1. These questions were not asked of all respondents; the sample size for these questions is 258 unless otherwise noted.
The first question asked respondents which days of the week they used ridehailing over the past month, and the answers were weekdays, weekends, or did not use. Respondents were allowed to select more than one option (i.e., for those respondents who used ridehailing both during the week and on the weekend). Thirty-eight percent (97 of 258) of respondents used ridehailing on the weekends within the past month, and 31% (81 of 258) used ridehailing during the week.
A follow-up question then asked respondents about the time periods throughout the day when they used ridehailing over the past month, and respondents could select more than one time period. The most popular time periods were 7pm to midnight (30%, or 78 of 258) and 4pm to 7pm (30%, 77 of 258). The two least common time periods were after midnight (10%, 27 of 258) and before 7am (8%, 21 of 258).
Respondents were asked to select their average estimated wait time when calling an Uber or Lyft from their home. The majority of respondents (70%) estimated a wait time of under 10 minutes, including 25% (64 of 258) waiting 8 to 10 minutes, 22% (56 of 258) waiting 6 to 7 minutes, 21% (55 of 258) waiting 2 to 5 minutes, and 2% (6 of 258) waiting less than 2 minutes.
Another survey question inquired about requesting a trip and then having it canceled by the driver. Sixty-one percent (157 of 258) of respondents reported never being cancelled on, and another 29% (75 of 258) reported they had been cancelled on less than 5% of the time.
Respondents were also asked how often they use Uber or Lyft to connect to public transit. Just 11% of respondents connected to public transit at least half of the time, including 7% (18 of 258) doing so half of the time, 2% (6 of 258) connecting to transit most of the time, and about 2% (3 of 258) always connecting to transit. The highest percentage of respondents (153 of 258, which is 59%) stated they never use ridehailing to connect to transit, and another 30% (78 of 258) stated that they rarely do so.
The final question asked how often respondents opted for a shared ride when using ridehailing services. In total, 12% opted for a shared ride at least half of the time. This percentage includes 7% (20 of 273) opting for a shared ride about half of the time, 3% (9 of 273) doing so most of the time, and 1% (4 of 273) always opting for a shared ride. Note that this question was asked to a slightly larger sample of 273 people.

78
Figure A6-1: Results of Additional Ridehailing Questions

79
Results of Ridehailing Impacts on Vehicle Ownership and Mode Choice Survey Questions The survey included several questions pertaining to the impacts of ridehailing on other transportation modes and the broader transportation system.
Figure A6-2 shows the impacts that ridehailing has on vehicle ownership decisions. Eighty-two percent of respondents stated that their decisions had not been impacted by ridehailing, and this includes 73% (189 of 258) that have not reduced the number of vehicles they own and an additional 9% (24 of 258) that did not have a vehicle prior to using ridehailing. Just 7% of all respondents indicated that they had gotten rid of a vehicle since using ridehailing, including 4% (9 of 258) getting rid of a second vehicle and 3% (7 of 258) getting rid of their only vehicle.
Figure A6-3 displays the impact of ridehailing on personal driving habits. Of the 200 people asked this question, 85% (171 of 200) stated that they drive about the same as they did before using ridehailing, 12% (23 of 200) stated that they drive less, and 3% (6 of 200) drive more than they did before using ridehailing.
Figure A6-4 shows responses to the following question: “Since you started using on-demand services such as Uber and Lyft, do you find that you use the following transportation options more or less?”. These questions are shown for the entire sample size and then broken down into groups based on the response to the ridehailing familiarity and adoption question (discussed in the previous sections). The sample size for each transportation mode varies due to some respondents not using specific transportation modes. Three modes (walking, bus, and train) were answered by 258 people, and these three modes are the focus of the following discussion.
For walking, 21% of the sample said they walked less (9%, 23 of 258) or significantly less (12%, 30 of 258) while 9% of the sample reported they walked more (5%, 14 of 258) or significantly more (4%, 11 of 258). Twenty-seven percent of those who use ridehailing in their city (N=146) said they walked less (11%, 15 of 146) or significantly less (16%, 23 of 146) while 10% answered that they walked more (7%, 10 of 146) or significantly more (3%, 4 of 146).
For those who used the bus, 28% of the sample said they used the bus less (9%, 23 of 258) or significantly less (19%, 48 of 258) while only 6% of the sample indicated they used the bus more (4%, 10 of 258) or significantly more (2%, 5 of 258). Thirty-one percent of those who used ridehailing in their city reported they used the bus less (10%, 15 of 146) or significantly less (21%, 31 of 146) while 6% said they used the bus more (5%, 7 of 146) or significantly more (1%, 1 of 146).
For those who used the train, 27% of the sample said they used the train less (10%, 26 of 258) or significantly less (17%, 44 of 258) while only 5% of the sample reported they used the train more (3%, 7 of 258) or significantly more (2%, 5 of 258). Thirty-three percent of those who use ridehailing in their city indicated they used the train less (12%, 17 of 146) or significantly less (21%, 31 of 146) while only 3% said they used the train more (2%, 4 of 146) or significantly more (1%, 1 of 146).

80
Figure A6-2: Impact of Ridehailing on Vehicle Ownership Decisions
Figure A6-3: Impact of Ridehailing on Personal Driving
3%
85%
12%
Impact of ridehailing on personal driving(weighted, N=200) More
About the same
Less
Data Source: Populus Technologies, Inc.
Data Source: Populus Technologies, Inc.

81
Figure A6-4: Impact of Ridehailing on Other Modes of Transportation Questions

82
Results of Ridehailing Driver Survey Questions The survey asked all respondents (N=996) whether they had ever driven for a ridehailing service. Respondents were given the ability to select several different services including Amazon Flex, DoorDash, Instacart, Lyft, Postmates, Uber, Via, other, and none. For Figure A6-5, DoorDash, Instacart, and Postmates were combined into a single category called online food delivery while Amazon Flex, Via, and other were combined to be “other”. Of these services, Uber was the most common service for drivers (6%, 58 of 996), followed by Lyft with 48 respondents (5%). Five percent of the respondents drove for online food delivery services (45 of 996). The majority of the respondents had never driven for any of these services before (88%, 874 of 996).
Eighty-two respondents were then asked how often they drove for Uber or Lyft over the past three months, as shown in Figure A6-6. Thirty-nine percent (32 of 82) of the respondents said they had not driven in the past three months. An additional 3% (2 of 82) stated that they stopped driving within the past three months. Of the respondents that did drive over the past three months, the most common frequency was a few days a month (25%, 21 of 82) and a few days a week (21%, 17 of 82).
Sixty-nine respondents were asked then about their behavior as a ridehailing driver over the past month, and the results are shown in Figure A6-7. The first question asked which days they drove for Uber/Lyft over the past month (weekdays or weekends), and drivers were able to select multiple answers for this question. More people drove for Uber/Lyft on weekdays (48%, 33 of 69) compared to the weekend (41%, 28 of 69). Of the 69 people that were asked this question, 17 did not answer (25%).
The second question asked what time of day the respondent drove for Uber/Lyft. Drivers were able to select multiple answers for this question. The most common times were 9am to 4pm (30%, 21 of 69), 7pm to midnight (20%, 14 of 69), and 4pm to 7pm (19%, 13 of 69). Of the 69 people that were asked this question, 25 people did not answer (36%).
Forty-one respondents were considered active drivers and were asked more questions about their current driving habits as seen in Figure A6-8. Drivers were asked the average number of miles they drive each day without a passenger in their vehicle. The most common responses were 10 to 24 miles (34%, 14 of 41), 25 to 49 miles (25%, 10 of 41), and less than 10 miles (24%, 9 of 41).
Drivers were also asked the average number of miles per week they drove with passengers over the past month. The most common response was 100 to 199 miles with 31% (13 of 41), followed by 200 to 299 miles with 21% (9 of 41).
Drivers were asked what their average earnings per hour were before accounting for expenses. The most common responses were $20 to $24.99 per hour (23%, 9 of 41), $10 to $14.99 per hour (21%, 9 of 41), $15 to $19.99 per hour (16%, 7 of 41), and less than $5 per hour (16%, 7 of 41).
Drivers were then asked to select the reason they drive for Uber/Lyft. Drivers were only able to select one answer from the list. The most common responses were to keep busy (23%, 9 of 41) and wanting to meet new people (17%, 7 of 41).
Twenty-eight respondents were considered non-active drivers and were asked questions about their previous experience driving for ridehailing services. The results of these questions are shown in Figure A6-9. Respondents were asked what their average earnings per hour were before accounting for expenses. The most common responses were $10 to $14.99 per hour (28%, 8 of 28), less than $5 per hour (20%, 6 of 28), $15 to $19.99 per hour (19%, 5 of 28), and $5 to $9.99 per hour (19%, 5 of 28).
The non-active drivers were also asked to select a reason for no longer driving for Uber/Lyft, and the results are shown in Figure A6-9. Respondents were only able to select one answer from the list. The most common responses were making less money than anticipated (23%, 7 of 28), putting too much wear and tear on their vehicle (18%, 5 of 28), and only driving while in between jobs (17%, 5 of 28).

83
Figure A6-5: Has Been a Driver For …
Figure A6-6: Average Number of Days Driven for Uber, Lyft, or Other on-Demand Ride Service in the Past Three Months
Data Source: Populus Technologies, Inc.
Average Number of Days Driven over the Past 3 Months (N=82)
Data Source: Populus Technologies, Inc.
Has been a driver for… (N=996)
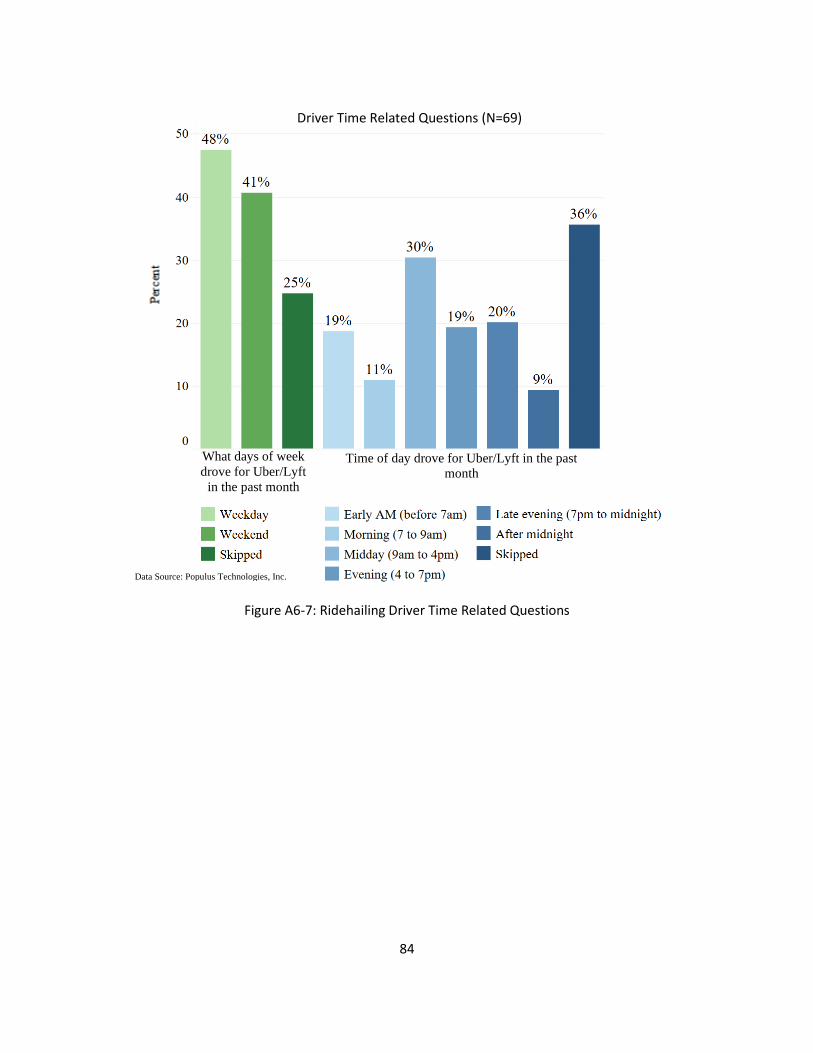
84
Figure A6-7: Ridehailing Driver Time Related Questions
What days of week
drove for Uber/Lyft
in the past month
Time of day drove for Uber/Lyft in the past
month
Data Source: Populus Technologies, Inc.
Driver Time Related Questions (N=69)
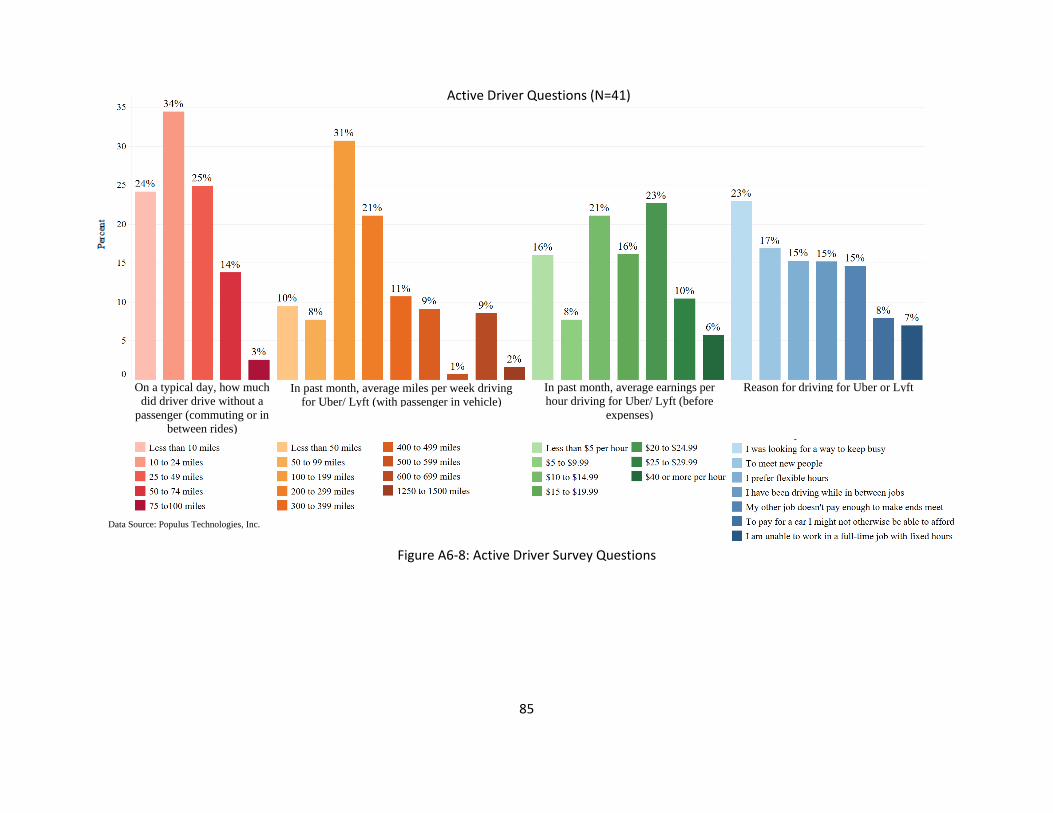
85
Figure A6-8: Active Driver Survey Questions
On a typical day, how much
did driver drive without a
passenger (commuting or in
between rides)
In past month, average miles per week driving
for Uber/ Lyft (with passenger in vehicle)
In past month, average earnings per
hour driving for Uber/ Lyft (before
expenses)
Reason for driving for Uber or Lyft
Data Source: Populus Technologies, Inc.
Active Driver Questions (N=41)
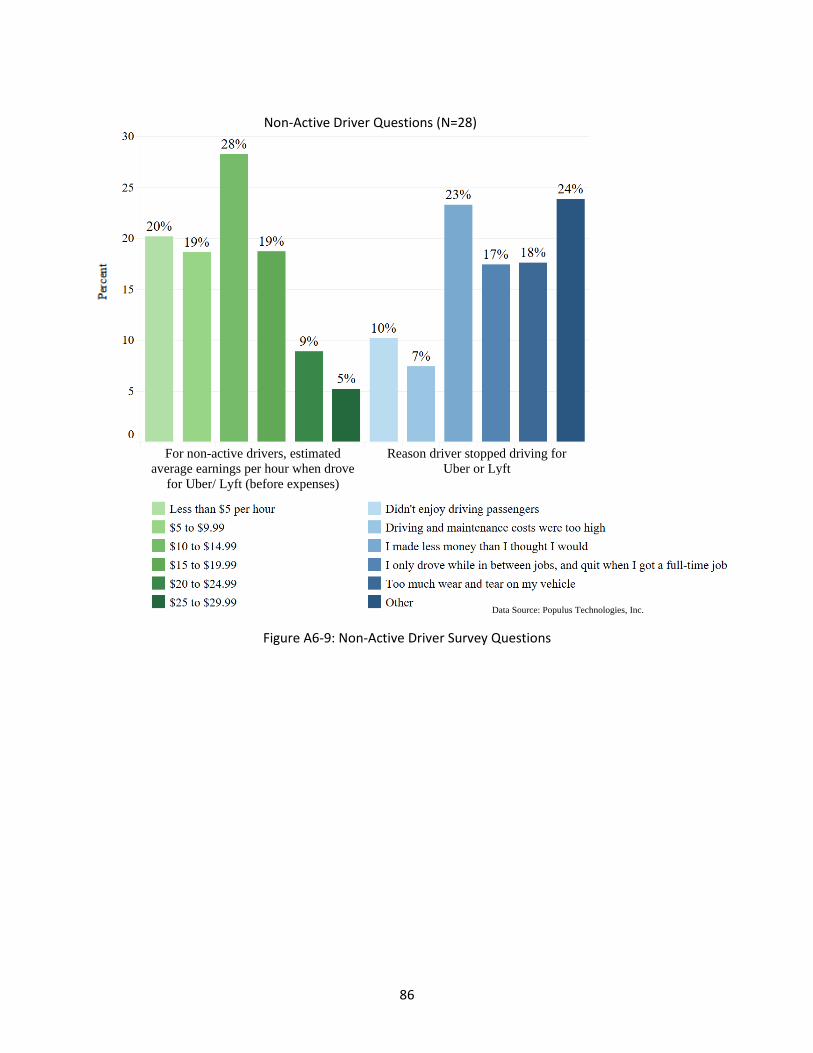
86
Figure A6-9: Non-Active Driver Survey Questions
Reason driver stopped driving for
Uber or Lyft For non-active drivers, estimated
average earnings per hour when drove
for Uber/ Lyft (before expenses)
Data Source: Populus Technologies, Inc.
Non-Active Driver Questions (N=28)