Embed Size (px)
Citation preview

University of South Florida University of South Florida
Scholar Commons Scholar Commons
Graduate Theses and Dissertations Graduate School
July 2019
Investigating the Effects of Motivational Interviewing compared to Investigating the Effects of Motivational Interviewing compared to
Action Planning on Supporting the Emotional and Academic Action Planning on Supporting the Emotional and Academic
Success of Ninth Grade Students in Advanced Placement Classes Success of Ninth Grade Students in Advanced Placement Classes
Kai Zhuang Shum University of South Florida, [email protected]
Follow this and additional works at: https://scholarcommons.usf.edu/etd
Part of the Secondary Education and Teaching Commons
Scholar Commons Citation Scholar Commons Citation Shum, Kai Zhuang, "Investigating the Effects of Motivational Interviewing compared to Action Planning on Supporting the Emotional and Academic Success of Ninth Grade Students in Advanced Placement Classes" (2019). Graduate Theses and Dissertations. https://scholarcommons.usf.edu/etd/7941
This Dissertation is brought to you for free and open access by the Graduate School at Scholar Commons. It has been accepted for inclusion in Graduate Theses and Dissertations by an authorized administrator of Scholar Commons. For more information, please contact [email protected].

Investigating the Effects of Motivational Interviewing compared to Action Planning on Supporting the
Emotional and Academic Success of Ninth Grade Students in
Advanced Placement Classes
by
Kai Zhuang Shum
A dissertation submitted in partial fulfillment
of the requirements for the degree of
Doctor of Philosophy in School Psychology
Department of Educational and Psychological Studies
College of Education
University of South Florida
Major Professor: Shannon Suldo, Ph.D.
Nathaniel von der Embse, Ph.D.
John Ferron, Ph.D.
Jonathan Lee, Ph.D.
Date of Approval:
July 8th, 2019
Keywords: high school, emotional success, academic success, coping, engagement
Copyright © 2019, Kai Zhuang Shum

Acknowledgments
Like any good adventure, the journey of conceptualizing, designing, implementing, and
writing up my dissertation was full of excitements and challenges. I have ventured into many
unknowns and experienced something new at every turn. Throughout this adventure, many
individuals supported me in various ways. Without them, I would have never been able to
complete this project. The first individual I would like to thank is Dr. Shannon Suldo, my major
professor and mentor. Words cannot express how much she had contributed to this project and to
my growth as a researcher. Her passion, determination, and encouragement always pushed me to
take it one step further, to explore out of my comfort zone. I only have the courage to take on this
project because I know that I have her wisdom to guide me and her positivity to support me. I am
also thankful for the support from my committee members. Dr. Jonathan Lee trained me to be a
competent Motivational Interviewing (MI) coach, listened to every coaching session that was
conducted in this project, and provided me with timely feedback that enabled me to feel
confident in implementing this project. His warm and encouraging personality also played a big
role in keeping me motivated in completing this project. I can never thank Dr. John Ferron
enough. Not only did he answer all my statistics questions, he did so with patience and kindness.
His knowledge in study design helped make this project a reality. Last but not least, Dr.
Nathaniel von der Embse’s support and expertise in school psychology was also pivotal in the
development of this project.
I would also like to thank my peers in the USF School Psychology program for their
various contributions. Letty DiLeo, Danielle Ahrendt, and Haley Seward generously offered their

time to be my pilot participants, whereas Amanda Moseley, Jasmine Gray, and Lora Williams
helped fidelity code some of my sessions. Their efforts were voluntary, and for that I am forever
grateful. Dr. Lindsey O’Brennan, our grant project coordinator, helped me tremendously in
organization and logistics. She also provided me with emotional support throughout this project.
I also cannot leave out my fiancé, Blake Prosch, who unconditionally supported me in many
ways, be it surprising me with my favorite Starbucks drink or helping out with chores. Finally, I
am forever indebted to my parents, who managed to make me feel loved and capable of going
through with this project, even from many miles away.

i
Table of Contents
List of Tables v
List of Figures viii
Abstract ix
CHAPTER I: Introduction 1
Statement of the Problem 1
Purpose of the Current Study 4
Definition of Key Terms 4
Multi-Tiered Systems of Support (MTSS) 4
Students in accelerated curricula 5
Student success 5
At-risk students in accelerated curricula 5
Action planning (AP) 6
Motivational interviewing (MI) 6
Advancing Coping and Engagement (ACE) 6
Motivation, Assessment, and Planning (MAP) 6
Research Questions 7
Hypotheses 7
Study Contributions to the Literature 9
CHAPTER II: Review of the Literature 10
Multi-tiered System of Supports for Adolescent Academic and
Emotional Success 11
Defining student success 11
Academic functioning 11
Social-emotional functioning 12
Universal support 13
Targeted support for high school students 16
Counseling Approaches in School Mental Health Services 19
Action planning (AP) 25
School-based application of action planning 26
Motivational interviewing 27
School-based application of motivational interviewing 31
Comparing action planning to motivational interviewing 34
Considerations for Using Motivational Interviewing with Students in
Accelerated Curricula 38
Advanced Placement 39

ii
International Baccalaureate 40
Unique needs of students in accelerated curricula 41
Supporting students in accelerated curricula through the Multi-Tiered
Systems of Support framework 42
Universal support – Advancing Coping and Engagement (ACE) 44
Screening 46
Targeted support – Motivation, Assessment, and Planning (MAP) 47
Assessment of current student functioning 48
MAP meeting 1 49
Reminder letter 49
MAP meeting 2 50
Rationale for a MI-based intervention 52
Evidence of promise of MAP 52
Conclusion and Gaps in Current Literature 57
CHAPTER III: Method 60
Research Design 60
Participants 61
Procedures 64
Universal intervention implementation 64
Recruitment of participants for selective intervention 64
Perceived Stress Scale 66
School Satisfaction subscale of the Multidimensional Students
Life Satisfaction Scale 66
School records 67
Selective intervention implementation 68
Selective stage assessment 68
Meeting 1 69
Reminder letter 1 69
Meeting 2 73
Reminder letter 2 73
Termination 73
Field notes 73
Outcome assessments 75
Pilot Study 76
Overview of Intervention Materials 80
MAP protocol 80
AP protocol 80
Base and student graph 81
Student success planning guide 81
Reminder letter 81
Outcome Measures 81
Importance of and Confidence to change 81
Therapeutic alliance 82
Goal attainment 86
Acceptability Measures 88

iii
Quantitative measures 88
Qualitative measures 88
Overview of Analyses 90
Quantitative analysis 90
Descriptive statistics 90
Research question 1 90
Research question 2 90
Qualitative analysis 91
Ethical Considerations 91
Chapter IV: Results 93
Data Screening 93
Data entry accuracy 93
Differentiating MAP and AP Meetings 94
Theoretical differences in intervention content 94
Analysis of MITI scores from 40 meetings 94
Descriptive Statistics 95
Measure reliability 103
Correlations 103
Research question 1 107
Importance of change 107
Confidence to change 111
Student-reported therapeutic alliance 111
Coach-reported therapeutic alliance 111
Goal attainment 115
Research question 2 115
Quantitative analyses 115
Qualitative analyses 121
Written feedback 121
Exit interviews 130
Feasibility 137
Fidelity to Intervention Protocol 140
Chapter V: Discussion 141
Efficacy of MAP compared to AP 141
Acceptability of MAP compared to AP 144
Order Effects 146
Additional Qualitative Results 148
Limitations 149
Study Contributions to Practice 151
Study Contributions to the Literature 153
Future Directions 154
Summary 155
References 157

iv
Appendix A: Sample MAP Student Graph 172
Appendix B: Reminder Letter 173
Appendix C: Progress Towards Goal Form 174
Appendix D: Student Base Graph 175
Appendix E: MAP Meeting Protocol 176
Appendix F: AP Meeting Protocol 200
Appendix G: Meeting 1 Student Success Planning Guide 209
Appendix H: Meeting 2 Student Success Planning Guide 215
Appendix I: MAP Meeting Fidelity Form 220
Appendix J: AP Meeting Fidelity Form 224
Appendix K: Outcome and Acceptability Assessment 227
Appendix L: Parent Consent Form 229
Appendix M: Student Assent Form 231
Appendix N: Student Recruitment Script 233
Appendix O: Interventionist Therapeutic Alliance Rating Form 234
Appendix P: Global Dimension Response Options for Motivational Interviewing
Treatment Integrity (MITI) 235
Appendix Q: Permission to use MITI Coding Manual 4.2 236
Appendix R: Permission to use TAQS included in Peabody Treatment Progress Battery 237
Appendix S: Social/Behavioral Investigators and Key Personnel Refresher Course 238
Appendix T: IRB Amendment Approval 239

v
List of Tables
Table 1: Approaches Used by Respondents in Hanchon and Fernald’s (2013) Study 20
Table 2: Study Characteristics from Snape and Atkinson’s (2016) Meta-analysis
of School-Based MI Interventions 35
Table 3: Coping and Engagement Skills Addressed in the ACE Program 48
Table 4: Summary of MAP Meeting 1 50
Table 5: Summary of MAP Meeting 2 51
Table 6: Student Acceptability and Preliminary Outcomes from Year 2
Implementation Trial 54
Table 7: Participants from School Mental Health Providers’ Perceived Utility of MAP
Meetings Study 56
Table 8: Participants Demographics and Screening Details 63
Table 9: Modules in Advancing Coping and Engagement (ACE) 65
Table 10: List of Surveys in Selective Stage Assessment Packet 70
Table 11: Descriptive Statistics of Motivational Interviewing Treatment Integrity
(MITI) Scores in Pilot 78
Table 12: Differences between MAP and AP Meetings 83
Table 13: Items on Importance of and Confidence to Change Measure 84
Table 14: Descriptive Statistics of Progress towards Goal and Change in Behavior
Items from Pilot 87
Table 15: Descriptive Statistics of Acceptability Items from Pilot 89
Table 16: Descriptive Statistics of Importance of and Confidence to Change 96
Table 17: Descriptive Statistics of Student-Report Therapeutic Alliance 97

vi
Table 18: Descriptive Statistics of Coach-Report Therapeutic Alliance 98
Table 19: Descriptive Statistics of Goal Attainment Scaling 99
Table 20: Descriptive Statistics of Perceived Progress towards Goal and
Changes in Behavior 101
Table 21: Descriptive Statistics of Percentage of Action Steps Completed 101
Table 22: Descriptive Statistics of Student Acceptability 102
Table 23: Descriptive Statistics of Motivational Interviewing Treatment Integrity
(MITI) Scores 104
Table 24: Correlations between All Variables after MAP 108
Table 25: Correlations between All Variables after AP 109
Table 26: Differences between Importance of Change after MAP vs. AP 110
Table 27: Differences between Confidence to Change after MAP vs. AP 112
Table 28: Differences between Student-Report Therapeutic Alliance after MAP vs. AP 113
Table 29: Differences between Coach-Report Therapeutic Alliance after MAP vs. AP 114
Table 30: Differences between Goal Attainment (Composite) after MAP vs. AP 116
Table 31: Differences between Goal Attainment Scaling after MAP vs. AP 117
Table 32: Differences between Progress towards Goals after MAP vs. AP 118
Table 33: Differences between Changes in Behavior after MAP vs. AP 119
Table 34: Differences between Percentage of Action Steps Completed after MAP vs. AP 120
Table 35: Differences between Student Satisfaction after MAP vs. AP 122
Table 36: Themes for Most Interesting or Useful Part of Meetings 124
Table 37: Themes for Good and Bad Parts of Meetings 127
Table 38: Themes for Differences between Meetings (Written Feedback) 129
Table 39: Additional Comments and Suggestions 130

vii
Table 40: Themes for Differences between Meetings (Exit Interview) 132
Table 41: Themes for Differences between Level of Comfort 133
Table 42: Additional Comments from Exit Interview 135
Table 43: Overlapping Quantitative and Qualitative Findings 138

viii
List of Figures
Figure 1: The Four Processes of Motivational Interviewing (MI) 29
Figure 2: Procedures in Selective Intervention 77

ix
Abstract
High school students in accelerated curricula (i.e., Advanced Placement classes or pre-
International Baccalaureate program) tend to report higher level of perceived stress compared to
general education students due to additional academic demands that stemmed from accelerated
courses (Suldo & Shaunessy-Dedrick, 2013). However, this group of students often receives
limited if any targeted supports in schools because they tend to perform well academically
(Suldo, O'Brennan, Storey, & Shaunessy-Dedrick, 2018). To address this gap in literature, this
study investigated the efficacy of a targeted intervention in development to support academic and
emotional success among students in accelerated curricula, namely the Motivation, Assessment,
and Planning (MAP) intervention. MAP involves up to two one-on-one coaching sessions rooted
in Motivational Interviewing (MI) techniques. The intervention aims to help students in
accelerated curricula further develop coping or engagement strategies learned in an
accompanying universal intervention termed the Advancing Coping and Engagement program
(ACE; Suldo, Parker, Shaunessy-Dedrick, & O’Brennan, 2019). In this study, the efficacy of the
MAP intervention was compared to an Action Planning (AP) intervention through a randomized,
within subject design. Twenty 9th grade students taking Advanced Placement Human Geography
from one high school who exhibited emotional and/or academic risks participated in this study.
Wilcoxon Signed-Rank test revealed that participants reported significantly higher importance to
change (S = 35.5, N = 20, p = 0.04) after receiving MAP compared to AP intervention. In
addition, the interventionist/coach reported significantly higher therapeutic alliance (S = 95, N =
20, p < .001) with participants after MAP compared to AP meetings. Although there were no

x
significant differences for other outcome and acceptability variables (i.e., confidence to change,
student-report therapeutic alliance, goal attainment, and student satisfaction), the direction of the
trends in the data all favored MAP over AP meetings except for goal attainment. Wilcoxon
Signed Rank tests also revealed significant order effects for two outcome variables; participants
reported higher therapeutic alliance (S = -18.5, N = 20, p = .03) and progress towards goal (S = -
18, N = 20, p = .04) after the second meeting, no matter to which condition they were assigned.
Qualitative analyses (constant comparative method) of written and verbal data provided by
student participants after each meeting and termination indicated themes with regard to (a) most
useful parts of meetings, (b) good and bad parts of meetings, (c) differences between meetings,
and (e) additional comments. Overall, analyses of qualitative data revealed inconclusive findings.
It is unclear whether participants find MAP more acceptable than AP, and vice versa. However,
some qualitative themes support the order effects found in quantitative analyses. The current
study contributed to the literature by examining how the MAP, in comparison to an AP
intervention, affects Advanced Placement students’ perceived importance of and confidence to
change, therapeutic alliance, goal attainment, and acceptability.

1
Chapter I: Introduction
The transition from middle to high school is full of challenges. Many students who
performed well in middle school struggle academically, emotionally, and socially in high school
(Cohen & Smerdon, 2009). Not only do they experience greater pubertal changes and increased
academic demands, they are also forced to navigate through self-identity exploration in a new
social context. These stressors often put 9th grade students at-risk for worse academic and
emotional outcomes, such as lower attendance (Benner & Wang, 2011), engagement (Eccles &
Roeser, 2011), and course grades (Benner & Graham, 2009). Unfortunately, a review of the
current literature revealed that most of the existing social-emotional interventions are developed
for elementary and middle school students (Durlak, Weissberg, Dymnicki, Taylor, &
Schellinger, 2011; Hoagwood et al., 2007). Moreover, there is a group of high school students
who tend to report higher level of perceived stress compared to general education student but
often receive limited if any targeted support in schools because they tend to perform well in
academics (Suldo, O'Brennan, Storey, & Shaunessy-Dedrick, 2018; Suldo & Shaunessy-Dedrick,
2013). In the current study, this group is referred to as students in accelerated curricula,
specifically high school students who are taking either Advanced Placement classes or enrolled
in the pre-International Baccalaureate program.
Statement of the Problem
As the field of education continues to adopt the Multi-Tiered Systems of Support (MTSS)
model that stemmed from the public health approach to meet all students’ needs through early
prevention and systematic intervention, researchers have worked hard to develop universal and

2
targeted interventions to meet various student needs. Meta-analysis has shown that universal
social-emotional programs are effective in preventing academic decline and emotional burnout
(Durlak et al., 2011); whereas studies on various targeted social-emotional interventions have
demonstrated promising results (Melnyk et al., 2015; Snape & Atkinson, 2016; Weisz et al.,
2012). Nonetheless, not all students’ needs have been considered. Specifically, students in
accelerated curricula (i.e., students taking Advanced Placement classes or enrolled in pre-IB
program) have been traditionally underserved in schools (Suldo, O'Brennan, Storey, &
Shaunessy-Dedrick, 2018). The existing evidence-based supports are usually designed for
general education students or students with disabilities, thus do not fit well with the unique needs
of students in accelerated curricula. To fill in this gap in literature, Suldo, Shaunessy-Dedrick,
Ferron, and Dedrick (2018) first conducted a large-scale exploratory study to identify predictors
of success for students in accelerated curricula. Then, with funding from the Institute of
Education Science (IES) in a grant (R305A150543) awarded to Drs. Shannon Suldo and
Elizabeth Shaunessy-Dedrick (University of South Florida, College of Education), a
comprehensive intervention designed for students in accelerated curricula is under development.
Consistent with the MTSS framework, the intervention includes a universal component
(Advancing Coping and Engagement, ACE), screening procedure, and a targeted intervention
(Motivation, Assessment, and Planning, MAP).
As part of the IES grant, two implementation trials have been carried out to test the
efficacy of the intervention in development. The targeted intervention – MAP—was found to be
feasible and acceptable (Suldo, Smith, Strait, Shum, Lee, & O’Brennan, 2018). MAP entails one
to two 50-minutes one-on-one coaching session(s) based on the Motivational Interviewing (MI)
approach. As MI has shown promising results with middle and high school students (e.g.,

3
increase engagement and academic achievement; Snape & Atkinson, 2016), it seems to be an
appropriate counseling approach to use with students in accelerated curricula who are at-risk for
diminished academic or emotional success. As mentioned, preliminary findings from the two
implementation trials support this sentiment (participants liked the intervention materials, are
likely to recommend the meeting to someone else, and self-reported making progress towards
self-determined goal). However, there is still much to learn about the efficacy of MAP. Of
interest is qualitative feedback provided by school mental health practitioners (Suldo, Shaunessy-
Dedrick, O’Brennan, Lee, & Shum, in progress). Collectively, 12 district-employed school
psychologists who listened to de-identified audio files of sample MAP meetings suggested that
the last part of MAP (action planning) is the most important part compared to the other three
parts (engaging, focusing, evoking). MI experts suggest otherwise, stating that the first three
processes of MI act as a foundation for action planning and without those processes the
intervention would not be considered MI-based at all (Miller & Rollnick, 2012). A review of the
literature showed that Action Planning (AP) has been established as a stand-alone intervention in
the adult health literature (Bélanger-Gravel et al., 2013) and has been successful in encouraging
behavior change among students as an embedded component of popular school-based
interventions such as Cognitive-Behavioral and Behavior Therapy (Kendall, 2011; Kratochwill
& Stoiber, 2000). On the other hand, school-based student-focused MI has also shown promising
evidence for its effectiveness (Snape & Atkinson, 2016). Examining this contradiction leads to a
gap in the current literature – there is a need to examine the efficacy of MAP compared to AP
intervention.

4
Purpose of the Current Study
The purpose of the current study was to add to the current literature on the efficacy of
school-based student-focused MI interventions. Specifically, the study examined the efficacy of
a MI-based intervention under development to support success among students in accelerated
curricula, namely the Motivation, Assessment, and Planning (MAP) intervention. In line with the
MI approach, MAP consists of four processes – engaging, focusing, evoking, and planning. The
aim of MAP is to help students in accelerated curricula who show early signs of academic or
emotional problems further develop coping and engagement skills that are associated with
success among this group of students. Although participants from implementation trials find
MAP acceptable and helpful in supporting them making progress towards self-determined goals,
there is a need to further examine this intervention’s efficacy. For instance, many school mental
health practitioners perceived the last process (planning) as the most important part of MAP.
This sentiment is inconsistent with the view of MI experts who advocate for the importance of
the first three processes (engaging, focusing, evoking; Miller & Rollnick, 2012). Thus, the
current study compared the efficacy of MAP (engaging, focusing, evoking, planning) to Action
Planning (AP) intervention. This study also examined the differences in student acceptability
between the two interventions.
Definition of Key Terms
Multi-Tiered Systems of Support (MTSS). Multitiered Systems of Support (MTSS) is a
service delivery model that focuses on data-based decision making as well as early prevention
and intervention (Cook et al., 2015). There are at least three tiers in the model: universal level
provides basic support to all students, targeted level provides additional support to students at-

5
risk academically or emotionally (15 to 20% of population), and intensive level provides
substantial support to students with severe needs (approximately 5% of the population).
Students in accelerated curricula. In this study, students in accelerated curricula refer
to high school students (specifically, freshmen) taking Advanced Placement classes or enrolled
in a pre-International Baccalaureate program. Advanced Placement classes are rigorous, college-
level courses offered to high school students to prepare them for college (College Board, 2017).
International Baccalaureate is an international academic program offered to various age groups.
This study focuses on the pre-IB Diploma Programme (IBDP), which is an internationally
recognized college preparatory program offered to junior and senior in high school. Freshmen
and sophomores are usually enrolled in the pre-IB program which is intended to lead to the
IBDP.
Student success. Suldo, Gormley, DuPaul and Anderson-Butcher (2014) suggest that
indicators of student success include academic and social-emotional functioning. A successful
student thrives academically (e.g., earns good grades), socially (e.g., has good peer
relationships), and emotionally (e.g., reports high subjective wellbeing). In this study, student
success is defined by academic (GPA and Advanced Placement/International Baccalaureate
course grade) and emotional (subjective wellbeing, academic burnout, symptoms of
psychopathology) outcomes.
At-risk students in accelerated curricula. In this paper, at-risk students are defined as
high school freshmen taking at least one Advanced Placement class (i.e., Human Geography)
who exhibit signs of academic challenges (indicated by lower Fall semester GPA and/or
Advanced Placement Human Geography course grade) and/or emotional difficulties (indicated
by elevated perceived level of stress or low school satisfaction).

6
Action planning (AP). In general, action planning refers to intervention that involve
participant stating (a) a goal, (b) when, where, and how they will carry out a plan to reach the
goal, and (c) how will they address barriers to goal (Hagger & Luszczynska, 2014).
Motivational interviewing (MI). As given by Miller and Rollnick, “MI is a
collaborative, goal-oriented style of communication with specific attention to the language of
change. It is designed to strengthen personal motivation for and commitment to a specific goal
by eliciting and exploring the person’s own reasons for change within an atmosphere of
acceptance and compassion” (p. 29).
Advancing Coping and Engagement (ACE). The Advancing Coping and Engagement
(ACE) for AP and IB student success program is a 12-week universal curriculum under
development (Shaunessy-Dedrick et al., 2018; Suldo, O’Brennan, Parker, Storey, Moseley, &
Shum, 2017; Suldo, Parker, Shaunessy-Dedrick, & O’Brennan, 2019). The aim of ACE is to
support students in accelerated curricula through teaching them coping and engagement skills
related to student success in Advanced Placement or International Baccalaureate courses.
Motivation, Assessment, and Planning (MAP). Motivation, Assessment, and Planning
(MAP) meetings are an individual MI-based selective intervention in development (O’Brennan
et al., 2019; Suldo, Parker, Shaunessy-Dedrick, & O’Brennan, 2018; Suldo, Smith, Strait, Shum,
Lee, & O’Brennan, 2018). The goal of MAP meetings are to help students who are at-risk for
diminished emotional or academic success further develop coping and engagement skills from
the ACE program.

7
Research Questions
This study aims to answer the following research questions:
1. Does participation in the Motivation, Assessment, and Planning (MAP) intervention
result in better outcomes compared to participation in the Action Planning (AP)
intervention among at-risk 9th grade students in accelerated curricula? Outcomes
include:
a. Importance of change
b. Confidence to change
c. Therapeutic alliance
d. Goal attainment
2. Does participation in the Motivation, Assessment, and Planning (MAP) intervention
results in better acceptability compared to participation in the Action Planning (AP)
intervention among at-risk 9th grade students in accelerated curricula?
Hypotheses
Regarding research question 1, this researcher hypothesized that participants (i.e., at-risk
9th grade students in accelerated curricula) would demonstrate better outcomes after participating
in the MAP compared to the AP intervention. Specifically, participants were anticipated to report
significantly higher perceived importance of and readiness to change, therapeutic alliance, and
goal attainment after the MAP intervention as compared to the AP intervention. These
hypotheses were based on findings from previous studies included in the literature reviewed in
Chapter 2. Although both MI-based and Action Planning (AP) interventions have been shown to
be effective in helping individuals enact positive change (e.g., increase healthy behaviors) in
clinical settings (Bélanger-Gravel et al., 2013; Lundahl & Burke, 2009), there are more instances

8
of empirical support for MI-based interventions in schools (Snape & Atkinson, 2016). In part
because AP interventions are often used in conjunction with other interventions, its effects as a
standalone intervention in schools remained unclear. On the other hand, 49 students from two
high schools in one district participated in an initial implementation trial of MAP and, on
average, indicated high readiness to change target behaviors after MAP meetings (Suldo,
Shaunessy-Dedrick, O’Brennan, Parker et al., 2018). Secondly, the collaborative nature of MI
might contribute to higher therapeutic alliance between coach and student (Kaplan, 2014).
Finally, past research included in the literature review presented in Chapter 2 suggests that MI-
based interventions are effective in motivating individuals to enact plans that align with their
values and beliefs (Lundahl & Burke, 2009; Snape & Atkinson, 2016). Preliminary findings from
students in the implementation trial of MAP meetings mentioned above also suggest that
participants often report completing some or all steps of their change plan (O’Brennan et al.,
2019).
Regarding research question 2, this researcher hypothesized that participants would rate
the MAP intervention to be more acceptable than the AP intervention. Again, this hypothesis is
rooted in the literature review included in Chapter 2. Specifically, MI has shown to be an
appropriate counseling approach for adolescents due to its support for autonomy and
collaborative nature (Kaplan, 2014). As participants in this study are high school students
enrolled in accelerated courses, they might appreciate a collaborative atmosphere and a coach
that support their autonomy, which could be stronger in the MAP meeting, which include engage
and evoke processes.

9
Study Contributions to the Literature
To the best of this author’s knowledge, there is no published study that compares the
efficacy of a school-based MI intervention to an AP intervention among high school students
enrolled in accelerated curricula. This is an important gap to fill as there is a need for targeted
intervention designed specifically for this population of students who are traditionally
underserved (Suldo, O'Brennan, Storey, & Shaunessy-Dedrick, 2018). Although these students
appear to be doing relatively well in school due to their prior academic success, they tend to
report higher level of perceived stress compared to general education students (Suldo &
Shaunessy-Dedrick, 2013), which might negatively affect their academic and emotional
functioning (Suldo et al. 2009). The current study’s findings shed some light on how the MAP
intervention (a targeted support developed for this group of students) affects students’ readiness
to use engagement and coping skills compared to an AP intervention. This is important as the
engagement and coping skills targeted in this study have shown to correlate with the success of
students in accelerated curricula (Suldo, Shaunessy-Dedrick, Ferron, & Dedrick, 2018). This
study also added to the current literature on school-based student-focused MI interventions.
Specifically, this study examined the efficacy of a school-based MI intervention with a new
population (i.e., students in accelerated curricula) in relation to an AP intervention.

10
Chapter II: Review of the Literature
This chapter includes a review of relevant literature to establish the study’s significance.
The literature review begins by describing the Multi-Tiered Systems of Support (MTSS) for
adolescent academic and emotional success. In this section, the review (a) introduces the
comprehensive definition of student success, (b) highlights the need to prevent academic decline
and emotional burnout through providing universal and early support, and (c) describes a range
of targeted support for high school students. Next, the review presents popular counseling
approaches in modern school mental health services, including a detailed description of one of
the most popular support provided to students - teaching and practicing action planning (AP)
skills. After that, the review focuses on describing an emerging counseling approach in school
mental health services—Motivational Interviewing (MI). This chapter will then offer a
comparison view between AP and MI. Next, this chapter explores a group of students who are
traditionally underserved (students enrolled in accelerated curricula), pointing out the unique
needs of this student population. Then, the literature review describes a comprehensive
intervention in development to support students in accelerated curricula – the Advancing Coping
and Engagement (ACE) for Advanced Placement and International Baccalaureate student
success program, screening, and the Motivation, Assessment, and Planning (MAP) intervention.
Finally, this review summarizes and identifies gaps in current literature, including a lack of
targeted social-emotional support for high school students, especially those enrolled in
accelerated courses. There are also minimal interventions that target stress management and

11
student engagement. This led a group of researchers to develop the ACE and MAP, but there is a
need to further examine the efficacy of MAP based on school mental health providers’ feedback.
Multi-Tiered System of Supports (MTSS) for Adolescent Academic and Emotional Success
According to Cook et al. (2015), Multi-Tiered Systems of Supports (MTSS) represents a
service delivery framework that stemmed from the public health approach, which focuses on
early prevention and intervention. The goal of MTSS is to utilize data-based decision-making to
provide a continuum of evidence-based services that meet all students’ academic and social-
emotional needs. To achieve this goal, the MTSS does not stop at preventing and minimizing
problems. In addition to addressing difficulties, the system strives to promote students’ academic
and social-emotional competencies to maximize their chances at succeeding in school.
Defining student success. Before this section continues, it is important to first define
student success in a comprehensive manner. According to Suldo, Gormley, DuPaul, and
Anderson-Butcher (2014), student success can be defined comprehensively through evaluating
students’ academic and social-emotional functioning.
Academic functioning. Doll, Spies, and Champion (2012) suggest that the field of
education is moving away from focusing on dropout prevention to school completion, which
indicates that educators are paying more attention to students’ ability to engage in school
activities, feel belonged, and be focused and interested in class (i.e., indicators that predict
successful school completion). Suldo et al. (2014) further suggest that definition of academic
success should include behavior and attitudes that serve as academic enablers, in addition to
skills assessed by tests and course grades. It is notable that improvements in behavioral and
affective engagement are related to removal of learning barriers, including negative student
behaviors (e.g., not focusing in class) and attitude (e.g., dislike school); (Adelman & Taylor,

12
2000). Through improving student engagement, students gain more access to instruction, which
ultimately helps them obtain the academic skills that schools are being evaluated on (e.g.,
passing statewide exams). In sum, academic functioning should constitute examining students’
academic skills (i.e., knowledge in specific areas such as GPA), behavioral engagement (e.g.,
on-tasks behaviors in class), and affective engagement (e.g., feelings of connectedness to school).
Social-emotional functioning. Traditionally, psychological functioning is measured
through levels of distress. Although the absence of distress (e.g., psychopathological symptoms)
is desirable, the addition of the presence of subjective well-being is optimal and considered
thriving (Suldo et al., 2014). Moreover, Roeser, Eccles, and Sameroff (2000) suggest that social-
emotional outcomes should comprise of psychological and behavioral functioning. Thus, a
comprehensive evaluation of social-emotional outcomes should include:
• Symptoms of distress/psychopathology: positive social-emotional functioning is
reflected in low levels of internalizing (e.g., anxiety, depression) and externalizing
(e.g., aggression) symptoms.
• Indicators of subjective well-being: positive social-emotional functioning is reflected
in average to above average level of emotional well-being, which can be measured by
student self-report of satisfaction with life or positive emotions such as happiness,
interest, pride, and joy.
• Indicators of behavioral functioning: positive social-emotional functioning is
indicated by high levels of social competence (e.g., social skills) and low levels of
social problem (e.g., peer victimization).
As mentioned, it is important to consider positive indicators of mental health in addition
to absence of psychopathology when evaluating students’ social-emotional functioning. When

13
Suldo and Shaffer (2008) examined the subjective well-being (SWB), psychopathology,
academic functioning, social adjustments, and physical health of 349 middle school students (6th
to 8th grades), they found that students with positive indicators of mental health (i.e., higher level
of SWB) and lower level of psychopathology demonstrated better academic outcomes (e.g.,
better reading skills), self-perceived physical health , and social functioning compare to peers
with low level of SWB and psychopathology. Suldo and Shaffer (2008) consider this group of
students who perceive self to have higher level of SWB and lower level of psychopathology as
those with complete mental health. Sixty percent of students fall in the complete mental health
group. Other students fall into the vulnerable group (i.e., low level of SWB and
psychopathology; 12.5%), symptomatic but content group (i.e., elevated level of SWB and
psychopathology; 12.5%), and troubled group (i.e., low level of SWB and high level of
psychopathology; 15%). If schools use the absence of psychopathology as the only indicator of
psychological functioning, students who fall in the vulnerable group will fall through the crack
and might not receive the appropriate support to prevent future failure. In summary, a
comprehensive definition of student success should include academic and social-emotional
functioning (Suldo et al., 2014). This comprehensive definition acknowledges the invisible skills
(e.g., academic enabling and social-emotional skills) that are required for students to succeed in
school.
Universal support. The MTSS aims to promote student success that aligns with the
description provided above. Christner, Mennuti, and Whitaker (2008) offer a more detailed
description of the MTSS. Similar to Cook et al. (2015), they describe MTSS as a systematic
approach to assess, intervene, and monitor students’ progress towards academic and social-
emotional success. Their model includes four levels of intervention, namely universal, targeted,

14
intensive, and crisis level. At the universal level, all students receive evidence-based supports to
build protective factors that reduce vulnerability to future problems or maladaptive coping. Some
examples of interventions at this level include teaching social-emotional skills, building
resiliency, preventing bullying, and promoting adaptive coping strategies.
The universal level of support has been shown to prevent academic decline and emotional
burnout. For example, Durlak, Weissberg, Dymnicki, Taylor, and Schellinger (2011) conducted
a meta-analysis across 213 studies that examined the outcomes of school-based universal Social-
Emotional Learning (SEL) programs found that students who participated in SEL programs
demonstrated improved social and emotional skills, attitudes, behavior, and academic
competence. Specifically, 68 studies demonstrated increased SEL skills such as identifying
emotions from social cues, goal setting, perspective taking, interpersonal problem-solving, and
decision making (ES = .57); 106 studies established increased attitudes towards self, school, and
social topics such as drug use (ES = .23); 86 studies showed increased self-report or observed
positive social behavior (ES = .24); 112 studies demonstrated improved conduct problems such
as aggression, non-compliance, and bullying (ES = .22); and 49 studies showed improved in
emotional distress such as depression, anxiety, stress, and social withdrawal (ES = .24).
Although a minority of studies in this meta-analysis examined academic outcomes (35 studies
with 135,396 participants), analysis yielded a significant increase in standardized reading or
math achievement test scores (ES = .27) and overall Grade Point Average (GPA) in specific
subjects such as Reading or Math (ES = .33). This meta-analysis suggests that universal school-
based social-emotional support serve as an effective mean to prevent academic deterioration or
emotional distress.

15
A total of 270,034 students from kindergarten to high school were involved in Durlak and
colleagues’ (2011) meta-analysis. Among that sample, 56% were elementary school students,
31% were middle school students, and 27% were high school students. This trend suggests that
social-emotional support gradually declines as students move onto higher grades. This
observation is concerning as students often experience more academic and social-emotional
challenges during times of transition, especially from middle to high school (i.e., 9th grade).
Cohen and Smerdon (2009) explained that many 9th grade students, even those who have done
well in the past, struggle to succeed in high school due to a combination of developmental and
contextual factors. Developmentally, 9th grade students move into adolescent years which
constitute greater pubertal changes (e.g., hormonal changes exacerbate uncertainty of transition),
bigger social stress (e.g., navigating through social cliques), and higher academic stress (e.g.,
increased academic workload). They also begin to develop their own identity while experiencing
a change in social contexts (e.g., losing support network from middle school, negotiating
autonomy from parents, relying more on peer support, etc.). These various factors contribute to
increased social and emotional challenges among 9th grade students, which often result in
negative outcomes such as achievement loss, poorer attendance, and decreased engagement
(Alspaugh, 1998). Aligned with the concept of providing preventative, universal support, Cohen
and Smerdon (2009) suggest providing early intervention and creating supportive environment to
aid students through middle to high school transition.
As the universal level of support has been shown to be effective in supporting student
success (i.e., prevent academic and social-emotional challenges as well as promote competence
in those areas), it might be beneficial to implement universal social-emotional interventions
during times of transition, especially during first year of high school, when students face

16
additional stress and challenges. To take it one step further, targeted supports should be provided
in addition to universal support for high school students who demonstrate signs of academic or
social-emotional risk. The following section describes existing targeted supports for high school
students in the context of MTSS in the current literature.
Targeted support for high school students. According to Christner, Mennuti, and
Whitaker (2008), the goal at this level is to provide additional supports to students who (a) did
not respond to universal level of support, (b) are at risk for developing emotional or behavioral
problems, and (c) have specific life stressors (e.g., poverty). Approximately 15-20% of students
at a given school can be expected to be in need of this level of support. This level provides more
intensive and specialized interventions that are appropriate for students who display ongoing
needs that are not severe enough to warrant intensive supports. Educators can identify students
who need this level of support through systematic screening and data-based decision making.
Bruhn, Lane, and Hirsch (2014) conducted a literature review to investigate the extent to
which targeted supports have been implemented and evaluated within schools that utilize MTSS
to provide academic and behavioral services. Out of the 28 studies that met the authors’ criteria,
only one study involved high school participants. In this descriptive, quasi-experimental study,
Lane, Kalberg, Mofield, Wehby, and Parks (2009) investigated the effects of a targeted academic
intervention (i.e., Preparing for the ACT) that aimed to help a group of students (N= 126;
identified by the principal and schoolwide team) prepare for the American College Test (ACT).
Comparing students who did (2005-2006 academic year) and did not (2004-2005 academic year)
participate in the intervention, the authors found a 10% increase in number of students who meet
the district target scores during intervention year. Moreover, school mean scores either met
(Science and total score) or exceeded (English and Math) state mean scores during intervention

17
year. That is an improvement as the school mean score was below the state mean score on all
subject areas in the previous year.
In terms of targeted supports within the MTSS framework that focus on social-emotional
functioning, a review of the current literature shows that most studies focus on addressing or
preventing internalizing (e.g., anxiety, depression) or externalizing (e.g., absenteeism,
aggression) symptoms among students. For example, the COPE (Creating Opportunities for
Personal Empowerment) Healthy Lifestyles TEEN (Thinking, Emotions, Exercise, Nutrition)
program is a 15-session manualized curriculum that aims to improve high school students’
lifestyle through a cognitive-behavioral lens. In a cluster randomized controlled trial conducted
by Melnyk et al. (2015), 779 culturally diverse youth (age 14-16 years) from 11 high schools in 2
school districts in the US Southwestern region were randomly assigned to the COPE Healthy
Lifestyle TEEN program or an attention control program called Healthy Teens (educate students
on common health issues such as dental care, skin care, etc.). Each lesson includes a cognitive-
behavioral component and a 20 minutes physical activity. Compared to the control group, a
marginal model approach to repeated measures ANCOVA revealed that there is a significant
decrease in the proportion of overweight and obese participants from baseline to 12 months (χ2 =
5.40, p = .02). Moreover, participants who received COPE and had elevated depression scores at
the beginning of the study showed significant decrease in depression scores (fell into normal
range) at 12 months (M = 42.39). In contrast, participants in the control group and had elevated
depression symptoms stayed in the depressed range after 12 months (M = 57.90; F1, 12 = 5.78, p
= .03). The COPE program is an example of curriculum that can be used at the universal (all
students) or targeted (subgroup of students) level. Its focus on teaching students coping strategies
to improve lifestyle aligns with the MTSS framework of prevention and early intervention.

18
Another example of an evidence-based targeted mental health support for youth is the
Modular Approach to Therapy for Children with Anxiety, Depression, Trauma, or Conduct
Problems (MATCH-ADTC; Chorpita & Weisz, 2009). With a modular design, MATCH-ADTC
(Chorpita & Weisz, 2009) act as an organized system that allows clinician to flexibly draw on 33
procedures adapted from evidence-based treatments to address youth’s anxiety, depression,
trauma, and/or conduct problems. Weisz et al. (2012) conducted a randomized trial with 174
clinically referred youth (age 7 to 13) from 2005 to 2009. Participants were randomly assigned to
1 of 3 conditions. Participants assigned to usual care condition used the treatment procedures that
they used regularly; participants in standard treatment received one of the manualized protocols
(i.e., Coping Cat, Primary and Secondary Control Enhancement Training, and Defiant Children);
participants assigned to modular treatment received MATCH-ADTC. Mixed effects regression
analyses revealed that participants who had modular treatment showed significantly steeper
trajectories of improvement compared to usual care and standard treatment.
It is noteworthy that the MATCH-ADTC (Chorpita & Weisz, 2009) can be utilized at the
intensive level with individual students who need extensive support beyond universal and
targeted level of services. Similar to how evidence-based targeted support programs are
sometimes used at the intensive level, practitioners often utilize evidence-based universal support
programs at the targeted level. For example, practitioners may deliver a social-emotional
curriculum (e.g., COPE program) to a subgroup of students whom they perceived to need
targeted support in that area. In summary, targeted support is defined as providing support
tailored to the needs of a specific group of students, individually or in small groups. The program
or curriculum used can be adapted from a universal or intensive program.

19
This review of the literature revealed few targeted supports for high school students
within the MTSS framework. Just as Durlak et al.’s (2013) meta-analysis of 213 studies that
examined the efficacy of universal social-emotional support found that the amount of studies that
involved high school students were the least, Hoagwood et al. (2007) reviewed over 2,000
published articles between 1990 and 2006 and reported that most of the interventions focused on
elementary students. This points to a gap in the current literature; there is a need to examine how
to best support high school students academically, socially, and emotionally. Moreover, many
targeted supports (e.g., Preparing for the ACT and MATCH-ADTC) adopt the deficit model,
where the goal is to fix an existing symptom (e.g., academic decline, internalizing symptoms,
etc.). In the spirit of the MTSS, the field of education is shifting towards a prevention model.
One way to prevent problems before they occur may be through teaching high school students
stress management and school engagement skills. Stress management skills can help students
cope with various demands associated with being a high school student (e.g., increase in
academic load, change in social circle); whereas school engagement skills can aid adolescents in
feeling more connected to others at school, which is a protective factor. Although some programs
like COPE teaches students coping skills, it does not explicitly teach skills that enable
adolescents to connect to their school, teachers, and peers (i.e., engagement skills). A curriculum
that combine both seems to be another gap in the literature.
Counseling Approaches in School Mental Health Services
According to a longitudinal community study conducted by Costello, Mustillo, Erkanli,
Keeler, and Angold (2003), 36.7% of youth age 9 to 16 (N = 1420) met criteria for at least one
psychiatric disorder over the study period (participants were assessed for psychiatric disorder
every year since intake until age 16). The National Comorbidity Survey-Adolescence

20
Supplement (NCS-A) provide more insight on the prevalence of disorders through interviewing a
sample of more than 10,000 youth age 13 to 18. The study results showed that a high rate of
mental disorders persist in U.S. youth; the most common is anxiety disorder (31.9% of youth),
followed by behavior disorders (19.1%), mood disorders (14.3%) and substance abuse (11.4%;
Merikangas et al., 2010). The NCS-A also revealed that only about 36% of youth who meet
criteria for a mental disorder receive any kind of services. Moreover, three out of four of youth
receiving mental health support receive such in a school setting.
School mental health providers utilize various counseling approaches to address students’
mental health needs. Hanchon and Fernald (2013) conducted an internet survey with 771 school
psychologists across the nation and found that the most popular counseling approach among the
participants who were providing school-based counseling services (n = 401; 58% out of 771
respondents) is the cognitive-behavioral model (n = 332; 88.2% out of 401 respondents). Table 1
lists all the counseling orientations that participants identified with in the order of most to least
common.
Table 1
Approaches Used by Respondents in Hanchon and Fernald’s (2013) Study
Counseling Approach n % of Respondents
Cognitive-Behavioral 335 88.2
Brief Solution-Focused 295 77.6
Behavioral 261 68.7
Reality-Based 157 41.3
Social-Cognitive 156 41.1
Family Systems 119 31.3
Humanistic 115 30.3
Psychoanalytic 70 18.4
Cognitive-behavioral therapy focuses on changing maladaptive thoughts among clients,
believing that doing so changes one’s emotions and behaviors in response to events. Action

21
planning, problem-solving, self-evaluation, and positive self-talk are common techniques in
cognitive-behavioral therapy (Kendall, 1985; Kendall, 2011). There are several reasons why the
cognitive-behavioral model, with an emphasis on action planning, is the most popular model
among school psychologists who provide school-based counseling services (Hanchon & Fernald,
2013). Raffaele-Mendez (2016) explained that the cognitive-behavioral model is appropriate for
school-based mental health services because it is evidence-based, flexible to be delivered in
small group or individualized modalities, and can be delivered in a non-manualized but
structured format, allowing the student and therapist to work together to create agenda that
relates to the topics that are important to the student. Case in point, the interventions in MATCH-
ADTC (Chorpita & Weisz, 2009), an evidence-based targeted support program describe above,
are rooted in the cognitive-behavioral framework.
The second most popular approach is the brief solution-focused therapy, a strengths-
based intervention that encourages clients to generate solutions to solve their own problems.
Using carefully posed questions, the approach aims to help client make changes with their own
resources and motivation. Kim and Franklin (2009) conducted a meta-analysis on studies that
examine the effects of solution-focused therapy in school settings. From 1998 to 2007, only 7
studies met the inclusion criteria. They found mixed results on the efficacy of this approach.
Some studies demonstrated decrease in intensity of negative emotions, increase in ability to
manage problems, improved academic outcomes (e.g., credits earned), and improvement in
externalizing symptoms and substance use. One study also revealed that the solution-focused
therapy is as effective as cognitive-behavioral therapy and result in better retention rate and
higher engagement with client. On the other hand, some studies suggested that this approach is

22
not effective in raising Grade Point Average (GPA), improving attendance, or increasing
students’ level of self-esteem.
An approach that shares some features with brief solution-focused is Motivational
Interviewing (MI). Both styles are collaborative in nature, aim to cultivate clients’ resources and
motivation, and are antitheses of problem-focused therapies (Lewis & Osborn, 2004). Although
there are some similarities between the two approaches, there are some key differences that
distinguish them. One such difference is that MI uses a well-defined model of change – the
stages of change model (Prochaska, 1999); whereas brief solution-focused therapy believes that
resistance does not exist and does not endorse a clear model of change (Lewis & Osborn, 2004).
Moreover, brief solution-focused therapy uses reflective practices to reach mutual client-
counselor reflection; whereas MI focuses on using reflection to communicate empathy and guide
client to move towards change. More details on MI will be provided after this section, but it is
important to not equate brief solution-focused therapy with MI.
The behavioral approach is the third most common approach adopted by respondents in
Hanchon and Fernald’s (2003) study. As overt behavioral difficulties are the most common
referral issue (94.5%) reported by the participants, it is easy to see why the behavioral approach
is popular. Behavioral approach can stem from a wide array of theories (e.g., applied behavior
analysis, social learning theory, etc.) and each model hold different assumptions about cause and
maintenance of problematic behaviors (Gresham, 2004). However, it is noteworthy almost all of
the behavioral interventions in schools involve the action planning process (Sugai & Horner,
2002). School practitioners often utilize one or more of these models in addressing behavioral
difficulties in school. A long line of research supports the efficacy of behavioral interventions.
For example, Kratochwill and Stoiber’s (2000) meta-analysis of over 300 studies that involve

23
youth age 2 to 18 years old and reported an average effect size between .70 and .90 for
behavioral interventions. As the percentage of school psychologists in Hanchon and Fernald’s
(2003) study who identify with the rest of the approaches drastically decrease after the three
most popular approach (i.e., cognitive-behavioral, brief solution-focused, and behavioral), this
literature review will not describe the details of the remaining approaches.
In addition to the approaches emerged from Hanchon and Fernald’s study, a new wave of
psychotherapy approaches has emerged. Acceptance and Commitment Therapy (ACT),
Dialectical Behavior Therapy (DBT), and Positive Psychology Intervention (PPI) are some
examples of the new wave of psychotherapy. A common element across ACT, DBT, and PPI is
mindfulness. These psychotherapies have gained popularity in school-based mental health
services in part because of their ability to simultaneously address problems and cultivate
subjective wellbeing among students. For example, Mind Up (Schonert-Reichl et al., 2015), an
evidence-based universal program designed to teach youth from pre-Kindergarten to 8th grade
about neuroscience (e.g., focused attention), mindful awareness (e.g., mindful listening), positive
psychology (e.g., savoring), and social-emotional learning (e.g., act with kindness) has been
shown to improve students’ (a) cognitive control and stress physiology, (b) empathy,
perspective-taking, emotional control, optimism, school pride, and mindfulness, (c) self-reported
symptoms of depression and peer-rated aggression, and (d) popularity among peers (Schonert-
Reichl et al., 2015).
Another emerging school counseling approach is the Strengths-Based School Counseling
(SBSC) framework. Galassi (2017) explained that this approach aims to promote and advocate
for positive development among all students, in contrast to the traditional model that only
focuses on a subgroup of students (e.g., students with exceptional needs). This framework is

24
rooted in evidence-based interventions that focuses on positive youth development (e.g., building
resiliency, foster self-efficacy, promote hope, etc.). The six guiding principles of SBSC are (a)
promote context-based development for all students, (b) promote individual student strengths, (c)
promote strengths-enhancing environment, (d) emphasize strengths promotion over problem
reduction and problem prevention, (e) emphasize evidence-based interventions and practice, and
(f) emphasize promotion-oriented developmental advocacy at the school level. This framework
encourages school mental health providers to endorse both direct (e.g., counseling) and systemic
(e.g., consultation) services to maximize the effectiveness of service delivery.
In line with the MTSS framework described before this section, the provision of school
mental health services should be proactive and strive to prevent problems before they occur.
Moreover, if complete mental health is the goal, it is equally important to reduce signs of
problems (e.g., psychopathology symptoms) as it is to promote subjective wellbeing among
students. Hanchon and Fernald’s (2013) study revealed that the majority of school psychologists
nationwide who are providing mental health services seem to identify with the more traditional
counseling approaches such as the cognitive-behavioral model, where the focus tends to be
reducing psychological distress. The new theories of psychotherapy (e.g., mindfulness and
positive psychology) address this gap by providing a mean to promote subjective wellbeing
among youth in school. Depending on how school-based mental health practitioners utilize the
counseling approach (traditional or new wave) in their own practice, each approach can
contribute to fostering complete mental health among students. In fact, practitioners should
match the school’s or students’ needs to the appropriate counseling approach. Often,
practitioners utilize more than one counseling approach to meet the various needs in school.

25
There are two additional interventions that have yet to be discussed in detail in this
chapter – action planning and motivational interviewing—that are relevant to promoting
complete mental health. These interventions are important to discuss as they have the potential to
reduce early psychopathological symptoms and promote subjective wellbeing among students.
Feasibility and acceptability are relatively high because they are brief, targeted interventions that
promote student behavior change to achieve a goal. The goal can either reduce distress or
promote subjective wellbeing. The flexibility of these interventions can be valuable to fit the
ever-changing needs of youth.
Action planning (AP). Action planning (AP) is an intervention technique rooted in
health behavior research and driven by social-cognitive theories. As mentioned, it is one of the
most important elements in two of the most popular counseling approaches utilized by school
psychologist – Cognitive Behavioral and Behavioral Therapy (Hanchon & Fernald, 2013). In the
social-cognitive model, intention is conceptualized as the primary determinant of whether one
perform and maintain health behavior (Hagger & Luszczynska, 2014). However, there is often an
intention-behavior gap, where the intention to perform a behavior does not translate into actual
behavior. AP, along with other planning interventions are techniques designed to close this gap
through strengthening one’s intention and creating solid plans to help individuals enact the
intended behavior. This review focuses on AP as it is one of the most used planning strategies in
the current literature (Bélanger-Gravel, Godin, & Amireault, 2013) and it is widely used by
school psychologists as an intervention (Hanchon & Fernald, 2013).
Generally, AP entails cue-response contingency, which means that the client specifies
when (time-related cues) and where (external environment cues) they will carry out their plan
(Hagger & Luszczynska, 2014). Moreover, client will detail how he or she will perform the

26
behavior. The action can be simple (e.g., studying) or relatively complex (e.g., review class
content for 45 minutes). Lastly, AP is always tied to a goal (e.g., get better grades). In addition to
specifying when, where, and how one would carry out a behavior, action planning is sometimes
accompanied by a coping plan (i.e., anticipate barriers and generate solutions to address them) to
further narrow the intention-behavior gap. The coping plan often involves some kind of problem-
solving process to anticipate and address obstacles to plan enactment.
Action planning (AP) has been found to be effective in increasing health behaviors. A
meta-analysis on the efficacy of AP intervention on physical activity (e.g., going to the gym)
across 26 randomized controlled trials involving college students, clinical samples, and adults
(age ranges from 18 to 64 years) reported small to medium overall effect size of 0.31 (95% CI
[0.11, 0.51]) at post-intervention; 0.24 (95% CI [0.13, 0.35]) at follow-up (Bélanger-Gravel et
al., 2013). Most of the studies used self-report measures (e.g., questionnaire, diaries, checklist)
except for two (one used direct observation; another used pedometer).
School-based application of action planning. In the realm of school-based interventions,
action planning (AP) is often embedded as part of a counseling or intervention program,
especially when the practitioner is using the Cognitive-Behavioral or Behavioral approach
(Hanchon & Fernald, 2013). In addition to specifying when, where, and how students will carry
out a plan, AP in the schools often involve problem-solving. Specifically, interventionists often
help student problem-solves barriers to carrying out the action plan. For example, a school
mental health provider may work with student to create an action plan at the end of counseling
session to encourage student to carry out behaviors that will lead them to achieve their therapy
goals. It is viewed as an accountability system that increase the probability that student perform
desired change in behavior. Sometimes, AP is embedded in an intervention curriculum, such as

27
the Homework, Organization, and Planning Skills (HOPS) Intervention (Langberg, 2011). HOPS
is a 16-session behavioral intervention that aim to teach students how to organize school
materials, record and manage homework, as well as planning out their time. AP occurs when
HOPS teaches students how to plan for the timely completion of school assignments. In a
randomized controlled trial carried out by Langberg, Epstein, Becker, Girio-Herrera and Vaughn
(2012), 47 middle school students (6th to 8th grade) with Attention-Deficit/Hyperactivity Disorder
(ADHD) were randomly assigned to receive the HOPS intervention or to a waitlist control group.
Compared to the control group, repeated measures multivariate analyses of variance
(MANOVAs) revealed that those who participated in HOPS demonstrated significant
improvements in parent-report organized action (d = .88), materials management (d = .63),
planning (d = 1.05), and homework completion behaviors (d = .85). In summary, school-based
mental health providers have been successfully utilizing AP to encourage behavior change
among students (e.g., when embedded in HOPS, CBT, or other behavioral interventions) in
schools.
Motivational interviewing. Miller and Rollnick (2012), leaders in the field of MI,
described MI as follows:
MI is a collaborative, goal-oriented style of communication with specific attention to the
language of change. It is designed to strengthen personal motivation for and commitment
to a specific goal by eliciting and exploring the person’s own reasons for change within
an atmosphere of acceptance and compassion (p. 29).
To further expand on that definition, MI is grounded in the person-centered approach,
where client’s autonomy is emphasized and respected. The spirit of MI constitutes partnership,
acceptance, compassion, and evocation. In the spirit of partnership, MI coaches acknowledge

28
that clients know themselves best and the process of change require collaboration between coach
and client. MI coaches also uphold an attitude of profound acceptance, that is to provide
unconditional positive regard, accurate empathy, autonomy support, and affirmation to clients.
Furthermore, MI coaches express compassion through prioritizing client’s need and wellbeing
above self. Finally, MI coaches embrace a strength-focused approach, believe that clients possess
what they need to change within them, and that the role of a MI coach is to evoke, to call forth
clients’ motivation and resources for change. This approach differs from the traditional
psychotherapy models that focus on client deficits.
While the underlying spirit of MI (i.e., partnership, acceptance, compassion, and
evocation) help coaches get into the appropriate mindset before practicing MI, the four processes
of MI (i.e., engaging, focusing, evoking, planning) guide coaches through the process of
conducting MI (Miller & Rollnick, 2012). The four processes are both sequential and recursive,
thus best represented by stair steps. Each process relies on the previous process as a foundation,
but one may step up or down to revisit a previous process that needs renewed attention. Figure 1
represent the four processes in stair steps. Engaging is the first step in MI and serve as the
foundation of the whole intervention as building a positive therapeutic relationship with client is
a prerequisite for all the other processes. The second step entail coaches guiding client to focus
on an agenda. Coaches strive to guide the conversation towards one or more change goals. Next,
coaches lead client into the heart of MI – evoke. This process occurs when client is focused on a
goal and the coach cultivate ideas and motivation within client to result in client-generated
reasons for change. After evoking, if a client reaches a threshold of readiness, he or she will shift
from talking about whether or why to change to how and when he or she can change. At this
point, MI coaches should engage in planning with client – developing client’s commitment to

29
change and collaboratively devising a plan of action. Completing the four processes does not
necessary mean that the intervention has concluded. Miller and Rollnick (2012) stress that the
four processes of MI may need to be revisit from time to time. For example, MI coaches often
have to re-engage client during conversation or revise the action plan if the client encounters
roadblocks while enacting the plan. In summary, MI coaches often step up and down the stairs of
the four processes to meet the client’s position in stages of change.
Planning
Evoking
Focusing
Engaging
Figure 1. The Four Processes of Motivational Interviewing (MI)
In addition to the spirit and processes of MI, MI is associated with core skills– ask Open
questions, Affirmation, Reflection, and Summary (OARS). These skills serve as tools that allow
coaches to embody the spirit of MI and move between the four processes (Miller & Rollnick,
2012). In other words, it is how coaches carry out MI. Open questions invite clients to reflect and
elaborate. It helps coaches understand clients and enhance collaboration between coach and
client. Affirmation allows coaches to communicate what they noticed about the clients’ strengths
to the clients. This is an important practice in MI as it relies on clients’ personal resources to
enable change. It is the coaches’ role to help clients believe in and harness their own ability to
change. Reflective listening keeps clients talking, exploring, pondering on what they said to the
coaches. It also helps coaches further understand what the clients are trying to convey. Finally,
summarizing enables coaches to provide a collection of reflections on what the clients had said in
the conversation. It can serve as a way to link various topics together or to transition from one
process to another. Miller and Rollnick (2012) explained that the four skills overlap. A summary
is a long reflection, some reflections can also be categorized as affirmations, and good reflective

30
listening is needed to perform all four skills. In essence, MI is a fairly complicated intervention.
The four spirit, processes, and core skills intertwine to create a counseling approach that is truly
unique with the goal of eliciting behavior change.
MI has gained much attention over the last three decades (Lundahl & Burke, 2009). From
1980 to 1989, there were only six references on MI in PsycInfo. The number grew to 78 between
1990 to 1999 and to 707 between 2000 and 2009. In terms of efficacy, various meta-analyses
have shown MI to be effective in helping individuals overcome a wide array of problems such as
substance use and risky behaviors. Burke, Arkowitz, and Menchola (2003) published a meta-
analysis on MI that included 30 controlled clinical trials. The trials delivered MI individually to
treat problem behaviors such as drinking, substance abuse, risky sexual behaviors, diet, and
exercise. In 2005, Hettema, Steele, and Miller (2005) published another meta-analysis on MI
which included 72 studies, but some of the studies combined MI with another counseling
approach such as Cognitive-Behavioral Therapy (CBT). Later, Vasilaki, Hosier, and Cox (2006)
published another MI meta-analysis that involved 15 studies that focused on reducing drinking
problem. Lundahl and Burke (2009) compared the above-mentioned published meta-analyses of
MI to their own meta-analysis (included 119 studies on MI that target a range of problems;
Lundahl, Kunz, Brownell, Tollefson, & Burke, 2010) to examine the research evidence for MI’s
effectiveness. To systematically compare the studies, they used effect sizes and difference in
success rate (i.e., percentage of gain relative to comparison group).
In general, Lundahl and Burke (2009) found that MI was consistently and significantly
more effective when compared to waitlist or no treatment group. The effect size is significant but
small (d = 0.28 – 0.40). Moreover, 14 to 19% of those who received MI tended to do better than
the control group after two or three sessions of MI. When compared to another active treatment

31
(e.g., CBT), MI is usually as effective as the other treatment, but there are some instances when
MI outperformed the other treatment (d = 0.04 – 0.32). Approximately 2 to 15% of the
participants who received MI fared better than those who received another treatment, but some
of these results are non-significant. This finding is consistent with the Dodo bird verdict, which
states that psychotherapies share common factors that lead to small and non-significant
differences between outcomes generated from different forms of psychotherapies (Luborsky,
Singer, & Luborsky, 1975). In terms of types of problems, Lundahl and Burke (2009) reported
that MI is most used to treat alcohol use problem and has shown to be more effective compared
to no treatment/waitlist control; at least as effective as other active treatments. The other
problems targeted in the four meta-analyses include marijuana use, tobacco use, all other drug
use, risky behavior, increase healthy behavior, diet/exercise, social functioning, treatment
compliance, increase motivation, gambling, eating disorder, emotional wellbeing, parenting
practices, and confidence to change. Lundahl and Burke (2009) also found that MI is less
effective when delivered in a small group modality and require less delivery time compared to
other established treatments. In summary, MI seems to be a cost-effective treatment that can be
used to address a wide range of problem behaviors and there is most empirical support for
positive effects when delivered individually.
School-based application of motivational interviewing. Since the 1980s, researchers had
adapted the MI approach in other settings, including school. MI is especially appropriate to use
with adolescents as its respect for autonomy and collaborative nature aligns well with their need
for independence and identity formation (Kaplan, 2014). Case in point, some of the meta-
analyses described above involved adolescents and had been shown to be effective. Nonetheless,
the literature on adolescents is still at an early stage compared to the literature on adults

32
Currently, MI is utilized in two ways in the schools – student-focused (directly conduct
MI interventions with youth) and consultative-focused (use MI to consult with educators and
parents; Strait, McQuillin, Terry, & Smith, 2014). For student-focused MI, a meta-analysis was
recently conducted to examine its efficacy (Snape & Atkinson, 2016). In their literature search,
they only included peer-reviewed studies conducted with youth (age 5 - 21), took place in an
educational setting, used a MI-based intervention, empirical, and written in English. Only 8
studies (4 conducted in United States; 4 conducted in United Kingdom) met the inclusion
criteria. Among the eight studies, some are case studies that involve only one student, others are
randomized controlled trials that included higher number of students (highest N = 135). It is also
noteworthy that a range of school professionals carried out the MI intervention, including school
psychology interns and graduate students. In general, the current school-based student-focused
MI interventions were primarily developed for the students who are only taking general
education classes or students with disabilities to improve their academic outcomes (e.g., grades),
behavior engagement (e.g., classroom participation, homework completion, and attendance),
emotional engagement (e.g., attitude towards school), and vocational development. Students in
accelerated curricula, who theoretically are great candidates to use MI with as they might be
better able to handle the cognitive and neuropsychological demands of the MI process, have yet
to be included in published studies. Nonetheless, combining all 8 studies in the meta-analysis,
Snape and Atkinson (2016) concluded that there is an overall evidence for the efficacy of
student-focused MI interventions. They also noted that some studies demonstrated positive
outcomes with just one session of MI, suggesting that student-focused MI has the potential to be
a cost-effective intervention. Table 2 describes each study included in the meta-analysis.

33
In addition to serving students directly, MI can also be used to strengthen consultative
practices in schools (i.e., consultative-focused MI). The field of education has come to realize the
importance of influencing parent and teacher behavior as it ultimately contributes to better
student outcome. An example of the adaptation of MI to facilitate behavior change in parents is
the Family Check Up (FCU) intervention. Through three sessions (i.e., intake interview,
ecological assessment of family functioning, and performance-feedback) delivered by clinician
in schools, FCU aims to increase parents’ use of positive behavior support at home. As for
teacher consultation, Lee, Frey, Herman, and Reinke (2014) provided some suggestions on how
MI can be used to coach teachers to improve their own practices. Specifically, it can be used to
motivate teachers to adhere to intervention fidelity, which in turn increase the likelihood of
successful intervention. They recommended four activities based on the processes of MI –
engaging, focusing, evoking, and planning. First, the coach should build a working alliance with
teacher. Then, coach work with teacher to assess current practices, share performance feedback,
and offer additional support to reach self-determined goal. There is also a more structured guide
for MI-based teacher consultation – the Motivational Interviewing Navigation Guide (MING;
Frey et al., 2013). MING consists of five steps that aim to evoke motivation within teachers to
implement intervention with fidelity. Similar to student-focused school-based MI intervention,
this field is relatively new but has great potential to improve student outcomes.
Although MI has much less evidence in its efficacy in school-based application compared
to the health field, it has shown much promise. Returning to Lundahl and Burke’s (2009)
analysis of the efficacy of MI across four meta-analyses, they recommend and encourage others
to adapt MI to new areas as their analyses revealed that MI is likely to be more effective than no
treatment and it fare as well as other established treatment, probably in less time. Snape and

34
Atkinson’s (2016) meta-analysis on current school-based student-focused MI interventions
confirmed this sentiment. In a setting like school, time is a valuable and limited resource. MI
may prove to be an excellent fit as past research lends confidence that it can support more
students with relatively few contacts.
Since that meta-analysis, other school-based studies have provided support for positive
impacts on other areas such as attitude towards school (Strait et al., 2017), sleep problems
(Bonnar et al., 2015), and school dropout (Iachini, Rogelberg, Terry, & Lutz, 2016). Through a
randomized controlled trial, Strait et al. (2017) reported that a brief school-based Motivational
Interviewing (MI) intervention called the Student Check-Up (SCU) was effective in increasing
middle school students’ perceived importance of in-class participation and academic self-
efficacy. On the other hand, Bonnar et al. (2015) found that a school-based motivational sleep
education programs (SEPs) delivered with adjunct bright light therapy (BLT) and/or parental
involvement (PI) was effective in increasing high school students’ motivation to regularize
bedtimes and avoid sleeping-in on weekends. Interestingly, MI was embedded in the class wide
SEPs instead of delivered to individuals or in groups. Finally, Iachini, Rogelberg, Terry, and
Lutz (2016) reported that Aspire, a MI-based early intervention program was feasible,
acceptable, and effective in preventing students who are repeating 9th grade from dropping out of
high school.
Comparing action planning to motivational interviewing. Compared to action
planning (AP), Motivational Interviewing (MI) offers additional elements (e.g., engaging with
client, cultivating clients’ own motivation to change, conveying acceptance and collaboration,
focusing on topics important to client, and evoking change talk) that serve to build up motivation
in clients before and while making a change plan. Nonetheless, both AP and MI have been

Table 2
Study Characteristics from Snape and Atkinson’s (2016) Meta-analysis of School-Based MI Interventions
Author
(Year)
Sample Study
Design
Intervention Interventionist Outcome(s)
Atkinson
& Woods
(2003)
1 Female; 9th grade CS Five weekly 1-hour MI
sessions + other
consultative techniques
School Psychology
Intern • Teacher reported increase
in attendance and
punctuality, attitude
towards school, and
confidence
• Slightly higher score on
Myself as a Learner Scale
(MALS; Burden, 1998)
• Increase in Pupils Feelings
about School and School
Work (PFSSW) Inventory
(Entwistle & Kozeki,
1985)
Atkinson
& Amesu
(2007)
1 Male; 6th grade CS Unspecified number of
MI + SFBT sessions
Social Worker
Manager • Increased attendance
• Teacher report improved
behavior in class
Kittles &
Atkinson
(2009)
3 students (age 13-
15)
CS One individual MI
session + Two optional
additional sessions
School Psychology
Intern • Qualitative feedback from
students were positive; 2
out of 3 students expressed
positive views about the
sessions
• Facilitators view MI as a
useful tool for assessment
purposes as it provided a
broad range of information

Table 2 (Continued)
36
about student that can be
used to personalize
intervention
Enea &
Dafinouni
(2009)
38 students (age 16-
17)
QE Eight 1-hour MI
sessions; Waitlist
control
School
Psychologist • Students who received MI
showed significant
decrease in truancy rates;
no difference in control
group
Strait et al.
(2012)
103 students (6th to
8th grades)
RCT One MI session (45
minutes) with structured
protocol; Include
normative feedback and
a goal sheet; Waitlist
control
Trained School or
Clinical
Psychology
graduate students
• Students who participated
in MI showed significant
improvements in math
scores compared to control,
but not in reading and
language arts or science.
• MI condition group
demonstrated significant
improvements in class
participation and overall
academic behavior, but not
on homework completion
or academic self-efficacy
Terry et al.
(2013)
49 students (6th to 8th
grades)
RCT Used Strait et al.’s
(2012) MI intervention;
Waitlist Control
Graduate Clinical
Community
doctoral student;
Bachelor-level
research specialist
• MI group showed
significant improvements
in Math
• No significant effect size
for overall academic
behavior, homework
completion, and
participation

Table 2 (Continued)
37
Channon et
al. (2013)
Approximately 480
students participated
in the peer support
program across 4
years (6th and 8th
grade)
CS 8th grade students get
trained in a MI-based
peer support program to
support 6th grade
students
8th grade students • Qualitative analyses of
individual interviews and
focus groups showed that
both adults and students
view the program as
beneficial and fit well with
the school’s vision and
mission
• Participants viewed the
program as feasible and
acceptable
Terry et al.
(2014)
42 students (6th to 8th
grades)
RCT Participants randomly
assigned to 1 or 2
sessions of MI (45
minutes; Strait et al.,
2012 protocol); those
who participate in 2nd
session received
performance feedback
Graduate Clinical
Community
doctoral student;
Bachelor-level
research specialist
• Participants who received
2 sessions of MI showed
significantly higher grades
in math, science, and
history, but not on English
Language Arts
• Compared to 1 session, 2
sessions of MI resulted in
significantly more
improvement in affective
engagement, but not on
self-efficacy, life
satisfaction, and behavioral
engagement
Note. CS = Case Study, QE = Quasi-Experimental, RCT = Randomized Controlled Trial
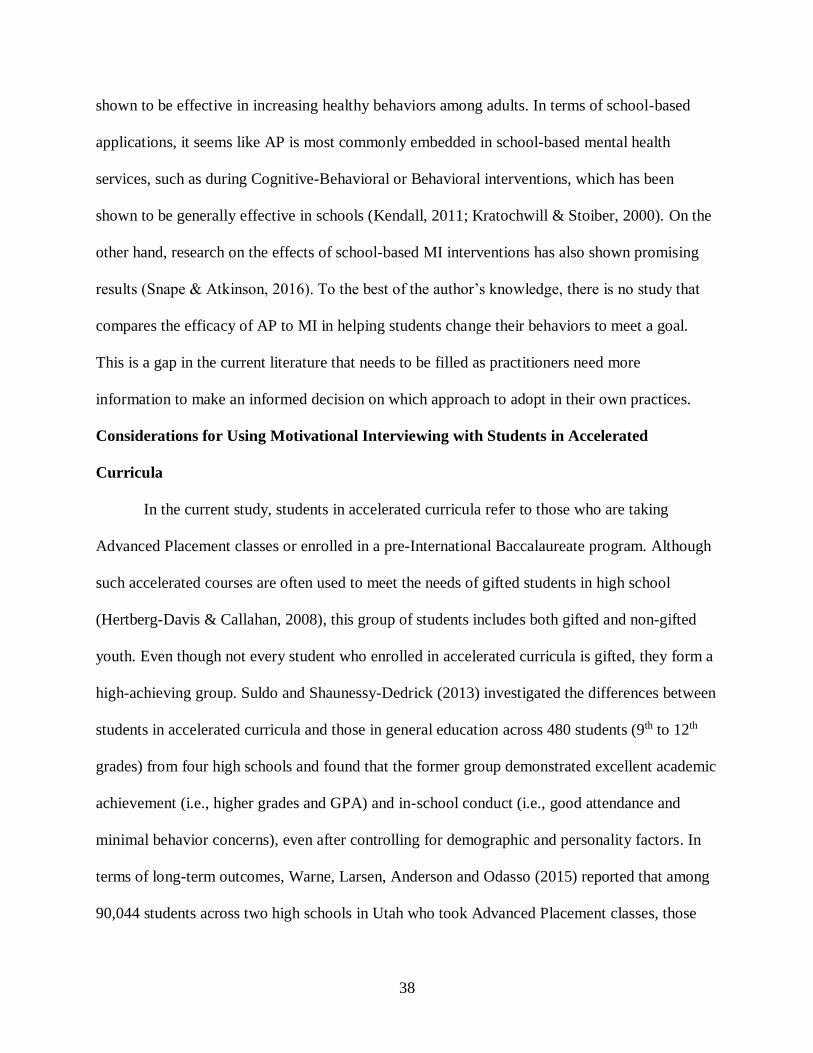
38
shown to be effective in increasing healthy behaviors among adults. In terms of school-based
applications, it seems like AP is most commonly embedded in school-based mental health
services, such as during Cognitive-Behavioral or Behavioral interventions, which has been
shown to be generally effective in schools (Kendall, 2011; Kratochwill & Stoiber, 2000). On the
other hand, research on the effects of school-based MI interventions has also shown promising
results (Snape & Atkinson, 2016). To the best of the author’s knowledge, there is no study that
compares the efficacy of AP to MI in helping students change their behaviors to meet a goal.
This is a gap in the current literature that needs to be filled as practitioners need more
information to make an informed decision on which approach to adopt in their own practices.
Considerations for Using Motivational Interviewing with Students in Accelerated
Curricula
In the current study, students in accelerated curricula refer to those who are taking
Advanced Placement classes or enrolled in a pre-International Baccalaureate program. Although
such accelerated courses are often used to meet the needs of gifted students in high school
(Hertberg-Davis & Callahan, 2008), this group of students includes both gifted and non-gifted
youth. Even though not every student who enrolled in accelerated curricula is gifted, they form a
high-achieving group. Suldo and Shaunessy-Dedrick (2013) investigated the differences between
students in accelerated curricula and those in general education across 480 students (9th to 12th
grades) from four high schools and found that the former group demonstrated excellent academic
achievement (i.e., higher grades and GPA) and in-school conduct (i.e., good attendance and
minimal behavior concerns), even after controlling for demographic and personality factors. In
terms of long-term outcomes, Warne, Larsen, Anderson and Odasso (2015) reported that among
90,044 students across two high schools in Utah who took Advanced Placement classes, those

39
who completed the course and passed the Advanced Placement exams tend to obtain higher ACT
scores. This is true even after controlling for academic, socioeconomic, and demographic
variables. Moreover, Patterson, Packman, and Kobrun (2011) found that students who passed the
Advanced Placement exam on the introductory course for their field major in college tend to
acquire higher college GPAs. Even mere participation in accelerated courses has been shown to
increase one’s likelihood to attend higher education. Compared to students who did not take
Advanced Placement exams, students who took Advanced Placement exams had a higher
tendency to attend college (Chajewski, Mattern, & Shaw, 2011). As for students who completed
the IB Diploma Programme (DP), they are highly likely to enroll in and complete studies at
postsecondary institutions (Bergeron, 2015). Specifically, 92% of IBDP students who graduated
from high school in 2008 enrolled in US postsecondary institutions between 2008 and 2014; 79%
of this group of students graduated within 4 years.
Advanced Placement. The College Board created the Advanced Placement program in
1955 to allow high-achieving students to earn college credits in high school. From 1955 to 1956,
only 104 schools offer Advanced Placement classes and approximately 1,200 students took
Advanced Placement exams. Currently, more than 22,000 schools offer up to 37 Advanced
Placement courses ranging from Biology to Human Geography and more than 2.5 million
students take Advanced Placement tests each year (College Board, 2017). Usually, students
choose to enroll in Advanced Placement courses based on their high school’s availability. Some
schools may set a limit on how many Advanced Placement courses students can take in their
earlier years in high school. It is noteworthy that students are allowed to take the Advanced
Placement exam even if they did not enroll in the Advanced Placement course at school. Out of a
score from 1 to 5, a score of 3 or above constitute a passing score on the Advanced Placement

40
exam. Although passing an Advanced Placement test usually earn student some college credits at
their future university, the ultimate decision of whether to award credits for passing Advanced
Placement tests rest in the hand of the college/university. This is a huge incentive for taking
Advanced Placement courses in high school as it helps students save tuition cost in the long run.
Other factors that contribute to Advanced Placement classes’ popularity over the years include
generous government support (Many states provide subsidies on Advanced Placement test fee for
students from low-income families; Dounay, 2007), ample availability to train teachers to teach
Advanced Placement courses, and increased recommendations from educators (Hertberg-Davis
& Callahan, 2008).
International Baccalaureate. The International Baccalaureate (IB) Diploma Programme
(DP) was first introduced to the United States in the 1970s. Since then, there are 945 schools in
the United States that offer this program and 1661 universities that established policies for
admitting IB students (IBO, 2018b). The IBDP is usually offered to junior and senior high school
students, but many schools in the United States offer freshmen and sophomores opportunities to
take some courses that lead into the IBDP (Suldo, Shaunessy-Dedrick, & Hardesty, 2008). These
freshmen and sophomores are enrolled in the pre-IB program. Alternatively, students can enroll
in the Middle Years Program (MYP). The focus of IB program include cultivating students’
metacognitive thinking, cultural competence, and encouraging community services. In addition
to an end-of-course exam, students enrolled in IBDP are expected to complete an extended essay,
learn critical thinking skills, participate in extracurricular activities that harness creativity,
provide service to the community, and complete all required courses (IBO, 2018a). Similar to the
AP courses, students can use their IB Diploma to receive college credits if the college policies
allow.

41
Unique needs of students in accelerated curricula. As students in accelerated courses
tend to demonstrate high academic achievement and good classroom conduct, they are often
misunderstood as students who do not need additional support. Contrary to popular beliefs,
Suldo and Shaunessy-Dedrick (2013) found that this group of students experience unique
stressors compared to students in general education. In their study, the term “stress” refers to the
psychological perception of stress, which occurs when an individual believes that he or she does
not have enough resources to overcome a difficult circumstance or demand. A total of 480
students (9th to 12th grades) from four high schools in a southeastern state in the United States
answered a set of questions, including a demographic questionnaire and surveys that inquire
about personality, perceived stress, life satisfaction, psychopathological symptoms, social
support, and school climate. Students also self-reported cumulative weighted GPAs. Finally,
participants’ attendance, Office of Discipline Referrals (ODRs), and tardiness data were
collected. Analyses revealed that students in Advanced Placement/International Baccalaureate
courses reported higher perceived stress compared to students in general education. This may be
due to the combination of extreme demands from their academic program, pressure to prepare to
college, and experiencing the normative challenges as adolescences. Case in point, an earlier
study found that IB students perceived academic requirements as the biggest contributor to their
stress level (Suldo, Shaunessy-Dedrick, Thalji, Michalowski, & Shaffer, 2009). Moreover, Suldo
et al. (2009) found that higher level of stress among their participants is associated with negative
outcomes (i.e., more psychopathology symptoms as well as reduced academic functioning).
These findings pose a need to support this group of traditionally underserved population.
Unfortunately, as mentioned earlier in the chapter, there is a lack of studies that examine how
best to support high school students, especially those who are enrolled in accelerated curricula.

42
Existing supports designed for general students or those with disabilities may not be appropriate
for students in accelerated courses as they experience unique stressors and strengths (Suldo,
O’Brennan, Storey, Shaunessy-Dedrick, 2018). On the bright side, these findings have also led
researchers to investigate how best to support high school students who are taking Advanced
Placement classes or enrolled in the International Baccalaureate program.
Supporting students in accelerated curricula through the Multi-Tiered Systems of
Support framework. After realizing that students in accelerated curricula experience more
stress compared to general education students and that high stress level poses risk for worse
emotional and academic functioning, Suldo, Shaunessy-Dedrick, Ferron, and Dedrick (2018)
conducted a large-scale study to identify malleable factors that are associated with success
among Advanced Placement/International Baccalaureate students, with the hope of identifying
targets for intervention development tailored to this group of students. Consistent with the
comprehensive definition of student success described earlier in the chapter, Suldo, Shaunessy-
Dedrick, Ferron, and Dedrick (2018) considered a successful Advanced Placement/International
Baccalaureate student to thrive social-emotionally (i.e., high life satisfaction, low
psychopathology, and minimal school burnout) and academically (i.e., high GPA and Advanced
Placement/International Baccalaureate exam score). A total of 2,379 students in accelerated
curricula (9th to 12th grades) from 20 school programs participated in the study. After
investigating 34 potential predictors of success (e.g., stressors, coping styles, student
engagement, family features, school climate, and demographic factors), Suldo, Shaunessy-
Dedrick, Ferron, and Dedrick (2018) found that emotionally successful students in accelerated
curricula (a) utilize problem-focused coping skills, (b) possess high level of achievement
motivation, (c) are emotionally and cognitively engaged in school and (d) have parents who are

43
authoritative. On the other hand, they found worse social-emotional outcomes to be associated
with students who use avoidance coping strategies. These students also tend to experience higher
levels of home (e.g., parent-child conflict) and school-related (e.g., academic and social
struggles) stress. As for academic success, it appeared most explained by students’ academic
history (e.g., performance in 8th grade), but also predicted by family SES, students’ motivation to
achieve, cognitive engagement, and eustress. Risk factors associated with worse academic
outcomes include high level of parent-child conflict and use of avoidance coping strategies.
After Suldo, Shaunessy-Dedrick, Ferron, and Dedrick (2018) identified the predictors of
success (i.e., plausible factors to target in interventions) among students in accelerated curricula,
it became possible to develop research informed interventions appropriate for this group of
students. Fortunately, there are various malleable variables that can be incorporated. Specifically,
findings suggest the inclusion of (a) ways to cope with academic stressors (e.g., utilize problem-
focused coping styles and minimize avoidance coping strategies, (b) methods to increase student
engagement, and (c) tactics to promote authoritative parenting.
Although Suldo, Shaunessy-Dedrick, Ferron, and Dedrick’s (2018) study shed light on
promising targets for intervention development, the method to deliver the intervention remained
unanswered. In line with the MTSS model, that research group proposed that one way to support
the unique needs of students in accelerated curricula is through providing services that match
their need intensity. With funding from the Institute of Education Science (IES) in a grant
(R305A150543) awarded to Drs. Shannon Suldo and Elizabeth Shaunessy-Dedrick (University
of South Florida, College of Education), a universal curriculum is being developed to support all
students who are taking Advanced Placement classes or enrolled in the International
Baccalaureate program, as well as a targeted intervention is being developed to provide

44
additional support to students in accelerated curricula who are at-risk academically and/or
emotionally. Targets of both interventions stemmed from the findings of Suldo, Shaunessy-
Dedrick, Ferron, and Dedrick (2018) as described in the previous paragraph. In terms of intended
population, the research team decided to focus on 9th grade students enrolled in Advanced
Placement courses or a pre-IB program. As aforementioned, the transition between middle and
high school is a stressful period for students (pubertal changes, social stress, identity formation;
Cohen & Smerdon, 2009). Students enrolled in accelerated curricula experience another layer of
stress (i.e., higher academic demands) on top of the normal adolescent struggles that might lead
to worse emotional and academic outcomes (Suldo et al., 2009). Consistent with the MTSS
philosophy of early prevention, the universal and targeted intervention in development are
designed to be delivered to students in accelerated curricula during their first year of high school
but can likely be adapted to support this group of students throughout their high school career.
Universal support – Advancing Coping and Engagement (ACE). The Advancing
Coping and Engagement (ACE) for AP and IB student success program is a 12-week universal
curriculum under development to support all students in accelerated curricula to be academically
and emotionally successful (Suldo, O'Brennan, Storey, & Shaunessy-Dedrick, 2018; Suldo et al.,
2019). The definition of success remained the same as the one described in Suldo, Shaunessy-
Dedrick, Ferron, and Dedrick’s (2018) study. A successful student in accelerated curricula
demonstrates emotional (i.e., satisfied with life, minimal sign of psychopathology, and not
overwhelm by schoolwork) and academic (i.e., high GPA and Advanced Placement/International
Baccalaureate test score) competence.
The universal program has three main goals. Through psychoeducation, role-play,
testimony from previous students in accelerated curricula, practice exercises, and other active

45
instructional strategies, ACE aims to teach 9th grade students in accelerated curricula how to (a)
be more engaged with teachers, program, and school (i.e., increase connectedness with others at
school and participation in extracurricular activities), (b) use problem-focused coping strategies,
and (c) minimize usage of avoidance coping strategies. Problem-focused coping strategies (e.g.,
time and task management, seeking support, relaxation, and positive thinking) are deemed
effective based on Suldo et al.’s (2018) study described above. Similarly, avoidance coping
strategies (e.g., withdraw and rely on self, skipping school, using illicit substances) are deemed
ineffective based on the same large-scale study (Suldo et al., 2018). The ACE program also
includes a teacher and parent component. Teacher trainings have been provided both in-person
and online to prepare teachers to participate in the facilitation of the student-focused modules.
The program also offers two in-person workshops (one on program rationale, the other on
authoritative parenting) for parents. In addition, parents receive weekly flyers that describe the
ACE module content and tips on continuing the education at home.
The ACE student program contains 12 modules (2 on introduction and research, 3 on
student engagement, 5 on coping, 1 on eustress, and 1 on strengths, values, and goals). The first
10 modules are the core of the program, whereas the last two (i.e., eustress and strengths, values
and goals) are designed to provide booster/follow-up sessions. More details on the ACE program
can be found in Suldo, Parker, Shaunessy-Dedrick, and O’Brennan (2019) chapter in Handbook
of Student Engagement Interventions: Working with Disengaged Youth, which include
description and sample learning experiences from the ACE engagement modules.
The modules were developed during Year 1 (2015-16) of the 4-year grant (2015-19), with
iterative feedback from students in accelerated curricula, teachers, administrators, parents, and
content experts. In Years 2 and 3 of the grant, the research team delivered the first 10 modules in

46
the Fall, once per week for approximately 50 minutes per module. The booster modules were
delivered early in the Spring (depending on school availability), each again lasting
approximately 50 minutes. Year 2 (2016-17) of the grant involved 15 classes from 2 high schools
in 1 district (implementation trial); whereas Year 3 (2017-18) included 16 classes from 8 high
schools in 3 districts (outcomes compared to 7 high schools initially assigned to a waitlist control
group, which was provided the refined intervention materials in Year 4 [2018-19]).
Screening. The President’s New Freedom Commission on Mental Health (Hogan, 2003)
proposed that any comprehensive school-based mental health services should include screening
practices to identify students showing risk factors and provide early intervention. After the
delivery of the universal ACE program, the research team created a midyear check-in procedure
to screen for students with signs of risk for diminished academic or emotional success (Suldo,
Storey, O’Brennan, et al. 2019). In addition to asking students to report unweighted GPA and
midyear Advanced Placement/International Baccalaureate course grade, two self-report
questionnaires were included in the one-page screener. The Perceived Stress Scale (PSS; Cohen,
Kamarck, & Mermelstein, 1983) assesses students’ level of perceived stress. The School
Satisfaction scale of the Multidimensional Life Satisfaction Scale (MSLSS; Huebner, 1994) asks
students to rate on a 6-point scale (1 = Strongly disagree to 6 = Strongly agree) on how they
have felt about school over the past several weeks. In addition, the students’ academic records
(i.e., unweighted GPA and Advanced Placement/International Baccalaureate course grades) are
examined with assistance from school administrators to ascertain information from report cards.
The screening process that follows the universal intervention (ACE) is intended to
identify students in accelerated curricula who are at-risk for diminished emotional or academic
success at midyear of 9th grade. The screening process adopts a multi-method (self-report

47
questionnaire, school records) approach to identify students who are at-risk emotionally and/or
academically. Specifics on the screening procedure proposed to be used in the current study are
described in Chapter III. The next section of this chapter describes the targeted support
developed for students who demonstrate risk through any of the methods, specifically a one-on-
one coaching session referred to as Motivation, Assessment, and Planning (MAP) meetings.
Targeted support – Motivation, Assessment, and Planning (MAP). Motivation,
Assessment, and Planning (MAP) is an individualized, selective intervention in development that
aims to provide additional support to students in accelerated curricula who demonstrate risk
factors for diminished academic and emotional success during the middle of their 9th grade year
(O’Brennan et al., 2019; Suldo, Parker, Shaunessy-Dedrick, & O’Brennan, 2019). Grounded in
Motivational Interviewing (MI), the MAP coach helps at-risks students (identified through the
screening described above) to (a) reflect on current levels of coping and engagement, (b) choose
to work on a coping or engagement skill that is related to success in accelerated curricula, and (c)
create an action plan to reach self-determined goal. The emphasis on improving coping and
engagement skills links to the universal ACE program. The goal of MAP is to encourage
students to further build on the coping and engagement skills taught to them in the ACE program
as those factors have been found to correlate with success among students in accelerated
curricula. Table 3 summarizes the coping and engagement skills taught through the ACE
program. Students are encouraged to increase use of effective coping styles, limit use of
ineffective coping styles, and improve use of engagement skills. In addition to coping and
engagement, students can also choose to tackle other factors related to success among students in
accelerated curricula, namely eustress and perceived parenting practices (authoritative
parenting).

48
Table 3
Coping and Engagement Skills Addressed in the ACE Program
Effective Coping Styles
(i.e., problem-focused coping
skills; associated with both
academic and emotional
success)
Ineffective Coping Styles
(i.e., avoidance coping skills;
associated with worse
academic and emotional
outcomes)
Engagement Skills
(i.e., emotional or
behavioral engagement)
• Time and Task
Management
• Positive Thinking
• Relaxation
• Seek Academic Support
• Turn to Family
• Turn to Spirituality
• Withdraw/Self-Reliance
• Skip School
• Take Short Cuts at
School
• Reduce Effort on
Schoolwork
• Use illicit Substances
• Sleep to avoid stress
Emotional Engagement:
• Build Relationship
with Others at School
• Increase School Pride
Behavioral Engagement:
• Participate in
Extracurricular
Activities
Assessment of current student functioning. In order to help students reflect on their
current use of coping and engagement strategies, the MAP coach administers a packet of surveys
(i.e., selective stage assessment) to students before the first MAP meeting. The survey packet
includes a list of questionnaires that tap into a student’s current level of functioning. After a
student fills out the packet, the MAP coach enters the student’s responses into a computerized
scoring system using Microsoft Excel. The Excel program generates scores that reflect students’
current use of coping strategies, level of student engagement, eustress, and perceived parenting
practices. A student’s raw scores are converted to T-scores, in line with comparison to a
normative sample of more than 2,000 Advanced Placement/International Baccalaureate students
across the state of Florida obtained from a previous study (Suldo, Shaunessy-Dedrick, Ferron, &
Dedrick, 2018). Converted scores are represented on a graph, which the MAP coach introduces
in MAP Meeting One. A sample graph is included as Appendix A.
MAP Meeting 1. The MAP intervention adopts the MI spirit, processes, and core skills as
described in the earlier section (Miller & Rollnick, 2012). The protocol consists of four sections,

49
which align with the four processes of MI (engaging, focusing, evoking, and planning). In the
stage of engage, the coach gets to know the student better through discussing their strengths,
values, and long-term goals. Then, the coach links those personal attributes to the ACE targets –
coping and engagement. In the focus stage, the coach provides feedback on the student’s current
level of coping, engagement, eustress, and perceived parenting practices. After some reflections,
the coach guides student to choose a target to work on. During evoke, the coach uses MI
strategies to elicit students’ motivation and reasons for change. Finally, the coach collaborates
with students to create an action plan to fulfill their goal during planning. Throughout the
meeting, the coach utilizes the core skills of MI (Open questions, Affirmation, Reflection, and
Summarize [OARS]; Miller & Rollnick, 2012) to create a safe, collaborative atmosphere.
Moreover, a handout—the Student Success Planning Guide— is used to lead a student through
the intervention. The end of the guide includes an action planning form to be completed by the
student and coach during the planning stage. The student and coach each keep a copy of the plan
after the session. Table 4, adopted from the MAP intervention protocol, provides more
description of the activities involved in MAP meeting 1, including an approximate timeline. For
more information on the MAP meeting 1, Suldo et al. (2019) included a case study that illustrates
the intervention.
Reminder letter. After the first MAP meeting, the coach sends a 1-page letter to students
to communicate care and to encourage students to enact their action plan if they have yet to do
so. In the letter, the coach expresses his or her excitement to meet again, includes a copy of the
student’s action plan, and lists some additional questions for students to ponder before the next
meeting. Along with the typed letter, the coach can send a handwritten note or card for a
personal touch. A sample reminder letter is included as Appendix B.

50
Table 4
Summary of MAP meeting 1
MI
Processes
Activities, Strategies, and Objectives
Approximate
Length
Engage • Introduction to coach and meeting purpose.
• Review values, strengths, hopes, and goals for the future.
• Summarize how student’s background fits with ACE targets
10-15
minutes
Focus • Elicit student knowledge of areas related to academic and
emotional success.
• Orient student to norm-referenced feedback graph and
review individualized graph with student.
• Develop discrepancy between student’s weaknesses and
comparison groups and/or personal goals.
• Agenda map and prioritize area(s) of change
20-25
minutes
Evoke • Pose evocative questions that elicit change talk
• Reinforce any change talk with OARS.
5 minutes
Plan • Collaboratively brainstorm strategies for meeting goals using
Problem-Solving Process in Action form.
• Create an action plan that specifies action steps, supports
needed, and a timeline.
• Increase hope and confidence in making change.
15 minutes
MAP meeting 2. Similar to MAP meeting 1, the second meeting includes the four
processes of MI (engage, focus, evoke, plan). A unique component of meeting 2 is that the coach
reviews students’ progress towards the goal set in previous meeting. Using the progress towards
goal form (attached as Appendix C), the student reports if he or she had done none, some, or
completed each step listed on the action plan. Whether or not the student made progress, the
coach reflects students’ reports in a non-judgmental way. During focus, the student can choose to
retain the same target or select a new target to work on. The processes of evoke and planning
remains almost the same as MAP meeting 1, except the coach terminates the relationship at the
end of MAP meeting 2, arranging additional support (e.g., continued school-based counseling)
for students if necessary. In terms of student materials, the second meeting also includes a

51
Student Success Planning Guide that is slightly different from the one for meeting 1.
Specifically, the agenda listed at the front of the guide is different as the second meeting also
includes a section in which the coach reviews progress towards goal with students based on the
action plan they developed in their first meeting. Table 5, adopted from the protocol, includes
more details on the activities involved in MAP meeting 2.
Table 5
Summary of MAP Meeting 2
MI
Processes Activities, Strategies, and Objectives
Approximate
Length
Engage • Re-introduction to coach and meeting purpose
• Revisit and reaffirm the student’s previously expressed
strengths, values, hopes, and aspirations for the future
• Elicit student memory about goal developed during MAP
Meeting 1
• Discuss current progress towards target/goal
• Summarize understanding of student’s current progress
toward goals
10-15
minutes
Focus • Help student decide to retain target or select new target
• Revisit student’s individualized graph (score report) if
applicable
8-10 minutes
Evoke • Elicit and reinforce change talk
• Following a sufficient amount of change talk, ask a key
question
• Move to planning with a transition question
5-7 minutes
Plan • Elicit and reinforce change talk regarding new/revised plan
• Help the student brainstorm strategies for meeting goal
• Create an action plan that specifies action steps, supports
needed, and a timeline
• Increase hope and confidence in change
• Terminate relationship; plan for further supports if applicable
15
minutes
Rationale for a MI-based intervention. Several factors led the research team to select MI
when developing a targeted intervention for students who are enrolled in accelerated curricula.
As aforementioned, MI has been shown to be effective in helping adolescents shape healthy

52
behaviors in clinical settings (Lundahl & Burke, 2009). Moreover, Snape and Atkinson’s (2016)
meta-analysis on school-based student-focused MI interventions revealed that this approach
showed promising results in helping students (a) advance academically (e.g., improve grades),
(b) be more emotionally engaged (e.g., better attitude towards school), and (c) be more
behaviorally engaged (e.g., higher attendance, homework completion, and classroom
participation). These targets (i.e., academic success and student engagement) align with the
universal ACE program’s intervention focus and ultimate goal. Furthermore, the time-efficient
nature of MI-based interventions (i.e., the potential to achieve positive results with just one or
two sessions) makes it an excellent fit for a targeted intervention in schools, where time is
always scarce. Although the effectiveness of MI has yet to be tested with students in accelerated
curricula, this population seems to be good candidates because this group of students tends to
demonstrate higher cognitive skills, as evidenced by their superior academic performance
compared to general education students (Suldo et al., 2013), which may help them better handle
the cognitive demands of the MI process. Moreover, this group of students are also adolescents
who crave autonomy, which aligns well with the collaborative nature of the MI approach.
Evidence of promise of MAP. Theoretically, MI is an appropriate approach to provide
targeted support to students who are in Advanced Placement classes or pre-International
Baccalaureate program to succeed emotionally and academically. Thus, the research team
developed the MAP intervention based on MI principles. To test its feasibility, acceptability, and
fidelity in actual practice, Year 2 of the grant entailed an implementation trial; 49 students from
2 high schools in 1 district participated in MAP. Among the 49 participants, 40 were identified at
at-risk through a screening process; the other 9 volunteered. To be identified as at-risk, the
student either shown academic (GPA < 3.0, Advanced Placement/International Baccalaureate

53
course grade ≤ C) or emotional risks (elevated stress [Perceived Stress Scale score > 3.6; Cohen
et al., 1983], negative feelings about schooling experiences [School Satisfaction scale < 3.4;
Huebner, 1994]) through self-report questionnaires, or was nominated by their teacher.
Regarding feasibility, research team records indicate that MAP Meeting One lasted on average
58.33 minutes (SD = 9.33 minutes) and MAP Meeting Two took an average of 40.79 minutes
(SD = 11.02 minutes). Coaches completed the meeting with high fidelity to protocol: average
fidelity for meeting 1 = 96%, SD = 3%; meeting 2 = 95%; SD = 5%. Approximately 85.7% of
students returned for MAP meeting 2. Brief measures of intervention acceptability were
completed by youth after each MAP meeting. Table 6 illustrates that participants find the MAP
intervention highly acceptable, with means that range from 3.8 to 4.8 on a scale range from 1 to
5 (1 = strongly disagree to 5 = strongly disagree; Suldo, Shaunessy-Dedrick, O’Brennan, Parker
et al., 2018). Students generally liked the intervention materials, liked the action planning
process, felt connected to the coach, and will recommend the meeting to a friend. Table 6 also
shows that students felt ready to change after MAP meeting 1 and strongly agree that they have
made progress towards self-determined goal after MAP meeting 2.
The support for feasibility, acceptability, and fidelity summarized above indicated to the
research team that MAP was ready for inclusion in Year 3 grant activities. Analysis of data from
the 121 students and 7 coaches who participated in Year 3 MAP meetings during spring 2018 is
in progress. From Spring to Fall 2018, the research team solicited feedback on perceived utility
of MAP from school mental health providers (n = 12) who worked for the schools and districts

54
Table 6
Student Acceptability and Preliminary Outcomes from Year 2 Implementation Trial
MAP Meeting 1 MAP Meeting 2
Intervention materials
(Meeting 1: selective stage assessment
packet, graph, student success planning
guide; Meeting 2: reminder letter)
4.4 3.8
Action planning process
4.5 4.5
Alliance with MAP coach
4.3 4.3
Recommend to friend
4.4 N/A
Readiness for change
4.5 N/A
In weeks after meeting: Made Progress
towards goal
4.8 (reported in
MAP meeting 2)
N/A
Note. Scale from 1 = strongly disagree to 5 = strongly disagree, N/A = Not Applicable
that participated in Year 3 grant activities. Demographic information of these participants is
summarized in Table 7. Participants worked in three districts located in Florida. District A was
an urban school district serving approximately 200,000 students including through 27 high
schools in the 2017-2018 school year; District B was a largely rural school district serving
approximately 70,000 students through 14 high schools in the 2017-2018 school year; District C
was an urban school district serving approximately 100,000 students through 18 high schools in
the 2017-2018 school year. The research procedures completed by the participants included:
review MAP Meeting One protocol; listen to de-identified audio file of MAP Meeting One
enacted with an student in accelerated curricula at a different school; meet with a researcher to
provide feedback to the usefulness of the meeting protocol, materials, and stages; and repeat
process for MAP Meeting Two, from protocol review to feedback (including review of audio file
from 2nd meeting with same student participant featured in Meeting One).

55
Preliminary analysis of this qualitative data conducted by the research team (including
this author and other graduate students as well as three faculty) suggested that all (N = 12)
participants perceive the action planning stage as an important part of the MAP intervention. For
example, participant 05 said, “[The action plan] is a huge component of the intervention because
you can talk in circles but not do anything about it unless you engage in this type of behavior
[action planning] and document it.” Some participants even shared that they believe the first
three stages (engage, focus, and evoke) can be streamlined to focus more on action planning, as
indicated by participants 06 when she said, “I would actually like to see the action plan to be
more of a focus. I would like to see the other sections be shortened so that more time could be
spent on the practical portion – the action plan… I like it [action planning] so much that I want
more.” Participants further explained that action planning is essential because it provides
students a clear plan to reach self-determined goals, and it acts as an accountability system,
where the coach can check-in on the student’s progress towards goal. For instance, participant 11
said, “I think that it [action planning] is very useful because otherwise he [student] would have
just walked away and this would’ve been a good conversation, but he wouldn’t have done
anything about it. You [coach] in a gentle way forced him to think about what he will do and
made him accountable for those things.” Participant 07 further illustrates the theme, “Students
can report anything back to you, like yes, I’ve been doing this… but instead of just taking the
student’s word for it, I feel like it would be more valuable to have another person to support
[students], whether things are working out or not.” As school mental health providers often have
a large case load or other school responsibilities, it is understandable that they are looking for
ways to save time on intervention. Moreover, as the field of education continues to put pressure

56
on school professionals to demonstrate accountability, it is logical to see why the action planning
stage appeals to the mental health providers perhaps more than the other three stages of MI.
Table 7
Participants from School Mental Health Providers’ Perceived Utility of MAP Meetings Study
Code Role in School District Gender Ethnicity
01 SP C Female White
02 SC C Female African American
03 SP B Female White
04 SC A Female White
05 SP A Male White
06 SP B Female African American
07 SC B Female African American
08 SC B Male White
09 SP A Female White
10 SC A Female White
11 SP C Male White
12 SP B Female White
Note. SP = School Psychologist, SC = School Counselor.
Action planning (AP) has been shown to be help adults increase healthy behaviors. It is
possible but unknown if it can achieve the same goals of the MAP intervention, when delivered
in isolation without the other three stages. To the best of this author’s knowledge, there are no
studies that looked at the effects of action planning alone in a school setting, but it has
demonstrated promising results as part of other interventions such as Cognitive Behavior and
Behavior Therapy (Kendall, 2011; Kratochwill, & Stoiber, 2000; Langberg et al., 2012). In
contrast, there are promising evidence for school-based student-focused MI interventions (Snape
& Atkinson, 2016). This poses a dilemma because action planning alone cannot be considered a
MI intervention. According to Miller and Rollnick (2012), an intervention cannot be considered
MI-based if the first three processes are absent. Returning to the staircase model used to explain
the four processes of MI (figure 1), engage, focus, and evoke are all pre-requisites to action
planning. The three stages also form the foundation of MI, which Miller and Rollnick (2012)

57
recommend revisiting as necessary. In summary, school mental health providers perceive that
action planning is the most important part of the MAP intervention and recommend streamlining
the intervention accordingly. However, MI experts argue that the other three stages of MI are
essential to make MAP a MI-based intervention (Miller & Rollnick, 2012), which has more
evidence for efficacy in the school setting compared to action planning alone. These competing
views are at the crux of the gap in the current literature that was addressed by this study, as this
literature review indicated a need to compare the efficacy of MAP with an AP intervention.
Conclusion and Gaps in Current Literature
Multi-tiered Systems of Support (MTSS) for student success entail universal and targeted
supports for all students K-12. A review of the literature revealed that evidence-based social-
emotional supports tend to be focused on younger students, with limited options for social-
emotional services in high schools. This is concerning as researchers have found that students
tend to experience increasing academic and social-emotional challenges during their transition
from middle to high school (i.e., 9th grade), which put them at-risk for worse outcomes such as
diminished academic achievement and engagement (Benner & Wang, 2014; Eccles & Roeser,
2011). This signifies a need for more research on social-emotional interventions developed for
older students. Specifically, there is a group of high school students that is traditionally
underserved –youth enrolled in accelerated courses such as Advanced Placement classes or
International Baccalaureate program. These students are usually performing well enough to stay
enrolled in their accelerated classes but may suffer from the additional stress originating from
rigorous coursework and high expectations (Suldo et al., 2013; Suldo, O'Brennan, Storey, &
Shaunessy-Dedrick, 2018). As most of the current interventions are designed for general

58
education student or student with disabilities, there is a gap in the current literature to develop
interventions that meet the unique needs among students in accelerated curricula.
Based on a large-scale study that examined factors that predict success among students in
accelerated curricula (Suldo, Shaunessy-Dedrick, Ferron, & Dedrick, 2018), Drs. Shannon Suldo
and Shaunessy-Dedrick (University of South Florida, College of Education) set on a path to
develop a multi-tiered support for this group of underserved students with funding from IES
(grant R305A150543). The support in development includes a universal component (Advancing
Coping and Engagement; ACE), screening, and a targeted support (Motivation, Assessment, and
Planning; MAP). They adopted the Motivational Interviewing (MI) approach for the targeted
support – MAP, as it has shown promising results in school-based application (Snape &
Atkinson, 2016). Specifically, school-based student-focused MI interventions have been shown
to be effective in improving students’ academic achievement and engagement in school, which
aligns with the targets of ACE and MAP. Although preliminary examinations of MAP have
provided support for feasibility, fidelity, and acceptability, further studies are needed to examine
its efficacy. Qualitative feedback from school mental health providers revealed that they view
action planning as an essential component of the MAP intervention. Some even recommend
streamlining the other three stages (engaging, focusing, evoking) to make more time for action
planning. Although action planning has shown to be effective in increasing healthy behaviors
among adults, to the best of the author’s knowledge, its school-based application is untested with
action-planning occurs in isolation, that is outside a larger cognitive-behavioral (Kendall, 2011)
or behavioral intervention such as HOPS (Langberg et al. 2012). In contrast, MI has shown great
promises when applied to school settings (Snape & Atkinson, 2016). The current study thus

59
aimed to fill in this gap of the literature through examining the efficacy of MAP compared to an
AP intervention.

60
Chapter III: Method
This study examined the efficacy of a targeted intervention in development to support
academically or emotionally at-risk 9th grade student in accelerated curricula – Motivation,
Assessment, and Planning (MAP). Specifically, this study compared the efficacy of MAP to
Action Planning (AP) intervention. This study is part of a larger 4-year study funded by IES
(grant R305A100911) awarded to Drs. Shannon Suldo and Elizabeth Shaunessy-Dedrick,
professors in the USF College of Education. The grant’s aim is to develop a comprehensive
intervention to support emotional and academic success among students enrolled in accelerated
curricula. Currently under development is a (a) universal program (Advancing Coping and
Engagement, ACE), (b) screening procedure, and (c) targeted intervention (MAP). This study
aims to advance the efficacy investigation on the last component of the comprehensive
intervention – MAP. Thus, the research procedure includes implementation of the first two
components (ACE and screening), but it is not the aim of this study to examine their efficacy or
appropriateness. This chapter describes the current study’s design, procedures, intervention
overview, outcome measures, and proposed analyses. It ends with a discussion of ethical
considerations.
Research Design
The current study is a mixed methods study. The majority part of the study adopts an
experimental, randomized, within-subject design in which each participant serve as their own
control. To further explain the design, participants were randomly assigned to either receive a
MAP or AP intervention during their first meeting. Then, participants received the other

61
condition (the one they had yet to receive) during their second meeting. This way, all participants
were exposed to both conditions in this study (i.e., MAP vs. AP). The advantage of using a
within subject design is that it requires fewer participants and it helps reduce errors associated
with individual differences. However, there might be carryover (e.g., student feel more
connected to the MAP coach during the second meeting no matter which condition he or she was
in previous meeting) or practice (e.g., students get better at action planning after one exposure)
effect. A smaller part of this study is qualitative in nature, involving open-ended questions
included in the acceptability survey and a brief exit interview. This study adopted a constant-
comparative method to analyze the qualitative responses from participants.
Participants
Thirty students in Advanced Placement Human Geography class from one high school
located in a large, urban district in a Southeastern state were invited to participate in the current
study. The district has 18 high schools that served 103,242 students in the 2017-18 school year.
This high school was assigned to the control condition in Year 3 (2017-18) of the larger IES-
funded project and had requested the research team implement the universal curriculum (ACE),
screening, and targeted intervention (MAP) with the target population (freshmen in Advanced
Placement Human Geography) in Year 4 (2018-19). During the 2018-19 school year, 71 students
were enrolled in 3 sections of Human Geography. All of these students received the ACE
program and participated in the midyear screening, as part of the school’s commitment to
supporting freshmen in accelerated courses. A parent notification letter with an option to opt out
of screening was sent home with all students in Advanced Placement Human Geography. One
student’s parents opted out of screening, and that student was deemed not eligible to participate
in this study, due to lack of screening data.

62
Out of the 70 students who participated in the universal intervention (Fall 2018) and
completed screening (January 2019), 30 students (43%) were identified as emotionally or
academically at-risk in the screening using cut scores developed from risk observed in prior
samples of AP/IB students (see Suldo, Storey, et al., 2019). Specifically, cut points for academic
risk are state GPA < 3 and/or Human Geography semester one course grade of “C” or below; cut
points for emotional risk are School Satisfaction Scale mean < 3.4 and/or Perceived Stress Scale
mean > 3.6. More information on the measures used for screening are documented later in this
chapter. Within the group of at-risk students, 5 had academic risk only, 15 had emotional risk
only, and 10 met thresholds for risk in both domains.
All 30 students who were at-risk were invited to participate in the study. A total of 3
students declined participation by refusing to bring consent forms home to parents. No parent
denied consent. After 20 participants returned consent forms, recruitment and study enrollment
stopped due to logistical concerns (i.e., the sole interventionist was likely unable to serve more
than 20 participants in the study timeline, February to April 2019). Only students with written
consent and assent (Appendices L and M) participated in the study. The remaining 7 out of 10
students identified as at-risk were offered MAP meetings by other interventionists supported by
the larger grant (3 students declined services).
Among the twenty participants, four had academic risk only, eight had emotional risk
only, and eight met thresholds for risk in both domains. Half of the participants within the group
(type of risk) were randomly assigned to the first condition (MAP AP), and then the other half
assigned to the second condition (AP MAP). The twenty participants included seven males
and thirteen females; two Asian, one Latina, and seventeen White students. Participants’ GPA in
Fall 2018 ranged from 1.80 to 4.00; Human Geography grade in Fall 2018 ranged from F to A;

63
satisfaction with school range from 2.50 to 4.75 (scale 1 to 6); and perceived stress range from
1.50 to 4.67 (scale 1 to 5). Table 8 provides more details on participants’ demographic features
and screening scores.
Table 8
Participants Demographics and Screening Details
Code
Number Group Gender
State
GPA
Advanced
Placement
Human
Geography
Grade
School
Satisfaction
Scale Mean
Perceived
Stress
Scale Mean
Type
of
Risk
1 2 M 3.00 2 4.00 1.83 0
2 2 M 3.35 2 4.75 2.67 0
3 1 F 1.80 0 4.38 3.17 0
4 1 F 3.42 2 4.13 2.33 0
5 1 M 4.00 4 3.88 3.67 1
6 2 F 3.54 3 3.63 5.00 1
7 2 M 3.92 4 3.50 5.00 1
8 2 F 4.00 4 2.63 4.67 1
9 2 F 4.00 4 3.38 3.33 1
10 1 F 3.58 3 4.25 4.33 1
11 1 F 3.60 3 3.13 3.33 1
12 1 F 3.91 4 3.13 3.33 1
13 1 M 2.75 2 3.38 1.50 2
14 1 F 3.28 2 3.00 4.33 2
15 1 M 2.00 1 2.50 4.17 2
16 2 F 3.27 2 3.75 4.83 2
17 2 F 3.46 2 3.88 4.33 2
18 1 M 2.83 1 3.25 2.50 2
19 2 F 3.54 2 4.50 4.50 2
20 2 F 3.16 3 3.50 4.00 2
Note. For group, 1 = MAP AP; 2 = AP MAP. School Satisfaction Scale came from the
Multidimensional Students Life Satisfaction Scale. Cut points for academic risk are GPA < 3
and/or Grade C or below; cut points for emotional risk are School Satisfaction mean < 3.4 and/or
Perceived Stress mean > 3.6. For grade in Human Geography, 4 = A, 3 = B, 2 = C, 1 = D, 0 = F.
For type of risk, 0 = Academic Only, 1 = Emotional Only, 2 = Both. Grade and GPA were from
Fall 2018.

64
Procedures
As aforementioned, this study is embedded within a comprehensive intervention designed
to support the success of students in accelerated curricula. This section details the procedures
throughout the comprehensive intervention, but the focus of this study was on the last component
– selective intervention implementation.
Universal intervention implementation. All students at the high school taking
Advanced Placement Human Geography participated in the 12-week universal intervention
(ACE) during their Advanced Placement Human Geography class in Fall 2018 (10 core modules
delivered once a week, approximately 50 minutes per module/week) and Spring 2019 (2 booster
modules delivered over two weeks, approximately 50 minutes per module/week). This author
facilitated delivery of the module with support from the classroom teacher. This author is a
graduate research assistant (M.A. level trainee) and part of the research team for the larger grant.
This author is one of many graduate students who assists on the project. She received extensive
training (self-study and mock deliveries) to deliver the ACE program and had implemented the
modules in an intervention high school in Year 3 (2017-18). The classroom teacher was present
for the majority of the modules to aid in behavior management and co-facilitated some of the
content. Table 9 demonstrates the modules included in the ACE curriculum. Additional
information on the ACE program can be found in Chapter II.
Recruitment of participants for selective intervention. In Spring 2019, a multi-method
screening was conducted to identify participants for the selective intervention (i.e., two one-on-
one coaching sessions). The goal of the screening process was to identify students in accelerated
curricula who have early signs of emotional or academic challenges and provide early

65
Table 9
Modules in Advancing Coping and Engagement (ACE)
Module Content/Topic
1 Adjusting to Advanced Placement/International Baccalaureate: Role of Stress
2 Factors Related to Advanced Placement/International Baccalaureate Success
3 Engagement: Forming School Pride
4 Engagement: Forming Strong Connections to Advanced
Placement/International Baccalaureate Teachers
5 Engagement: Extracurricular Activities at School and Community
6 Coping Time and Task Management 1
7 Coping: Time and Task Management 2
8 Coping: Relaxation and Positive Thinking
9 Coping: Seeking Support from School and Beyond
10 Coping: Minimizing Use of Ineffective Strategies
11 Promoting Eustress & Review of Coping and Engagement Tools
12 Strengths, Values, and Goals
intervention. Targets of the screening process were factors most salient to success among
students in accelerated curricula, namely perceived stress, connectedness to school, and
academic performance. Parents of all the students who participated in the universal intervention
in the Fall received a “notification of screening” letter to inform parents of the upcoming
screening. The letter explained that students would complete a short survey on perceived stress,
satisfaction with school, and academic performance, and that data generated from the survey
would be used to determine which students will be offered additional support. One parent
returned the notification form wishing to exclude their child from the process, and the student
was not included in this study. The remaining 70 students filled out a one-page survey on
January 17th, 2019. This researcher administered the screening survey to the entire class, during
5-10 minutes of class time. Five students were absent on screening, thus completed the screening
individually in the same week. This author also collaborated with a school administrator and the
classroom teacher to collect students’ academic data (i.e., unweighted semester GPA and

66
Advanced Placement Human Geography semester grade). More information on the measures and
methods are described below.
Perceived Stress Scale. The Perceived Stress Scale (PSS; Cohen, Kamarck, &
Mermelstein, 1983) originally contains 14 items on perceived stress and coping over the previous
month. Only 6 items (those on perceived stress) were administered in the current study because
the larger research project utilized a different measure to capture student’s use of coping
strategies. Moreover, Lavoie and Douglas (2012) has found the retained items to appropriately
capture overall feelings of distress caused by overwhelmed life circumstances. The scale has a
five-point response scale: 1 = Never, 2 = Almost Never, 3 = Sometimes, 4 = Fairly Often, and 5 =
Very Often. A sample item from the PSS includes, “In the last month, how often have you found
that you could not cope with all the things that you had to do?” This scale has demonstrated
strong internal reliability in Suldo, Shaunessy, and Hardesty’s (2008) study with students in
accelerated curricula described in Chapter II (α = .91). In terms of construct validity, the PSS
yielded large associations with another self-report survey on perceived stress (Student Rating of
Environmental Stressors Scale; StRESS) among students in accelerated curricula (Suldo,
Dedrick, Shaunessy-Dedrick, Roth, & Ferron, 2015). In the current study (N = 70), the PSS also
yielded high internal reliability (α = .89). To interpret the scores, higher scores indicate higher
level of perceived stress in the past month.
School Satisfaction subscale of the Multidimensional Students Life Satisfaction Scale.
The school satisfaction (SS) scale is part of a larger self-report measure named Multidimensional
Student Life Satisfaction Scale (MSLSS; Huebner, 1994). The MSLSS measures students’ life
satisfaction across domains using a 6-point scale (1 = Strongly Disagree, 2 = Disagree, 3 =
Mildly Disagree, 4 = Mildly Agree, 5 = Agree, and 6 = Strongly Agree). The domains include 7

67
items on family, 9 items on friends, 9 items on living environment, 7 items on self, and 8 items
on school. This study administered the 8-item school satisfaction scale. A sample item is, “There
are many things about school I don't like” [reverse scored]. This scale has yielded excellent
internal consistency when used with high school students (α = .84; Zullig, Huebner, & Patton,
2011). In prior research, test-retest reliability for the SS scale was high across four weeks (.70;
Huebner, Laughlin, Ash & Gilman, 1998) and one year (.60; Elmore & Huebner, 2010). In this
study (N =70), the SS scale yielded high internal reliability (α = .80). In terms of interpretation,
after reverse-scoring negatively phrased items, higher scores on this survey indicate higher
satisfaction with school.
School records. The author examined participants’ (a) unweighted GPA and (b)
Advanced Placement Human Geography course grade over the Fall 2018 semester.
All data reported by students on the screening survey and provided by school
administrators (course grades and semester GPA) were entered into an Excel spreadsheet. Then,
the author checked 100% of data were for accuracy by reading aloud each data line on the
original format and checking to see if it matches the data entered in the Excel spreadsheet. The
cut points for identifying students at-risk were pre-determined based on previous implementation
trials (Suldo, Storey, et al., 2019). All students (N = 30) who had (a) Fall semester GPA lower
than 3.0, (b) AP Human Geography Fall grade C or below, (c) PSS score above 3.6, or (d) SS
score lower than 3.4 were offered the opportunity to participate in MAP as part of sanctioned
school supports for students in accelerated curricula. The thirty students who met those criteria
were also invited to take part in the current study to evaluate critical phases within the MAP
protocol. Whereas parent consent was not required to access the routine school support, it was
required to take part in the research aspect associated with this dissertation. To recruit students

68
for this study, this author administered parent consent and student assent forms for students to
participate in research. Only students with parent consent and student assent (Appendices L and
M) participated in this study. Incentives offered to students who participated in this study
included a $10 gift card for each meeting the student attended, totaling up to $20 gift card per
participant.
Selective intervention implementation. This study used a stratified random assignment
process to assign half of the sample (students with parent consent to participate in research) to
condition A (MAP Meeting 1 AP Meeting 2), and the other half to condition B (AP Meeting
MAP Meeting 2). Once twenty participants were recruited, participants were stratified based
on type of risk (i.e., academic only, emotional only, and both). Four participants had academic
only risk, eight had emotional only risk, and eight had both risks. The author had to make a slight
adjustment to the GPA cut score (from <3 to <3.2) to ensure that each stratum (risk type group)
had an even number of participants. Within each of the three strata (risk type group), SAS 9.4
statistical software (SAS Institute, 2013) was used to assign each participant a random number.
Half of the participants with the lowest random numbers in each stratum were assigned to the
first condition (MAP AP), the other half was assigned to the second condition (AP MAP).
Selective stage assessment. A few days prior to their first meeting (MAP or AP Meeting
1), all participants completed the selective stage assessment. This survey packet includes items
on demographic features (e.g., age, gender, school), current stressors, use of coping strategies,
level of student engagement, perceived parenting practices, and eustress. It also includes a
values discovery activity, in which students choose up to 3 values (e.g., family, friends, leisure
time) that resonate with them. Students also get to pick up to 3 character strengths through a list

69
of VIA character strengths. Table 10 lists all the questionnaires included in the packet along with
some details.
After students filled out the selective stage assessment packet, this researcher entered
student responses into a pre-developed scoring program created with Microsoft Excel. The Excel
file generated graphs for each student that reflect students’ current level of functioning, including
current use of coping and engagement strategies. Once the graph was created, this researcher
scheduled the first meeting with each student, usually to occur during their elective class or study
hall period. This researcher, a graduate student in the School Psychology program who had
previously received intensive training in cognitive-behavioral therapy (e.g., completion of EDG
7931 Cognitive Therapy with Children and Adolescents with a course grade of A) and MI
(deemed proficient in MI by a MINT-certified trainer, a Ph.D.-level professor with considerable
expertise in MI), delivered all the interventions in this study.
Meeting 1. During meeting 1, participants received either a MAP or AP meeting. An
overview of MAP vs. AP meetings is described later in this chapter. This researcher scheduled a
meeting during a student’s elective period. The meeting length ranged from 26 to 55 minutes. In
MAP meetings, participants may choose to not complete an action plan, but none of the
participants in this study chose to do that. Materials needed for meeting 1 include MAP or AP
protocol (Appendices E and F), base graph (Appendix D), student graph (sample attached as
Appendix A), and meeting 1 student success planning guide (Appendix G).
Reminder letter 1. Approximately two weeks after meeting 1, this researcher sent a
reminder letter to student along with a handwritten note. The letter included a copy of the
student’s action plan from the first meeting and encouraged students to complete the plan to

Table 10
List of Surveys in Selective Stage Assessment Packet
Survey
Number of Items
(Subscale) Brief Description Scale Range Sample Item(s)
Student Rating of Environmental
Stressors Scale (StRESS; Suldo,
Dedrick, Shaunessy-Dedrick,
Roth, & Ferron, 2015)
37 Measure types of
stressors students faced
over the school year.
1 – 5 (Never
to Almost
Always)
How often have you
experienced the events or
situations listed below this
school year?
Conflicts or arguments with
teachers(s).
Coping with Academic Demands
Scale (CADS; Suldo, Dedrick,
Shaunessy-Dedrick, Fefer, &
Ferron, 2015)
6 (Time and Task
Management)
4 (Positive
Thinking)
3 (Turn to Family)
3 (Seek Academic
Support)
2 (Relaxation)
3 (Spirituality)
4 (Withdraw and
Rely on Self)
3 (Sleep)
4 (Reduce Effort
on School Work)
3 (Take Short
Cuts)
3 (Skip School)
3 (Substance
Abuse)
Measures how students
in accelerated curricula
cope with academic
stressors.
1 – 5 (Never
to Almost
Always)
Think about the current school
year. When you are (or have
been) faced with school-related
challenges or stress, how often
do you:
Break work into manageable
pieces?
Adopt an optimistic or positive
attitude?
Vent or complain to parent(s).
Study with other students?
Take deep breathes?
Pray?
Keep problems to yourself?
Take naps?
Stop caring about schoolwork?
Copy other students’
homework and assignments?
Take a day off from school to
get work done?

Table 10 (Continued)
71
Drink alcoholic beverages,
such as beer, wine, liquor, etc.?
Eustress Scale (O’Sullivan, 2011) 5 Measure the extent to
which students view
stress to pose impact on
self.
1 – 6 (Never
to Always)
In general, how often do you
feel motivated by your stress?
Student Attitude Assessment
Survey (SAAS-R; McCoach &
Siegle, 2003).
7 (Attitude
towards Teacher)
5 (Attitude
towards School)
9 (Academic Self-
Perception)
Measure students’
engagement with
teachers, school, and
academic self-efficacy
1 – 7
(Strongly
Disagree to
Strongly
Agree)
Most of the AP teachers at this
school are good teachers.
This school is a good match
for me.
I put a lot of effort into my
schoolwork.
Satisfaction with Advanced
Placement/International
Baccalaureate Classes (Developed
and piloted by research team)
1 The research team
developed a 1 item
measure to gauge
students’ satisfaction
with Advanced
Placement/International
Baccalaureate class.
1 – 5
(Strongly
Disagree to
Strongly
Agree)
I am satisfied with my school
program (AP classes)
Extracurricular Activity Scale
(EAS; Developed and Piloted by
Research Team)
15 Estimate the different
types and total weekly
hours student spend on
extracurricular activities.
0 to 12
types; 0 –
10+ hours
On average, in a typical week
during this school year, how
much time do you spend in...
Sports and athletic teams
(basketball, cheerleading,
tennis, golf, track, soccer, etc.)
Short Dispositional Flow Scale-2
(Jackson, Martin, & Ecklund,
2008)
2 Measure students’ flow
in their Advanced
Placement/International
1 – 5 (Never
to Always)
The time passes more quickly
than in other activities.

Table 10 (Continued)
72
Baccalaureate classes
(motivation)
I am completely absorbed in
my work.
Short Grit Scale (Duckworth &
Quinn, 2009)
8 Measure students’ level
of grit (determination
and work ethic)
1 – 5 (Not
like me at all
to Very much
like me)
I am a hard worker.
Standards subscale from Almost
Perfect Scale (APS-R; Slaney et
al., 2001)
7 Measure students’
standards for academic
performance
1 – 7
(Strongly
Disagree to
Strongly
Agree)
I have high expectations for
myself.
Parenting Style Inventory-II
(Darling, 1997)
5 (Emotional
support)
5 (Promote
Autonomy)
Measure students’
perception of parenting
practices
1 – 5 (Strong
Disagree to
Strongly
Always)
My parent(s) doesn’t really
like me to tell him or her my
troubles.

73
reach self-determined goal. It also included additional questions for students to ponder before the
next meeting. A sample reminder letter is attached as Appendix B.
Meeting 2. Meeting 2 was held approximately 1 to 2 weeks after the reminder letter was
sent, thus about 1 month after meeting 1. During meeting 2, participants experienced the
condition that they had yet to receive (MAP or AP). This researcher used the same procedure to
invite students to the meeting and return them to their classes. Participants could choose to work
on the same goal, pick a different target, or not complete an action plan. All participants either
chose to work on the same goal (n = 7) or pick a different target (n = 13). Meeting 2 ranged from
21 to 49 minutes in duration. Materials needed for meeting 2 are similar to meeting 1, except that
the meeting 2 student success planning guide (Appendix H) was used instead of the meeting 1
student success planning guide (Appendix G).
Reminder letter 2. Reminder letter 2 is similar to the first one and was delivered
approximately two weeks after the second meeting. Sample attached as Appendix B.
Termination and exit interview. Approximately 2 weeks after participants received
reminder letter 2, thus about a month after meeting 2, this researcher met with students one final
time for the purposes of collecting outcome data and intervention termination. This researcher
conducted a brief, semi-structured exit interview to gain participants’ perception of the two
interventions (MAP and AP). This meeting ranged from 6 to 15 minutes in duration. The author
ensured that all participants were aware of the school’s internal resources in case they need
further support in the future.
Field notes. The interventionist (this researcher) recorded details of intervention
implementation in the field, including (a) number of contacts needed to recruit and conduct
meetings, (b) duration of each contact, and (c) number of days between meetings. In summary,

74
the author sent parent consent forms home twice (2/6/19 and 2/14/19), and the Human
Geography teacher reminded students to return signed forms. The Human Geography teacher
helped collect signed parent consent forms from students every school day from 2/7/19 to
2/25/19. Verbal reminders stopped after 20 students returned signed parent consent forms. Out of
the 30 students who were determined as at-risk academically and/or emotionally, 20 participated
in the current study while 7 received MAP sessions from other interventionists from the larger
grant (3 students declined extra supports).
Students with signed parent consent forms had a first meeting with this researcher from
2/12/19 to 2/25/19. Students were called down from an elective period in small groups of 4 to 6
students. All students agreed to participate and signed an assent form. The recruitment (e.g.,
introduction, explaining the assent form, etc.) took approximately 10 to 15 minutes. Then,
participants completed the selective stage assessment packet which took between 25 to 30
minutes. Then, this researcher met with participants for meeting 1 from 2/25/19 to 3/13/19 and
sent the first reminder letter between 3/11/19 to 3/21/19. The second meeting took place between
3/26/19 to 4/12/19, and the second reminder letter was sent between 4/8/19 and 4/22/19.
Termination and exit interviews (meeting 3) were conducted between 4/22/19 to 5/1/19. The
passage of time between meeting 1 and 2 range from 23 to 31 days (M = 28 days). The days
between meeting 2 and 3 range from 18 to 30 days (M = 23 days). The shorter duration between
meeting 2 and 3 was necessary to avoid meeting with participants during the district testing
period (May 2019). Testing period is not ideal for meetings because of the lack of room
availability (most empty offices or conference rooms are used to store assessment materials) and
the possibility of interfering with students’ preparation for tests.

75
As the interventionist, this researcher also recorded challenges faced in the field. The
primary challenge faced relates to some participants’ limited responses to questions and
reflections. Limited responses posed difficulty with building rapport and eliciting change talk.
Two of the participants with limited verbalizations also seemed to exhibit symptoms of anxiety
(e.g., fidgeting, difficulty concentrating, restlessness, self-disclose anxiety disorder diagnosis,
etc.), whereas another student demonstrated symptoms of Autism Spectrum Disorder (e.g.,
avoiding eye contact, lack of facial expressions, difficulty understanding metaphors, etc.).
Another challenge faced by the author is that some meetings (about 10 out of 60 meetings) were
interrupted by other school staff who walked into the room unintentionally. In reaction to an
interruption, the researcher usually paused the meeting for a moment, sometimes pausing the
audio recording to explain the purpose of the meeting to the interrupter, who was often a
concerned school staff. These challenges are not uncommon to applied research in school
settings, and participants did not seem to be too bothered by the interruptions. Lastly, some
participants struggled to come up with strategies to accomplish their goals. Consistent with the
spirit of MI, the interventionist tried to limit advice giving during MAP meetings, which seemed
to frustrate some participants. To address this challenge, the elicit-provide-elicit method was
used which appeared to help participants come up with a concrete action plan.
Outcome assessment. Outcome measures (described below) were divided into two parts
(Part A = importance of and confidence to change, and therapeutic alliance; Part B = goal
attainment). Part A was completed immediately after meetings 1 and 2 along with the
acceptability items within an outcome assessment survey (Appendix K); part B was assessed
immediately before meeting 2 and during termination on the progress towards goal form

76
(Appendix C). Figure 2 demonstrates the components of this study in a flow chart. More details
on the outcome and acceptability measures are included in the sections later in the chapter.
Pilot Study
A pilot study was conducted in Fall 2018 with three School Psychology graduate students
(two assigned to condition A, one assigned to condition B) for two reasons. First, this researcher
was able to gain practice in implementing the AP protocol while minimizing the use of MI spirit
and techniques. Specifically, the pilot meetings were audio recorded and reviewed by a MI
expert (i.e., a dissertation committee member who specializes in MI). The MI expert used the
Motivational Interviewing Treatment Integrity (MITI; Moyers, Manuel, & Ernst, 2014) coding
system to evaluate the author’s MI proficiency in the first two out of three pilot meetings. The
MI expert scored the author’s proficiency in several areas, including the extent to which she (a)
cultivate change talk, (b) soften sustain talk, (c) build partnership and (d) express empathy. The
mean of (a) and (b) provides a technical global score, whereas the mean of (c) and (d) provides a
relational global score. In addition, the MI expert also reported the ratio of complex reflection
use compared to total reflection use (i.e., percent of complex reflections) and the ratio of
reflection use to question use (i.e., reflection to question ratio). More details on the criteria used
to score MITI can be found in Appendix P: Global Dimension Response Options for
Motivational Interviewing Treatment Integrity (MITI). The MI expert only coded the first two
meetings because the third meeting was meant to be an opportunity for the coach to put into
practice the feedback received from the MI expert based on the first two meetings. Table 11
shows the MITI scores for the meetings with the first two pilot participants.

77
Figure 2. Procedures in Selective Intervention
Pre-MAP
survey
packet
MAP
(Engage,
Focus, Evoke,
Plan)
Action
Planning
(Pick target
from graph,
Plan)
Meeting 1
Rem
ind
er L
ette
r
Ou
tcom
e A
sses
smen
t P
art
B
//
Action
Planning
(Pick target
from graph,
plan)
MAP
(Engage,
Focus,
Evoke, Plan)
Meeting 2
Rem
ind
er L
ette
r
Ou
tcom
e A
sses
smen
t P
art
B +
Ter
min
ati
on
Condition A
January 2019 February 2019 March 2019 April 2019
Condition B
Ou
tcom
e A
sses
smen
t P
art
A
Ou
tcom
e A
sses
smen
t P
art
A

78
Table 11
Descriptive Statistics of Motivational Interviewing Treatment Integrity (MITI) Scores in Pilot
Participant Meeting Cult
ivat
e C
han
ge
Tal
k
Soft
enin
g S
ust
ain T
alk
Par
tner
ship
Em
pat
hy
Tec
hnic
al G
lobal
Rel
atio
nal
Glo
bal
Per
centa
ge
of
Com
ple
x
to S
imple
Ref
lect
ions
Ref
lect
ion
-to-Q
ues
tion
Rat
io
1 MAP 4 3 5 5 3.5 5.0 0.40 1.25
AP 3 3 3 3 3.0 3.0 0.23 0.38
2 MAP 4 4 3 4 4.0 3.5 0.88 1.20
AP 3 3 3 3 3.0 3.0 0.29 0.63
Note. For condition, 1 = MAP to AP, 2 = AP to MAP. For cultivating change talk, softening
sustain talk, partnership, and empathy, scale from 1 = Low to 5 = High was used. Details on
response options were included as Appendix P. For technical global, a score of 3 is considered
fair, 4 is good; for relational global, a score of 3.5 is fair, 4 is good; for percentage of complex to
simple reflection, 40% is fair, 50% is good; for reflection-to-question ratio, 1:1 is fair, 2:1 is
good. Adapted from Moyers, T.B., Manuel, J.K., & Ernst, D. (2014). Motivational Interviewing
Integrity Coding Manual 4.2. Unpublished manual.
As shown on Table 11, the author received higher MITI scores during MAP meetings,
except for scoring the same score on level of partnership for participant 2. To further distinguish
the level of MI spirit and techniques used in MAP compared to AP meetings, the MI expert
suggested several strategies, including (a) increase use of complex reflections during MAP
meetings, (b) use more open-ended questions when asking about barriers towards goal
completion during MAP meetings, (c) use more neutral responses (e.g., okay) and evaluative
praise (e.g., that’s awesome) during AP meetings, and (d) always start a MAP meeting with a
question about student’s value, no matter the order of the meeting (first or second). The author
practiced incorporating these strategies with a third pilot participant, then proceeded to meet with
actual participants at the high school.

79
In addition to gaining practice in minimizing use of MI spirit and technique during AP
meetings, the author also gained feedback on the appropriateness of study procedures (e.g., when
and how to explain to participants regarding the two conditions they will experience in this
study) through the pilot study. Based on recommendations from the pilot, an exit interview was
added to the procedures to gain more qualitative feedback from participants, as suggested by the
MI expert. Furthermore, the author made conditions (MAP or AP) blind to the MI expert to
eliminate biases during MITI coding. In terms of study materials, the author also (a) fixed
clerical errors on the student-report outcome measure form, (b) added qualitative questions on
coach’s feedback form (e.g., “What are some challenges in this meeting?”), (c) made it optional
for students to look at their personalized graph again during meeting 2, and (d) revised the
fidelity forms to reflect the changes made to MAP or AP meeting protocol (e.g., making it
optional for all students to look at personalized graph during meeting 2, adding more questions
related to students’ values at the beginning of MAP meeting 2, etc.).
The pilot participants also provided some qualitative feedback, which helped refine the
current study. For example, pilot participant 1 shared that her prior exposure to MAP made it
easy for her to predict questions in meetings and suggested the author to conduct another pilot
with an individual with no prior exposure to MAP. The author took her suggestion and recruited
the third pilot participant. Pilot participant 2 suggested that students might need a reminder of the
definitions of character strengths if they are receiving MAP during their second meeting. The
author kept that in mind during study implementation. Other than those two suggestions, all three
pilot participants conveyed that the study was well designed, in particular the materials were
easy to understand, the flow was smooth, the questions were clear, and they felt comfortable
during meetings.

80
In summary, the pilot study provided useful information to further refine the procedures
of the current study and to increase the level of control the author had over her use of MI skills,
which is important to differentiate MAP and AP meetings. Qualitative feedback from pilot
participants contributed to further improvement of study procedures.
Overview of Intervention Materials
MAP protocol. The MAP protocol (Appendix E) is based on the original MAP meeting
1 protocol developed and piloted by the research team in line with the larger project. The
literature review in Chapter II provides more details on the development and characteristics of
the original MAP protocols. In the current study, the author made minor adjustments to the
original MAP meeting 1 to ensure that it can be used in both first and second meeting with
students. Specifically, language to re-introduce coach, re-orient students to the graph, review
progress in meeting 2, and ensure students make another action plan in meeting 2 were added. As
in the original version, the protocol follows the four processes of MI, namely engaging, focusing,
evoking, and planning. The goal of the MAP protocol is to guide the author in adhering to the MI
spirit and techniques during implementation. The MAP meeting protocol is attached as Appendix
E.
Action Planning (AP) protocol. The AP protocol (attached as Appendix F) jumps
straight into action planning after orienting students to the coach, meeting, and graph. This
protocol does not adhere to the spirit of MI and the author minimized usage of MI techniques
during implementation. Although the focus of AP meeting is to conduct the action planning
process with participants, some other elements in the other stages are included to provide context
for the intervention (e.g., introducing the coach and purpose of meeting, orienting student to their

81
graph, picking a target goal, etc.). Table 12 further demonstrates the differences between MAP
and Action Planning protocol.
Base and student graph. The base and student graphs that were used in this study are
the same as in the original implementation of the selective intervention (O’Brennan et al., 2019).
They were used in meetings as a visual tool to provide performance feedback to participants. It
also helped participants decide which target to pick for action planning. A sample base and
student graph are provided in Appendices A and D.
Student success planning guide. The student success planning guides in this study was
slightly modified from the originals. It is a visual tool to help the author guide participants
through the meetings. The AP meetings omit page 3 of the meeting 1 planning guide and page 2
of the meeting 2 planning guide (i.e., skipped the part where the coach reviews students’ values,
strengths, and goals). In contrast, the author utilized the complete planning guide during MAP
meetings. Appendices G and H contain blank Meeting 1 and 2 student success planning guides.
The main differences between the two guides are reflected on the agenda on the front page.
Reminder letter. The reminder letter in this study is the same as the original. It reminded
students of their action plan and urge them to complete the steps to reach self-determined goal. A
sample letter is provided in Appendix B.
Outcome Measures
Importance of and confidence to change. In consultation with committee members,
which include researchers with expertise in MI, the author developed three items to measure
participants’ perceived importance to change and another three items to tap participants’
confidence to change. These two elements align with the theoretical underlying of MI regarding
why and how individuals make changes (i.e., one manages to change when one feels that the

82
change is important and is confident that one could make the change; Miller & Rollnick, 2012).
Although these items have not been piloted before, the construct that the items attempt to
measure is straightforward. In other words, the items should be able to capture participants’
perceived importance of and confidence to change accurately. In this study (N = 20), the
importance of change scale yielded low to moderate internal reliability (α = 0.55 for MAP
meetings; α = 0.44 for AP meetings). The confidence to change yielded higher internal reliability
(α = 0.70 for MAP meetings; α = 0.81 for AP meetings). The scale for this measure ranges from
1 to 5 (1 = Strongly Disagree, 2 = Disagree, 3 = Neither Agree nor Disagree, 4 = Agree, 5 =
Strongly Agree). The items are listed in Table 13. A higher total score on this scale indicates
higher level of importance of and confidence to change. The measure was included in outcome
assessments (Appendix K).
Therapeutic alliance. This study utilized two sources of therapeutic alliance. First, a
slightly modified version of the Therapeutic Alliance Quality Scale (TAQS; Bickman et al.,
2010) was used to measure therapeutic alliance from the youth participants’ perspective. The
TAQS has been widely used to measure the working relationship between youth (11 to 18 years)
and clinician in one-on-one counseling session. Specifically, 2 items measure the bond between
clinician and youth; and 3 items measure the level of agreement between clinician and youth on
tasks and goal of therapy. In total, it is a 5-item student self-report survey on a 5-point scale (1 =
Not at all, 2 = Only a little, 3 = Somewhat, 4 = Quite a bit, 5 = Totally). A sample item is “Did
this meeting head in the direction you wanted?” As part of the Peabody Treatment Progress
Battery (PTPB), this scale had undergone rigorous psychometric testing and has been shown to
be reliable and valid across a large sample of youth (N = 679) who were receiving home-based
mental health services (Riemer et al., 2012). In addition, the items included in this study were

83
Table 12
Differences between MAP and AP Meetings
Step MAP Meeting AP Meeting
Step 1:
Engage • Introduction/Re-introduction to coach
and meeting purpose.
• Meeting 2 only: Review progress
towards goal
• Review values, strengths, hopes, and
goals for the future.
• Summarize how student’s background
fits with ACE targets
• Introduction/Re-introduction to
coach and meeting purpose.
• Meeting 2 only: Review progress
towards goal
Step 2:
Focus • Elicit student knowledge of areas
related to academic and emotional
success.
• Orient/re-orient student to norm-
referenced feedback graph and review
individualized graph with student.
• Develop discrepancy between student’s
weaknesses and comparison groups
and/or personal goals.
• Agenda map and prioritize area(s) of
change
• Orient/Re-orient student to norm-
referenced feedback graph and
review individualized graph with
student.
• Agenda map and prioritize area(s)
of change.
Step 3:
Evoke • Pose evocative questions that elicit
change talk
• Reinforce any change talk with OARS.
• N/A [Skip this step entirely]
Step 4:
Plan • Collaboratively brainstorm strategies
for meeting goals using Problem-
Solving Process in Action form.
• Create an action plan that specifies
action steps, supports needed, and a
timeline.
• Increase hope and confidence in
making change.
• Collaboratively brainstorm
strategies for meeting goals using
Problem-Solving Process in
Action form.
• Create an action plan that
specifies action steps, supports
needed, and a timeline
Note. ACE = Advancing Coping and Engagement, OARS = Open-ended questions, Affirmation,
Reflection, Summary.

84
Table 13
Items on Importance of and Confidence to Change Measure
Items
Importance of
change
1. I feel the target behavior my coach and I discussed today is
important.
2. The target behavior my coach and I discussed today became more
important as the meeting went along.
3. I am ready to make change in the target behavior discussed during
today’s meeting.
Confidence to
change
4. Because of this meeting, I feel confident that I will meet my goal.
5. I know I can take the steps necessary to reach my goal.
6. I am confident that my plan will help me overcome barriers to reach
my goal.
piloted with students in accelerated curricula in conjunction with the implementation of the
original MAP intervention during Year 3 of the project. A total of 120 students in accelerated
curricula completed the items after MAP meeting 1, and 114 of these students completed the
items after meeting 2. After meeting 1, the 5-item composite mean score ranged from 4.43 to
4.79 (SD = 0.45 – 0.72); after meeting 2, the mean composite ranged from 4.45 to 4.81 (SD =
0.44 – 0.73). In the current study (N = 20), the TAQS for participants yielded sufficient internal
reliability (α = 0.67 for MAP meetings; α = 0.68 for AP meetings). To interpret this scale, higher
total score indicates higher level of therapeutic alliance. The TAQS for participants is included in
outcome assessment (Appendix K) with other outcome and acceptability items.
The second source of therapeutic alliance rating for this study is the interventionist
(coach). This study collected the interventionist’s rating of therapeutic alliance through a
modified version of the Therapeutic Alliance Quality Rating (TAQR; Bickman et al., 2010).
Specifically, one item measured the interventionist’s perception of the level of therapeutic
alliance she shares with participants (“In this meeting, how would you describe your relationship
with this student?”) and another item measures how the interventionist thinks the participants
would rate their respective alliance with her (“In this meeting, how do you think the student will

85
rate your relationship with him/her?”). These two items are measured on a 5-point scale (very
poor, poor, satisfactory, good, and excellent) and adopted from the TAQR, which was developed
alongside the TAQS, thus has also been widely tested with practitioners who worked with youth
in clinical settings. In addition to those two items, this study included four more items to measure
interventionist’s perception on therapeutic alliance. These items were developed and piloted by
the research team working on the larger grant (R305A150543) associated with this study
(O’Brennan et al., 2019). The additional items were rated on a 5-point scale (1 = Strongly
Disagree, 2 = Disagree, 3 = Neither Disagree nor Agree, 4 = Agree, 5 = Strongly Agree). During
Year 3 of the larger grant, a total of 121 students in accelerated curricula completed the items
after MAP meeting 1, and 114 of these students completed the items after meeting 2. After
meeting 1, the 6-item composite mean score ranged from 3.17 to 5.00 (M = 4.39; SD = 0.54);
after meeting 2, the 7-item composite mean score ranged from 2.86 to 5.00 (M = 4.39; SD =
0.55). In the current study (N = 20), the TAQS for participants yielded high internal reliability (α
= 0.97 for MAP meetings; α = 0.92 for AP meetings). To interpret this scale, higher total score
indicates higher level of therapeutic alliance. All therapeutic alliance items are included in
Appendix O. It is important to note that due to potential biases (i.e., interventionist not blind to
the condition that participants are in), reliability of interventionist-rated therapeutic alliance
should be viewed with caution.
Collecting rating of therapeutic alliance from two sources (participants and coaches)
permits examination of alliance ratings from multiple sources. In terms of which source should
be prioritized, this study put most emphasis on participant-rated therapeutic alliance because
client-rated therapeutic alliance has shown to be most predictive of therapy outcomes (Lambert
& Barley, 2001).

86
Goal attainment. To measure goal attainment, this study utilized four indicators of
progress. The first indicator used in this study is the Goal Attainment Scaling (GAS; Kiresuk &
Sherman, 1968), which was developed as an alternative evaluative technique to measure progress
on individualized goals more than 40 years ago. The GAS was first applied in mental health
settings (Kiresuk & Sherman, 1968) and has since been considered appropriate to measure highly
diverse outcomes or goals in treatment across settings, including schools (Ruble, Dalrymple, &
McGrew, 2010). The GAS scale was rated on a 5-point scale (+2 = much more than expected, 1
= more than expected, 0 = expected level of progress, -1 = less than expected, -2 = much less
than expected). In this study, participants first developed a goal relevant to themselves in a
meeting, then determined how much progress they have made in the following meeting. This
procedure is a shorter version of the original procedure recommended by Kiresuk, Smith, and
Cardillo (2014), which has seven steps. The author simplified the procedure after consulting with
committee members to avoid adding more intervention elements in meetings, which might
complicate the distinction between MAP and AP meetings.
The second and third indicators are 5-point Likert items that measured participants’
perception on overall progress towards self-determined goal and changes in behavior after
meeting. The items are “I made progress on the goal I identified with my coach” and “I made
changes in my behavior based on the last meeting.” Participants rated the item on a scale from 1
to 5 (1 = Not at all, 2 = Only a little, 3 = Somewhat, 4 = Quite a bit, 5 = Totally). These two
items were also piloted with 114 students in accelerated curricula in Year 3 of the larger IES
grant. Table 14 details the frequency distributions, means, and stand deviations of the two goal
attainment items from that study, data collected at meeting 2 which reflects progress toward goal
since meeting 1.

87
Table 14
Descriptive Statistics of Progress towards Goal and Change in Behavior Items from Pilot
n M SD
Stro
ngly
Disag
ree
Disag
ree
Neith
er Agree
Nor D
isagree
Agree
Stro
ngly
Agree
Items Percent
I made progress on the goal I identified
with my coach. 114 4.46 0.69 0.0 1.8 6.1 35.1 57.0
I made changes in my behavior based
on the first meeting. 114 4.18 0.72 0.0 3.5 7.9 53.5 35.1
Note. 1 = Not at all, 2 = Only a little, 3 = Somewhat, 4 = Quite a bit, 5 = Totally.
The fourth and last indicator of goal attainment is the percentage of action steps
completed. The author (coach) first reviewed participants’ self-determined goal and action plan
as developed in the earlier meeting, then asked participants to determine if he or she has made
“no progress”, “some progress”, or “completed” each step on the action plan. A score of 0 is
assigned if participant had made “no progress”, a score of 1 is assigned for some “progress”, and
a score of 2 is assigned for “completed”. The number of steps for each action plan range from 1
to 4. To illustrate, if a participant had a score of 4 out of total possible score of 6 (i.e., 3 steps in
action plan), he or she is considered to have made 67% (4/6 x 100%) towards his or her goal. A
higher percentage indicates larger progress made towards self-determined goal since the
individual coaching session. In Year 3 of the larger IES grant, the research team piloted this
method of measuring goal attainment (from meeting 1 to 2) with 114 students in accelerated
curricula and found that 2% of students completed 0% of the plan, 7% completed 1 to 25% of the
plan, 24% completed 26 to 50% of the plan, 25% completed 51 to 75% of the plan, 18%
completed 76 to 99% of the plan, and 25% completed 100% of the plan. All indicators of goal
attainment were included in the progress towards goal form, attached as Appendix C.

88
Acceptability Measures
In order to gauge the acceptability of the MAP and AP meetings, this study utilized both
quantitative and qualitative measures to capture participants’ sentiments.
Quantitative measures. Immediately after each meeting, participants completed a 1-
page survey (Appendix K) that includes the acceptability, therapeutic alliance, and goal
attainment items. This study also included 4 items on acceptability that were rated on a scale
from 1 to 5 (1 = Not at all, 2 = Only a little, 3 = Somewhat, 4 = Quite a bit, 5 = Totally). The
items are “I would recommend the meeting to other students.”, “I felt comfortable during this
meeting.”, “The materials presented were helpful.”, and “The process used to develop the action
plan was helpful.” A higher total score on these items indicate higher level of acceptability or
satisfaction of meeting. Two of the four items were piloted with 112-120 students in accelerated
curricula in conjunction with the larger IES study. Table 15 displays the means, standard
deviations, and frequency distributions yielded from each item, using data from 2017-18. The
other two items were newly constructed in consultation with dissertation committee members
and were expected to capture participants’ acceptability reliably as the purpose of the items
should be clear to participants. Case in point, the 4 acceptability items yielded high internal
reliability in this study (N = 20; α = 0.78 for MAP meetings; α = 0.73 for AP meetings).
Qualitative measures. In addition to the four quantitative items on acceptability,
participants also had the opportunity to provide written and verbal feedback. Specifically,
participants were asked to provide written responses to open-ended questions after the first two
meetings. The open-ended questions provided a space for participants to voice any additional
comments not captured through quantitative measure. It also generated helpful information that

89
Table 15
Descriptive Statistics of Acceptability Items from Pilot
Items n M SD
Stro
ngly
Disag
ree
Disag
ree
Neith
er Agree
Nor D
isagree
Agree
Stro
ngly
Agree
MAP Meeting One Percent
I would recommend the meeting to
other students. 120 4.49 0.65 0.0 0.0 8.3 34.2 57.5
I felt comfortable during this meeting. 120 4.61 0.61 0.8 0.0 1.7 32.5 65.0
MAP Meeting Two Percent
I would recommend the meeting to
other students. 112 4.30 0.71 1.0 0.0 8.9 48.2 41.9
I felt comfortable during this meeting. 114 4.65 0.58 0.0 0.9 2.6 27.2 69.3
Note. 1 = Not at all, 2 = Only a little, 3 = Somewhat, 4 = Quite a bit, 5 = Totally.
supplement the data generated from quantitative methods. The open-ended questions were
provided right after the quantitative measures in outcome assessment (attached as Appendix K).
The open-ended questions are “What part of the meeting did you find most interesting or
useful?,” “After meeting 1 only: What are the good and bad parts of the meeting?,” “After
meeting 2 only: Can you name some differences between the extra support you experienced
today compared to our last meeting?,” and “Additional comments and suggestions.”
In addition to the written responses, the author also conducted a semi-structured exit
interview with each participant during the third meeting. The interview questions were “Please
describe some differences between the two meetings we had?,” “How comfortable do you feel
during the first meeting? How about during the second meeting?,” and “Anything else about
your experiences during the two meetings that you would like to share?” The coach asked
follow-up questions as appropriate. The duration of the interview ranged from 6 to 15 minutes.

90
Overview of Analyses
Quantitative analysis. The majority of this study is quantitative in nature, in which
various statistical methods were used to answer the research questions.
Descriptive statistics. The author conducted descriptive statistics analyses through SAS
9.4 statistical software (SAS Institute, 2013) to summarize various aspects of the data collected
throughout this study. Specifically, the author calculated the distribution of scores, medians,
means, and standard deviations for outcomes (i.e., perceived importance of and confidence to
change, therapeutic alliance, goal attainment) and acceptability items at various time points (i.e.,
after meeting 1, before meeting 2, after meeting 2, and before termination). In addition, the
author also compared the average Motivational Interviewing Treatment Integrity (MITI; Moyers
et al., 2014) scores between MAP and AP meetings. All descriptive statistics are reported in
detail in Chapter IV.
Research question 1. Does participation in the MAP intervention results in better
outcomes compared to participation in the Action Planning intervention among at-risk 9th grade
students in accelerated curricula? Outcomes include (a) importance of change, (b) confidence to
change, (c) therapeutic alliance, and (d) goal attainment.
Research question 2. Does participation in the MAP intervention result in better
acceptability compared to participation in the Action Planning intervention (planning only)
among at-risk 9th grade students in accelerated curricula?
To answer research questions 1 and 2, SAS 9.4 statistical software (SAS Institute, 2013)
was used to conduct Wilcoxon Signed-Rank Tests. This test was chosen because it is a non-
parametric test that does not assume a normal distribution or equal variances. It is suitable for the
small sample size of this study. Essentially, the tests compared two sets of scores that came from
the same participants and revealed any differences. Each participant acted as his or her own

91
control. The condition (MAP vs. AP meeting first) is the independent variable, whereas the
outcome and acceptability measures are the dependent variables. All results are described in
detail in Chapter IV.
Qualitative analysis. Student participant written and verbal responses to acceptability of
meetings provided more context to answer research question 2. After the data were collected, the
author transcribed participants’ responses into a Word document. Then, she read the responses
several times, highlighted repetitive keywords, and immersed herself in the data. Finally, the
author utilized the constant comparative method to identify key themes from the qualitative data
(Strauss & Corbin, 1990). All qualitative findings are reported in Chapter IV.
Ethical Considerations
Permission to conduct the larger study was secured from the USF’s IRB (amendment 19
to eIRB Pro00022787; see Appendix U) and the research offices from the school district. The
amendment specified the procedures to be used with 20 students. Parent consent, student assent
forms, and recruitment letter (Appendices L, M, and N) for this study were approved for use.
Several additional precautions were taken to protect the rights and confidentiality of the
participants in this study. For example, the USF’s IRB and the author’s committee members
reviewed the intervention protocols and procedures to ensure all interactions with participants
presented minimal risk or no harm. A pilot study was conducted in which the author received
feedback on the study procedures and her counseling skills. Study participants were allowed to
withdraw at any time. The consent and assent forms include contact information of the USF
researchers in case participants or parents had any concerns or questions. In order to protect
participants’ identity and confidentiality, participants were assigned code numbers. The sessions
were audio recorded and uploaded to a secure university drive (p-drive, which the university

92
transitioned to Box). Only approved project staff are allowed to access the audio files, and no
participants’ names are on specified within the files. All physical data collected (e.g., paper and
pencil surveys) are stored in a locked room and all electronic data entered are kept on the p-
drive/Box for security.

93
Chapter IV: Results
The first part of this chapter reviews data screening and results from descriptive analyses
to demonstrate the validity of the data set and describes relationships between variables. Then,
this chapter presents analyses of data to answer the research questions of this study. For research
questions 1 and 2, the results of Wilcoxon Signed-Rank Tests are described. Lastly, this chapter
presents themes generated from qualitative data analyses and explains how these themes provide
context for the findings of this study.
Data Screening
Data entry accuracy. The author first entered all data collected on paper into an Excel
spreadsheet, then created a database in SAS 9.4 statistical software (SAS Institute, 2013). Once
the database was established in SAS, the author read aloud each data line in the Excel sheet, and
a volunteer research assistant ensured that the data matched those in the SAS database. No errors
were found through this check. The author further evaluated data entry accuracy by manually
checking 100% of all measures used in study. Specifically, the author made sure that the data
collected on papers matched the data in the SAS database. In SAS, the author also calculated the
minimum and maximum values of each variable to check for impossible values. No values were
found to be outside of the minimum or maximum range. In summary, the data entry error rate
was 0%, with an accuracy rate of 100%. It is also noteworthy that there is no missing data in this
study.

94
Differentiating MAP and AP Meetings
The conditions in this study (MAP and AP) were differentiated with two methods.
Theoretical differences in intervention content. The author designed two different
intervention protocols with the support of her committee members. Details on the protocol can
be found in Chapter III. The author adhered to the protocol strictly to ensure that participants
experience two different conditions throughout the study. Fidelity scores are reported later in this
chapter.
Analysis of MITI scores from 40 meetings. The author incorporated more MI skills and
spirit during MAP compared to AP meetings. An expert in MI (i.e., one of the author’s
dissertation committee member who specializes in MI) used the MITI coding system to evaluate
the author’s MI proficiency in all meetings. Wilcoxon Signed Rank test revealed significant
differences in cultivating change talk (S = 82.5, N = 20, p < .0001) and softening sustain talk (S
= 88, N = 20, p < .0001) between MAP and AP meetings, such that the coach cultivated more
change talk and softened sustain talk more effectively during MAP compared to AP meetings.
Wilcoxon Signed Rank tests also demonstrated significant differences in partnership (S = 60, N
= 20, p < .0001), empathy (S = 54.5, N = 20, p = 0.003), technical global (S = 91, N = 20, p
< .0001), relational global (S = 73.5, N = 20, p < .0001), percent of complex reflection (S = 105,
N = 20, p < .0001), and reflection to question ratio (S = 74, N = 20, p = .004) scores. These
results suggest that the coach formed stronger partnership with participants, displayed higher
empathy, demonstrated stronger technical skills, built stronger overall relationships, used more
complex reflections compared to simple reflections, and used less questions compared to
reflections during MAP meetings. In other words, the author demonstrated significantly higher
95
quality of MI during MAP compared to AP meetings. Descriptive statistics on MITI scores are
reported in the next section.
Descriptive Statistics
Descriptive statistics were computed via SAS for all variables, including the three
outcome variables (importance of and confidence to change, therapeutic alliance, and goal
attainment), student acceptability, and the control variable (level of MI quality). There are two
sources of therapeutic alliance (student and coach) and four indicators of goal attainment (Goal
Attainment Scaling, perceived progress towards goal, perceived change in behavior, and
percentage of action steps completed).
Overall, participants reported high levels of importance of change, as evidenced by the
high means and medians for MAP (M = 4.68, Med = 4.67) and AP (M = 4.50, Med = 4.33)
meetings. In fact, no participant responded to any items with a number lower than 4 on a scale
that range from 1 to 5 (strongly disagree to strongly agree). The same observations were made
for confidence to change, where means and medians were high for MAP (M = 4.38, Med = 4.33)
and AP (M = 4.35, Med = 4.33) meetings. However, a small number of participants (5 to 10%)
responded to some items with a 2 or 3 out of the 5-point Likert scale for this variable. On the
other hand, participants also reported high therapeutic alliance across MAP (M = 4.70, Med =
4.80) and AP (M = 4.66, Med = 4.70) meetings on a scale from 1 = not at all to 5 = totally, with
no 1 or 2 responses. In contrast, the coach reported slightly higher therapeutic alliance for MAP
(M = 4.47, Med = 5.00) compared to AP (M = 3.18, Med = 3.00) meetings. Tables 16 to 18
describe the mean, median, standard deviation, and score distributions of these variables and
their items.

96
Table 16
Descriptive Statistics of Importance of and Confidence to Change
MAP AP α M Med SD Percent α M Med SD Percent
Scales and Items 1 2 3 4 5 1 2 3 4 5
Importance of Change 0.55 4.68 4.67 0.33 0.44 4.50 4.33 0.12
1. I feel the target behavior my
coach and I discussed today is
important.
4.75 5.00 0.44 0 0 0 25 75 4.55 5.00 0.51 0 0 0 45 55
2. The target behavior my coach
and I discussed today became
more important as the meeting
went along.
4.80 5.00 0.41 0 0 0 20 80 4.50 4.50 0.51 0 0 0 50 50
3. I am ready to make change in
the target behavior discussed
during today’s meeting.
4.50 4.50 0.51 0 0 0 50 50 4.45 4.00 0.51 0 0 0 55 45
Confidence to Change 0.70 4.38 4.33 0.49 0.81 4.35 4.33 0.62
1. Because of this meeting, I feel
confident that I will meet my
goal.
4.30 4.00 0.66 0 0 10 50 40 4.55 5.00 0.69 0 0 10 25 65
2. I know I can take the steps
necessary to reach my goal.
4.30 4.00 0.66 0 0 10 50 40 4.35 4.00 0.67 0 0 10 45 45
3. I am confident that my plan
will help me overcome barriers to
reach my goal.
4.55 5.00 0.51 0 0 0 45 55 4.15 4.00 0.81 0 5 10 50 35
Note. MAP = Motivational, Assessment, and Planning, AP = Action Planning; 1=Strongly Disagree, 2 = Disagree, 3 = Neither Agree
Nor Disagree, 4 = Agree 5=Strongly Agree.

97
Table 17
Descriptive Statistics of Student-Report Therapeutic Alliance
MAP AP α M Med SD Percent α M Med SD Percent
Scale and Items 1 2 3 4 5 1 2 3 4 5
Student-report Therapeutic
Alliance
0.67 4.70 4.80 0.36 0.68 4.66 4.70 0.34
1. Did this meeting head in the
direction that you wanted?
4.65 5.00 0.59 0 0 5 25 70 4.50 5.00 0.69 0 0 10 30 60
2. Did you understand the things
your coach said in this meeting?
4.80 5.00 0.41 0 0 0 20 80 4.85 5.00 0.37 0 0 0 15 85
3. Did you and your coach work on
problems together in this meeting?
4.90 5.00 0.31 0 0 0 10 90 4.80 5.00 0.41 0 0 0 20 80
4. In this meeting, do you feel that
your coach will stick with you no
matter how you behaved?
4.70 5.00 0.47 0 0 0 30 70 4.75 5.00 0.44 0 0 5 25 75
5. In this meeting, did you feel that
your coach understood what it feels
like to be you?
4.45 5.00 0.76 0 0 15 25 60 4.40 4.00 0.60 0 0 5 50 45
Note. MAP = Motivational, Assessment, and Planning, AP = Action Planning; 1 = Not at all, 2 = Only a little, 3 = Somewhat, 4 =
Quite a bit, 5 = Totally.

98
Table 18
Descriptive Statistics of Coach-Report Therapeutic Alliance
MAP AP α M Med SD Percent α M Med SD Percent
Scale and Items 1 2 3 4 5 1 2 3 4 5
Coach-report Therapeutic Alliance 0.97 4.67 5.00 0.47 0.92 3.18 3.00 0.57
1. In this meeting, how would you
describe your relationship with this
student?
4.65 5.00 0.49 0 0 0 35 65 3.30 3.00 0.57 0 0 75 20 5
2. In this meeting, how do you think
the student will rate your relationship
with him/her?
4.65 5.00 0.49 0 0 0 35 65 3.25 3.00 0.55 0 0 80 15 5
3. The student seemed engaged
during this meeting.
4.70 5.00 0.47 0 0 0 30 70 3.30 3.00 0.73 0 10 55 30 5
4. The student and I had a positive
working alliance during this meeting.
4.65 5.00 0.59 0 0 5 25 70 3.00 3.00 0.73 0 20 65 10 5
5. The student seems likely to make
a positive change in a target
discussed during today’s meeting.
4.65 5.00 0.49 0 0 0 35 65 3.00 3.00 0.80 0 25 55 15 5
6. I feel the student benefitted from
taking part in the meeting.
4.70 5.00 0.47 0 0 0 30 70 3.25 3.00 0.64 0 5 70 20 5
Note. MAP = Motivational, Assessment, and Planning, AP = Action Planning; Item 1 and 2 used the scale of 1 = Very poor, 2 = poor,
3 = satisfactory, 4 = good, 5 = excellent; items 3 to 6 used the scale of 1=Strongly Disagree, 2 = Disagree, 3 = Neither Agree Nor
Disagree, 4 = Agree 5=Strongly Agree.

99
As described in Chapter III, there are four indicators of goal attainment. For Goal
Attainment Scaling (GAS), the scale ranges from much more than expected (+2), more than
expected (+1), expected level of progress (0), less than expected (-1), to much less than expected
(-2). The median GAS scores for both MAP and AP meetings were +1, with the highest number
of participants choosing +1 for MAP (60%) and AP (45%) meetings (see Table 19).
Table 19
Descriptive Statistics of Goal Attainment Scaling
MAP AP
Scale and Items M Med SD Percent M Med SD Percent
Goal Attainment Scale 0.60 1.00 0.75 0.40 1.00 1.05
Much more than expected (+2) 5 10
More than expected (+1) 60 45
Expected level of progress (0) 25 25
Less than expected (-1) 10 15
Much less than expected (-2) 0 5
Note. MAP = Motivational, Assessment, and Planning, AP = Action Planning.
For student self-report progress towards goal, participants reported scores of 3 and above
on a scale from 1 to 5 (strongly disagree to strongly agree) for both MAP (M = 4.10, Med =
4.00) and AP (M = 4.50, Med = 4.50) meetings. For student self-report changes in behavior,
participants reported scores above 4 on the same scale for MAP (M = 4.40, Med = 4.00) and AP
(M = 4.60, Med = 5.00) meetings. The last indicator of goal attainment is percentage of action
steps completed, which reflects the extent to which participants completed each step of the action
plan they created during the meeting. For each step, a score of 0 is assigned if participant had
made “no progress”, a score of 1 is assigned for some “progress”, and a score of 2 is assigned if
the step has been “completed”. The number of steps for each action plan range from 1 to 4. If a
participant had a score of 4 out of total possible score of 6 (i.e., 3 steps in action plan), he or she
will be considered to have attained 67% (4/6 x 100%) of steps towards his or her goal. In this
study, participants reported completing the majority of the steps for MAP (M = 70%, Med =

100
83%) and AP (M = 75%, Med = 75%) meetings. Tables 20 and 21 describe the mean, median,
standard deviation, and score distributions of these variables.
In terms of acceptability, participants reported high acceptability for MAP (M = 4.64,
Med = 4.75) and AP (M = 4.60, Med = 4.67) meetings on a scale from 1 = Strongly Disagree to 5
= Strongly Agree. Table 22 describe the mean, median, standard deviation, and score
distributions of these variables and their items.
Last, an expert in MI coded all meetings with the MITI coding system and rated MAP
meetings with higher quality of MI compared to AP meetings. The first four indicators of MI
quality (cultivating change talk, softening sustain talk, partnership, and empathy) were rated on 1
to 5 Likert scale (1 = Low to 5 = High). As reported in Table 23, MAP meetings have higher
scores on cultivating change talk (M = 3.90 vs. M = 2.45; S = 82.5, N = 20, p < .0001), softening
sustain talk (M = 3.80 vs. M = 2.65; S = 88, N = 20, p < .0001), partnership (M = 3.95 vs. M =
2.80; S = 60, N = 20, p < .0001), and empathy (M = 4.00 vs. M = 3.00; S = 54.5, N = 20, p =
0.003). Appendix P provides details on how the MI expert choose between score 1 to 5 for each
indicator. On technical global, a score of 3 is considered fair whereas 4 is considered good
(Moyers et al., 2014). Table 23 shows that MAP meetings have higher mean technical global
score that is also considered close to good (M = 3.85). In contrast, AP meetings have lower mean
technical global score that is not even considered fair (M = 2.55). Wilcoxon Signed Rank test
revealed a significant difference in technical global score (S = 54.5, N = 20, p = 0.003).
For relational global, a score of 3.5 is considered fair and a score of 4 is considered good.
MAP meetings have a higher mean relational global score (S = 73.5, N = 20, p < .0001) that is
also considered good (M = 3.98), whereas AP meetings have lower mean relational global score
that is not even considered fair (M = 2.90). Next, a score of 40% on percentage of complex to

101
Table 20
Descriptive Statistics of Perceived Progress towards Goal and Changes in Behavior
MAP AP M Med SD Percent M Med SD Percent
Scale and Items 1 2 3 4 5 1 2 3 4 5
Progress towards Goal
I made progress on the goal I identified with my
coach.
4.10 4.00 0.64 0 0 5 75 20 4.50 4.50 0.51 0 0 10 30 60
Changes in Behavior
I made changes in my behavior based on the last
meeting.
4.40 4.00 0.50 0 0 0 60 40 4.60 5.00 0.50 0 0 0 15 85
Note. MAP = Motivational, Assessment, and Planning, AP = Action Planning; 1=Strongly Disagree, 2 = Disagree, 3 = Neither Agree
Nor Disagree, 4 = Agree 5=Strongly Agree.
Table 21
Descriptive Statistics of Percentage of Action Steps Completed
MAP AP n M Med SD Percent n M Med SD Percent
Scales and Items 0 1 2 0 1 2
Percentage of Action Steps Completed 0.70 0.83 0.24 0.75 0.75 0.24
Step 1 20 1.55 2.00 0.67 10 25 65 20 1.66 2.00 0.49 0 35 65
Step 2 20 1.45 2.00 0.69 10 35 55 20 1.50 2.00 0.61 5 40 55
Step 3 18 1.22 1.00 0.65 11 55 33 20 1.35 2.00 0.81 20 25 55
Step 4 0 . . . . . . 2 1.50 1.50 0.71 0 50 50
Note. MAP = Motivational, Assessment, and Planning, AP = Action Planning; For Steps 1 to 4, a score of 0 is assigned if participant
had made “no progress”, a score of 1 is assigned for some “progress”, and a score of 2 is assigned for “completed”. The number of
steps for each action plan range from 1 to 4. In summary, if a participant had a score of 4 out of total possible score of 6 (i.e., 3 steps
in action plan), he or she will be considered to have made 0.67 (4/6 x 100%) towards his or her goal.

102
Table 22
Descriptive Statistics of Student Acceptability
MAP AP α M Med SD Percent α M Med SD Percent
Scales and Items 1 2 3 4 5 1 2 3 4 5
Student Acceptability 0.78 4.64 4.75 0.40 0.73 4.60 4.67 0.41
1. I would recommend the meeting
to other students.
4.70 5.00 0.47 0 0 0 30 70 4.65 5.00 0.49 0 0 0 35 65
2. I felt comfortable during this
meeting.
4.65 5.00 0.59 0 0 5 25 70 4.70 5.00 0.57 0 0 5 20 75
3. The materials presented were
helpful.
4.70 5.00 0.47 0 0 0 30 70 4.45 4.00 0.51 0 0 0 55 45
Note. MAP = Motivational, Assessment, and Planning, AP = Action Planning; 1=Strongly Disagree, 2 = Disagree, 3 = Neither Agree
Nor Disagree, 4 = Agree 5=Strongly Agree.

103
simple reflection is considered fair and 50% is considered good. As shown on table 23, MAP
meetings have higher mean percentage of complex to simple reflection (S = 105, N = 20, p
< .0001) that is considered good (M = 56%). On the other hand, AP meetings have lower mean
percentage of complex to simple reflection that is not even considered fair (M = 25%). Finally, a
1:1 reflection-to-question ratio is considered fair and a 2:1 ratio is considered is good. MAP
meetings have higher mean ratio (S = 74, N = 20, p = .004) that is considered fair (M = 1.15),
whereas AP meetings have lower mean ratio that is not considered fair or good (M = 0.90). Table
23 describes the mean, median, standard deviation, and score distributions of these indicators.
Measure reliability. Cronbach’s alphas were computed to explore the internal reliability
of all variables in this study. According to Nunnally (1978), a reliability of .70 or higher is
considered sufficient. Following this guideline, cronbach alpha values were sufficient for
confidence to change (MAP α = .70; AP α = .81), coach therapeutic alliance (MAP α = .97; AP α
= .92), goal attainment (combining all four indicators; MAP α = .70; AP α = .81), student
acceptability (MAP α = .78; AP α = .73), and level of MI quality (global dimensions: MAP α
= .85; AP α = .75; proficiency thresholds: MAP α = .77; AP α = .76). On the other hand,
Cronbach’s alpha values were in the lower range (between .50 and .69) for importance to change
(MAP α = .55; AP α = .44) and student therapeutic alliance (MAP α = .67; AP α = .68). As both
composites have few items (3 for importance to change; 5 for student therapeutic alliance), a
lower Cronbach’s alpha value is expected. Cronbach’s alphas were included in Tables 18 to 23
as appropriate.
Correlations. Pearson Correlation Coefficients (detailed in tables 24 and 25) were
computed in SAS 9.4 statistical software (SAS Institute, 2013) to explore the relationships
between all variables for MAP and AP meetings. The relationship between importance of and

104
Table 23
Descriptive Statistics of Motivational Interviewing Treatment Integrity (MITI) Scores
MAP AP α M Med SD Percent α M Med SD Percent
Indicators of MI Quality 1 2 3 4 5 1 2 3 4 5
Global Dimensions 0.85 0.75
Cultivating Change Talk 3.90 4.00 0.55 0 5 5 85 5 2.45 2.00 0.60 0 60 35 5 0
Softening Sustain Talk 3.80 4.00 0.52 0 5 10 85 0 2.65 3.00 0.59 0 40 55 5 0
Partnership 3.95 4.00 0.60 0 0 20 65 15 2.80 3.00 0.52 0 25 70 5 0
Empathy 4.00 4.00 0.79 0 5 15 75 5 3.00 3.00 0.92 0 35 35 25 5
Proficiency Thresholds 0.77 0.76
Technical Global 3.85 4.00 0.49 2.55 2.50 0.54
Relational Global 3.98 4.00 0.64 2.90 2.75 0.60
Percentage of Complex to Simple
Reflections
0.56 0.57 0.12 0.25 0.24 0.10
Reflections-to-Questions Ratio 1.15 1.13 0.23 0.90 0.94 0.29
Note. For cultivating change talk, softening sustain talk, partnership, and empathy, scale from 1 = Low to 5 = High was used. Details
on response options were included as Appendix P. For technical global, a score of 3 is considered fair, 4 is good; for relational global,
a score of 3.5 is fair, 4 is good; for percentage of complex to simple reflection, 40% is fair, 50% is good; for reflection-to-question
ratio, 1:1 is fair, 2:1 is good. Adapted from Moyers, T.B., Manuel, J.K., & Ernst, D. (2014). Motivational Interviewing Integrity
Coding Manual 4.2. Unpublished manual.

105
confidence to change is significant (p <.05) for both MAP and AP, with a strong positive
relationship (r = .57 and .63, respectively). This means that higher levels of importance of
change tend to co-occur with more confidence to change, and vice versa. The relationship
between importance to change and student acceptability is also significant (p <.05) for both MAP
and AP with strong positive relationships (r = .59, .65), meaning higher levels of importance to
change tend to co-occur with greater student acceptability of the meeting. The relationship
between importance to change and student-reported therapeutic alliance is also significant (p
<.05) for both MAP and AP, with medium to strong positive relationships (r = .49, .61), meaning
higher level of importance of change tend to co-occur with higher level of therapeutic alliance.
The relationship between importance of change and perceived progress towards goal is
significant (p <.05) only for AP, with a medium positive relationship (r = .49). Within the AP
condition, higher scores on importance of change tend to co-occur with perceived progress
towards goal, and vice versa.
For MAP meetings, the relationship between confidence to change and student-report of
therapeutic alliance is significant (p < .05) with a strong positive relationship (r = .61). This
suggests that higher confidence to change co-occurs with higher therapeutic alliance. For AP
meetings, the relationships between confidence to change and several variables are significant (p
< .05), namely with student acceptability, student-report therapeutic alliance, GAS, progress
towards goal, and behavior change. The relationships were strong and positive (student
acceptability, r = .76; student-report therapeutic alliance, r = .77; GAS, r = .64; progress towards
goal, r = .53; behavior change, r = .65).

106
The relationship between student acceptability and coach-report therapeutic alliance in
MAP meetings is significant (p < .05) with a strong positive relationship (r = .66). This suggests
that higher student satisfaction tends to co-occur with coach-reported therapeutic alliance. For
AP meetings, the relationships between student satisfaction and several variables are significant
(p < .05), namely with student-report therapeutic alliance, GAS, progress towards goal, behavior
change, and percentage of steps completed. The relationships were strong and positive (student-
report therapeutic alliance, r = .52; GAS, r = .55; progress towards goal, r = .58; behavior
change, r = .71; percentage of steps completed, r = .58).
The relationship between student-report therapeutic alliance and behavior change is
significant (p <.05) for both MAP and AP, with a moderate positive relationship (r = .45
and .47). This means that the higher student-report therapeutic alliance tends to co-occur with
participants’ change in behavior.
The four indicators of goal attainment also shared some significant relationships. For
MAP meetings, the relationships between GAS and two other indicators are significant (p < .05),
namely with progress towards goals and percentage of steps completed. The relationships were
strong and positive (progress towards goals, r = .63; percentage of steps completed, r = .59). For
AP meetings, the relationships between GAS and two other indicators are significant (p < .05),
namely with progress towards goals and behavior change. The relationships were strong and
positive (progress towards goals, r = .78; behavior change, r = .52). In addition, the relationship
between progress towards goal and percentage of steps completed is also significant (p < .05),
but only in AP meetings. The relationship is strong and positive (r = .54). Lastly, the relationship
between behavior changes and percentage of completed steps is significant (p <.05) for both

107
MAP and AP, with a moderate to strong positive relationship (r = .45, .60). This means that
higher perceived change in behavior tend to co-occur with higher percentage of steps completed.
Research question 1. Does participation in the MAP intervention result in better
outcomes compared to participation in the AP intervention among at-risk 9th grade students in
accelerated curricula? Outcomes include (a) importance of change, (b) confidence to change, (c)
therapeutic alliance, and (d) goal attainment.
To answer research question 1, data on each variable were first divided into two groups
(those collected after a MAP meeting and those collected after an AP meeting). Then, the means
of each group were calculated and the mean differences between groups (MAP AP vs. AP
MAP) were computed with SAS 9.4 statistical software (SAS Institute, 2013). For goal
attainment, the four indicators were measured with different scales, thus their means were first
transformed into z-scores, then mean z-scores across the 4 items were computed for each
condition (MAP vs. AP), and the mean z-differences between MAP and AP was calculated with
SAS. Lastly, Wilcoxon Signed-Rank Tests were calculated to obtain differential statistics. The
results for each variable are explored below.
Importance of change. To explore whether participants felt higher importance of change
after MAP compared to AP meetings, a Wilcoxon Signed-Rank Test was conducted with SAS
using the univariate procedure. The test revealed a significant difference in importance of change
between MAP and AP meetings (S = 35.5, N = 20, p = 0.04), with participants reporting
significantly higher levels of importance to change after MAP compared to AP meetings.
Wilcoxon Signed Rank test revealed no significant order effect (S = -1, N = 20, p = .98). Table
26 shows each participant’s score on importance of change after each meeting, sorted by the
condition they were in (receive MAP or AP first).

108
Table 24
Correlations between All Outcome Variables after MAP
Importance Confidence
Acceptability
Student
TA
Coach
TA GAS
Progress
towards
Goal
Behavior
Change
Percentage of
Steps
Completed
Importance ___-
.57** .59** .49* .25 .03 .40 .17 .17
Confidence
- .31 .61** .03 -.18 -.13 .34 .16
Acceptability
- .42 .66** -.03 .15 -.02 .08
Student TA
- .27 .19 .05 .47* .42
Coach TA
- -.05 .12 -.15 .17
GAS
- .63** .17 .59**
Progress
towards Goal
- .03 .37
Behavior
Change
- .45*
Percentage of
Steps
Completed
-
Note. TA = Therapeutic Alliance, GAS = Goal Attainment Scale. *p < .05, ** p <.01.

109
Table 25
Correlations between All Outcome Variables after AP
Importance Confidence
Acceptability
Student
TA
Coach
TA GAS
Progress
towards
Goal
Behavior
Change
Percentage of
Steps
Completed
Importance -
.63** .65** .61** -.01 .33 .49* .40 .41
Confidence
- .76** .77** .23 .64** .53* .65** .29
Acceptability
- .52* .25 .55* .58** .71** .58**
Student TA
- .27 .37 .36 .45* .21
Coach TA
- .22 .42 .30 .42
GAS
- .78** .52* .34
Progress
towards Goal
- .41 .54*
Behavior
Change
- .60**
Percentage of
Steps
Completed
-
Note. TA = Therapeutic Alliance, GAS = Goal Attainment Scale. *p < .05, ** p <.01.

110
Table 26
Differences between Importance of Change after MAP vs. AP
Participant Condition MAP AP Differences
(MAP-AP)
3 1 4.33 5.00 -0.67
4 1 4.33 4.67 -0.33
13 1 4.67 5.00 -0.33
11 1 5.00 4.67 0.33
12 1 4.67 4.33 0.33
14 1 5.00 4.67 0.33
15 1 4.67 4.33 0.33
5 1 4.67 4.00 0.67
10 1 5.00 4.33 0.67
18 1 5.00 4.33 0.67
Condition 1 M 4.73 4.53 0.20
17 2 4.67 5.00 -0.33
1 2 4.33 4.33 0.00
6 2 5.00 5.00 0.00
7 2 4.00 4.00 0.00
9 2 4.00 4.00 0.00
16 2 5.00 5.00 0.00
19 2 4.67 4.33 0.33
20 2 4.67 4.33 0.33
2 2 5.00 4.33 0.67
8 2 5.00 4.33 0.67
Condition 2 M 4.63 4.67 -0.04
Overall M 4.68 4.50 0.18
Overall Med 4.67 4.33
Overall SD 0.33 0.35
Note. MAP = Motivation, Assessment, and Planning, AP = Action Planning; For condition, 1 =
MAP to AP, 2 = AP to MAP. 1=Strongly Disagree, 2 = Disagree, 3 = Neither Agree Nor
Disagree, 4 = Agree 5=Strongly Agree.

111
Confidence to change. A Wilcoxon Signed-Rank Test was conducted with SAS using
the univariate procedure to explore the differences in confidence to change after MAP compared
to AP meetings. The test revealed that the difference in confidence to change between MAP and
AP meetings (S = 1, N = 20, p = 0.99) is not significant. Wilcoxon Signed Rank test revealed no
significant order effect (S = -7.5, N = 20, p = .35). Table 27 shows each participant’s score on
confidence to change after each meeting, sorted by whether they received MAP or AP first.
Student-reported therapeutic alliance. To explore whether participants reported higher
therapeutic alliance after MAP compared to AP meetings, a Wilcoxon Signed-Rank Test was
conducted with SAS using the univariate procedure. The test indicated the difference was not
statistically significant (S = 4.5, N = 20, p = 0.64). However, Wilcoxon Signed Rank test
revealed a significant difference between student-reported therapeutic alliance scores at two time
points (S = -18.5, N = 20, p = .03), which suggests an order effect in which participants reported
higher therapeutic alliance after their second meeting, no matter what intervention they received
at that meeting. Table 28 shows each participant’s score on therapeutic alliance after each
meeting, sorted by the condition they were assigned to (receive MAP or AP first).
Coach-reported therapeutic alliance. A Wilcoxon Signed-Rank Test was conducted with
SAS using the univariate procedure to discover any differences in coach-reported therapeutic
alliance after MAP compared to AP meetings. The test revealed a significant difference (S = 95,
N = 20, p < .0001), specifically that the coach reported significantly higher therapeutic alliance
during MAP compared to AP meetings. Wilcoxon Signed Rank test revealed no significant order
effect (S = -23.5, N = 20, p = .36). Table 29 shows the therapeutic alliance score coach reported
after each meeting, sorted by the condition in which participants were assigned to.

112
Table 27
Differences between Confidence to Change after MAP vs. AP
Participant Condition MAP AP Differences
(MAP-AP)
3 1 4.33 5.00 -0.67
15 1 4.00 4.33 -0.33
5 1 4.00 4.00 0.00
10 1 5.00 5.00 0.00
11 1 5.00 5.00 0.00
12 1 4.00 4.00 0.00
13 1 5.00 5.00 0.00
14 1 4.67 4.67 0.00
18 1 4.33 4.33 0.00
4 1 4.67 4.33 0.33
Condition 1 M 4.50 4.57 -0.07
2 2 4.00 4.67 -0.67
9 2 3.33 3.67 -0.33
1 2 4.33 4.33 0.00
6 2 5.00 5.00 0.00
7 2 3.67 3.67 0.00
16 2 5.00 5.00 0.00
17 2 4.33 4.33 0.00
19 2 4.67 4.33 0.33
20 2 4.33 3.67 0.67
8 2 4.00 2.67 1.33
Condition 2 M 4.27 4.13 0.14
M 4.38 4.35 0.03
Med 4.33 4.33
SD 0.49 0.62
Note. MAP = Motivation, Assessment, and Planning, AP = Action Planning; For condition, 1 =
MAP to AP, 2 = AP to MAP. 1=Strongly Disagree, 2 = Disagree, 3 = Neither Agree Nor
Disagree, 4 = Agree 5=Strongly Agree.

113
Table 28
Differences between Student-Report Therapeutic Alliance after MAP vs. AP
Participant Condition MAP AP Differences
(MAP-AP)
18 1 4.00 4.80 -0.80
5 1 4.40 4.60 -0.20
11 1 4.80 5.00 -0.20
3 1 5.00 5.00 0.00
4 1 5.00 5.00 0.00
10 1 5.00 5.00 0.00
12 1 4.60 4.60 0.00
13 1 5.00 5.00 0.00
14 1 5.00 5.00 0.00
15 1 5.00 5.00 0.00
Condition 1 M 4.78 4.90 -0.12
7 2 4.00 4.20 -0.20
9 2 4.00 4.20 -0.20
1 2 4.40 4.40 0.00
6 2 5.00 5.00 0.00
16 2 4.80 4.80 0.00
17 2 4.60 4.60 0.00
2 2 4.80 4.40 0.40
19 2 4.80 4.40 0.40
8 2 5.00 4.20 0.80
20 2 4.80 4.00 0.80
Condition 2 M 4.62 4.42 0.20
M 4.70 4.66 0.04
Med 4.80 4.70
SD 0.36 0.34
Note. MAP = Motivation, Assessment, and Planning, AP = Action Planning; For condition, 1 =
MAP to AP, 2 = AP to MAP. 1 = Not at all, 2 = Only a little, 3 = Somewhat, 4 = Quite a bit, 5 =
Totally.

114
Table 29
Differences between Coach-Report Therapeutic Alliance after MAP vs. AP
Participant Condition MAP AP Differences
(MAP-AP)
18 1 5.00 5.00 0.00
13 1 3.83 3.67 0.17
14 1 4.00 3.33 0.67
5 1 4.00 2.83 1.17
11 1 4.00 2.67 1.33
10 1 5.00 3.50 1.50
15 1 5.00 3.50 1.50
4 1 5.00 3.17 1.83
12 1 4.83 3.00 1.83
3 1 5.00 3.00 2.00
Condition 1 M 4.57 3.37 1.20
2 2 5.00 4.00 1.00
7 2 4.00 3.00 1.00
1 2 4.17 2.67 1.50
19 2 5.00 3.33 1.67
9 2 4.50 2.67 1.83
17 2 5.00 3.17 1.83
6 2 5.00 3.00 2.00
20 2 5.00 2.83 2.17
8 2 5.00 2.67 2.33
16 2 5.00 2.67 2.33
Condition 2 M 4.77 3.00 1.77
M 4.67 3.18 1.49
Med 5.00 3.00
SD 0.47 0.57
Note. MAP = Motivation, Assessment, and Planning, AP = Action Planning; For condition, 1 =
MAP to AP, 2 = AP to MAP. Two out of the five items used the scale of 1 = Very poor, 2 =
poor, 3 = satisfactory, 4 = good, 5 = excellent; the other three items used the scale of 1=Strongly
Disagree, 2 = Disagree, 3 = Neither Agree Nor Disagree, 4 = Agree 5=Strongly Agree.

115
Goal attainment. To explore whether participants made more progress in their action
plans after MAP compared to AP meetings, a Wilcoxon Signed-Rank Test was conducted with
SAS using the univariate procedure. The test was performed on the composite variable that
include all four indicators of goal attainment (i.e., GAS, progress towards goal, changes in
behavior, and percentage of action steps completed). The test resulted in a non-significant
difference (S = -29, N = 20, p = 0.30). Table 30 demonstrate participants’ z-scores on the
composite variable, sorted by the condition they were in (received MAP or AP first). As there are
four indicators of goal attainment, Tables 31 to 34 show each participant’s score on each
indicator. Wilcoxon Signed Rank tests also revealed that there is a significant difference between
participants’ perceived progress towards goal (one of the four indicators) at time 1 and 2 (after
meeting 1 compared to after meeting 2; S = -18, N = 20, p = .04). This suggests that an order
effect occurred, in which participants felt that they have made more progress towards after their
second meeting, no matter which intervention they received at that meeting. In contrast,
Wilcoxon Signed Rank test revealed no significant order effects for the other three indicators:
Goal Attainment Scaling (S = -24, N = 20, p = .06), perceived change in behavior (S = 9, N = 20,
p = .29), and percentage of actions steps completed (S = 13.5, N = 20, p = .57).
Research question 2. Does participation in the MAP intervention results in better
acceptability compared to participation in the Action Planning intervention (planning only)
among at-risk 9th grade students in accelerated curricula? To answer research question 2, both
quantitative and qualitative data were utilized.
Quantitative analyses. For quantitative analysis, data on student satisfaction were first
divided into two groups (those collected after a MAP meeting and those collected after an AP
meeting). Then, the means of each group was calculated. Next, the mean differences between

116
Table 30
Differences between Goal Attainment (Composite) after MAP vs. AP
Participant Condition MAP AP Differences
(MAP-AP)
3 1 0.66 0.65 0.01
12 1 -0.19 -1.28 1.09
15 1 0.47 -0.13 0.60
5 1 -0.88 -0.87 -0.02
13 1 0.19 0.27 -0.08
11 1 0.47 0.83 -0.36
4 1 -1.74 -1.35 -0.39
14 1 0.47 1.18 -0.72
10 1 -0.03 0.89 -0.92
18 1 -0.96 0.89 -1.85
Condition 1 M -0.15 0.10 -0.25
1 2 -0.73 0.23 -0.96
17 2 -1.11 1.05 -2.16
16 2 -0.71 0.39 -1.09
2 2 0.69 1.05 -0.36
6 2 0.89 0.94 -0.05
20 2 0.23 0.12 0.11
7 2 -0.57 -0.69 0.12
19 2 0.24 -0.18 0.42
9 2 -0.09 -0.69 0.60
8 2 0.07 -0.66 0.73
Condition 2 M -0.11 0.15 -0.26
M -0.13 0.13 -0.26
Med 0.02 0.25
SD 0.71 0.82
Note. MAP = Motivation, Assessment, and Planning, AP = Action Planning; For condition, 1 =
MAP to AP, 2 = AP to MAP.

117
Table 31
Differences between Goal Attainment Scaling after MAP vs. AP
Participant Condition MAP AP Differences
(MAP-AP)
18 1 -1 1 -2
11 1 1 2 -1
13 1 0 1 -1
14 1 1 2 -1
3 1 1 1 0
4 1 -1 -1 0
5 1 0 0 0
10 1 1 1 0
12 1 0 -1 1
15 1 1 0 1
Condition 1 M 0.30 1.08 -0.78
17 2 0 1 -1
1 2 1 1 0
6 2 1 1 0
16 2 0 0 0
20 2 1 1 0
2 2 2 1 1
7 2 1 0 1
9 2 1 0 1
19 2 1 -1 2
8 2 1 -2 3
Condition 2 M 0.90 0.20 0.70
M 0.60 0.40 0.20
Med 1.00 1.00
SD 0.75 1.05
Note. MAP = Motivation, Assessment, and Planning, AP = Action Planning; For condition, 1 =
MAP to AP, 2 = AP to MAP. 2 = much more than expected, 1 = more than expected, 0 =
expected level of progress, -1 = less than expected, -2 = much less than expected.

118
Table 32
Differences between Progress Towards Goal after MAP vs. AP
Participant Condition MAP AP Differences
(MAP-AP)
4 1 2.00 4.00 -2.00
3 1 4.00 5.00 -1.00
10 1 4.00 5.00 -1.00
11 1 4.00 5.00 -1.00
13 1 4.00 5.00 -1.00
14 1 4.00 5.00 -1.00
18 1 4.00 5.00 -1.00
5 1 4.00 4.00 0.00
12 1 4.00 4.00 0.00
15 1 4.00 4.00 0.00
Condition 1 M 3.80 4.60 -0.80
17 2 4.00 5.00 -1.00
1 2 4.00 4.00 0.00
2 2 5.00 5.00 0.00
6 2 5.00 5.00 0.00
7 2 4.00 4.00 0.00
9 2 4.00 4.00 0.00
16 2 4.00 4.00 0.00
19 2 4.00 4.00 0.00
20 2 5.00 5.00 0.00
8 2 5.00 4.00 1.00
Condition 2 M 4.40 4.40 0.00
M 4.10 4.50 -0.40
Med 4.00 4.50
SD 0.64 0.51
Note. MAP = Motivation, Assessment, and Planning, AP = Action Planning; For condition, 1 =
MAP to AP, 2 = AP to MAP. 1=Strongly Disagree, 2 = Disagree, 3 = Neither Agree Nor
Disagree, 4 = Agree 5=Strongly Agree.

119
Table 33
Differences between Changes in Behavior after MAP vs. AP
Participant Condition MAP AP Differences
(MAP-AP)
10 1 4.00 5.00 -1.00
18 1 4.00 5.00 -1.00
3 1 5.00 5.00 0.00
4 1 4.00 4.00 0.00
5 1 4.00 4.00 0.00
11 1 5.00 5.00 0.00
14 1 5.00 5.00 0.00
15 1 5.00 5.00 0.00
12 1 5.00 4.00 1.00
13 1 5.00 4.00 1.00
Condition 1 M 4.60 4.60 0.00
1 2 4.00 5.00 -1.00
2 2 4.00 5.00 -1.00
16 2 4.00 5.00 -1.00
17 2 4.00 5.00 -1.00
6 2 5.00 5.00 0.00
7 2 4.00 4.00 0.00
8 2 4.00 4.00 0.00
9 2 4.00 4.00 0.00
19 2 5.00 5.00 0.00
20 2 4.00 4.00 0.00
Condition 2 M 4.20 4.60 -0.40
M 4.40 4.60 -0.30
Med 4.00 5.00
SD 0.50 0.50
Note. MAP = Motivation, Assessment, and Planning, AP = Action Planning; For condition, 1 =
MAP to AP, 2 = AP to MAP. 1=Strongly Disagree, 2 = Disagree, 3 = Neither Agree Nor
Disagree, 4 = Agree 5=Strongly Agree.

120
Table 34
Differences between Percentage of Action Steps Completed after MAP vs. AP
Participant Condition MAP AP Differences
(MAP-AP)
18 1 0.50 1.00 -0.50
5 1 0.33 0.50 -0.17
10 1 0.83 1.00 -0.17
14 1 0.83 1.00 -0.17
13 1 0.83 0.83 0.00
15 1 0.83 0.83 0.00
4 1 0.50 0.38 0.13
3 1 1.00 0.83 0.17
12 1 0.50 0.33 0.17
11 1 0.83 0.67 0.17
Condition 1 M 0.70 0.72 -0.02
17 2 0.25 1.00 -0.75
8 2 0.67 1.00 -0.33
16 2 0.67 1.00 -0.33
1 2 0.33 0.50 -0.17
2 2 1.00 1.00 0.00
7 2 0.50 0.50 0.00
19 2 0.83 0.83 0.00
6 2 1.00 0.88 0.13
20 2 0.83 0.50 0.33
9 2 1.00 0.50 0.50
Condition 2 M 0.71 0.79 -0.08
M 0.70 0.75 -0.05
Med 0.83 0.75
SD 0.24 0.24
Note. MAP = Motivation, Assessment, and Planning, AP = Action Planning; For condition, 1 =
MAP to AP, 2 = AP to MAP. A score of 0 is assigned if participant had made “no progress”, a
score of 1 is assigned for some “progress”, and a score of 2 is assigned for “completed”. The
number of steps for each action plan range from 1 to 4. In summary, if a participant had a score
of 4 out of total possible score of 6 (i.e., 3 steps in action plan), he or she will be considered to
have made 67% (4/6 x 100%) towards his or her goal.

121
groups (MAP – AP) were computed with SAS. Lastly, Wilcoxon Signed-Rank Tests were
calculated to obtain differential statistics. The test revealed a non-significant difference (S =
14.5, N = 20, p = 0.47) between student satisfaction after MAP compared to AP meetings.
Wilcoxon Signed Rank test also revealed non-significant order effects (S = -2, N = 20, p = .90).
Tables 35 shows each participant’s rating, sorted by the whether they received MAP or AP first.
Qualitative analyses. In this study, participants provided written and verbal responses on
their perceptions on the acceptability of meetings. To analyze the qualitative data generated from
the open-ended questions on feedback form (written responses) and exit interviews (verbal
responses), the author utilized the constant-comparative method (Strauss & Corbin, 1990). First,
the author typed or transcribed participants’ responses into a Word document. Then, she read the
responses over and over again while highlighting repetitive keywords. While she immersed
herself in the data, she derived key themes and described them below. The one criterion for
theme formation is that the sentiment must be voiced by more than one participant.
Written feedback. Participants were asked to provide written responses to open-ended
questions after each meeting. The questions were “What part of the meeting did you find most
interesting or useful?,” “What are the good and bad parts of the meeting (after first meeting
only)?,” “Please describe differences between the extra support you experienced today
compared to our last meeting (after meeting two only)?,” and “Additional comments and
suggestions.”
For the first question regarding the most interesting or useful part of meeting, four themes
emerged through analyses. Specifically, participants felt that (a) action planning, (b) comparing
level of coping and engagement to other students on the graph, (c) recognizing weaknesses, and

122
Table 35
Differences between Student Satisfaction after MAP vs. AP
Participant Condition MAP AP Differences
(MAP-AP)
13 1 3.75 5.00 -1.25
10 1 4.75 5.00 -0.25
11 1 4.50 4.75 -0.25
3 1 5.00 5.00 0.00
12 1 4.25 4.25 0.00
14 1 5.00 5.00 0.00
15 1 4.75 4.75 0.00
4 1 4.75 4.25 0.50
5 1 4.50 4.00 0.50
18 1 5.00 4.50 0.50
Condition 1 M 4.63 4.63 0.00
1 2 4.25 4.50 -0.25
9 2 4.00 4.25 -0.25
2 2 4.75 4.75 0.00
6 2 5.00 5.00 0.00
16 2 5.00 5.00 0.00
19 2 4.75 4.75 0.00
7 2 4.00 3.75 0.25
20 2 4.75 4.50 0.25
17 2 5.00 4.50 0.50
8 2 5.00 4.00 1.00
Condition 2 M 4.65 4.57 0.08
M 4.64 4.60 0.04
Med 4.75 4.67
SD 0.40 0.41
Note. MAP = Motivation, Assessment, and Planning, AP = Action Planning; For condition, 1 =
MAP to AP, 2 = AP to MAP. 1 = Strongly Disagree, 2 = Disagree, 3 = Neither Agree Nor
Disagree, 4 = Agree 5=Strongly Agree.

123
(d) discussing impacts of previous plan were the most helpful part of their meetings. To reveal
any differences in terms of how participants view MAP compared to AP meetings, the author
counted the number of participants who expressed sentiments related to each theme after each
meeting. Table 36 provides the full written responses from all participants, sorted into themes
and type of meeting. As shown in the table, 10 participants wrote that action planning was the
most useful part after completing a MAP meeting, whereas 12 participants expressed the same
sentiment after completing an AP meeting. Five participants felt that the part where they were
able to review individualized graph was the most helpful after a MAP meeting, while three felt
the same way after an AP meeting. Three participants appreciated the opportunity to review their
own weaknesses after MAP meeting, and four participants expressed the same thought after an
AP meeting. Lastly, one participant shared that discussing the impacts of pervious plan was most
helpful after attending a MAP meeting, whereas three participants shared the same opinion after
attending an AP meeting. Overall, it seemed like there are roughly the same number of
participants writing similar comments after each type of meeting. It is also noteworthy that for
some participants, the same theme emerged after each meeting, regarding of MI skill emphasis.
For the second question (good and bad parts of the meeting), the author found five
themes. Note that this question is only asked after participants’ first meeting. This is because at
that time point (after the first meeting), participants have yet to receive the other condition (MAP
or AP), thus unable to provide insights on perceived differences between MAP and AP. The
author designed this question to at least collect some data on student satisfaction at that time
point. Participants shared that some good parts of the meetings include discussing goals and
plans as well as feeling supported by coach. Many also reported no bad parts, whereas some felt
that admitting weaknesses and being away from class were not ideal. Similar to the first question,

124
Table 36
Themes for Most Interesting or Useful Part of Meetings
Action planning is the most useful/interesting part of meetings
Participant MAP (n = 10) AP (n = 12)
1 Making the plan because I will be able
to use it.
Making a schedule to put more effort
into schoolwork.
2 The making a plan part because she has
shown me what I can do and improve
on.
Making a plan because it helped me
decide how to tackle this challenge.
3 Coming up with the action plan. The part of the meeting I found most
useful was coming up and creating
the action plan I need to take to reach
my goal.
4 Making a plan was very helpful to me
because it motivated me to do the things
I need to get done.
I liked the part of making a plan, so I
know what I have to do and when.
6 When we were talking about ways to
stick with positive thinking.
8 Discussing ways to overcome my
problem.
Talking about coping strategies for
my anxiety.
9 I found it useful to think of new
strategies on how to deal with anxiety
and stress, instead of me ignoring it.
10 I found the solutions most interesting
and useful.
11 Making the plan was most useful.
13 I found the part about discussing how I
could get myself to join Robotics the
most interesting.
The part where we came up with a
new plan for me becoming less
independent and learning different
ways to deal with problem.
14 Discussing my strengths, how I
compared to other AP students, and
discussing how I can overcome this
constant struggle of negative thinking.
Talking about my problem and ways
to overcome it. I like that my problem
was discussed, and I understood.
15 Talking about the smaller goals that I
can accomplish to achieve my larger
goals.
16 Being able to figure out how to reach
my goal.
18 Putting the options into steps that I
can follow through with minimal
consequences.
19 Being able to express my goal and
making steps to reach it.
Being able to talk about how I can fix
my problem.

125
Table 36 (Continued)
Comparing level of coping and engagement to other students on the graph is the most
useful/interesting part of meetings
Participant MAP (n = 5) AP (n = 3)
5 The strengths and weaknesses that came
out on the graph.
11 Using and looking at the chart where I
was in comparison to other students.
12 Looking at my results because it really
showed me what needed improvement.
14 Discussing my strengths, how I
compared to other AP students, and
discussing how I can overcome this
constant struggle of negative thinking.
Talking about my problem and ways
to overcome it. I like that my problem
was discussed, and I understood.
16 Seeing my chart really showed me
what I need to work on.
18 The part where we talked about my
score compared to others.
20 The part where my coach showed me
my results on the test I did back then.
Recognizing weaknesses is the most useful/interesting part of meetings
Participant MAP (n = 3) AP (n = 4)
5 Vocalizing what I need to do.
7 We went into a subject I didn't realize I
had a problem in.
The part where we talked about how I
was trying less in school.
9 I found it useful to think of new
strategies on how to deal with anxiety
and stress, instead of me ignoring it.
I was interested in the fact that I've
addressed something I've been
ignoring.
10 When we talked about my ineffective
coping styles because it helped me
understand why I need to improve.
14 Talking about my problem and ways
to overcome it. I like that my problem
was discussed, and I understood.
Discussing impacts of previous plan is the most useful/interesting part of meetings
Participant MAP (n =1) AP (n = 3)
6 When we talked about how much has
changed in my life after I committed to
my goals
.
12 Discovering my talent and opening
up to something new.
15 Revisiting the past meeting made me
feel confident about my progress
towards my goal.
Note. Some written responses relate to more than one theme, and the author included those
responses more than once in this table.

126
the author counted the number of participants who expressed sentiments related to each theme in
an attempt to discern any differences between how participants feel about MAP compared to AP
meetings. Table 37 provides the full written responses from all participants, sorted into themes
and type of meeting. Five participants wrote that the good part of their MAP meetings was
discussing goals and plans; six participants wrote similar comments after their AP meetings.
Participant 10 (MAP meeting) and participant 19 (AP meeting) shared that being supported by
the coach was the good part. Moreover, 9 participants (4 from MAP, 5 from AP) felt that there
were no bad parts throughout their meetings. Two participants who went through the MAP
meeting did not like facing their weaknesses, so did 2 other participants who went through the
AP meeting. Lastly, 2 participants thought the bad part of their MAP meetings were that the
meetings took away class time. One other participant who went through the AP meetings also
thought that being away from class for the meeting is not ideal. In sum, it seemed like there were
no clear differences in how participants view MAP compared to AP meetings based on the
results on this qualitative analysis.
For the third question (differences between the two meetings), five themes emerged by
using the constant-comparative method (Strauss & Corbin, 1990). It is noteworthy that this
question is only asked after participants’ second meeting. At this time point (after the second
meeting), participants had completed both MAP and AP meetings, thus able to provide data to
answer the research question directly (i.e., whether participants felt that MAP or AP was more
acceptable). The first theme is that participants (n = 6; 4 from MAP 2 from AP) felt that they are
more connected to the coach (i.e., higher therapeutic alliance) after their second meeting (see
Table 38 for participants’ comments sorted by themes), which is consistent with the quantitative
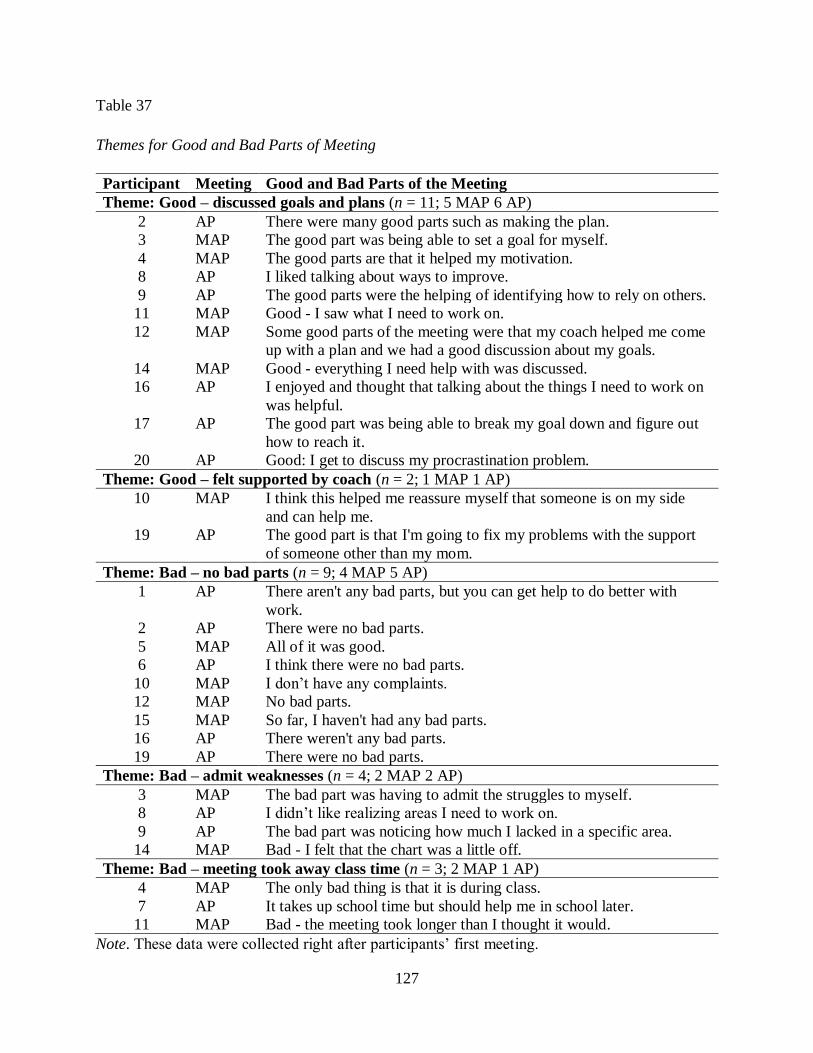
127
Table 37
Themes for Good and Bad Parts of Meeting
Participant Meeting Good and Bad Parts of the Meeting
Theme: Good – discussed goals and plans (n = 11; 5 MAP 6 AP)
2 AP There were many good parts such as making the plan.
3 MAP The good part was being able to set a goal for myself.
4 MAP The good parts are that it helped my motivation.
8 AP I liked talking about ways to improve.
9 AP The good parts were the helping of identifying how to rely on others.
11 MAP Good - I saw what I need to work on.
12 MAP Some good parts of the meeting were that my coach helped me come
up with a plan and we had a good discussion about my goals.
14 MAP Good - everything I need help with was discussed.
16 AP I enjoyed and thought that talking about the things I need to work on
was helpful.
17 AP The good part was being able to break my goal down and figure out
how to reach it.
20 AP Good: I get to discuss my procrastination problem.
Theme: Good – felt supported by coach (n = 2; 1 MAP 1 AP)
10 MAP I think this helped me reassure myself that someone is on my side
and can help me.
19 AP The good part is that I'm going to fix my problems with the support
of someone other than my mom.
Theme: Bad – no bad parts (n = 9; 4 MAP 5 AP)
1 AP There aren't any bad parts, but you can get help to do better with
work.
2 AP There were no bad parts.
5 MAP All of it was good.
6 AP I think there were no bad parts.
10 MAP I don’t have any complaints.
12 MAP No bad parts.
15 MAP So far, I haven't had any bad parts.
16 AP There weren't any bad parts.
19 AP There were no bad parts.
Theme: Bad – admit weaknesses (n = 4; 2 MAP 2 AP)
3 MAP The bad part was having to admit the struggles to myself.
8 AP I didn’t like realizing areas I need to work on.
9 AP The bad part was noticing how much I lacked in a specific area.
14 MAP Bad - I felt that the chart was a little off.
Theme: Bad – meeting took away class time (n = 3; 2 MAP 1 AP)
4 MAP The only bad thing is that it is during class.
7 AP It takes up school time but should help me in school later.
11 MAP Bad - the meeting took longer than I thought it would.
Note. These data were collected right after participants’ first meeting.

128
finding reported earlier in this section (significant order effect; S = -18.5, N = 20, p = .03). In
contrast, only two participants (both received MAP first) shared that their level of comfort
remained the same throughout both meetings. In addition, three participants (all received AP)
reported higher increase in progress towards goal after the second meeting compared to the first
meeting. This supports the finding of an order effect in progress towards goal (S = -18, N = 20, p
= .04), in which participants consistently reported higher progress towards goal after their second
meeting no matter which condition they were assigned. Another main difference that participants
(n = 5) noted is that new goals were set during the second meeting, which is consistent with the
study protocol. Two participants shared that the main difference they noticed between the
meetings is that the action plan is revised during the second meeting, which again is the result of
following the study protocol, instead of a difference between MAP and AP.
Finally, only 5 participants left comments on the last open-ended prompt, which is
“additional comments and suggestions.” Three were written after MAP meetings, two were
written after AP meetings. No themes can be generated from those responses. Table 39
demonstrates the comments as they were written by participants.
In summary, it seemed like qualitative analyses on questions 1 (most interesting or
useful), 2 (good and bad parts of meeting), and 4 (additional comments) did not reveal any
differences between student satisfaction of MAP compared to AP meetings. However, those
analyses produced interesting themes that provide context to the current study. On the other
hand, some of the qualitative results derived from question 3 (differences between meetings)
seemed to support some of the quantitative differences between MAP and AP. Specifically,

129
Table 38
Themes for Differences between Meetings (Written Feedback)
Participant Meeting Differences between Meetings
Theme: Higher therapeutic alliance in second meeting (n = 6; 4 MAP 2 AP)
6 MAP I feel like she understood more and could help me on a more
personal level
7 MAP I felt more comfortable and it was easier to talk knowing I had done
this before.
8 MAP This meeting felt more personalized to my needs.
9 MAP The strategies were changed and developed. It was more personal
such as things I like/want to do when I'm older.
11 AP This meeting went by faster because my coach knew more about me.
13 AP We went further into things related to me and my struggles. Last
time, the majority of the time was spent on coming up with them
rather than discussing them.
Theme: New goals were set (n = 5; 4 MAP 1 AP)
1 MAP I now will get better at 2 factors and not just 1.
2 MAP Well she congratulated me on what I have achieved with my other
goals and we set more goals.
9 MAP The strategies were changed and developed. It was more personal
such as things I like/want to do when I'm older.
10 AP Our last meeting was checking up on my progress and this meeting
was the same but also adding in another goal I can set for myself.
17 MAP We changed the topic from time management to positive thinking
and worked on new goals.
Theme: Increase in progress towards goal (n = 3; 3 AP)
3 AP The difference was the first time I felt a little skeptical about my plan
but today I felt very excited to try my action plan out.
4 AP Today my grades were in a much better place which allows me to
focus on this plan.
18 AP I was more relaxed and happier because I made progress on the goal
we set.
Theme: Plans were revised (n = 2; 1 MAP 1 AP)
5 AP We got to see what I did and what I don't and slightly change the
plan.
16 MAP Today we talked a lot about how I can further improve my goal that
we came up with last time.
Theme: Level of comfort remained the same (n = 2; 2 AP)
12 AP My coach was open to things I had to say, just like last time, and I
like that she is helping expand my options for success in the future.
14 AP I definitely always feel comfortable here and it relates to my last
meeting strongly.
Note. Some written responses relate to more than one theme, and the author included those
responses more than once. These data were collected right after participants’ second meeting.

130
Table 39
Additional Comments and Suggestions
Participant Meeting Additional Comments and Suggestions
1 MAP I think the plan will work.
8 MAP Very good meeting.
9 MAP In this meeting I was able to talk and get a personalized plan instead
of a generic survey.
11 AP I really enjoyed today's meeting.
15 AP I really enjoyed the meeting and can’t wait to get working on the next
part of my plan.
themes generated from analyzing the written feedback support the quantitative findings that
suggest participants reported higher therapeutic alliance and progress towards goal after their
second meeting, regardless of the type of meeting they participated in.
Exit interviews. In addition to the written responses, participants also completed an exit
interview during their third and last meeting with the coach, which took place approximately a
month after the second intervention meeting (i.e., last MAP or AP meeting, per condition
assignment). The interviews were brief (6 to 15 minutes) and involved three questions, namely
“Please describe some differences between the two meetings we had?”, “How comfortable do
you feel during the first meeting? How about during the second meeting?”, and “Anything else
about your experiences during the two meetings that you would like to share?” The questions
were similar to those on the written feedback form because the author aimed to seek verbal in
addition to written responses on similar questions. To analyze these data, the author first
transcribed the audio files into a Word document, then read the transcript multiple times while
highlighting repetitive key words. Next, the author generated themes using the constant-
comparative method (Strauss & Corbin, 1990).
For differences between MAP and AP meetings, only one theme emerged from
qualitative analyses. Nine participants shared that the first meeting felt more like the foundation,

131
whereas the second functioned to revise goals and plans. Among the 9 participants, 6 were
assigned to receive MAP first (condition 1). Table 40 displays all 9 participants’ sentiments. This
finding is consistent with the themes generated from analyzing participants’ written responses to
the same question after their second meeting. Specifically, participants shared that the main
difference between the meetings include setting new goals and revising action plans during the
second meeting.
For differences in comfort level, 14 participants (8 received MAP first) shared that they
felt more comfortable during the second meeting while 5 participants (1 received MAP first)
expressed that they felt the same during both sessions. Table 41 shows participants’ comments
sorted by themes. Similar to the trend observed in analyzing the written responses, more
participants (14 compared to 5) reported that they felt more comfortable with the coach after the
second meeting, providing some support to the existence of an order effect in which participants
feel more comfortable after the second meeting no matter to which condition they were assigned.
When author asked participants for additional comments, some (6 participants, 2 received
MAP first) shared that the meetings helped them achieve personal goals such as reducing stress
and increasing grade. Furthermore, 6 participants (2 from condition 1) also reported that they felt
supported by the coach. This finding resonates with the qualitative theme emerged from
analyzing the written responses described earlier in this chapter. Specifically, participants shared
that a good part of their meetings was being supported by the coach. Lastly, some participants (3,
all from condition 1) expressed that the meetings helped them identify areas that have room for
growth. This theme is similar to the other theme generated by written responses, which shows
that participants view recognizing weaknesses as one of the most useful part of their meetings.
Table 42 displays participants’ transcript sorted by themes.

132
Table 40
Themes for Differences between Meetings (Exit Interview)
Participant Condition Transcript
Theme: The first meeting was the foundation, the second provided opportunity to revise goals and plans (n = 9; 6 vs. 3)
2 2 I know the first one we were really just setting a goal… to see what I could do and then the second
meeting we revised the goals to make them better, to see what I can improve on after the first meeting.
4 1 The first one was a lot more on paper... answering the questions on paper, and after the first one we
actually started making plans, like plans of what I am actually going to do outside of the meeting.
5 1 The first meeting we figured out what we were going to do, and then we have like a plan. The second
meeting was more like, see what works, see what didn’t and kind of like, when you’re doing something
for the first time and you let it go, and then you see what’s wrong with it, and you go back to fix it.
9 2 The first meeting was showing the graph and looking at it all at once, I can see it with numbers and
logics and facts. The second meeting I got more in depth on why. The first one is setting goal, the second
one was on why this is happening and how to change things.
11 1 I feel like the first meeting was like… very general and the basic of what my goal was. The second
meeting was more in depth and more about the steps I need to take to reach my goal.
13 1 I remember at the first meeting we just identified a bunch of different things and we just went into the
bare basics… the second meeting is when we talked about all the things I pointed out I want to work
on... more in depth discussions about everything.
14 1 I think the first meeting really focused on the basics, like school and AP in general, and then the second
meeting got more into personal.
15 1 I notice we went more in-depth during the second meeting. The first one was kind of just brushing the
surface, talking about the overall idea and making the plan, whereas the second one was more of looking
over, going into details on how I carried it out, and add on to that.
16 2 The first one was more talking about what I need to work on, and the second one we already knew what I
need to work on and going a little more in depth.
Note. Condition 1 = MAP to AP, 2 = AP to MAP.

133
Table 41
Themes for Differences between Level of Comfort
Participant Condition Transcript
Theme: Increase in comfort during second meeting (n = 14; 8 vs. 6)
3 1 I feel a lot more comfortable during the second meeting I think, because the first meeting I didn't really
get to know you too well, and I was a little more nervous, I guess. During the second meeting I was more
willing to talk through things, talk about the problems and goals.
4 1 The first meeting I was a little nervous because I get nervous around people that I don't talk to very
often, but now I'm like pretty comfortable and not nervous anymore. It's just being around you [coach]
more and it's not scary.
6 2 Well the first meeting I was like nervous a little bit, and not very open because I didn't really know you. I
feel like the second meeting I was like "okay" now it's more comfortable. I think I'm more motivated to
like do what you said to do because I've seen that it works.
7 2 Probably more comfortable during the second one. "How so?" I don't know. Been here before, just
being in this room before, seen it.
8 2 I feel like the second meeting was better because you knew more about me, so it was more like personal.
So, I feel like that one was better because we kind of made a plan that was important, and it worked. We
went more in depth with the second meeting too.
9 2 The more meetings we have, the more comfortable I get just because… the first one was like "this is
new. What is going on?" the second one was like I'm kind of used to this. I feel like you're not an
intimidating person where I'm like freaking out, you are very nice and calm and I'm like yeah!
11 1 I generally feel more comfortable during the second meeting because I knew what was going to happen,
whereas the first meeting I didn’t know what was going to happen.
12 1 I think the first meeting I was a little confused, like what the whole experiment is about, I just didn’t
know what to expect. The second meeting I felt more comfortable and it felt better talking to you. I think
I like the second meeting better, again I was more comfortable, and I knew what I was getting myself
into. I just knew it's a positive effect on my life just in general because I know it would help me.
13 1 The first meeting I didn't know what to expect because… even though you said you were going to record
it and I said okay, but I got a little nervous, but it slowly went away. Not hard to answer the questions,
and I was able to say everything I wanted to say.

134
Table 41 (Continued)
14 1 The first meeting is… I don't know a little awkward because it's the first time I ever really get to sit down
with you and face to face talk, but then the second meeting and from there on it has just been more
comfortable because we've talked and I've shared everything with you. You've helped me through school
and personal matters.
15 1 The first meeting was a little awkward, but after that I'm pretty comfortable, because, obviously the first
time I haven't done this before and I'm not sure how this is going to go, what I have to talk about, and it
kind of made me nervous but the second one is like I got this.
18 1 The second meeting feels more natural, the first one was like "What am I going to do?" Out of 10 scale,
the first one would be 6-ish, and now I feel like a 10, cause you're a pretty cool dude.
19 2 The first time I was kind of scared, because seeing you in class is not the same as having a relationship
with you, it was weird to say "oh yeah I'm not doing too good in AP" because everyone else in my class
in doing so good. I don't know if I'm like average or I'm like low, so I kind of felt like insecure. The
second meeting I was able to open up more, so that was nice.
20 2 I'm used to it when we meet for the second time. I feel more comfortable during the second meeting.
Theme: Comfort level remained the same (n = 5; 1 vs. 4)
1 2 I just feel the same. "You just feel equally comfortable?" Yes.
2 2 I feel equally comfortable. I feel very comfortable sharing my progress and talking about areas for
growth, I'm not afraid to share that with anyone.
5 1 I feel like it is the same. I mean the first one I feel… I don't know…. Yeah pretty much the same.
16 2 I was fine during both. "No differences?" No.
17 2 Probably just as comfortable for both just because it wasn't stressful, but it wasn't super laid back either.
Note. Condition 1 = MAP to AP, 2 = AP to MAP.

135
Table 42
Additional Comments from Exit Interview
Participant Condition Transcript
Theme: The meetings helped achieve personal goals (n = 6; 2 vs. 4)
1 2 Well they worked. I get more work done. Usually I just stop working on it, but now I keep working on it.
8 2 I enjoyed them. I feel like they helped. It made me more self-aware on stuff I need to work on. I like
being able to identify things that I can work on.
14 1 Well having that connection with my parents now, and feel trust, it really does help me with my
schoolwork, I know that I can always go to them and tell them about it. I don't contain my stress to
myself anymore or just my friends over the phone or media. Instead, I can go face to face with my
parents. It was a good experience, and just helped me through a lot. Stress wise it has gone from like 10
to 3, 4 or 5.
17 2 It has made my time management better, which is something I've always wanted to improve.
18 1 Not really. Just that the meetings have been a positive influence on my academic behaviors. I feel good,
it helped me a lot.
19 2 It [the meetings] helped me become a better student, so my grades are getting better, so that's a plus. It's
not even just for AP, it's for all my classes. That helps me out a lot because I remember getting texts
from my mom "This grade is dropping. What's happening here?" I got stressed out. Now for once I'm
actually focusing on, actually caring about, like in the middle of the year I started getting lazy, now I try
to get back to my old habits from the beginning of the year. I'm getting there. I also stopped copying
other students' work and letting others copy my work.
Theme: Participants felt supported (n = 6; 2 vs. 4)
2 2 I know setting the goals helped a lot because like the meeting with you after setting the goal helped a lot,
because you have somebody come back with a progress, because some kids don’t have guardians or
something to share progress with. I know that coming back to you that they have somebody to come
back to and "yeah look what I did, I accomplished what I said I would.
6 2 It's been like… after the first one it was very easy to talk, and to discussed and to be able to make the
plans it's very cooperative. "What do you mean by cooperative?" If I say something, then you'll say
something that kind of compliments what I say, in a way where it's like you can do this... and you can do
this... that will help. It's like very... understanding kind of.

136
Table 42 (Continued)
9 2 People know I get anxious because it's visible [on my face], but I never had anybody helped me with it
because I don't really talk to my parents or my friends. A lot of the time my friends just say "Just do it."
and that doesn't really help me, I try to force myself... but this is just different, having someone that's not
a therapist, but more of a good coach I guess. "You're against the idea of getting therapy." Yeah,
maybe later on therapy but now I have a lot of things I need to do on my plate and therapy will take up
my time.
10 1 It's nice to talk to someone. Parents, you know, sometimes aren't always there for you, I mean they
should be, most parents are, but sometimes maybe something is going on in their personal lives that
might be hard on them, some people don't have parents, and your friends, you can go to your friends, but
sometimes they can't relate to some things. Either your friend will listen, or they just don't care, so when
you come in and you sit down and you say so here's what you're doing badly, how are we going to
improve this, really sits you down and talk to you, it feels very nice, someone listening to you.
15 1 Other than the fact that I felt really comfortable the whole time, like you are a really nice person to talk
to. Most people are very judgmental, and it shows, but with you, I'm talking and you're just listening,
taking it all in, and thinking about it, instead of just immediately jumping to conclusions and judging
people, and I really like that. It was really nice to just be able to get away from it for a minute and talk.
20 2 It helped me voice what I want to say, I usually don't tell other people my opinions. Talking to people
about my plan help me voice what I want to do.
Theme: The meetings helped point out room for growth (n = 3; 3 condition 1)
11 1 I think they are very helpful for me. Kind of a nice time to set aside to see what I need to focus on,
instead of continuing with my day.
12 1 I just thought that this was a really good experience, because not a lot of people get to like… not
everybody get to do this [one-on-one meeting] so I think it's good that I get to know things that need
improvement and just kind of like put school behind me for a second and focus on me and what I should
do better to improve my lifestyle and I think it's good that I get the opportunity to do that.
13 1 This has been one of those situations where I was able to think about everything I can improve on
rationally, sometimes it's hard to figure out flaws in myself, because I don't really want to criticize
myself, but this has helped me identified them. This is helping me improve them, like I don't do a lot of
the things I do now before this meeting.
Note. Condition 1 = MAP to AP, 2 = AP to MAP.

137
In summary, some of the themes generated from analyzing the exit interviews align with
the themes discovered through analyzing written responses. For example, the theme first meeting
felt more like the foundation, whereas the second functioned to revise their goals and plans from
exit interview is similar to setting new goals and revising action plans from written feedback.
Moreover, the themes feel supported by coach and recognize areas for growth also emerged
from both written feedback and exit interview analyses. In addition, participants shared through
exit interviews that the meetings helped them achieve various goals, including stress reduction,
grade improvement, and relationship development. This theme overlaps with the some of the
themes generated through written feedback, in which participants reported that the most useful
part of their meetings was action planning and that one of the good parts of the meeting is that
they were able to discuss their goals and plans. Lastly, it is noteworthy that the analyses on exit
interviews data revealed more evidence to support the idea that an order effect occurred (i.e.,
participants feel more comfortable with the coach after the second meeting despite the condition
they were assigned). As there are many overlaps between the quantitative and qualitative themes,
table 43 provides a visual summary of the overlaps.
Feasibility
Each meeting (MAP or AP) was designed to last from 30 to 45 minutes, which is within
the length of one period in a typical high school schedule. In this study, the average length of
MAP meetings was 44 minutes, with a range from 31 to 55 minutes. In comparison, the average
length of AP meetings was 32 minutes, with a range from 21 to 49 minutes. The meetings that
lasted longer than 45 minutes usually involved a very talkative or quiet student, suggesting that
student factors play a role in session length. Nonetheless, the longest session was only 10 more
minutes over a typical high school period, which suggests that participants’ schedule was not

138
Table 43
Overlapping Quantitative and Qualitative Findings
Overlapping Findings
Data from Different Sources
Quantitative
Qualitative
(Written Feedback)
Qualitative
(Exit Interview)
Higher student-reported
therapeutic alliance after
the second meeting.
Wilcoxon Signed Rank Test
revealed significant order
effect (S = -18.5, N = 20, p
= .03).
Six participants reported higher
therapeutic alliance after second
meeting while only 2 reported level
of comfort remained the same.
14 participants reported
feeling more comfortable
during the second meeting
while only 5 participants
expressed that they felt the
same during both sessions.
Higher perceived progress
towards goal after the
second meeting.
Wilcoxon Signed Rank Test
revealed significant order
effect (S = -18, N = 20, p
= .04).
Three participants reported higher
increase in progress towards goal
after the second meeting compared
to the first meeting.
N/A
The main differences
between the two meetings
being that participants get
to set new goals and revise
action plans at meeting 2.
N/A Five participants reported difference
between meeting 1 and 2 is setting
new goals; Two participants
reported difference between
meeting 1 and 2 being that they get
to revise action plans in meeting 2.
Nine participants reported
that first meeting felt more
like the foundation, whereas
the second functioned to
revise their goals and plans.
Participants reported that
they felt supported by the
coach.
Participants reported high
mean scores (4.70 for MAP
and 4.75 for AP over a 5-point
Likert-scale that range from 1
= not at all to 5 = totally) on
the item: “In this meeting, do
you feel that your coach will
stick with you no matter how
you behaved?”
Two participants wrote that one of
the good parts of the meeting is that
they felt supported by the coach.
Six participants shared that
they felt supported by coach
when asked if they have any
additional comments.

139
Table 43 (Continued)
Participants reported that
the meetings helped them
recognize personal room
for growth.
N/A Five participants shared that the
most interesting or useful part of the
meeting was that they get the
opportunity to recognize their own
weaknesses.
Three participants expressed
that the meetings helped them
learn their weaknesses when
asked for additional
comments.
Participants appreciate that
the meetings helped them
plan and achieve personal
goals.
N/A Fifteen participants wrote that the
most interesting or useful part of the
first meeting is to action plan.
Moreover, 11 participants reported
good part of their meeting was that
they get the opportunity to discuss
their personal goals and plans.
Six participants shared that
the meetings helped them
achieve personal goals such
as reducing stress and
increasing grade when asked
for additional comments.
Note. N/A = No data available.

140
disturbed drastically. This is especially true because all meetings were carried out during
participants’ elective periods. Moreover, the author always asked participants if it was a good
time to have a meeting before getting started. In the rare event that a student said no (e.g., when
they are about to take a test next period), the author rescheduled those meetings.
Fidelity to Intervention Protocols
In order to determine the extent to which the author followed the intervention protocol for
MAP or AP meeting, all meetings were audio recorded and the author used fidelity checklists to
code all meetings. Two fidelity checklists were used (one for MAP meetings, the other for AP
meetings; attached as Appendices I and J). The average fidelity for MAP meetings is 98% (99%
for participants who receive MAP first [condition 1] and 98% for participants who receive MAP
second [condition 2]). The overall fidelity for AP meetings is 98% (100% for participants who
receive MAP first [condition 1] and 96% for participants who receive MAP second [condition
2]). Forty percent of audio files (8 out of 20) were also assigned to two other graduate students in
the School Psychology program for fidelity monitoring purposes, and to establish inter-rater
reliability. The author randomly chose two tapes from MAP (condition 1), MAP (condition 2),
AP (condition 1), and AP (condition 2). The inter-rater reliability was 100%.

141
Chapter V: Discussion
The first purpose of the current study was to compare the efficacy of a school-based
student-focused Motivational Interviewing (MI) intervention, called Motivation, Assessment,
and Planning (MAP), to an Action Planning (AP) intervention. The goal of MAP is to help
students in accelerated curricula with academic and/or emotional risks develop coping and
engagement skills that are associated with success among this population. The second purpose of
this study was to examine the differences in student acceptability between the two interventions.
This chapter first summarizes the findings of this study, then compares the results to previous
studies. Next, the implications and limitations of this study are discussed. Lastly, this study
explores directions for future research in this realm.
Efficacy of MAP Compared to AP
The main purpose of this study (research question 1) was to compare the efficacy of a
newly developed school-based, student-focused Motivational Interviewing (MI) intervention
termed Motivation, Assessment, and Planning (MAP) to an Action Planning (AP) intervention,
which is commonly embedded as part of other school-based intervention that are cognitive-
behavioral in nature (Kendall, 2011; Langberg et al., 2012). Although MAP has been found to be
feasible and acceptable in previous trials (O’Brennan et al., 2019), this study offers a closer look
at its efficacy. Specifically, Wilcoxon Signed Rank tests revealed that participants (N = 20)
reported a significantly higher level of the importance to change after MAP compared to AP
meetings (S = 35.5, N = 20, p = 0.04). This finding is consistent with the hypothesis of this study,

142
which was that participants will demonstrate better outcome (i.e., higher importance to change)
after participating in counseling sessions that utilize MI (use of MI was more evident in MAP
compared to AP meetings as coded with the MITI). According to Miller and Rollnick (2012),
one of the main goals of MI-based intervention is to affect change in behavior through
increasing individual’s sense of importance to change. Through building higher sense of
importance to change, coach helps individuals realize the discrepancy between personal goals or
values and their current behavior, which leads to increase in desire to make changes to decrease
the discrepancy (Resnicow & McMaster, 2012; Rollnick et al., 2010). Importance of change has
been shown to reliably predict whether individuals quit smoking (Butler et al., 1999; Rollnick,
Mason, & Butler, 1999) and drinking (Bertholet et al., 2012). Furthermore, this finding of greater
sense of importance to change following MAP is consistent with findings of other studies that
support the efficacy of school-based, student-focused MI interventions (Snape & Atkinson,
2016). There is one caveat, which is that individuals also need sufficient confidence to change in
addition to feeling that change is important to best predict behavior change (Miller & Rollnick,
2012). Since there is no significant differences between participants’ confidence to change after
MAP compared to AP meetings (both means were high; 4.38 for MAP and 4.35 for AP on a 5-
point scale), the findings of this study suggests that MAP, when implemented with satisfactory
MI quality, may be more effective than AP in affecting change in behavior as MAP is more
effective in increasing participants’ perceived importance to make changes, one of the necessary
ingredients for change in behavior.
Another significant finding revealed through Wilcoxon Signed Rank test is that the
author/coach perceived significantly higher level of therapeutic alliance with participants after
MAP compared to AP meetings. However, Wilcoxon Signed Rank test detected no significant

143
differences between participant/student perceived therapeutic alliance after MAP and AP
meeting. As client-rated therapeutic alliance has shown to be most predictive of therapy
outcomes (Lambert & Barley, 2001) and there is a possibility that the coach/author, being not
blind to the conditions, was biased in rating the alliance of each meeting, the author prioritized
student-reported over coach-reported therapeutic alliance during the interpretation of the results.
Thus, this author is not suggesting that therapeutic alliance was actually higher in MAP
compared to AP meeting. However, alliance as perceived by interventionists has been shown to
be helpful in prior research, with benefits including catching ruptures in alliance during early
stages of therapy (Eames & Roth, 2000). Since the means of coach-rated therapeutic alliance in
this study are above 3 out of a 5-point scale (4.67 for MAP; 3.18 for AP), ruptures were unlikely
to have occurred, thus eliminating rupture as a possible factor that influenced the outcomes of
this study. On the other hand, the correlations between student and coach-reported therapeutic
alliance are positive but low during both MAP and AP meetings in this study, which is consistent
with findings from previous research on alliance (Hersoug et al., 2001). The correlations may
increase over time if the study has more than two sessions as past research revealed that therapist
and client-rated alliance tend to converge over time in successful treatments (Horvath, 2001;
Zorzella, Rependa, & Muller, 2017). It is also possible that youth participants in this study may
had exhibited socially desirable responding when reporting therapeutic alliance after each
meeting. In other words, participants may have consistently reported high level of therapeutic
alliance because they were biased toward liking/pleasing the coach.
Similar to findings with student-reported alliance, this study also found no significant
differences between other outcomes, including confidence to change and goal attainment. In
sum, only two of five outcomes indicted beneficial impact of MAP in relation to an active

144
comparison condition, and one of those indicators is from a potentially biased source (i.e.,
therapist-rated alliance). Since only one of four outcome areas as rated by students favored MAP,
no substantive conclusions can be made; findings from this study do not support MAP or AP as
more effective in increasing therapeutic alliance, participants’ confidence to change, and goal
attainment, but indicate MAP is tied to greater importance of change. Taken as a set, these
inconclusive findings may be due to many reasons. For instance, it is possible that participants
reported high therapeutic alliance across interventions due to socially desirable responding. In
addition, the measures adopted in this study might not be precise or sensitive enough to detect
differences between MAP and AP. It is also possible that the current study has insufficient
statistical power (small sample size) to detect differences in outcomes. Lastly, it is possible that
there is indeed no difference between how effective MAP and AP are in affecting Advanced
Placement students’ immediate confidence to change, therapeutic alliance, and goal attainment
over one month (conclusions about goal attainment in the long run were not examined, and some
participants may need more time to complete their action plan and show progress). That being
said, the findings of this study demonstrate positive effects of MAP on students’ perceptions of
the importance of making a positive change in one’s behavior, and also provide some initial
evidence to support that AP may be as effective as MAP in affecting participants’ confidence to
change, alliance with coach, and goal attainment. This is noteworthy as it shines light on the
effectiveness of AP as a standalone intervention, which is lacking in the current school-based
intervention literature as AP is often used in conjunction with other interventions in schools.
Acceptability of MAP Compared to AP
Research question 2 of this study focused on investigating whether participants find one
intervention (MAP or AP) more acceptable than the other. Quantitative and qualitative data were

145
collected to answer this research question. Quantitatively, Wilcoxon Signed Rank test revealed
non-significant differences in student satisfaction of MAP compared to AP meetings. This shows
that this study does not have enough evidence to suggest whether participants accept MAP more
than AP, or vice versa. Similar to research question 1, this inconclusive finding may be due to
the smaller sample size of this study leading to less statistical power to detect differences
between MAP and AP.
Qualitatively, constant-comparative analysis on written feedback revealed that an almost
equal number of participants in MAP or AP meetings felt that the good parts of the meeting
include discussing goals and plans (n = 5 and 6) as well as feeling supported by coach (n = 1 and
1). When asked about the bad parts of their meetings, analysis again revealed that almost equal
number of participants in MAP or AP meetings felt that there are either no bad parts (n = 4 and
5) or reported admitting to weaknesses (n = 2 and 2) and being away from class (n = 2 and 1)
were the only bad parts. Overall, the qualitative finding suggests that participants do not feel that
any one intervention (MAP or AP) have more good than bad parts, and vice versa.
On the other hand, when asked to write about the differences between the two meetings
(written feedback), participants wrote that the main differences are that at the second meeting,
they set new goals and revised action plans. At the exit interview (verbal feedback), participants
(n = 9) view the first meeting as the foundation to set their goals and the second meeting as the
platform to further revise their plans. Collectively, it seems like the main difference perceived by
participants is more related to the structure of the meeting (i.e., activities they engaged in the
meeting). The two meetings do have connecting parts (e.g., reviewing past action plans during
the second meeting), which may have deterred participants from comparing the two interventions
(MAP and AP) as separate meetings. This leads to information that does not necessarily answer

146
the research question (i.e., do participants find MAP more acceptable than AP or vice versa), but
suggests that in general students feel less comfortable during the initial therapeutic contact with
an interventionist regardless of the intervention framework utilized.
In sum, it seems like neither quantitative or qualitative data provided evidence to suggest
that participants preferred one intervention over the other (MAP vs. AP). Instead, ratings of
acceptability were high in both interventions, including a mean score of 4.64 (MAP) and 4.60
(AP) on the 1 – 5 response metrics (1 = strongly disagree and 5 = strongly agree). These mean
scores suggest that participants find both interventions highly acceptable. This inconclusive
result may be due to many of the aforementioned possible reasons (e.g., socially desirable
responding, small sample size, low precision of measurement) or it may be that there are no
differences between acceptability of the two interventions among this population (Advanced
Placement students). Although this study did not find any conclusive findings, past trials suggest
that MAP is highly acceptable among its intended population (i.e., students in accelerated
curricula; O’Brennan et al., 2019), which is replicated in this study. Moreover, MI’s
collaborative nature and support for autonomy is a good fit for the population of this study (high
school freshmen; Kaplan, 2014). In contrast, to the best of the author’s knowledge, the
acceptability of AP as a standalone intervention in schools is unclear, in part because it is most
often used in conjunction with other interventions. Thus, the fact that participants find AP as
acceptable as MAP is a result worthy of noting as it shines some light on how AP fares as a
standalone intervention among students in accelerated curricula.
Order Effects
This researcher did not originally intend to systematically examine order effects, but in
reviewing student data from meeting one and meeting two took note of the elevated scores after

147
meeting two regardless of condition assignment. Post-hoc Wilcoxon Signed Rank tests revealed
a significant difference between student-reported therapeutic alliance scores at meeting 1 and 2.
In particular, students reported higher therapeutic alliance after their second meeting, no matter
to which condition they were assigned (to receive MAP or AP first). This order effect is further
supported by qualitative theme relates to participants’ level of comfort. From analyzing written
feedback, this study found that participants (n = 6) felt more comfortable with the coach at the
second meeting, although a small number (n = 2) said they felt equally comfortable at both
meetings. This finding is found again in analyzing verbal feedback, in which more participants (n
= 14 vs. 5) shared that they felt more comfortable with the coach in the second meeting
compared to being equally comfortable at both meetings. Although this finding does not provide
evidence to support whether participants preferred one meeting over the other, it does suggest an
order effect. In other words, it seems like participants felt more comfortable in the second
meeting, no matter which condition they were assigned (i.e., whether they received MAP or AP
first).
This order effect can be partly explained by the details provided by participants during
qualitative feedback. They shared that the first meeting is more nerve wrecking as they did not
know what to expect, but as time went on they felt more comfortable with the coach. Perhaps
this initial feeling of nervousness is so strong for most participants, that it masked any potential
differences between level of comfort at MAP compared to AP meetings. Shirk and Karver
(2011) demonstrate that the correlation between therapeutic alliance and outcomes tend to
increase over time. Following this trend, it makes sense that the alliance scores are higher at the
end of the second meeting, as it should continue to increase over time according to Shirk and
Karver (2011). They also recommend that the earliest time period to assess alliance should be

148
around third to fifth session as that is the earliest scores that reliably predict outcomes and
dropouts (Shirk & Karver, 2011). Because this author was familiar to all of the participants—
having just delivered 12 weeks of classwide lessons that comprise the ACE program—it was
somewhat unexpected that individual students would be uneasy during the first MAP or AP
meeting.
Wilcoxon Signed Rank test also revealed another order effect. Participants self-reported
higher level of progress towards goal after the second meeting, no matter which intervention they
received at that meeting. This order effect is also supported by qualitative analysis of written
feedback, which revealed that some participants (n = 3) felt that they made more progress on
their second action plan, no matter to which condition they were assigned. This finding is not
surprising as participants may have developed more efficacy in setting goals, designing action
plans, and carrying out the steps after having the opportunity to go through the same process
with the coach once.
Additional Qualitative Results
In addition to asking participants about the differences between the two meetings and
how comfortable they felt (research question 2), this study also included more qualitative
questions that aim to further understand participants’ view on the two interventions, MAP and
AP. Analysis of participants’ written and verbal feedback generated themes that provide context
to this study. For example, three-quarter of participants (n = 15) shared that the most interesting
or useful part of the meeting is action planning. It is important to note that this finding does not
necessarily suggest that participants prefer AP over MAP because they were not directly
comparing MAP to AP in this instance. Since the processes of MAP (e.g., open-ended questions,
affirmations, reflections, and summaries) are much subtler than AP (i.e., the part where students

149
brainstorm and make plans), the author does not view this theme (participants find action
planning as most interesting/useful) as an indicative of AP being more acceptable. Instead,
participants are just expressing which parts of the meetings were most obviously interesting to
them. The fact that participants mentioned similar good and bad parts for both types of meetings
support this interpretation. Nonetheless, it is noteworthy that participants view the action
planning process so favorably, as the effects of AP as a standalone intervention in the current
literature remains unclear as it is often used in conjunction with other interventions in schools
(e.g., HOPS; Langberg et al., 2012).
In addition to action planning, participants also find comparing level of coping and
engagement to other students on the graph (n = 7) and recognizing weaknesses (n = 5) as the
most interesting or useful parts of their meetings. This suggests that this targeted population
(students in accelerated curricula) enjoy a little competition and comparison with others.
It is also noteworthy that participants expressed that the meetings helped them achieve
personal goals (n = 11 written; n = 6 verbal) and they felt supported by the coach (n = 2 written;
n = 3 verbal). Both intervention frameworks (MI-based intervention and AP) have been shown to
be effective in helping individuals make positive changes in clinical settings (Bélanger-Gravel et
al., 2013; Lundahl & Burke, 2009). Although the goal of this study is to examine whether one of
these interventions is more appropriate for students enrolled in accelerated curricula, it is
reassuring to learn that participants ultimately perceived benefiting from these meetings.
Limitations
Several limitations pertained to this study. First, this study used a convenience sample—
youth attending a partner school whose administration expressed high interest in adopting the
comprehensive intervention in development. Compared to random sampling, this sampling
method produced lower generalizability of findings, which posed as a threat to the population

150
validity. The intervention protocols of this study are also designed to target the needs of a
specific population, namely students in accelerated curricula. The author does not recommend
readers of this dissertation attempt to apply the intervention protocols to other student
populations. Second, the sample size is small (N = 20). Although non-parametric statistical
methods were used to compensate for this limitation, a larger sample size would have provided
more power for this study to detect any differences between MAP and AP. Third, the author,
who is also the interventionist in this study, may have been biased in rating therapeutic alliance
with participants. This is because the author generated a hypothesis that participants would
experience higher therapeutic alliance during MAP compared to AP meetings. As the author is
not blind to the condition (MAP or AP) to which participants were assigned, it might have
influenced how the author rated therapeutic alliance for each session (i.e., the author may have
rated higher alliance for MAP vs. AP sessions due to biases). To address this limitation, this
study also collected another source of therapeutic alliance, specifically alliance rating from
participants. Furthermore, participants experienced some order effects (higher therapeutic
alliance and more progress towards goal after the second meeting, no matter which intervention
they received at that meeting) due to the limitation of the study design in which intervention
began immediately in the first counseling session. Finally, there were some technical challenges
in comparing MAP and AP due to the design of the intervention protocols. The MAP protocol,
rooted in MI, rather quickly covers four conceptually distinct processes (engage, focus, evoke,
and plan) that are sometimes treated as separate conversations. In contrast, the AP protocol is
comprised mainly of one stage- planning. In a different study that would compare the planning
stage of MAP to AP, the author expects there might be more similarities than differences.

151
Study Contributions to Practice
Initial themes in an ongoing qualitative study by the author’s research group (details of
this study are described in chapter 2) that involve 12 school mental health practitioners revealed
that they favor the action planning portion of the MAP intervention and seemed confident that
action planning plays the biggest role in helping students commit and enact behavior changes
that lead to self-determined goal. This is consistent with the general emphasis on using action
planning in school-based interventions, such as in school wide positive behavior supports (Sugai
& Horner, 2002) and in individual counseling sessions with cognitive-behavioral therapy
(Kendall, 1985; Kendall, 2011), one of the most popular therapy approaches among school
mental health providers (Hanchon & Fernald, 2013). As time is often a limited resource in
school, it is important to investigate this sentiment.
Results of statistical tests in the current study revealed that participants reported
significantly higher importance of change after MAP compared to AP. However, the other tests
revealed no differences in whether participants felt more confident to change, experienced higher
therapeutic alliance, or attained more of their goals. Findings from this study did not support one
intervention as more acceptable than the other (MAP vs. AP), instead both were viewed
positively. However, the results favor MAP over AP in terms of increasing students’ perceived
importance to enact positive change to be more successful in Advanced Placement class.
According to Miller and Rollnick (2012), importance to change is essential in moving
individuals towards behavioral change, as individuals who view change as important are more
likely to see the discrepancy between their current behaviors and personal goals/values, thus are
more likely to enact behaviors to decrease the discrepancy. This technique of encouraging
individuals to view change as important has been shown to be successful in helping individuals

152
make positive changes in life, such as stop smoking (Butler et al., 1999; Rollnick, Mason, &
Butler, 1999) and drinking (Bertholet et al., 2012). It has also been shown to affect various
school-related outcomes (e.g., attendance and grades) when applied in educational settings
(Snape & Atkinson, 2016). Since there seems to be some additional benefits of implementing all
four stages of MI with respect to enhanced perceptions of the importance of changing, the results
of this study provide some support to encourage practitioners to devote the time to learn more
about MI and to not skip the first three stages (engage, focus, evoke) and jump straight into
action planning. On the other hand, AP and MAP were relatively equally as effective in helping
participants increase confidence to make changes, form high therapeutic alliance, and attain
immediate goals. This finding provides some evidence to suggest that practitioners who are not
as familiar with MI— or practitioners who simply decide to use AP as a standalone
intervention—might expect AP to be as effective as MAP in affecting proximal student
outcomes, at least when utilized with students in accelerated courses. Moreover, AP is also more
cost-effective as the average time of AP meetings are shorter than MAP meetings (44 compared
to 32 minutes). From a Multi-Tiered Systems of Support (MTSS) standpoint, both MAP and AP
would be worthy of consideration if a high school decides to incorporate a Tier 2 intervention for
students in accelerated courses. This is because both interventions have been shown to be
feasible and acceptable in this study. However, schools with limited resources (e.g., low
availability of mental health providers, limited finances to train mental health providers to be
competent in MI, etc.) may find AP to be more appealing as it is potentially more cost effective
and has some support for being as effective as MAP in affecting most of the outcomes (i.e.,
confidence to change, therapeutic alliance, and goal attainment).

153
It is important to note that the MAP intervention adopted in this study differs slightly
from the original MAP intervention developed through the larger grant (R305A150543).
Specifically, the second meeting was compulsory in this study, but is optional in the original
MAP intervention. In addition, this study also sent out a second reminder letter after the second
meeting and held a termination session a month after the second meeting. These two elements
are absent in the original MAP intervention. They were added to the current implementation of
MAP to adapt to the study design (a between subject design requires all participants to go
through both interventions [two meetings; MAP and AP] and goal attainment data can only be
collected approximately one month after a meeting). Thus, the coach/author in this study had
more face-to-face time with participants to show care and provide accountability to a second
action plan; future coaches who choose to implement the original MAP intervention should
expect to have less contact time with their students if they delivery MAP as originally advanced.
Study Contributions to the Literature
To the best of the author’s knowledge, there is no study in the current literature that
compared the efficacy and acceptability of a school-based, student-focused MI intervention to a
standalone Action Planning (AP) intervention. This study shed some light on how the two
interventions affected ninth grade Advanced Placement students’ perceived importance to
change, confidence to change, therapeutic alliance with coach, and goal attainment. This study
also provided students with an avenue to voice their acceptability of the two interventions. These
findings are important because high school students enrolled in accelerated curricula are
traditionally underserved (Suldo et al., 2018) even though they tend to report higher level of
stress compared to general education students (Suldo & Shaunessy-Dedrick, 2013). The findings
of this study add to the literature by providing some information on how different types of Tier 2

154
interventions are received by this student population, which can help inform best practices to
support high school students in accelerated curricula.
It is also noteworthy that this study contributed to the literature by providing an insight
into how ninth grade students in Advanced Placement class perceived AP as a standalone
intervention. In the current school-based research literature, AP is often used in conjunction with
other interventions such as a popular counseling model, CBT (Kendall, 2011) or positive
behavior support strategies (Sugai & Horner, 2002). This study compared AP as a standalone
intervention to MAP and found that participants accept AP as much as they accept MAP. In fact,
more than half of the participants (n = 15) reported the action planning process as the most
interesting/useful part of their meetings. Furthermore, this study’s findings also suggested that
AP is as effective as MAP in affecting participants’ proximal outcomes (i.e., confidence to
change, therapeutic alliance, and goal attainment). Although associations between MAP and AP
and distal outcomes such as academic performance, stress levels, and engagement are lacking,
preliminary information from this study can aid readers in making evidence-based decisions to
support students enrolled in accelerated curricula.
Future Directions
The current study provided many directions for future research in the realm of supporting
youth enrolled in accelerated curricula. For example, future research can replicate this study with
a larger sample size that also includes students in a different type of accelerated program, such as
International Baccalaureate. The larger sample size will increase the statistical power to detect
any differences between student outcomes and acceptability. In addition, future studies can
choose to adopt a between-subject design with larger sample size to explore interaction effects.
Moreover, with a between-subject design, participants will not receive both conditions, thus no

155
order or practice effects will occur. In terms of expanding the target population, although it
would be inappropriate to use the intervention protocols of this study on general education
students, it may be worthwhile to test out the interventions on Advanced Placement/International
Baccalaureate students who are in 10th, 11th, and 12th grade. It would also be interesting to have
more than one interventionist involved in future studies, to provide some insights into whether
the coach plays a role in affecting student outcomes and acceptability. Future studies can also
investigate the long-term effects of MAP and AP. For example, future research can explore
whether students who participated in MAP and AP generalize the skills they learned to address
future challenges and whether the effects of MAP and AP can be further differentiated in the
long term. Finally, future research can focus on coding instances of change talk in the de-
identified audio files from this study because frequency of change talk has been shown to be
predictive of behavioral change (Apodaca & Longabaugh, 2009). Although it is beyond the
resources of this study to include frequency of change talk as an outcome variable, future studies
can address this issue by applying for funding or searching for professional collaborations with
other MI experts.
Summary
This randomized, within-subject study aimed to compare the efficacy and acceptability of
two interventions (MAP and AP) with a specific population – ninth grade students enrolled in
accelerated curricula. MAP is a newly developed school-based, student focused Motivational
Interviewing (MI) intervention, whereas Action Planning (AP) is a long-standing school-based
intervention that is often incorporated as part of other interventions such as CBT (Kendall, 2011)
and positive behavior interventions (Sugai & Horner, 2002). Participants reported significantly
higher level of importance to change after MAP compared to AP meetings. No significant
differences were observed for the other outcome variables: confidence to change, student-rated

156
therapeutic alliance, or goal attainment. Similarly, there were no significant differences between
student acceptability of MAP and AP. Instead, participants consistently reported higher
therapeutic alliance and progress towards goal after their second meeting with the interventionist,
no matter which condition they were assigned to receive first (MAP or AP). These order effects
were supported by themes generated from qualitative analyses (constant-comparative).
Qualitative analyses pertinent to acceptability further failed to support that participants found one
intervention to be more acceptable than the other. Instead, participants generally find both
meetings to be helpful. For example, they shared that the meetings helped them achieve personal
goals (e.g., reducing stress, increasing grades, etc.) and recognize own weaknesses. They were
especially interested in setting goals, completing action plans, and revising steps to achieve goals
(n = 15). Finally, participants felt supported by the coach throughout both meetings.

157
References
Achenbach, T. M., & Rescorla, L. A. (2001). Manual for the ASEBA school-age forms and
profiles. Burlington: University of Vermont, Research Center for Children, Youth, and
Families.
Adelman, H., & Taylor, L. (2000). Moving prevention from the fringes into the fabric of school
improvement. Journal of Educational and Psychological Consultation, 11(1), 7-36.
Alspaugh, J. W. (1998). Achievement loss associated with the transition to middle school and
high school. The Journal of Educational Research, 92(1), 20-25.
Apodaca, T. R., & Longabaugh, R. (2009). Mechanisms of change in motivational interviewing:
a review and preliminary evaluation of the evidence. Addiction, 104(5), 705-715.
Atkinson, C., & Amesu, M. (2007). Using solution-focused approaches in motivational
interviewing with young people. Pastoral Care in Education, 25, 31–37.
Atkinson, C., & Woods, K. (2003). Motivational interviewing strategies for disaffected
secondary school students: A case example. Educational Psychology in Practice, 19, 49–
64. doi:10.1080/0266736032000061206
Bélanger-Gravel, A., Godin, G., & Amireault, S. (2013). A meta-analytic review of the effect of
implementation intentions on physical activity. Health Psychology Review, 7, 23-54. doi:
10.1080/17437199.2011.560095
Benner, A. D., & Graham, S. (2009). The transition to high school as a developmental process
among multiethnic urban youth. Child development, 80(2), 356-376.

158
Benner, A. D., & Wang, Y. (2014). Shifting attendance trajectories from middle to high school:
Influences of school transitions and changing school contexts. Developmental
psychology, 50(4), 1288.
Bergeron, L. (2015). Diploma Programme students’ enrollment and outcomes at US
postsecondary institutions 2008–2014. Bethesda, MD: International Baccalaureate
Organization.
Bertholet, N., Gaume, J., Faouzi, M., Gmel, G., & Daeppen, J. B. (2012). Predictive value of
readiness, importance, and confidence in ability to change drinking and smoking. BMC
Public Health, 12(1), 708.
Bickman, L., Athay, M. M., Riemer, M., Lambert, E. W., Kelley, S. D., Breda, C., & Vides de
Andrade, A. R. (2010). Manual of the Peabody treatment progress battery. Nashville, TN:
Vanderbilt University.
Bonnar, D., Gradisar, M., Moseley, L., Coughlin, A. M., Cain, N., & Short, M. A. (2015).
Evaluation of novel school-based interventions for adolescent sleep problems: does
parental involvement and bright light improve outcomes?. Sleep Health, 1(1), 66-74.
Bruhn, A. L., Lane, K. L., & Hirsch, S. E. (2014). A review of tier 2 interventions conducted
within multitiered models of behavioral prevention. Journal of Emotional and Behavioral
Disorders, 22(3), 171-189.
Butler, C. C., Rollnick, S., Cohen, D., Bachmann, M., Russell, I., & Stott, N. (1999).
Motivational consulting versus brief advice for smokers in general practice: a randomized
trial. The British Journal of General Practice, 49(445), 611.

159
Channon, S., Marsh, K., Jenkins, A., & Robling, M. (2013). Using motivational interviewing as
the basis for a peer support programme in high school. Pastoral Care in Education, 31,
66–78. doi:10.1080/02643944.2012.731426
Chorpita, B. F., & Weisz, J. R. (2009). MATCH-ADTC: Modular approach to therapy for
children with anxiety, depression, trauma, or conduct problems. Satellite Beach, FL:
PracticeWise.
Christner, R. W., Mennuti, R. B., & Whitaker, J. S. (2008). An Overview of School-Based
Mental Health Practice. School-Based Mental Health: A Practitioner's Guide to
Comparative Practices, 1.
Cohen, S., Kamarck, T., & Mermelstein, R. (1983). A global measure of perceived stress.
Journal of Health and Social Behaviors, 24, 385-396. doi: 10.2307/2136404
Cohen, J. S., & Smerdon, B. A. (2009). Tightening the dropout tourniquet: Easing the transition
from middle to high school. Preventing School Failure: Alternative Education for
Children and Youth, 53(3), 177-184.
College Board. (2017). Summary reports: 2017. Retrieved from https://secure-
media.collegeboard.org/digitalServices/pdf/research/2017/Program-Summary-Report-
2017.pdf
Cook, C. R., Frye, M., Slemrod, T., Lyon, A. R., Renshaw, T. L., & Zhang, Y. (2015). An
integrated approach to universal prevention: Independent and combined effects of PBIS
and SEL on youths’ mental health. School Psychology Quarterly, 30(2), 166.
Costello, E. J., Mustillo, S., Erkanli, A., Keeler, G., & Angold, A. (2003). Prevalence and
development of psychiatric disorders in childhood and adolescence. Archives of general
psychiatry, 60(8), 837-844.

160
Darling, N., & Toyokawa, T. (1997). Construction and validation of the parenting style inventory
II (PSI-II). Unpublished manuscript.
Duckworth, A. L., & Quinn, P. D. (2009). Development and validation of the Short Grit Scale
(GRIT–S). Journal of personality assessment, 91(2), 166-174.
Doll, B., Spies, R., & Champion, A. (2012). Contributions of ecological school mental health
services to students’ academic success. Journal of Educational & Psychological
Consultation, 22, 44–61. doi:10.1080/10474412.2011.649642.
Dounay, J. (2007). Recent state policies/activities: high school—Advanced
Placement. Education Commission of the States Policy Brief, Retrieved from the web-
site: http://www.ecs.org/ecs/ecscat.nsf/WebTopicView.
Durlak, J. A., Weissberg, R. P., Dymnicki, A. B., Taylor, R. D., & Schellinger, K. B. (2011). The
impact of enhancing students’ social and emotional learning: A meta‐analysis of school‐
based universal interventions. Child development, 82(1), 405-432.
Eames, V., & Roth, A. (2000). Patient attachment orientation and the early working alliance-a
study of patient and therapist reports of alliance quality and ruptures. Psychotherapy
Research, 10(4), 421-434.
Eccles, J. S., & Roeser, R. W. (2011). Schools as developmental contexts during
adolescence. Journal of research on adolescence, 21(1), 225-241.
Elmore, G. M., & Huebner, E. S. (2010). Adolescents' satisfaction with school experiences:
Relationships with demographics, attachment relationships, and school engagement
behavior. Psychology in the Schools, 47(6), 525-537. doi: 10.1002/pits.20488

161
Enea, V., & Dafinoui, I. (2009). Motivational/solution-focused intervention for reducing school
truancy among adolescents. Journal of behavioural and cognitive psychotherapies, 9,
185–198.
Epstein, J. L., & McPartland, J. M. (1976). The concept and measurement of the quality of
school life. American Educational Research Journal, 13(1), 15-30.
Frey, A. J., Lee, J., Small, J. W., Seeley, J. R., Walker, H. M., & Feil, E. G. (2013). The
motivational interviewing navigation guide: A process for enhancing teachers’ motivation
to adopt and implement school-based interventions. Advances in School Mental Health
Promotion, 6, 158–173. doi:10.1080/1754730X.2013.804334
Galassi, J. (2017). Strengths-based school counseling: Promoting student development and
achievement. Routledge.
Gresham, F. M. (2004). Current status and future directions of school-based behavioral
interventions. School Psychology Review, 33(3), 326.
Hagger, M. S., & Luszczynska, A. (2014). Implementation intention and action planning
interventions in health contexts: State of the research and proposals for the way
forward. Applied Psychology: Health and Well‐Being, 6(1), 1-47.
Hanchon, T. A., & Fernald, L. N. (2013). The provision of counseling services among school
psychologists: An exploration of training, current practices, and perceptions. Psychology
in the Schools, 50(7), 651-671.
Hersoug, A. G., Høglend, P., Monsen, J. T., & Havik, O. E. (2001). Quality of working alliance
in psychotherapy: Therapist variables and patient/therapist similarity as predictors. The
Journal of psychotherapy practice and research, 10(4), 205.

162
Hertberg-Davis, H., & Callahan, C. M. (2008). A narrow escape: Gifted students' perceptions of
Advanced Placement and International Baccalaureate programs. Gifted Child
Quarterly, 52(3), 199-216.
Hoagwood, K. E., Serene Olin, S., Kerker, B. D., Kratochwill, T. R., Crowe, M., & Saka, N.
(2007). Empirically based school interventions targeted at academic and mental health
functioning. Journal of emotional and behavioral disorders, 15(2), 66-92.
Hogan, M. F. (2003). New Freedom Commission report: The president's New Freedom
Commission: recommendations to transform mental health care in America. Psychiatric
Services, 54(11), 1467-1474.
Horvath, A. O. (2001). The alliance. Psychotherapy: Theory, research, practice, training, 38(4),
365.
Huebner, E. S. (1991). Initial development of the Students' Life Satisfaction Scale. School
Psychology International, 12, 231-240.
Huebner, E. S. (1994). Preliminary development and validation of a multidimensional life
satisfaction scale for children. Psychological Assessment, 6, 149-158.
Huebner, E. S., Laughlin, J. E., Ash C., & Gilman, R. (1998). Further validation of the
Multidimensional Students' Life Satisfaction Scale. Journal of Psychological Assessment,
16, 118-134.
Iachini, A. L., Rogelberg, S., Terry, J. D., & Lutz, A. (2016). Examining the feasibility and
acceptability of a motivational interviewing early intervention program to prevent high
school dropout. Children & Schools, 38(4), 209-217.
International Baccalaureate Organization. (2018a). The IB Diploma Programme. Retrieved from
http://www.ibo.org/diploma/

163
International Baccalaureate Organization. (2018b). IB World School statistics. Retrieved from
https://www.ibo.org/about-the-ib/the-ib-by-country/u/united-states/
Kaplan, S. G. (2014). Motivational Interviewing with children and young people: an overview.
In E. McNamara (Ed.), Motivational Interviewing: Further applications with children
and young people (pp. 49–58). Ainsdale: Positive Behaviour Management.
Kendall, P. C. (1985). Toward a cognitive-behavioral model of child psychopathology and a
critique of related interventions. Journal of Abnormal Child Psychology, 13, 357-372.
Kendall, P. C. (Ed.). (2011). Child and adolescent therapy: Cognitive-behavioral procedures.
Guilford Press.
Kim, J. S., & Franklin, C. (2009). Solution-focused brief therapy in schools: A review of the
outcome literature. Children and Youth Services Review, 31(4), 464-470.
Kiresuk, T. J., Smith, A., & Cardillo, J. E. (2014). Goal attainment scaling: Applications, theory,
and measurement. Psychology Press.
Kiresuk, T. J., & Sherman, R. E. (1968). Goal attainment scaling: A general method for
evaluating comprehensive community mental health programs. Community Mental
Health Journal, 4, 443–453. doi:10.1007/BF01530764.
Kittles, M., & Atkinson, C. (2009). The usefulness of motivational interviewing as a consultation
and assessment tool for working with young people. Pastoral Care in Education, 27,
241–254. doi:10.1080/02643940903133870
Kratochwill, T. R., & Stoiber, K. C. (2000). Uncovering critical research agendas for school
psychology: Conceptual dimensions and future directions. School Psychology Review,
29, 591-603.

164
Lambert, M. J., & Barley, D. E. (2001). Research summary on the therapeutic relationship and
psychotherapy outcome. Psychotherapy: Theory, research, practice, training, 38(4), 357.
Lane, K. L., Kalberg, J. R., Mofield, E., Wehby, J., & Parks, R. J. (2009). Preparing students for
college entrance exams: Findings of a Tier 2 intervention conducted within a three-tiered
model of support. Remedial and Special Education, 30, 3–18.
doi:org/10.1177/0741932507314022
Landgraf, J. M., Abetz, L., & Ware, J. E., Jr. (1999). Child Health Questionnaire (CHQ): A
user's manual. Boston, MA: HealthAct.
Langberg, J. M. (2011). Homework, organization, and planning skills (HOPS) interventions: A
treatment manual. National Association of School Psychologists.
Langberg, J. M., Epstein, J. N., Becker, S. P., Girio-Herrera, E., & Vaughn, A. J. (2012).
Evaluation of the Homework, Organization, and Planning Skills (HOPS) intervention for
middle school students with ADHD as implemented by school mental health
providers. School Psychology Review, 41(3), 342.
Laurent, J., Catanzaro, J., Joiner, T. E., Rudolph, K., Potter, K. I., Lambert, S., et al. (1999). A
measure of positive and negative affect for children: Scale development and preliminary
validation. Psychological Assessment, 11, 326-338.
Lavoie, J. A., & Douglas, K. S. (2012). The Perceived Stress Scale: Evaluating configural,
metric and scalar invariance across mental health status and gender. Journal of
Psychopathology and Behavioral Assessment, 34(1), 48-57.
Lee, J., Frey, A. J., Herman, K., & Reinke, W. (2014). Motivational interviewing as a framework
to guide school-based coaching. Advances in School Mental Health Promotion, 7, 225–
239. doi:10.1080/1754730X.2014.949515

165
Lewis, T. F., & Osborn, C. J. (2004). Solution‐focused counseling and motivational
interviewing: A consideration of confluence. Journal of Counseling &
Development, 82(1), 38-48.
Luborsky, L., Singer, B., & Luborsky, L. (1975). Comparative studies of psychotherapies: is it
true that everyone has won and all must have prizes? Archives of general
psychiatry, 32(8), 995-1008.
Lundahl, B., & Burke, B. L. (2009). The effectiveness and applicability of motivational
interviewing: A practice‐friendly review of four meta‐analyses. Journal of clinical
psychology, 65(11), 1232-1245.
Lundahl, B. W., Kunz, C., Brownell, C., Tollefson, D., & Burke, B. L. (2010). A meta-analysis
of motivational interviewing: Twenty-five years of empirical studies. Research on Social
Work Practice, 20, 137–160. doi:10.1177/1049731509347850
Malecki, C. K., Demaray, M. K. (2002). Measuring perceived social support: Development of
the Child and Adolescent Social Support Scale. Psychology in the Schools, 39, 1-18.
McCoach, D. B., & Siegle, D. (2003). The School Attitude Assessment Survey—Revised: A new
instrument to identify academically able students who underachieve. Educational and
Psychological Measurement, 63, 414-429.
Melnyk, B. M., Jacobson, D., Kelly, S. A., Belyea, M. J., Shaibi, G. Q., Small, L., ... &
Marsiglia, F. F. (2015). Twelve‐Month Effects of the COPE Healthy Lifestyles TEEN
Program on Overweight and Depressive Symptoms in High School Adolescents. Journal
of school health, 85(12), 861-870.
Merikangas, K. R., He, J. P., Burstein, M., Swanson, S. A., Avenevoli, S., Cui, L., ... &
Swendsen, J. (2010). Lifetime prevalence of mental disorders in US adolescents: results

166
from the National Comorbidity Survey Replication–Adolescent Supplement (NCS-
A). Journal of the American Academy of Child & Adolescent Psychiatry, 49(10), 980-
989.
Miller, W. R., & Rollnick, S. (2012). Motivational interviewing: Helping people change.
Guilford press.
Moyers, T.B., Manuel, J.K., & Ernst, D. (2014). Motivational Interviewing Treatment Integrity
Coding Manual 4.2. Unpublished manual.
Nunnally, J. C. (1978). Psychometric theory (2nd ed.). New York: McGraw-Hill.
O’Brennan, L., Suldo, S., Shaunessy-Dedrick, E., Dedrick, R., Parker, J., Lee, J., Ferron, J., &
Hanks, C. (2019). Supports for youth in accelerated high school curricula: applicability
and acceptability of a Motivational Interviewing intervention. Gifted Child Quarterly.
Manuscript under review.
O’Sullivan, G. (2011). The relationship between hope, eustress, self-efficacy, and life
satisfaction among undergraduates. Social indicators research, 101(1), 155-172.
Patterson, B. F., Packman, S., & Kobrin, J. L. (2011). Advanced Placement® Exam-Taking and
Performance: Relationships with First-Year Subject Area College Grades. Research
Report No. 2011-4. College Board.
Prochaska, J. O. (1999). How do people change, and how can we change to help many more
people?
Raffaele-Mendez, L. (2016). Cognitive Behavioral Therapy in Schools: A Tiered Approach to
Youth Mental Health Services. Taylor & Francis.

167
Resnicow, K., & McMaster, F. (2012). Motivational Interviewing: moving from why to how
with autonomy support. International Journal of Behavioral Nutrition and Physical
Activity, 9(1), 19.
Riemer, M., Athay, M. M., Bickman, L., Breda, C., Kelley, S. D., & De Andrade, A. R. V.
(2012). The Peabody Treatment Progress Battery: History and methods for developing a
comprehensive measurement battery for youth mental health. Administration and Policy
in Mental Health and Mental Health Services Research, 39(1-2), 3-12.
Roeser, R. W., Eccles, J. S., & Sameroff, A. J. (2000). Schools as a context of early adolescents’
academic and social-emotional development: A summary of research findings. The
Elementary School Journal, 100, 443–471.
Rollnick, S., Butler, C. C., Kinnersley, P., Gregory, J., & Mash, B. (2010). Motivational
interviewing. Bmj, 340, c1900.
Rollnick, S., Mason, P., & Butler, C. (1999). Health behavior change: a guide for practitioners.
Elsevier Health Sciences.
Ruble, L. A., Dalrymple, N. J., & McGrew, J. H. (2010). The effects of consultation on
individualized education program outcomes for young children with autism: The
collaborative model for promoting competence and success. Journal of Early
Intervention, 32, 286–301. doi:10.1177/1053815110382973.
Schonert-Reichl, K. A., Oberle, E., Lawlor, M. S., Abbott, D., Thomson, K., Oberlander, T. F.,
& Diamond, A. (2015). Enhancing cognitive and social–emotional development through
a simple-to-administer mindfulness-based school program for elementary school
children: A randomized controlled trial. Developmental psychology, 51(1), 52.

168
Shaunessy-Dedrick, E., Suldo, S. M., O’Brennan, L. M., Parker, J., Moseley, A., Ferron, J., &
Dedrick, R. F. (2018, April). Development of an intervention to support Advanced
Placement and International Baccalaureate Students’ Coping and Engagement. Paper
presented at the Annual Conference of the American Educational Research Association,
New York, NY.
Shirk, S. R., Karver, M. S., & Brown, R. (2011). The alliance in child and adolescent
psychotherapy. Psychotherapy, 48(1), 17.
Slaney, R. B., Rice, K. G., Mobley, M., Trippi, J., & Ashby, J. S. (2001). The revised almost
perfect scale. Measurement and evaluation in counseling and development, 34(3), 130.
Snape, L., & Atkinson, C. (2016). The evidence for student-focused motivational interviewing in
educational settings: a review of the literature. Advances in School Mental Health
Promotion, 9(2), 119-139.
Strait, G. G., Lee, E. R., McQuillin, S., Terry, J., Cebada, M., & Strait, J. E. (2017). The Student
Check-Up: effects of paraprofessional-delivered Motivational Interviewing on academic
outcomes. Advances in School Mental Health Promotion, 10(4), 250-264.
Strait, G., McQuillin, S., Terry, J., & Smith, B. (2014). School-based motivational interviewing
with students, teachers, and parents: New developments and future direction. Advances in
School Mental Health Promotion, 7, 205–207. doi:10.1080/1754730X.2014.949064
Strauss, A., & Corbin, J. (1990). Basics of Qualitative Research: Grounded Theory Procedures
and Techniques. Newbury Park, CA: Sage Publications.
Sugai, G., & Horner, R. (2002). The evolution of discipline practices: School-wide positive
behavior supports. Child & Family Behavior Therapy, 24(1-2), 23-50.

169
Suldo, S. M., Dedrick, R. F., Shaunessy-Dedrick, E., Fefer, S.A., & Ferron, J. (2015).
Development and initial validation of the Coping with Academic Demands Scale
(CADS): How students in accelerated high school curricula cope with school-related
stressors. Journal of Psychoeducational Assessment, 33 (4), 357-374. doi:
10.1177/0734282914552165
Suldo, S. M., Dedrick, R. F., Shaunessy-Dedrick, E, Roth, R. Ferron, J. (2015). Development
and initial validation of the Student Rating of Environmental Stressors Scale (StRESS):
Stressors faced by students in accelerated high school curricula. Journal of
Psychoeducational Assessment, 33(4), 339-356.
Suldo, S. M., Gormley, M. J., DuPaul, G. J., & Anderson-Butcher, D. (2014). The impact of
school mental health on student and school-level academic outcomes: Current status of
the research and future directions. School Mental Health, 6(2), 84-98.
Suldo, S. M., O’Brennan, L. M., Parker, J., Storey, E., Moseley, A., & Shum, K. Z. (2017,
October). Optimizing Academic Outcomes of High-Achieving High School Freshmen via
a Multi-Tiered System of Supports for Mental Health. Paper presented at the annual
conference on Advancing on School Mental Health, Washington, DC.
Suldo, S. M., O'Brennan, L., Storey, E. D., & Shaunessy-Dedrick, E. (2018). Supporting High
School Students in Accelerated Courses. Communique, 46(6).
Suldo, S. M., Parker, J. Shaunessy-Dedrick, E., & O’Brennan, L. (2019). Mental health
interventions. In J. Fredricks, A. Reschly, & S. Christenson (Eds.), Handbook of Student
Engagement Interventions: Working with Disengaged Youth. Elsevier Press.
Suldo, S. M., & Shaffer, E. J. (2008). Looking beyond psychopathology: the dual-factor model
of mental health in youth. School Psychology Review, 37(1).

170
Suldo, S. M., & Shaunessy‐Dedrick, E. (2013). The psychosocial functioning of high school
students in academically rigorous programs. Psychology in the Schools, 50(8), 823-843.
Suldo, S. M., Shaunessy-Dedrick, E., Ferron, J., & Dedrick, R. F. (2018). Predictors of Success
Among High School Students in Advanced Placement and International Baccalaureate
Programs. Gifted Child Quarterly, 0016986218758443.
Suldo, S. M., Shaunessy, E., & Hardesty, R. B. (2008). Relationships among stress, coping, and
mental health in high-achieving high school students. Psychology in the Schools, 45, 273
– 290.
Suldo, S. M., Shaunessy, E., O’Brennan, L., Lee, J. & Shum, K.Z. (in progress). Feasibility of a
school-based Motivational Interviewing intervention for high-achieving youth.
Manuscript in preparation.
Suldo, S. M., Shaunessy, E., Thalji, A., Michalowski, J., & Shaffer, E. J. (2009). Sources of
stress for students in high school college preparatory and general education programs:
Group differences and associations with adjustment. Adolescence, 44, 925 – 948.
Suldo, S. M., Smith, B., Strait, G., Shum, K., Lee, J., & O’Brennan, L. (2018, August).
Contemporary applications of motivational interviewing to youth in school settings.
Symposium presented at the American Psychological Association Annual Convention,
San Francisco, CA.
Suldo, S., Storey, E., O’Brennan, L., Shaunessy-Dedrick, E., Ferron, J., Dedrick, R., & Parker, J.
(2019). Identifying High School Freshmen with Signs of Emotional or Academic Risk:
Screening Methods Appropriate for Students in Accelerated Courses. School Mental
Health Special Issue.

171
Terry, J., Smith, B., Strait, G., & McQuillin, S. (2013). Motivational interviewing to improve
middle school students’ academic performance: A replication study. Journal of
Community Psychology, 41, 902–909. doi:10.1002/jcop.21574
Terry, J., Strait, G., McQuillin, S., & Smith, B. (2014). Dosage effects of motivational
interviewing on middle-school students’ academic performance: Randomized evaluation
of one versus two sessions. Advances in School Mental Health Promotion, 7, 62–74.
doi:10.1080/1754730X.2013.851995
Warne, R. T., Larsen, R., Anderson, B., & Odasso, A. J. (2015). The impact of participation in
the Advanced Placement program on students' college admissions test scores. The
Journal of Educational Research, 108(5), 400-416.
Weisz, J. R., Chorpita, B. F., Palinkas, L. A., Schoenwald, S. K., Miranda, J., Bearman, S. K., ...
& Gray, J. (2012). Testing standard and modular designs for psychotherapy treating
depression, anxiety, and conduct problems in youth: A randomized effectiveness
trial. Archives of general psychiatry, 69(3), 274-282.
Zorzella, K. P., Rependa, S. L., & Muller, R. T. (2017). Therapeutic alliance over the course of
child trauma therapy from three different perspectives. Child abuse & neglect, 67, 147-
156.
Zullig, K. J., Huebner, E. S., & Patton, J. M. (2011). Relationships among school climate
domains and school satisfaction. Psychology in the Schools, 48(2), 133-145.
doi:10.1002/pits.20532

172
Appendix A: Sample MAP Student Graph

173
Appendix B: Reminder Letter
Dear Student,
Thank you for participating in the ACE Program’s Motivation, Assessment, and Planning (MAP)
meeting last month. It was so nice getting to know you better, and learning about your values,
strengths, and goals for the future! I hope all is going well with school!
During our meeting on [Date], we created an action plan to help you use [target skill] more often
in times of stress at school. You thought of great steps for taking action towards reaching your
goal, including:
Step Action By (date)
1
2
3
4
In case you find yourself struggling to meet your goal, don’t forget the great solutions to likely
barriers you came up, including:
Potential Barrier Solution
After [date], we can touch base and talk more about your action plan. In the meantime, please
consider completing the questions below.
Question to Self: Notes to Self:
1 How am I doing in AP Human Geo, in terms
of grades, emotional well-being, and stress?
2 Why is academic and emotional success in
AP important to my future?
3 What are the three good things that would
happen I reached my goal this week?
4 What can I do to make use of my action plan
this week more likely?
I can’t wait to see you in a couple of weeks to learn about your progress with this plan!
Best,
Coach, ACE Program Coach

174
Appendix C: Progress Towards Goal Form
Name: ____________________
Date of meeting:____________
Thank you for taking part in the ACE Program’s Motivation, Assessment, and Planning (MAP)
meeting on [Date]. During our meeting, we created an action plan to help you [insert target] in
times of stress at school. You set a terrific goal: [insert goal] You thought of great steps for taking
action towards reaching your goal, including:
Step Action By (date) Progress
None Some Completed
1
2
3
4
Potential Barrier Solution
Overall progress on goal: [Insert Goal]
+2 Much more than expected
+1 More than expected
0 Expected level of progress
-1 Less than expected
-2 Much less than expected
Item
Strongly
Disagree Disagree
Neither
Agree nor
Disagree
Agree Strongly
Agree
1. I made progress on the goal I identified with
my coach. SD D N A SA
2. I made changes in my behavior based on the
last meeting. SD D N A SA

175
Appendix D: Student Base Graph

176
Appendix E: MAP Meeting Protocol
Motivation, Assessment, and Planning (MAP) Meeting
Protocol Overview
Session Goals, in line with Motivational Interviewing (MI) processes (Miller & Rollnick, 2013)
1. Engage: Establish a positive alliance with the student through (1) a review of the
meeting goals and objectives, (2) exploration of the student’s character strengths,
values, and goals, and (3) discussion of the student’s primary reasons for positive
change. Use reflective listening, simple and complex reflections, and affirmations as
the student share his/her strengths, values, hopes, and aspirations for the future.
2. Focus: Discuss student’s relative strengths and weaknesses on the factors associated
with success among AP/IB students (school engagement and use of coping styles),
and offer normative feedback information using the Elicit-Provide-Elicit cycle. Elicit
student’s own perceptions of these comparisons. Use complex reflections to (a) affirm
strengths, and alignment with values and hopes/aspirations for the future, and (b)
develop discrepancy between current status on behaviors predictive of AP/IB student
success and student’s long-term goals, values, and expressed desire for academic and
emotional health while in AP/IB. Prioritize target behavior to discuss further.
3. Evoke: Pose questions that elicit change talk, such that the student (not you) is
voicing their desire, ability, reasons, and need for positive change on the factors the
student wants to address further. Use simple and complex reflections to mirror back
the student’s change talk and nurture their motivation to take action.
4. Plan: Collaboratively develop an action plan that addresses “how” and “”when” the
student will enact the behaviors they voiced to be associated with their success.
Mobilize the student’s self-proclaimed goals regarding school engagement and use of
coping styles by reflecting continued change talk and affirming their ideas for making
a lasting change. Increase students’ confidence in their ability to enact their plan and
meet their goals by linking their action steps to their strengths, values, hopes, and
aspirations for the future. Ideally by the end of planning the student will be able to
voice their commitment to making a change in their academic and emotional
functioning.
Throughout your discussion, remember to meet the spirit of MI:
• Cultivate change talk through evoking the student’s own language in favor of the change
goal, and confidence for making that change.
• Soften sustain talk by avoiding a focus on the reasons against changing or for
maintaining the status quo.
• Convey partnership with and autonomy for the student by expressing an understanding
that the expertise and wisdom about the change resides mostly within the student.
• Accept the student’s worldview and convey empathy by making every attempt to grasp
the student’s perspective and experience.

177
Use core MI communication skills throughout the meeting:
• Use reflective listening by giving the student your undivided attention to establish trust
and show your interest in understanding their current situation.
• Use simple and complex reflections frequently and focus on your depth in the reflections
to add meaning to the student’s language, especially their change talk.
• Ask open-ended questions that elicit personal reflections and elaborations, and follow
them up with reflective listening to ensure the student feels heard and understood.
• Use affirmations to convey empathy, support, and encouragement of the student’s
personal strengths, resources, and positive efforts.
• Intersperse summaries to highlight connections between statements the student shares, as
well as help transition a student to the next step of the meeting.
• Help student generate own ideas for change strategies; if appropriate, offer information
(avoid being the expert) using the Elicit-Provide-Elicit cycle.
Materials Needed
• Session 1
o Student-specific information:
▪ Character Strengths and Values Discovery results from ACE Student mod. 12
▪ Completed assessment packet (current status on factors associated with AP/IB
student success) if student queries what item responses led to scores on a given
factor
▪ Score report/profile (created using the norms for large sample of AP/IB
students) on the assessment of factors associated with AP/IB student success
o Blank score report/profile (base graph), for use prior to sharing student-specific
report
o AP/IB Student Success Planning Form
o Colored Pencils or Markers (red, yellow, green)
o ACE Student Program binder, to access handouts and worksheets as appropriate
during planning step
• Additional materials needed for session 2
o Progress towards ACE program goal letter

178
Meeting Timeline
MI Step Activities, Strategies, and Objectives Approximate
Length
Step 1: Engage
• Introduction/Re-introduction to coach and meeting purpose.
• Session 2 only: Review progress towards goal
• Review values, strengths, hopes, and goals for the future.
• Summarize how student’s background fits with ACE targets
10 minutes
Step 2: Focus
• Elicit student knowledge of areas related to academic and
emotional success.
• Orient/re-orient student to norm-referenced feedback graph and review individualized graph with student.
• Develop discrepancy between student’s weaknesses and
comparison groups and/or personal goals.
• Agenda map and prioritize area(s) of change
15-20 minutes
Step 3: Evoke
• Pose evocative questions that elicit change talk
• Reinforce any change talk with OARS.
5 minutes
Step 4: Plan • Collaboratively brainstorm strategies for meeting goals using
Problem-Solving Process in Action form.
• Create an action plan that specifies action steps, supports needed,
and a timeline.
• Increase hope and confidence in making change.
10 minutes

179
MAP MEETING STEP 1: ENGAGE
Time: Approximately 10-15 minutes
Purpose: Establish a positive alliance with the student through (1) a review of the meeting goals and
objectives, (2) exploration of the student’s strengths, values, goals and aspirations for the future, and (3) to discuss the student’s primary reasons for positive change.
Part 1: Introduction to Coach and Meeting Purpose
• Share name and affiliation; ask student how they prefer to be addressed.
o Meeting 1: Hi [Name] it’s really good to see you again. As you know, I am [Name]
from the ACE Program. I wanted to thank you for your participation in the ACE
program – you seem to be working hard to be successful in what I am sure are
difficult AP/IB courses – good for you!
o Meeting 2: Hi [Name] it’s really good to see you again. As you know, I am [Name]
from the ACE Program. I wanted to thank you for your participation in our last
meeting. I couldn’t wait to talk with you again as I was so impressed by the goals
you shared with me in our last meeting. I was so proud of how you took advantage of
our time together to consider how you’re doing in AP/IB. I enjoyed working with you
to develop an action plan for how you might do even better in AP/IB, through coping
with stress or engaging at school differently.
• Gauge understanding of meeting and explain reason for meeting with them individually.
o What is your understanding of why we are meeting today?
o Meeting 1: Thanks for sharing your expectations for this meeting! I’d be happy to
share a little more with you. As part of the ACE Program we offer students extra
support through one-on-one meetings like this one, which we call MAP meetings.
We’ve worked with lots of AP/IB students, and have learned what helps them do well
academically and stay relatively happy in the process. The MAP meetings are
intended to help you succeed in AP/IB. We are offering this extra support to lots of
students, including some with room for growth in happiness at school, stress
management, or grades.
o Meeting 2: Thanks for sharing your expectations for this meeting! My hope for us
today is that we can review the goal that you made in our last meeting, and see how
your plan is going so far. Please honestly share how that plan went, so we can
trouble shoot, celebrate, or make a new plan- wherever you’re at I’m just excited to
catch up!
• Share meeting agenda (Student Success Planning Guide p. 1)
o Meeting 1: In the rest of this hour (point to agenda)…
1. I am looking forward to learning about your personal strengths and values,
and how you’re doing with reaching your goals for the future.
2. I will also share where you stand relative to other students in Florida on the
factors that are linked to success in AP/IB as you’ve heard about in the ACE
program in your class.
3. And if you’re willing, I would like to work with you to develop a plan for how
you may boost your chances for doing well in your AP/IB class(es), by
targeting an area through the course of our discussion you come to feel might

180
be most central to helping you achieve your goals. What questions do you have
about this process?
o Meeting 2: In the rest of this hour (point to agenda)…
1. I will review the personal goal you made during Meeting 1 and discuss any
progress you’ve made since the first meeting.
2. I am looking forward to learning about your personal strengths and values,
and how you’re doing with reaching your goals for the future.
3. I will also revisit where you stand relative to other students in Florida on the
factors that are linked to success in AP/IB as you’ve heard about in the ACE
program in your class.
4. And if you’re willing, I would like to work with you to develop a new plan for
how you may boost your chances for doing well in your AP/IB class(es), by
targeting an area through the course of our discussion you come to feel
might be most central to helping you achieve your goals. What questions do
you have about this process?
o I am recording this meeting because it will help me do my best with you. The MAP
meetings are part of a research project, and members of the research team will
review the audio file to make sure I’m doing a good job. The file will not be shared
with anyone at your school, and my research team will destroy it as soon as our
project is complete. Are you okay with this?

181
Review students’ goal from Meeting 1
• Restate goal written on Student Success Planning Guide if student has trouble
remembering.
o In our meeting last month, we talked a great deal about how you may boost your
chances for doing well in your AP/IB class(es) by targeting a factor on the graph
you felt might be most central to helping you be successful. Tell me your
understanding or recollection of the goal you made last time we met?
• Elicit student change talk through a review of importance of attaining initial goal.
Reinforce any change talk through simple and complex reflections.
o Why was [restate goal] something you wanted to work on?
o Example reflections:
▪ You saw talking to your teachers, in particular your math teacher, as
being crucial to being successful in your IB program.
▪ Making a list of your upcoming assignment is something you identified as
important.
• Ask open-ended questions to encourage student to elaborate on the importance on
change:
o What benefits come from talking to your math teacher in times of stress?
o Why did you think [insert goal] would be helpful?
Discuss Current Progress towards Target/Goal
o Bring out Progress towards ACE Program Goal letter to remind student of their specific
goal and action steps identified in Meeting 1.
o In our last meeting, we brainstormed ways to make that goal happen. I
handed/sent a card to you a few weeks ago with a reminder of the plan we created
to help you reach that goal.
o Tell me all about how you feel your progress towards your goal is coming along,
like what steps, if any, you have taken? Some students I’ve spoken to this week
said, “Man, I totally forgot all about it,” while other students completed part of
the plan or told me about the many steps they completed.
o While student discusses progress made with change plan, mark none, some, or completed
next to each action step listed on their “Progress Towards ACE Program Goal” form.
o Enhance students’ confidence and hope (see Part 4 of Step D- Plan)
o Ask the questions listed in one of the 2 boxes below based on the student’s reported
progress towards their goal.
o Box 1: If student reports making LITTLE to NO PROGRESS toward goal
o Box 2: If student reports making SOME to A LOT OF PROGRESS toward goal
IF THIS IS MEETING 1, skip the following steps and proceed to Part 2: Review values,
strengths, hopes, and aspirations for the future
IF THIS IS MEETING 2, proceed with the following steps.

182
Box 1: If student reports making LITTLE to NO PROGRESS toward goal
➢ Make empathetic statements that communicate understanding.
➢ You have faced a lot of challenges this past month, both at school and at home, that
have kept you from sticking to this plan.
➢ Ask open-ended questions to evoke any steps the student may have taken towards
reaching their goal. Affirm and reinforce any steps the student has taken.
➢ Tell me about any steps you’ve taken so far to improve or even keep stable your
[target].
➢ Evoke examples and details regarding any barriers the student may have faced. Follow up
by expressing understanding through simple and complex reflections.
➢ You made some headway on improving your time and task management by getting a
planner, and found it tiresome to continue using the planner week after week and
stopped. Practicing new habits can be very challenging, but I commend you for trying
something out, even if it was for a brief period of time!
➢ Evoke potential benefits of working to manage and overcome the expressed barriers.
Yoke any positive improvements in academic/emotional status to change efforts for the
target, as well as any potential declines in academic/emotional status to lack of change
efforts.
➢ Even though you found using a planner burdensome, you also felt like it was easier to
remember your assignments and their due dates when you wrote everything down.
How might continued use help with your academic/emotional success?
➢ It was really challenging for you to keep a positive mindset when faced with multiple
tests and assignments. You also realized your negative thinking before a test got in the
way of you feeling confident about your performance.
Box 2: If student reports making SOME to A LOT OF PROGRESS toward goal
➢ Affirm student’s ability to make progress on their goal.
➢ It’s clear you took your goal of improving your time and task management very
seriously as demonstrated by all the progress you’ve made!
➢ Ask open-ended questions to evoke the steps taken towards reaching their goal. Affirm
and reinforce steps the student took towards accomplishing their goal.
➢ Tell me about the steps you’ve taken so far to improve your [target].
➢ For example, what did yesterday after school look like for you as you applied your
plan to “stop procrastinating.”
➢ What does the future hold if you continue sticking to this plan like that?
➢ Evoke examples and details regarding progress. Highlight these efforts through
reflections and affirmations.
➢ How were you able to ask for help from your teacher?
➢ Tell me more about what allowed you to be successful this time around.
➢ Who, if anyone, helped you make this progress?
➢ Evoke potential benefits of working to manage and overcome the expressed barriers.
Link positive improvements in academic/emotional status to change efforts for the target.
➢ Since you started making progress on your plan, what changes (either
academically or emotionally) have you seen in yourself?
➢ [After student describes academic gains]: Wow, you’ve raised your C to a B in
only 1 month. And what changes in your mood and stress have you seen?

183
➢ [After student describes emotional improvements]: Wow, you are feeling more
confident, less stressed, happier, more social since making those changes. And
what changes in your work completion, grades/test scores have you seen?
➢ Yoke positive improvements in academic/emotional status to change efforts for the target
through complex reflections and affirmations.
➢ These efforts are helping you make progress toward reaching [insert goal], which
has helped you get your work done on time and be better prepared for tests!
➢ The strengths you’ve shared with me helped you face barriers as you enacted
your change plan! Your efforts are clearly paying off in your lighter mood, too;
the way you’re taken control of your stressors is inspiring to witness.
Summarize Your Understanding of the Student’s Current Progress toward Goals
• Provide a transition summary by compiling your understanding of the student’s current
situation and transition to focus – for example:
o [Student making little progress] Since I’ve seen you last, you’ve continued to use
your strengths of perseverance and open-mindedness, as well as support from
family and friends to help you reach your long-term goal of going to college.
When we last met you set a goal of becoming involved in three extracurricular
activities at your school. However, this was complicated by transportation and
not feeling confident in your ability to make the team. For all of us it’s quite
challenging to change our situation and try new things, so I commend you for
starting the process and acknowledging the setbacks you’ve faced.
o [Student making good progress] Since I saw you last, you have used some of your
strengths of humor and kindness to feel more connected to people in your IB
classes. That’s great, because you view success in IB classes as necessary to be
optimally prepared for pursuing your goal of graphic design in college. It sounds
like you’ve made quite a bit of progress towards the goal you set of seeking
academic support from your Inquiry Skills Teacher when stressed! You are
participating more in class, asking him for homework help after class, and even
contacting him via Edsby after your grades were posted. You’ve seen a change in
your grades in class, happiness with life, and overall confidence and satisfaction
with the class since enacting your plan.

184
Part 2: Review values, strengths, hopes, and aspirations for the future
• Be transparent about direction of session.
o Meeting 1: I want to thank you for coming by earlier to complete that packet of
questionnaires that [USF research team member] gave you. I’ve looked it over,
and I’ll have some questions to ask you later.
o Meeting 2: I want to thank you for coming back for a second meeting. Since we
have discussed your progress towards goal, I’d love the opportunity to spend the
rest of our time brainstorming a plan to further enhance your emotional health
and academic success in AP/IB by revisiting the coping or engagement targets
you feel make sense to strengthen. Before that, I’d actually like to know you a
little better.
• Transition to values, strengths, and goals by asking about things of importance.
o Right now I’d like to get to know your values, personal strengths, and goals for
the future. What are the most important things in your life right now?
• Review previously identified values and strengths [Student Success Planning Guide p. 2].
Use simple and complex reflections to follow-up the student’s responses, and link
current and future goals to values and strengths.
o I have here the results of the personal values discovery and character strengths
identification activities and that you completed earlier. I wonder if you might
review these with me.
o You identified [insert values here] as the most important to you. ▪ If links between opening question (things of importance) and sorted values
not clear: Tell me more about the value that might be the most important
to you, in other words the guiding principle/belief that matters most to
you. How would others say you exemplify this value?
o You identified your character strengths as [insert strengths here]. Tell me more
about one of these strengths that the people closest to you would describe as best
capturing what makes you special.
o Jot down additional value(s) and strength(s) that emerge during the conversation.
• Discuss student’s long-term goals using open-ended questions and reflect back using
simple and complex reflections. Link back to strengths and values when possible.
o Tell me what you see yourself doing after high school.
o How might your strengths help you attain your goals?
o How might your values affect your future life (career, family life, etc.)?
• Ask open-ended questions to help the student make the connection between their goals
and values with academic and emotional success in AP/IB. Follow up any expression of
hopes or future plans with complex reflections to identify and affirm the strengths,
values, and goals expressed by the student.
o Bringing it back to the here-and-now, how does being successful in AP/IB
classes- both academically and emotionally- fit in with your goals and values?
o Being in an AP class (IB program), how does that fit into your future goals?
• Use a linking summary to reflect what the student has just shared and link it to things
they shared previously (strengths, values, long-term goals) and amplify any change talk.
o You see taking AP classes as challenging you academically, and helping you
learn more complex content as well as meet other bright students you might study

185
with throughout high school, and that falls in line with what you told me at the
beginning of our meeting about your desire to go onto a prestigious college.
• Ask open-ended questions to elicit connections between student’s short- and long-term
goals and their school engagement and use of coping styles. Optional: reference page 2 of
the Student Success Planning Guide that lists the coping and engagement factors, when
posing questions like:
o How might the coping strategies - like positive thinking, seeking support, and time
management - you learned in the ACE program [reference page 2 of planning
guide] help you achieve [insert short-term class goals or long-term life goals
student just shared]?
o How might the school engagement strategies – like being connected to your
teachers and getting involved in extracurriculars - you learned the ACE program
[reference page 2 of planning guide] align with your goals?
• Affirm the student’s beliefs, intentions, and effort in this area. Connect your affirmation
directly to the general goals of the intervention.
o Your family obviously supports your school engagement and intentional efforts to
cope with the stress of AP classes – what a valuable asset.
o You put forth the extra effort to be organized and seek out support when needed,
both of which will really help you manage the academic demands of your AP/IB
schoolwork and stay emotionally healthy.
o Your strengths of kindness and wisdom comes through in your motivations for
connecting with your IB classmates (to help others with their work when
possible); what valuable assets you bring to new relationships!
Part 3. Summary of student’s background
• Provide a collecting summary that communicates your understanding of the student’s
current situation using complex reflections to pull together the student’s values,
strengths, and future goals, while placing emphasis on any change talk that the student
has brought forth. End with a question that invites the student to add details, comment on
the accuracy of your understanding, or ideally elicit more change talk. For example:
o Seems like a close knit family and persisting on something you set your mind to do
[discovering new things/bravely taking on new challenge] are strengths and
values that you associate with doing well in school and coping with all the
stressors associated with AP courses. And succeeding in AP classes helps out
with your big picture goal- getting into the University of Michigan. You’ve got a
plan, support, and the willingness to make the changes you want in order to make
this happen!
o You’ve moved around a lot in your childhood and shown an amazing ability to
make meaningful, lasting connections at school. Some of those connections turned
out to be great resources in times of stress. You’re now in yet another new school,
and have a chance to use your strengths of love, kindness, and perspective again
when getting to know new people and becoming more involved in activities. You
recognize that getting involved will help you get the most from this IB program
that aligns so nicely with your appreciation for critical thinking and global travel.
What else, as you think about how the IB program fits in with the future you see
for yourself?

186
If a student appears disengaged during the engage section, ask yourself:
• How comfortable is this student in talking to me?
o If the student seems visibly uncomfortable (jittery, avoiding eye contact,
teary-eyed) or appears defensive say, “I’m so sorry, I feel like I’ve caused
you to be concerned about our meeting - maybe it was something I said or
how I’ve approached our work together. I want to make sure that you feel as
though this is a helpful process- what can I do to help you feel more
comfortable?
• Does this feel like a collaborative partnership?
o If you find yourself in the expert or question/answer trap attempt to slow
speech and provide extra waiting time following open-ended questions and
reflections.
o Have a more global discussion about the student’s values, aspirations, etc.
that the student shows interest in by asking “____ does not seem to be of
interest, but are there other topics that are important in your life right now?”
or “What’s something you’ve been considering changing in your life as it
relates to school?”
• How comfortable do I feel in this conversation?
o If your behavior is related to the disengagement be transparent about your
feelings. “I want to pause for a moment because I’m feeling a little
nervous/flustered/distracted right now and it’s gotten in the way of me being
fully present with you right now. My apologies for that. Do you mind if we
start again?”

187
MAP MEETING STEP B: FOCUS
Time: Approximately 20-25 minutes
Purpose: Discuss student’s relative strengths and weaknesses on the factors associated with
success among AP/IB students, and offer normative feedback information using the Elicit-
Provide-Elicit cycle. Elicit student’s own perceptions of these comparisons.
Part 1 (MAP MEETING ONLY): Elicit student knowledge regarding the areas related to
academic and emotional success.
• Affirm students’ participation in the ACE Student Program. If discussion of ACE targets
did not occur during Engage, elicit student’s memory of ACE modules.
o You’ve worked a good deal during the ACE modules on the areas related to
academic and emotional success – these are listed out on p. 2 of the Student
Success Planning Guide. What was the most helpful thing you learned in the ACE
Program modules?
• Elicit student’s memory of—and emotions around—the pre-MAP intervention survey.
Respond with simple/complex reflections dependent upon the student’s use of sustain or
change talk.
o You recently completed a 10-page survey packet that asked you to rate yourself
on the factors discussed in the ACE Program. Tell me how it felt to rate yourself
in some of these areas.
o What did you learn from completing those surveys?
• Establish data review process as collaborative partnership. Respond with
simple/complex reflections dependent upon the student’s use of sustain or change talk.
o I’d like to review/revisit your responses to the survey together now. Many
students that we’ve met with in MAP meetings have appreciated seeing their own
results compared to responses from the thousands of other AP/IB students we’ve
surveyed before – how might seeing this comparison be helpful to you?
o [OPTIONAL, pending amount of time permitted for the meeting as student
writing extends session time somewhat] Some students find it easier to write down
their thoughts in addition to talking. You can use the “AP/IB Student Success
Planning Guide” throughout our talk today – if you like – or not, it’s up to you.
For instance, you can color your personal strengths (higher scores) in green,
neutral/average behaviors in yellow, areas for growth (lower scores) can be red.
Also, you can mark on this graph with colors, like circle your strengths in green.
Part 2: Orient/re-orient student to norm-referenced feedback graph (*limit to 2 minutes)
• Present the base graph (without the student’s data included) to orient the student to
factors presented on the X axis, and mean scores among comparison groups. Use a blank
sheet of paper to show small portions of the graph if student seems overwhelmed.
• We have organized the graph into four areas:
1. The first area focuses on Effective Coping Styles, which includes coping styles
like time and task management and positive thinking. If you think back to the
“Coping Chart” we shared with your class, these styles were associated with
higher academic achievement and emotional well-being. Because higher scores

188
here tended to co-occur with better academic and emotional wellness among
AP/IB students in prior research, there is gray shading above the midline to
indicate the direction of scores that may be most healthy (point to gray section;
before the meeting, the coach can use green colored pencil or crayon to add color
to the gray section, and refer to “green” rather than “gray” throughout).
2. The second area focuses on Ineffective Coping Styles, which includes behaviors
research suggests to limit, like withdrawing and relying on self when faced with
stress, and various forms of avoidance. Because lower scores here co-occurred
with better academic and emotional wellness among AP/IB students in prior
research, the gray shading is below the midline here (point to gray section).
3. The third area focuses on Student Engagement, which includes things like
involvement in extracurricular activities and school connectedness. Again, higher
scores (closer to the gray area) are linked to better outcomes for most students.
4. The last area deals with things at Home, such as your perceptions of your
parents’ emotional warmth and support, and how much they promote your
independence. Higher scores here [point to gray] are also often associated with
better academic and emotional outcomes for students.
In the event the target student’s scores within positive parenting practices are
low:
o When we talked with your class about factors research has shown predict success
in AP/IB, we noted successful students tend to perceive their parents support them
and also promote their independence..
o Our ACE program in the classroom focused on the first 3 areas because these are
things more within students’ personal control to work with us to change or
improve.
o However, in these individual meetings, we offer students complete feedback on
how their levels of factors related to student success map on to typical levels
reported by lots of AP/IB students.
o This section of the graph is not an exhaustive look at all parenting practices,
family factors, or parent-child relationship issues, but a focused look at two
aspects of authoritative parenting practices (warmth/support, autonomy
promotion) studied in prior research and shown to correlate with AP/IB student
outcomes. Many other home factors- like parental absence or neglect, amount of
fighting in the home, etc. are not reflected in these two factors of parenting
practices.
If Student has Significant Elevations in Ineffective Coping Styles:
Reduce stigma through acknowledgement of AP/IB students’ use of these factors.
o Researchers have an understanding of what these terms mean, but different people
have a different reaction to these labels- do you have a strong reaction to any of
them? Like what does “taking short cuts” mean to you?
o Lots of students report they feel unable to stay on top of their schoolwork unless
they swap notes or divvy up assignments with classmates (which falls under
“Taking Short Cuts” because it often goes with other stress reactions like copying
other students’ work)
o Many students may give in to the exhaustion for a bit by taking naps, or going to
sleep early to either recharge or escape (which fall under “Sleep More”).
o But such coping styles are listed here within “Ineffective” based on research
showing that the more often these behaviors occur, the less likely a student is to
have long-term success in general…

189
• Explain gray and white columns of graph
o These gray bars represent overall scores in broad categories, such as levels of
coping with school-related stressors through Problem-Focused strategies or
Avoidance strategies, levels of School Connectedness, levels of Extracurricular
Activities, etc.
o The white columns that follow a gray bar give levels of more specific coping
styles and behaviors within a particular category. For example, effective coping
styles such as time and task management, positive thinking, and turning to family
are all placed in the Problem Focused Coping category.
• Explain the two comparison groups on graph
o There are also two points of comparison for you. You can compare your scores
to: (1) The average responses of over 2,300 AP/IB students that we previously
surveyed, which is represented by the (purple) dashed line across the middle of
the graph (before the meeting, the coach can trace over this dashed line with a
purple marker, and refer to “the purple line” for the average AP/IB student). ▪ Optional explanation: This is the mathematical
average score from the students in the sample
on each factor. It is not indicative of how the
average student in the sample performed
academically or was doing emotionally; just
the most common score on a given variable across 2300 students from 20 different AP or
IB programs.
o (2) A subgroup of a few hundred students who
are particularly successful both academically
(high GPAs and test scores) and emotionally
(happy, not burnout at school or emotionally
distressed). The average score within this
group is reflected in the (blue) dashed line
that runs above and below the average score
(before the meeting, the coach can trace over this dashed line with a blue marker,
and refer to “the blue line” to reference particularly successful AP/IB students).
• Check for understanding and expectations.
o What questions do you have about the information in this graph?
• Transition to a focus on the student’s own scores (levels)
o [OPTIONAL] Pose in the event the question “how might seeing this comparison be
helpful to you” (page 7) was not explored earlier.
• How might seeing your levels of engagement and coping compared to the
average AP/IB student and students who are academically and emotionally
successful be helpful?
o [OPTIONAL] Pose in the event a student has not already shared what they think of their
status on the various ACE targets during earlier parts of the interview:
▪ What do you expect to see in your scores?
▪ What areas do you feel are your greatest areas of strength?
▪ What areas do you feel have the most room for improvement or growth?
Facilitator Note:
Student responses to survey packet
entered into a scoring program and
compared against the responses of
2,300+ other AP/IB students from
20 FL high schools (mean score =
50, as reflected in the dashed line). Successful subgroup = top 10% of
norm sample that met all indicators
of emotional success (high life satis-
faction, no mental health problems,
low school burnout) and academic
success (GPA > 3.0, passing scores
on end-of-course AP/IB exams).

190
o Let’s walk through a graph that has your scores along with these other two lines of
scores, so you can see how your scores compare to other students.
Part 3a: Review individualized norm-referenced graph with student
• Before the meeting, use a highlighter or orange marker to trace over the student’s score
line, and refer to “the orange/highlighted line” to reference the student’s scores.
• Orient student to their scores on the graph and allow them 1-2 minutes to review their
graph and independently identify their personal strengths.
o This colored line shows your current level on each factor associated with student
success, based on your responses to the 10-page packet you completed. I’d like to
offer you a chance to silently look at the graph before we talk about it together.
o [OPTIONAL] As you’re reviewing your scores, some students find it helpful to
circle their greatest strengths in green and any areas of concern we may want to
discuss together in red. I’ll give you a few minutes for you to review your graph
independently and color on it if you’d like, let me know when you’re done
processing.
▪ To further reinforce the concept the coach can circle an example of a clear
strength (point on graph within or close to green shaded section) in green
and clear weakness (point on graph far from green shaded section) in red.
• Review 1-2 student’s relative strengths in coping, engagement, and home support (factors
in shaded area and/or above comparison line). Respond with simple and complex
reflections and affirmations. (*try to limit to 3 minutes, vs. 5-7 minutes)
o What do you make of… the scores you identified as your strengths? […your
scores that are in or closer to the green areas…at/near/above the blue line]?
o [OPTIONAL] Point out 1-2 additional relatively high-scoring factors student
neglected.
• Transition from strengths to weaknesses. Review 1-2 relative weaknesses and other areas
for growth.
o Thanks for discussing your coping and engagement strengths with me! Let’s turn
our attention to areas that indicate room for growth.
o [After student self identifies areas for growth] What do you make of these scores?
o Are there particular areas or categories that are far from the shaded areas that
you’d like to talk about in more detail?
**As student discusses each factor, go through Part 3b (next step) to develop a discrepancy
between their score and the comparison groups.**
If student avoids addressing weaknesses or engages to sustain talk:
• Ask for permission to point out 1-2 weaknesses in line with the coach’s case
conceptualization of what may be a particularly important target to discuss by asking,
would it be ok if we discuss an additional factor on the chart?
• Factors to point out: (a) particularly low-scoring factor(s) a student should have on
his/her radar (i.e., “elephant in the room”), (b) a factor that was suggested as important
during the engage process, or (c) a factor that- if improved- is likely to lead to further
improvements in other areas.
• As time permits provide information on remaining factors assessed in the selective
assessment, by systematically going through the identified variable, unpacking the larger
category (e.g., problem focused) into its component elements (e.g., time and task
management, positive thinking, turn to family, etc.).

191
Part 3b: Develop discrepancy between student’s weaknesses and comparison groups and/or
personal goals and standards. Elicit reactions, comprehension, and student’s interpretation
to feedback.
• Ask open-ended questions to guide student to make
an observation and then reflect on their thoughts and
feelings regarding a discrepancy (score that reflects a
relative weakness).
o What do you make of your score, in [target
behavior] that is kind of far from how other
students’ scored, or from where you want to
be? OR When you see your score compared to
others students’ scores, what goes through your
mind?
o How does your [low/high level of target behavior] line up with your future plans?
o What popped out to you as an area that has some room for growth and is
important for your success?
• Reflect the discrepancy between a student’s scores and (a) desired levels of functioning
in AP/IB and/or (b) personal values and strengths. Bring conversation back to the student
personally, i.e., how they think they’re doing relative to their personal standard.
o You’ve identified a gap between yourself and [the sample of successful AP/IB
students; the average score; student’s personal goals, standards, values] in
relation to [target behavior].
• Use simple and complex reflections to summarize how student’s current behavior is
affecting their academic performance and focus on student’s change talk.
o How is your current level of [target behavior] likely affecting your performance
in AP/IB classes?
o How would improvements in that area be in line with the goals and values you
shared with me earlier?
• Provide a collecting summary that communicates your understanding of the area(s) the
student previously justified that s/he believe would be helpful to focus and improve
upon. End with a question that invites the student to add details, comment on the
accuracy of your understanding, or ideally elicit more change talk.
• Transition between identified weaknesses.
o This sounds like something that is important to you. Is this key to your success
and should be the focus for the rest of our meeting, or is there something else you
circled in red that you’d like to explore first?
o This sounds like something that is important to you. Let’s keep that in the back of
our minds for right now, because I want to make sure we have enough time to
talk about any other areas where changes might be helpful.
If the student has clear initial goals and concerns in mind:
If the direction for change is clear to you both, don’t spend too much time in this focusing
stage. Make sure you’re on the same page (“I want to make sure I’m clear regarding what
you think is best for us to work on together – can you share with me again just what you think
the priority is?)
Facilitator Note:
Start by ensuring they are interpreting
the graph correctly, and understand
their target behavior is more/less/
same than a normative sample on the
graph OR their own report of
observations of “successful” kids at
their school. Point to green area or comparison lines depending on which
group student has pointed out before.
Start by ensuring they are
interpreting the graph correctly, and understand their target behavior is
more/less/same than a normative
sample on the graph OR their own
report of observations of
“successful” kids at their school.
Point to green area or comparison
lines depending on which group
student has pointed out before.

192
OPTIONAL: Pose additional open-ended questions if student reports little or weak change
talk during Part 3b, or had circled additional scores in red in 3a.
• Prompt for discussion of other targets with room for growth:
o What’s another factor you see on the chart that you
notice is kind of far from where you might like it to be?
o If student doesn’t see anything: Here’s what I noticed,
what do you think of that?
• Gauge student’s reactions to relative strengths and weaknesses.
Reactions may range from surprise to marked self-awareness of
their strengths and challenges.
o Does this information match what you expected you would find when completing
the survey?
▪ Note: Questions about accuracy of predictions are optional, as prior self-
awareness is likely not as crucial as increasing change talk. This type of
question, though, might help transition to agenda mapping.
Part 4: Agenda mapping; Prioritize areas of change in a way that balances students’
autonomy with assessment data
• Label and affirm relatively high scores noted.
o Thanks for spending that time getting to know you. We have talked about a lot of
different things, like your strengths in [reference targets near green]. You have a
lot of things going well!
• Give student autonomy to identify what factors may be important to
maintain/improve/decrease. Make it clear where you’re heading for rest of conversation.
o You are very insightful, and understand [list factors identified as having room for
growth] have room for growth. Let’s take
some time to discuss which issues seem
MOST pressing or important to you at the
moment.
• Consider options student circled on the graph and
make a list if needed. If student voices a target not
discussed already then say:
o You saw X and Y on the graph, but Z stands
out as the top priority for you.
• Offer additional options as indicated.
o Another possibility that occurs to me is [coach’s idea
for focus]. We could consider that as well, or maybe
that’s for another time.
• Allow the student to prioritize and select area of focus.
o Let’s prioritize. What do you think is the most
important thing to work on first?
• Provide a transitional summary to evoke.
Facilitator Note:
It’s not essential that a student
choose to focus on the score with the
largest discrepancy. A coach may suspect that targeting a very low
score may hold the most obvious
path to improvement, but growth on
a factor with even a small
discrepancy may still serve a
promotive effect and align better
with the student’s values, desires,
and perceived abilities (target
capable of working on). The
difference should be large enough to
provide motivation but not so large as to be demoralizing (accompanied
by extreme lack of confidence).
Target factor must be important +
feasible to change.
Facilitator Note:
If new target areas are
identified return to Part
3b (developing a
discrepancy) to elicit their reaction to the
data.

193
o I’m with you on this, and think that you’ve identified an area that we can work on
together.
o Complete Step 1 of the Problem-Solving Process record form. Either the student can
complete the form or the coach can complete in a discreet manner if the worksheet might
distract from the conversation.
o If it’s ok with you, I would like us to take some notes while we talk so we capture all the
great ideas you have. Would you like to write, or do you prefer that I do?
• Partner with the student to identify a concrete goal and/or replacement behavior, particularly if
the student chose to focus on limiting an ineffective coping style. Record the goal in the top part
of the Action Plan if desired. Example questions:
o How will you know when success in this area has occurred?
o How much school do you want to attend?
o How many uninterrupted hours of sleep do you want to get each night?
o How much of your work do you want to complete independently?
o How many extracurricular activities do you want to get involved in?
o How many hours per week would you like to spend in extracurriculars?
Part 5: Summarize discrepancy and transition to evoke
• Affirm student’s ability to identify areas for growth and summarize factor identified as an area
for change.
o Thanks for setting that admirable goal with me. Success in AP/IB and attaining [future
aspirations/values] is something you hold dear, and you view [current level of target
behavior] as standing in the way of your hopes and dreams. You’re ready to make some
changes and use some strategies to address [target behavior].
• Provide a transitional summary to evoke.
o I’d like to help you plan how you will do this, but first have a few questions.

194
MAP MEETING STEP C: EVOKE
Time: Approximately 5 minutes
Purpose: Pose questions that elicit change talk, such that the student (not you) is voicing the
rationale for positive change on the factors you just discussed. Use complex reflections to
highlight discrepancy between current and desired status in terms of academic and emotional
health, and status on behaviors predictive of those outcomes.
Part 1: Elicit and reinforce change talk
• Ask at least two evocative questions to
which the student describes their own
desire, ability, reasons, and need (DARN)
to improve the status of their school
engagement or use of coping strategies.
o Desire: Why is [target behavior] so important to you? (…for success in your
AP/IB courses/program)?
o Ability: We've discussed a number of your strengths, how can these be helpful in
approaching the areas that you’ve identified?; What strengths and powers do you
have in yourself that might help you [target behavior]?
o Reasons: What are the three best reasons for making a change to [target
behavior]?
▪ If client responds with only 1 or 2 reasons for making a change then
reflect this change talk and do not continue pressing for more reasons.
o Need: What do you suppose the future holds if you are 100% successful in [target
behavior]? OR What is the worst thing that can happen if you don’t approach
[target behavior]? Followed quickly by Ugh, yeah that’s no good, what is the
best thing that can happen if you do.
• These questions do not stand alone. When you hear any form of preparatory (DARN) or
mobilizing (CAT) change talk, it’s important to follow up with a thorough exploration
using complex reflections and ask open-ended questions to gather additional
information. Examples of follow-up statements and questions:
o Tell me more.
o I’m interested in an example or two.
o What would that look like?
o Wow, I can tell you really thought about this. When you set your mind to
something, it’s really going to happen.
o You know how you don’t want to feel and really want a change.
Part 2. Following a sufficient amount of change talk, ask a key question.
• Gauge readiness to change the target by using the importance ruler:
o On a scale of 1-10, how important is it for you to [target behavior] and succeed
in your AP class? and/or How important is it for you to [target behavior] to stay
emotionally well while taking AP classes, like to manage your stress so that you
are happy?
o Why are you a [student’s number] and not a [number – 2]?
Facilitator Note:
While the student voices their desire, ability,
reasons, and need for making a change in their
behavior, record big ideas on Step 2 of the
Problem Solving Process form (“Determine the
Potential Benefits of Addressing those Factors”).

195
Part 3. Move to planning with a transition summary.
• Provide a transition summary that reflects all the key change talk statements voiced by
the client in Part 1. For example:
o Let me pull together what you just shared before we move onto making a plan of
action. Lately you’ve been feeling a lot of stress in your IB program. You really
would like to get along with your IB Biology teacher because you see how a
positive relationship with her could help your grades, and also your happiness
during that class. When you started disengaging in the class you noticed your
grade started to slip, and it was the D on the last test—that really got your
attention. You’re a pretty resourceful, optimistic person and eager to make a
change in how you approach this class. You’ve overcome struggles like this in the
past and believe you can do the same now. Is that about right?
• Transition to planning.
o Sounds like [target behavior] is something you want to get started on –What are
some ideas/strategies/steps you could take, or have already taken, to help you
reach this goal?

196
MAP MEETING STEP D: PLANNING
Time: Approximately 15 minutes
Purpose: This stage should culminate in a specific plan of action that targets the areas in need
of improvement discussed earlier in the session. Students should (a) express commitment to
change, and (b) leave with an action plan. It is important to continue to engage, focus, and
evoke throughout this planning process.
Part 1: Elicit and reinforce change talk
• Affirm initial ideas regarding steps to take towards positive change.
o You’ve clearly given [some / a lot] of thought to how you want to get started.
• Introduce collaborative problem-solving process.
o How do you feel about us working together to create an action plan for those
factors you noted you might want to maintain or improve?
o You’re the expert on your life so you know what works best. I’m an expert on
changing these things, so I might have some ideas to offer.
Part 2: Help the student brainstorm strategies for meeting goals in prioritized areas using
Problem-Solving Process in Action form
• Ask open-ended questions to prompt the student to generate alternate solutions for making
positive changes with the first target (behavior to maintain or change) and write them down
on Step 3 of the Problem-Solving Process form.
o What has helped in the past to address that behavior?
o What have you seen work for your classmates or friends?
o How much do you want me to offer some ideas, including some strategies we shared
during the ACE Program that have worked for other students? [Use ACE Program:
Potential Strategies Cheat Sheet for ideas]
• While completing Step 3 continue using OARS to gather more details to reinforce change
talk, and elicit the advantages of those optional strategies that are consistent with change. For
example:
o You see talking to your teachers, in particular
your math teacher, as being crucial to being
successful in your IB program. Why?
o So making a list of your upcoming assignment is
something you are willing to try. Why might that
be helpful?
o What are 1 or 2 of the biggest “pros” of that option?
• Encourage student to select the best solution(s) (Step 4 of Problem-Solving Process in Action
form).
o You came up with some great ideas! Among the solutions you generated, which
one(s) would you like to try out?
• Encourage students to celebrate successful outcomes when this solution works, and to pick a
different solution if the outcome is not as positive as planned (Step 5)
Facilitator Note:
Do NOT solicit cons for a potential
solution, as focusing on the disadvantages or drawbacks of any
potential change essentially serves to
elicit sustain talk.

197
Part 3: Create an action plan that specifies action steps, supports needed, and a timeline.
• Complete p.5 of the Student Success Planning
Guide (Action Plan) by breaking down the action
plan into small, doable steps. Provide reflections
and affirmations throughout this action-planning
process, rather than a sole focus on the plan
logistics.
o The target most important to you is
[reflect student’s choice] and your goal
is [reflect student’s choice, while filling
in the top column of the Action Plan].
o The solution(s) you choose to do are
[reflect student’s choice].
• If a concrete goal or replacement behavior was not identified early in the meeting (e.g., end
of Focus), set behavioral goal now prior to developing action steps.
o I wonder if setting a specific goal would help you to know what you’re striving
towards. How would your overall goal of [insert goal] play out in a typical week?
o How will you know when success in that areas occurs?
▪ What specific time and task management strategy would you like to focus on?
▪ How much school do you want to attend?
▪ How many uninterrupted hours of sleep do you want to get each night?
▪ How much of your work do you want to complete independently?
• Ask open-ended questions that evoke mobilizing change talk through commitment,
activation, and taking steps (CAT). After each question pause to reflect the action steps the
student plans on taking.
o Preparing: What would be a first step?
o Setting a date: When could you do that?
• Ask optional follow-up questions that continue to generate mobilizing change talk
o Getting more specific: What would you need to start this?
o Evoking change talk: How confident are you in taking this step?
o Asking for commitment: How committed are you to this change?
• Complete “Sticking to My Plan” portion of Action Plan by reframing challenges, finding
ways for the student to hold themselves accountable, and discussing which supports are
needed to accomplish plan.
o How can you stick to this plan?
o Who can you share your progress with as you move through this action plan?
• Complete “Anticipating Bumps in the Road” section of Action Plan by using confidence
ruler to identify barriers
o On a scale of 1-10, how confident are you that you [describe change specifically]?
o What is getting in the way of you getting to a ___ [insert a number one or two
higher than the number given]?
o The answer to the confidence ruler are potential barriers the student currently sees.
Use handout and identify strategies for overcoming barriers.
o Knowing that this barrier might get in the way, what are some possible solutions to
overcome this obstacle?
Facilitator Note:
Throughout planning, evoke confidence by
referring to students’ strengths. Display the
top of p. 3 as a visually reminder of a
student’s strengths and values. Integrate the
student’s strengths and values when
reflecting their change talk (e.g., You are
pulling on your strength of creativity and
truly thinking outside the box to come up
with these ideas; It’s so clear your family is
important to you, as you’ve tied them into
supporting you on this action plan.)

198
Part 4: Increase hope and confidence in change
• Ask open-ended questions to evoke/review and elaborate examples of prior successes
and efforts/attempts to change. Re-affirm strengths, and boost student’s confidence in
his/her ability to make the desired change and be successful. If available, reference those
success examples shared in “You at Your Best” writing activity from Module 12.
o When you’ve used your strength of open-mindedness before, what did that look
like?
o The last time you tried [specific solution], what did you learn through the process?
• Reflect change talk specific to student’s ability to make positive change in various areas
of life, currently (and not necessarily limited to coping and student engagement) as well
as in the past.
o Tell me more how you were able to succeed/try [prior change, success, or effort].
• Affirm prior efforts to change and reframe as one step closer to lasting change. Each
time someone makes an effort to change, they learn something about change.
• Ask open-ended questions regarding the future, and make complex reflections that
yoke previously stated values and goals to importance and the initial behaviors being
elicited.
o How are you feeling now that you’ve made this action plan focused on improving
[target behavior]?
• Summarize the reasons given by the student that indicate confidence about change.
o Increasing your positive thinking is really important to you. You’ve seen the direct
connection between your thoughts and your happiness, and negative thinking hasn’t
been very helpful to you so far. Not only are you ready to make a change, but
you’ve also thought of some steps you will take today! You’re going to start a
gratitude journal, put reminders of your favorite uplifting quote by your laptop, and
spend more time with your family who are positive influences in your life. You’re
ability to think creatively and be open-minded shines through in the plan you
developed. Earlier this year, your strengths helped you transition successfully to
this new school environment, and make friends with other students in theater.
You’ve got a plan and the resources to make the changes you want!
Part 5: Increase commitment in change and end the meeting
• Ask student to sign the final page of the planning form if he or she is sufficiently
confident to commit to enacting the change plan- with the desired level (if any) of
support from the ACE coach.
▪ Example support 1: Offer to drop off a letter to student in a few weeks (or
later) that summarizes the action plan developed in this first meeting.
▪ Example support 2: Offer student a second meeting with the coach in order to
provide an opportunity for follow-up re: progress to plan. If the student agrees
to the second meeting, decide on a timeline for the meeting.
o This last page is the ‘commitment’ page where we both make a commitment on the
work we’ve done today. On your end you are committing to try your best to follow
through on the action plan you created. You don’t have to be perfect, but make an
attempt to use the strategies you came up with to reach your goal of [insert goal].
On my end, I’m committing to 2 things: One I’m going to be the person rooting for
you behind the scene, silently cheering for you from the sidelines. Two, I’m also

199
offering to meet with you again a month from now to check in on your action plan.
We can celebrate any successes you’ve made and problem solve any barriers
you’ve faced. How does that sound?
• Coach also signs, demonstrating collaboration.
• Arrange for a paper or electronic copy (e.g., taking photo of the plan with their
phone) of the action plan to be provided to the student.

200
Appendix F: AP Meeting Protocol
Action Planning Meeting
Protocol Overview
Materials Needed
• Session 1
o Student-specific information:
▪ Completed assessment packet (current status on factors associated with AP/IB
student success) if student queries what item responses led to scores on a given
factor
▪ Score report/profile (created using the norms for large sample of AP/IB
students) on the assessment of factors associated with AP/IB student success
o Blank score report/profile (base graph), for use prior to sharing student-specific
report
o AP/IB Student Success Planning Form
o Colored Pencils or Markers (red, yellow, green)
o ACE Student Program binder, to access handouts and worksheets as appropriate
during planning step
• Additional materials needed for session 2
o Progress towards ACE program goal letter
Meeting Timeline
MI Step Activities, Strategies, and Objectives Approximate
Length
Engage • Introduction/Re-introduction to coach and meeting purpose.
• Session 2 only: Review progress towards goal
5-10
minutes
Focus • Orient/re-orient student to norm-referenced feedback graph
and review individualized graph with student.
• Agenda map and prioritize area(s) of change
10-15
minutes
Plan • Brainstorm strategies for meeting goals using Problem-
Solving Process in Action form.
• Create an action plan that specifies action steps, supports
needed, and a timeline.
15-20
minutes

201
AP MEETING STEP 1: ENGAGE
Time: Approximately 5-10 minutes
Purpose: Review meeting goals and objectives
Introduction to Coach and Meeting Purpose
• Share name and affiliation; ask student how they prefer to be addressed.
o Meeting 1: Hi [Name] it’s really good to see you again. As you know, I am [Name]
from the ACE Program. I wanted to thank you for your participation in the ACE
program!
o Meeting 2: Hi [Name] it’s really good to see you again. As you know, I am [Name]
from the ACE Program. I wanted to thank you for your participation in our last
meeting. I couldn’t wait to talk with you again!
• Gauge understanding of meeting and explain reason for meeting with them individually.
o What is your understanding of why we are meeting today?
o Meeting 1: Thanks for sharing your expectations for this meeting! I’d be happy to
share a little more with you. As part of the ACE Program we offer students extra
support through one-on-one meetings like this one. We’ve worked with lots of AP/IB
students, and have learned what helps them do well academically and stay relatively
happy in the process. The meetings are intended to help you succeed in AP/IB. We
are offering this extra support to lots of students, including some with room for
growth in happiness at school, stress management, or grades.
o Meeting 2: Thanks for sharing your expectations for this meeting. My hope for us
today is that we can review the goal that you made in our last meeting, and see how
your plan is going so far. Please honestly share how that plan went, so we can
celebrate/trouble shoot and make a new plan- wherever you’re at I’m just excited to
catch up!
• Share meeting agenda (Student Success Planning Guide p. 1)
o Meeting 1: In the rest of this hour (point to agenda)…
4. I will share where you stand relative to other students in Florida on the factors
that are linked to success in AP/IB as you’ve heard about in the ACE program
in your class.
5. I would like to work with you to develop a plan for how you may boost your
chances for doing well in your AP/IB class(es), by targeting an area through
the course of our discussion you come to feel might be most central to helping
you achieve your goals. What questions do you have about this process?
o Meeting 2: In the rest of this hour (point to agenda)…
1. I will review the personal goal you made during Meeting 1 and discuss any
progress you’ve made since the first meeting.
2. I will revisit where you stand relative to other students in Florida on the
factors that are linked to success in AP/IB as you’ve heard about in the ACE
program in your class.
3. I would like to work with you to develop a new plan for how you may boost
your chances for doing well in your AP/IB class(es), by targeting an area
through the course of our discussion you come to feel might be most central to

202
helping you achieve your goals. What questions do you have about this
process?
o I am recording this meeting because it will help me do my best with you. The
meetings are part of a research project, and members of the research team will
review the audio file to make sure I’m doing a good job. The file will not be shared
with anyone at your school, and my research team will destroy it as soon as our
project is complete. Are you okay with this?
IF THIS IS MEETING 1, skip this box and proceed to Step 2: Focus.
IF THIS IS MEETING 2, proceed with the following steps in the box, then skip to part
2: Orient/re-orient student to norm-referenced feedback graph in Step 2: Focus.
• Review student goal from Meeting 1. Restate goal written on Student Success
Planning Guide if student has trouble remembering.
o In our meeting last month, you mentioned that [insert value] was very
important to you. Tell me more about that.
o We also talked a great deal about how you may boost your chances for doing
well in your AP/IB class(es) by targeting a factor on the graph you felt might
be most central to helping you be successful. Tell me your understanding or
recollection of the goal you made last time we met?
• Bring out Progress towards ACE Program Goal letter to remind student of their
specific goal and action steps identified in Meeting 1.
o In our last meeting, we brainstormed ways to make that goal happen. I
handed/sent a card to you a few weeks ago with a reminder of the plan we
created to help you reach that goal.
o Tell me all about how you feel your progress towards your goal is coming
along, like what steps, if any, you have taken? Some students I’ve spoken to
this week said, “Man, I totally forgot all about it,” while other students
completed part of the plan or told me about the many steps they completed.
o While student discusses progress made with change plan, mark none, some, or
completed next to each action step listed on their “Progress Towards ACE Program
Goal” form.
o Summarize Your Understanding of the Student’s Current Progress toward Goals and
provide a transition summary by compiling your understanding of the student’s
current situation.

203
AP MEETING STEP 2: FOCUS
Time: Approximately 10-15 minutes
Purpose: Discuss student’s relative strengths and weaknesses on the factors associated with
success among AP/IB students.
Part 1: Elicit student knowledge regarding the areas related to academic and emotional
success.
• Elicit student’s memory of ACE modules.
o You’ve worked a good deal during the ACE modules on the areas related to
academic and emotional success – these are listed out on p. 2 of the Student
Success Planning Guide. What was the most helpful thing you learned in the ACE
Program modules?
• Elicit student’s memory of the pre-meeting intervention survey.
o You recently completed a 10-page survey packet that asked you to rate yourself
on the factors discussed in the ACE Program.
• Establish data review process as collaborative partnership.
o I’d like to review/revisit your responses to the survey together now. Many
students that we’ve met with in meetings have appreciated seeing their own
results compared to responses from the thousands of other AP/IB students we’ve
surveyed before.
o [OPTIONAL, pending amount of time permitted for the meeting as student
writing extends session time somewhat] Some students find it easier to write down
their thoughts in addition to talking. You can use the “AP/IB Student Success
Planning Guide” throughout our talk today – if you like – or not, it’s up to you.
For instance, you can color your personal strengths (higher scores) in green,
neutral/average behaviors in yellow, areas for growth (lower scores) can be red.
Also, you can mark on this graph with colors, like circle your strengths in green.
Part 2: Orient/re-orient student to norm-referenced feedback graph (*limit to 2 minutes)
• Present the base graph (without the student’s data included) to orient the student to
factors presented on the X axis, and mean scores among comparison groups. Use a blank
sheet of paper to show small portions of the graph if student seems overwhelmed.
• We have organized the graph into four areas:
5. The first area focuses on Effective Coping Styles, which includes coping styles
like time and task management and positive thinking. If you think back to the
“Coping Chart” we shared with your class, these styles were associated with
higher academic achievement and emotional well-being. Because higher scores
here tended to co-occur with better academic and emotional wellness among
AP/IB students in prior research, there is gray shading above the midline to
indicate the direction of scores that may be most healthy (point to gray section;
before the meeting, the coach can use green colored pencil or crayon to add color
to the gray section, and refer to “green” rather than “gray” throughout).
6. The second area focuses on Ineffective Coping Styles, which includes behaviors
research suggests to limit, like withdrawing and relying on self when faced with

204
stress, and various forms of avoidance. Because lower scores here co-occurred
with better academic and emotional wellness among AP/IB students in prior
research, the gray shading is below the midline here (point to gray section).
7. The third area focuses on Student Engagement, which includes things like
involvement in extracurricular activities and school connectedness. Again, higher
scores (closer to the gray area) are linked to better outcomes for most students.
8. The last area deals with things at Home, such as your perceptions of your
parents’ emotional warmth and support, and how much they promote your
independence. Higher scores here [point to gray] are also often associated with
better academic and emotional outcomes for students.
• Explain gray and white columns of graph
o These gray bars represent overall scores in broad categories, such as levels of
coping with school-related stressors through Problem-Focused strategies or
Avoidance strategies, levels of School Connectedness, levels of Extracurricular
Activities, etc.
o The white columns that follow a gray bar give levels of more specific coping
styles and behaviors within a particular category. For example, effective coping
In the event the target student’s scores within positive parenting practices are
low:
o When we talked with your class about factors research has shown predict success
in AP/IB, we noted successful students tend to perceive their parents support them
and also promote their independence..
o Our ACE program in the classroom focused on the first 3 areas because these are
things more within students’ personal control to work with us to change or
improve.
o However, in these individual meetings, we offer students complete feedback on
how their levels of factors related to student success map on to typical levels
reported by lots of AP/IB students.
o This section of the graph is not an exhaustive look at all parenting practices,
family factors, or parent-child relationship issues, but a focused look at two
aspects of authoritative parenting practices (warmth/support, autonomy
promotion) studied in prior research and shown to correlate with AP/IB student
outcomes. Many other home factors- like parental absence or neglect, amount of
fighting in the home, etc. are not reflected in these two factors of parenting
practices.
If Student has Significant Elevations in Ineffective Coping Styles:
Reduce stigma through acknowledgement of AP/IB students’ use of these factors.
o Researchers have an understanding of what these terms mean, but different people
have a different reaction to these labels- do you have a strong reaction to any of
them? Like what does “taking short cuts” mean to you?
o Lots of students report they feel unable to stay on top of their schoolwork unless
they swap notes or divvy up assignments with classmates (which falls under
“Taking Short Cuts” because it often goes with other stress reactions like copying
other students’ work)
o Many students may give in to the exhaustion for a bit by taking naps, or going to
sleep early to either recharge or escape (which fall under “Sleep More”).
o But such coping styles are listed here within “Ineffective” based on research
showing that the more often these behaviors occur, the less likely a student is to
have long-term success in general…

205
styles such as time and task management, positive thinking, and turning to family
are all placed in the Problem Focused Coping category.
• Explain the two comparison groups on graph
o There are also two points of comparison for you. You can compare your scores
to: (1) The average responses of over 2,300 AP/IB students that we previously
surveyed, which is represented by the (purple) dashed line across the middle of
the graph (before the meeting, the coach can trace over this dashed line with a
purple marker, and refer to “the purple line” for the average AP/IB student). ▪ Optional explanation: This is the mathematical
average score from the students in the sample
on each factor. It is not indicative of how the
average student in the sample performed
academically or was doing emotionally; just
the most common score on a given variable
across 2300 students from 20 different AP or
IB programs.
o (2) A subgroup of a few hundred students who
are particularly successful both academically
(high GPAs and test scores) and emotionally
(happy, not burnout at school or emotionally
distressed). The average score within this
group is reflected in the (blue) dashed line
that runs above and below the average score
(before the meeting, the coach can trace over this dashed line with a blue marker,
and refer to “the blue line” to reference particularly successful AP/IB students).
• Check for understanding and expectations.
o What questions do you have about the information in this graph?
• Transition to a focus on the student’s own scores (levels)
o Let’s walk through a graph that has your scores along with these other two lines of
scores, so you can see how your scores compare to other students.
Part 3: Review individualized norm-referenced graph with student
• Before the meeting, use a highlighter or orange marker to trace over the student’s score
line, and refer to “the orange/highlighted line” to reference the student’s scores.
• Orient student to their scores on the graph and allow them 1-2 minutes to review their
graph and independently identify their personal strengths.
o This colored line shows your current level on each factor associated with student
success, based on your responses to the 10-page packet you completed. I’d like to
offer you a chance to silently look at the graph before we talk about it together.
o [OPTIONAL] As you’re reviewing your scores, some students find it helpful to
circle their greatest strengths in green and any areas of concern we may want to
discuss together in red. I’ll give you a few minutes for you to review your graph
independently and color on it if you’d like, let me know when you’re done
processing.
▪ To further reinforce the concept the coach can circle an example of a clear
strength (point on graph within or close to green shaded section) in green
and clear weakness (point on graph far from green shaded section) in red.
Facilitator Note:
Student responses to survey packet
entered into a scoring program and
compared against the responses of
2,300+ other AP/IB students from
20 FL high schools (mean score =
50, as reflected in the dashed line).
Successful subgroup = top 10% of
norm sample that met all indicators
of emotional success (high life satis-
faction, no mental health problems,
low school burnout) and academic success (GPA > 3.0, passing scores
on end-of-course AP/IB exams).

206
• Review 1-2 student’s relative strengths in coping, engagement, and home support (factors
in shaded area and/or above comparison line).
o Let’s discuss some of your strengths, factors that are closer to the shaded green
area.
• Review 1-2 relative weaknesses and other areas for growth.
o Thanks for discussing your coping and engagement strengths with me! Let’s turn
our attention to areas that indicate room for growth.
Part 4: Agenda mapping; Prioritize areas of change in a way that balances students’
autonomy with assessment data
• Recognize relatively high scores noted.
o Thanks for spending that time getting to know you. We have talked about a lot of
different things, like your strengths in [reference targets near green]. You have a
lot of things going well!
• Give student autonomy to identify what factors may be important to
maintain/improve/decrease. Make it clear where you’re heading for rest of conversation.
o You are very insightful, and understand [list factors identified as having room for
growth] have room for growth. Let’s take some time to discuss which issues seem
MOST pressing or important to you at the moment.
• Consider options student circled on the graph and make a list if needed. If student voices
a target not discussed already then say:
o You saw X and Y on the graph, but Z stands out as the top priority for you.
• Allow the student to prioritize and select area of focus.
o Let’s prioritize. What do you think is the most important thing to work on first?
• Provide a transitional summary to planning.
o I think that you’ve identified an area that we can work on together.
o Complete Step 1 of the Problem-Solving Process record form. Either the student can
complete the form or the coach can complete in a discreet manner if the worksheet might
distract from the conversation.
o I would like us to take some notes while we talk so we capture all the great ideas you
have. Would you like to write, or do you prefer that I do?
• Identify a concrete goal and/or replacement behavior, particularly if the student chose to focus on
limiting an ineffective coping style. Record the goal in the top part of the Action Plan if desired.
Example questions:
o How will you know when success in this area has occurred?
o How much school do you want to attend?
o How many uninterrupted hours of sleep do you want to get each night?
o How much of your work do you want to complete independently?
o How many extracurricular activities do you want to get involved in?
o How many hours per week would you like to spend in extracurriculars?
Part 5: Summarize and transition to planning
• Summarize factor identified as an area for change.
o Thanks for setting that admirable goal with me. You would like to work on [target
behavior] because it is an area for growth. I’d like to help you plan how you will do this.

207
AP MEETING STEP D: PLANNING
Time: Approximately 15-20 minutes
Purpose: This stage should culminate in a specific plan of action that targets the areas in need
of improvement discussed earlier in the session. Students should (a) express commitment to
change, and (b) leave with an action plan.
Part 1: Help the student brainstorm strategies for meeting goals in prioritized areas using
Problem-Solving Process in Action form
• Prompt the student to generate alternate solutions for making positive changes with the first
target (behavior to maintain or change) and write them down on Step 3 of the Problem-
Solving Process form.
o What has helped in the past to address that behavior?
o What have you seen work for your classmates or friends?
o How much do you want me to offer some ideas, including some strategies we shared
during the ACE Program that have worked for other students? [Use ACE Program:
Potential Strategies Cheat Sheet for ideas]
• Encourage student to select the best solution(s) (Step 4 of Problem-Solving Process in Action
form).
o You came up with some great ideas! Among the solutions you generated, which
one(s) would you like to try out?
Encourage students to celebrate successful outcomes when this solution works, and to
pick a different solution if the outcome is not as positive as planned (Step 5)
Part 2: Create an action plan that specifies action steps, supports needed, and a timeline.
• Complete p.5 of the Student Success Planning Guide (Action Plan) by breaking down the
action plan into small, doable steps.
o The target most important to you is [reflect student’s choice] and your goal is
[reflect student’s choice, while filling in the top column of the Action Plan].
o The solution(s) you choose to do are [reflect student’s choice].
• If a concrete goal or replacement behavior was not identified early in the meeting (e.g., end
of Focus), set behavioral goal now prior to developing action steps.
o I wonder if setting a specific goal would help you to know what you’re striving
towards. How would your overall goal of [insert goal] play out in a typical week?
o How will you know when success in that areas occurs?
▪ What specific time and task management strategy would you like to focus on?
▪ How much school do you want to attend?
▪ How many uninterrupted hours of sleep do you want to get each night?
▪ How much of your work do you want to complete independently?
o Preparing: What would be a first step?
o Setting a date: When could you do that?
• Complete “Sticking to My Plan” portion of Action Plan by reframing challenges, finding
ways for the student to hold themselves accountable, and discussing which supports are
needed to accomplish plan.
o How can you stick to this plan?

208
o Who can you share your progress with as you move through this action plan?
• Complete “Anticipating Bumps in the Road” section of Action Plan
o What do you think might be some barriers that will keep you from reaching your
goal?
o Knowing that this barrier might get in the way, what are some possible solutions to
overcome this obstacle?
o Use handout to record barriers and identify strategies for overcoming barriers.
Part 3: Increase commitment in change and end the meeting
• Ask student to sign the final page of the planning form if he or she is sufficiently
confident to commit to enacting the change plan.
• Explain that you will drop off a letter to student in two weeks that summarizes the
action plan developed in this first meeting.
• Schedule a second meeting with the coach.
o This last page is the ‘commitment’ page where we both make a commitment on the
work we’ve done today. On your end you are committing to try your best to follow
through on the action plan you created. You don’t have to be perfect, but make an
attempt to use the strategies you came up with to reach your goal of [insert goal].
On my end, I’m committing to 2 things: One I’m going to be the person rooting for
you behind the scene, silently cheering for you from the sidelines. Two, I’m also
going to meet with you again a month from now to check in on your action plan. We
can celebrate any successes you’ve made and problem solve any barriers you’ve
faced. In two weeks, I will also send you a reminder letter that summarizes your
plan today. How does that sound?
• Coach also signs, demonstrating collaboration.
• Arrange for a paper or electronic copy (e.g., taking photo of the plan with their
phone) of the action plan to be provided to the student.

209
Appendix G: Meeting 1 Student Success Planning Guide
Student: _______________ USF Coach: _______________
School: _______________ Date: _______________
Extra Support Meetings:
Student Success Planning Guide
MAP AGENDA
1. Get to know more about your personal values, strengths, and goals.
2. Review your survey results and how they compare to other AP/IB students.
3. Develop a plan to help you meet your goals.
ACTION PLANNING AGENDA
1. Review your survey results and how they compare to other AP/IB students.
2. Develop a plan to help you meet your goals.

210
How well am I doing in each area below, factors related to academic and emotional success?
Factor/Target Compared to Other
AP/IB Students
COPING WITH SCHOOL-RELATED STRESS
Using Problem-Focus Coping Styles?
Time and Task Management Lower Same Higher
Positive Thinking Lower Same Higher
Turn to Family Lower Same Higher
Seek Academic Support Lower Same Higher
Relaxation Lower Same Higher
Turn to Spirituality Lower Same Higher
Limiting Use of Withdrawal and Rely on Self Coping Style? Higher Same Lower
Limiting Use of Avoidance Coping Styles?
Withdraw and Rely on Self Higher Same Lower
Sleep More to Avoid Stressors Higher Same Lower
Reduce Effort on Schoolwork Higher Same Lower
Take Short Cuts at School Higher Same Lower
Skip School Higher Same Lower
Turn to Substances Higher Same Lower
Experiencing Eustress at School (Feel Motivated by Demands)? Lower Same Higher
STUDENT ENGAGEMENT
Feel Connected to School and AP/IB Program?
Positive Relations with AP/IB Teachers Lower Same Higher
Satisfied with AP/IB Courses/Program Lower Same Higher
Pride in School Lower Same Higher
Involved in Extracurricular Activities?
Take Part in Multiple Types of Extracurriculars Lower Same Higher
Healthy # of Total Weekly Hours in All Extracurriculars Lower Same Higher
Focused on Schoolwork and Interested in AP/IB Classes? (high
personal standards; persist towards goals; strategies to reach goals) Lower Same Higher
Motivated to Engage in AP/IB Coursework? (confident in academic
abilities; feel in control & absorbed during class) Lower Same Higher
HOME
Parents Provide Emotional Support (warm, available)? Lower Same Higher
Parents Encourage Age-Appropriate Independence? Lower Same Higher

211
Values, Strengths, and Goals (MAP MEETING ONLY)
Areas of Importance
1.
2.
3.
Values
1. 4.
2. 5.
3.
Character Strengths from VIA classification:
1. 4.
2. 5.
3.
Goals for later high school or post-high school plans:
1.
2.
3.
Notes:

212
Problem-Solving Process in Action
Step 1: Recognize Factors that can be Improved Upon
Step 2: Determine the Potential Benefits of Addressing those Factors (skip this step if this
is Action Planning meeting)
Step 3: Develop Alternative Solutions and Evaluate Possible Benefits
Step 4: Select the Best Solution and Try It Out
Step 5: Evaluate the Outcome; Savor Successes
Option 1
Pros:
Option 2
Pros:
Option 3
Pros:

213
Action Plan
Target: I want to maintain/improve/decrease:
Goal:
Steps Action Steps By (Date)
1.
2.
3.
Additional
Steps
Sticking to My Plan
How will I keep myself accountable to this plan?
With whom can I share my progress? How and when?
Anticipating Bumps in the Road
Potential Barriers Solutions

214
I, ___________________, plan to carry out the planned steps and activities I
worked on today with my ACE Program Coach, Kai Zhuang Shum.
I would receive a reminder copy of the action plan(s) I created today, in 2 week(s).
I would meet with the ACE Program Coach again, in 2 weeks.
________________________________ ____________
Signature of Student Date
________________________________ ____________
Signature of ACE Program Coach Date

215
Appendix H: Meeting 2 Student Success Planning Guide
Student: _______________ USF Coach: _______________
School: _______________ Date: _______________
Extra Support Meetings:
Student Success Planning Guide
MAP AGENDA
1. Review goals made during Meeting 1 and discuss any changes made since the first
meeting.
2. Discuss personal values, strengths, and long-term goals.
3. Review graph and decide how to focus this meeting:
a. Update your previous goal and revise the plan
b. Work on creating a new goal together
4. Develop an action plan to help you overcome barriers and meet your goals
ACTION PLANNING AGENDA
1. Review personal goal made during Meeting 1 and discuss any changes made since the
first meeting.
2. Review graph and decide how to focus this meeting:
a. Update your previous goal and revise the plan
b. Work on creating a new goal together
3. Develop an action plan to help you overcome barriers and meet your goals

216
Values, Strengths, and Goals (MAP MEETING ONLY)
Areas of Importance
1.
2.
3.
Values
1. 4.
2. 5.
3.
Character Strengths from VIA classification:
1. 4.
2. 5.
3.
Goals for later high school or post-high school plans:
1.
2.
3.
Notes:

217
Problem-Solving Process in Action
Step 1: Recognize Factors that can be Improved Upon
Step 2: Determine the Potential Benefits of Addressing those Factors (skip this step if this
is Action Planning meeting)
Step 3: Develop Alternative Solutions and Evaluate Possible Benefits
Step 4: Select the Best Solution and Try It Out
Step 5: Evaluate the Outcome; Savor Successes
Option 1
Pros:
Option 2
Pros:
Option 3
Pros:

218
Action Plan
Target: I want to maintain/improve/decrease:
Goal:
Steps Action Steps By (Date)
1.
2.
3.
Additional
Steps
Sticking to My Plan
How will I keep myself accountable to this plan?
With whom can I share my progress? How and when?
Anticipating Bumps in the Road
Potential Barriers Solutions
219
I, ___________________, plan to carry out the planned steps and activities I
worked on today with my ACE Program Coach, Kai Zhuang Shum.
I would receive a reminder copy of the action plan(s) I created today, in 2 week(s).
I would meet with the ACE Program Coach again, in 2 weeks.
________________________________ ____________
Signature of Student Date
________________________________ ____________
Signature of ACE Program Coach Date

220
Appendix I: MAP Meeting Fidelity Form
Fidelity Checklist – Motivation, Assessment, and Planning (MAP) Meeting
MAP Coach: KS Student Initials: __________ Date: __/19___________
School: _______RRHS_____________________ Class Teacher/Period: _________________________
Item
No. Key Elements in Session
Content
Covered?
Y/N
Comments
ENGAGE (10-15 minutes) Start time: __0:00__________ End time: ____________
1. Introduction to coach. Y N
2. Share meeting agenda/objectives of MAP session.
*FIDELITY CODING NOTE: PROCEED TO ITEM 9 IF THIS IS SESSION 1
Y N
3. Discuss target student chose to address (or goal developed)
during Meeting 1. Y N
4. Discuss student’s reasons for developing initial goal. Y N
5. Mention written reminder of change plan coach provided to
student after Meeting 1. Y N
6. Discuss student’s current progress on goal (e.g., ask what
action steps they took since last meeting). Y N
7. Discuss links between academic and/or emotional status and
change efforts. Y N

221
8. Summarize student’s current situation (e.g., progress toward
goal developed during Meeting 1, emotional or academic
status, primary barriers in life).
Y N
9. Discuss student’s current situation (e.g., most important
things to student right now). Y N
10. Discuss at least one of the student’s value. Y N
11. Discuss at least one of the student’s character strengths. Y N
12. Discuss the student’s long-term goals. Y N
13. Link goals and/or values to performance in AP/IB classes. Y N
14. Link ACE Program targets (coping and/or school
connectedness) to student’s goals. Y N
15. Transition to focus by summarizing student’s background
(current situation, goals, values, and strengths). Y N
16. MEETING 1 ONLY:
Elicit student knowledge of ACE module content. Y N
FOCUS (20-25 minutes) Start time: ____________ End time: ____________
17.
Elicit reactions to completion of survey packet.
*FIDELITY CODING NOTE: Items 17-26 are optional during Meeting 2
Y N
18. Present base graph to student by explaining 4 core content
areas (effective & ineffective coping, engagement, home). Y N
19. Explain two comparison lines on graph (sample mean and
successful students). Y N
20. Transition to student’s own scores (e.g., ask how seeing their
data may be helpful, what they expect to see) Y N
21. Present individualized graph to student. Y N
22. Discuss at least one of the student’s relative strengths on
graph. Y N
23. Identify student’s relative weakness(es) on graph Y N
24. Discuss discrepancy between student’s relative weakness
score and comparison group(s) or personal standards/goals Y N
25. Discuss how student’s current behavior is affecting his/her
performance in AP/IB classes. Y N

222
(OPTIONAL) Complete steps 18 and 19 again with another
relative weakness. Y N
26. Prioritize an area(s) to focus on for remainder of meeting
(e.g., What issues seem most pressing to you?) Y N
27. Transition to evoke by summarizing factor(s) identified as
areas for change and reaffirm strengths. Y N
EVOKE (5 minutes) Start time: ____________ End time: ____________
28.
Ask first evocative question to solicit student’s DARN for
change. Circle question type used:
• Desire (why is [change] so important?)
• Ability (how can your strengths help you improve?) • Reasons (3 best reasons for making a change?) • Need (what does future hold if you change?)
Y N
29.
Ask second evocative question to solicit student’s DARN for
change. Circle question type used:
• Desire (why is [change] so important?) • Ability (how can your strengths help you improve?) • Reasons (3 best reasons for making a change?) • Need (what does future hold if you change?)
Y N
30. Gauge readiness to change with the importance ruler. Y N
31. Transition to planning by summarizing change talk. Y N
PLANNING (15 minutes) Start time: ____________ End time: ____________
32. Generate alternate solutions. Y N
33. Elicit student’s perception of advantages of each solution. Y N
34. Encourage student to pick the “best” option(s). Y N
35. Develop goal (replacement behavior) for the target identified
for focus. Y N
36. List action steps and timeline to enact selected solution(s) Y N
37. Discuss supports that will help student to stick to plan. Y N
38. Discuss potential barriers to completion of action plan (e.g.,
use a confidence ruler to identify barriers). Y N
39. Build hope and confidence (e.g., review prior successes, re-
affirm strengths, reframe prior attempts as important steps Y N

223
towards lasting change).
40. Ask student to sign the final page of planning form, along
with coach signing Y N
41. MEETING 1 ONLY:
Foreshadow second Meeting to student. Y N
42. Provide copy of the action plan to student. Y N
Session Protocol Fidelity Score:
A. # of session elements completed (circled “Y”): ______
B. # of session elements expected: 36 (Session 1) or
30 (Session 2)
% elements completed this session (Line A / 35 or 30): ______%

224
Appendix J: AP Meeting Fidelity Form
Fidelity Checklist – Action Planning Meeting
MAP Coach: KS Student Initials: __________ Date: __/19_____________
School: __RRHS_______________________ Class Teacher/Period: _________________________
Item
No. Key Elements in Session
Content
Covered?
Y/N
Comments
ENGAGE (5-10 minutes) Start time: _0:00___________ End time: ____________
43. Introduction to coach. Y N
44. Share meeting agenda/objectives of AP session.
*FIDELITY CODING NOTE:
PROCEED TO ITEM 7 IF THIS IS MEETING 1
Y N
45. Discuss target student chose to address (or goal developed)
during Meeting 1. Y N
46. Mention written reminder of change plan coach provided to
student after Meeting 1. Y N
47. Discuss student’s current progress on goal (e.g., ask what
action steps they took since last meeting). Y N
48. Summarize student’s current situation. Y N
FOCUS (10-15 minutes) Start time: ____________ End time: ____________
49. MEETING 1 ONLY:
Elicit student knowledge of ACE module content. Y N
50. Present base graph to student by explaining 4 core content
areas (effective & ineffective coping, engagement, home). Y N

225
*FIDELITY CODING NOTE: Items 8-14 are optional during Meeting 2
51. Explain two comparison lines on graph (sample mean and
successful students). Y N
52. Transition to student’s own scores Y N
53. Present individualized graph to student. Y N
54. Discuss at least one of the student’s relative strengths on
graph. Y N
55. Discuss student’s relative weakness(es) on graph Y N
56. Prioritize an area(s) to focus on for remainder of meeting
(e.g., What issues seem most pressing to you?) Y N
57. Transition to planning by summarizing factor(s) identified as
areas for change. Y N
PLANNING (15 minutes) Start time: ____________ End time: ____________
58. Generate alternate solutions. Y N
59. Elicit student’s perception of advantages of each solution. Y N
60. Encourage student to pick the “best” option(s). Y N
61. Develop goal (replacement behavior) for the target identified
for focus. Y N
62. List action steps and timeline to enact selected solution(s) Y N
63. Discuss supports that will help student to stick to plan. Y N
64. Discuss potential barriers to completion of action plan. Y N
65. Ask student to sign the final page of planning form, along
with coach signing Y N
66. MEETING 1 ONLY:
Foreshadow second Meeting to student. Y N
67. Provide copy of the action plan to student. Y N

226
Session Protocol Fidelity Score:
A. # of session elements completed (circled “Y”): ______
B. # of session elements expected: 21(Session 1) or
16 (Session 2)
% elements completed this session (Line A / 21 or 16): ______%

227
Appendix K: Outcome and Acceptability Assessment
Extra Supports Meeting- Student Feedback Form
PART I Directions: Based on the meeting you had with a coach from the USF ACE Team,
please rate your level of agreement or disagreement with the following statements.
Item
Strongly
Disagree Disagree
Neither
Agree nor
Disagree
Agree Strongly
Agree
1. I feel the target behavior my coach and I discussed
today is important. SD D N A SA
2. The target behavior my coach and I discussed today
became more important as the meeting went along. SD D N A SA
3. I am ready to make change in the target behavior
discussed during today’s meeting. SD D N A SA
4. Because of this meeting, I feel confident that I will
meet my goal. SD D N A SA
5. I know I can take the steps necessary to reach my
goal. SD D N A SA
6. I am confident that my plan will help me overcome
barriers to reach my goal. SD D N A SA
7. I would recommend the meeting to other students. SD D N A SA
8. I felt comfortable during this meeting. SD D N A SA
9. The materials presented were helpful. SD D N A SA
10. The process used to develop the action plan was
helpful. SD D N A SA
My Relationship with the USF Coach Please select one answer for each question.
Not at
All
Only A
Little
Some-
what
Quit
e a
Bit
Totally
11. Did this meeting head in the direction that you
wanted? 1 2 3 4 5
12. Did you understand the things that your coach said in this meeting?
1 2 3 4 5
13. Did you and your coach work on problems together
in this meeting? 1 2 3 4 5
14. In this meeting, did you feel that your coach would stick with you no matter how you behaved?
1 2 3 4 5
15. In this meeting, did you feel that your coach
understood what it feels like to be you? 1 2 3 4 5
--------- PLEASE FLIP TO PAGE 2 FOR ADDITIONAL QUESTIONS ---------

228
PART II Directions: Please take about 3 minutes to record your thoughts. There are no right or wrong answers. Write down the first thought that comes to your head.
A. What part of the meeting did you find most interesting or useful?
_________________________________________________________________________________
_________________________________________________________________________________
_________________________________________________________________________________
B. AFTER MEETING 1 ONLY: What are the good and bad parts of the meeting?
_________________________________________________________________________________
_________________________________________________________________________________
_________________________________________________________________________________
C. AFTER MEETING 2 ONLY: Can you name some differences between the extra support you
experienced today compared to our last meeting?
_________________________________________________________________________________
_________________________________________________________________________________
_________________________________________________________________________________
D. Additional comments and suggestions.
_________________________________________________________________________________
_________________________________________________________________________________
_________________________________________________________________________________

229
Appendix L: Parent Consent Form

230

231
Appendix M: Student Assent Form

232

233
Appendix N: Student Recruitment Script
Recruiting Students for Study Participation
What USF research staff will say to students:
Congratulations on completing the Advancing Coping and Engagement (ACE) program lessons in Advanced
Placement (AP) Human Geography! The USF ACE program is now offering several students in your class
individualized extra supports. This help is intended to help you keep developing effective coping strategies and
strong connections to school. The extra supports involve two one-on-one meetings with a coach from USF. During
the meetings, you will experience two types of extra support. Researchers from USF are conducting a study to evaluate these two types of extra supports for AP/IB students. In the Action Planning meeting, you will review your
current levels of coping and engagement, select a target for improvement, and spend the bulk of the meeting
creating an action plan. In the MAP meeting, you will describe your personal values, strengths, and goals. Then,
you will connect your personal goals to the topics discussed in the ACE program—coping and engagement. Finally,
you select an area for improvement, and work with the ACE coach to create an action plan. The information that we
collect from this study will be used to improve our extra support materials. This will help make sure the program
works well for future AP and IB students. You are being asked to participate because you are in an AP class that is
participating in the ACE program this year. Participation in this study is completely voluntary; it is your choice
whether or not you want to participate. If you refuse to take part, you will not get in trouble or lose access to the
supports that are always available in your class or at your school. You are free to stop taking part in this study at
any time. Deciding to participate, not to participate, or to stop participating at any point during the study, will in no way affect your student status, grades, or your relationship with your high school, school district, USF, or anyone
else. Students who decide to take part will be asked to participate in two meetings that last about 30 to 45 minutes.
Students who decide to take part in the extra supports will be randomly assigned to receive either Action Planning
or MAP in the first meeting, and the other type of support in the second meeting. Students will also be asked to (1)
share their perspectives on the usefulness of each meeting, (2) report readiness to change the target discussed
during the meeting, and (3) at the beginning of the next meeting, report the progress they made on the last action
plan developed. It will take about 10 minutes to provide this self-report information at the end of each meeting, and
during a brief check in about one month after the second meeting. In total, participation in the extra supports,
completion of the feedback forms and progress reports, will take no more than approximately 2 hours during the
2018-19 school year. Students who participate by providing feedback to coaching meetings will receive a $10 gift
card on each occasion.
Please keep one copy of the consent form for your personal records. Complete the other copy and return to me or
your teacher as soon as possible. This study’s procedures have been approved by USF (IRB # 22787. Thank you!
Kai Zhuang Shum, M.A. Shannon Suldo, Ph.D.
School Psychology Program School Psychology Program
813-466-0510 or [email protected] 813-974-2223 or [email protected]

234
Appendix O: Interventionist Therapeutic Alliance Rating Form
Student Initials: ______________ Date: ________________
MAP/Action Planning Therapeutic Alliance Meeting 1 (Interventionist Version)
THERAPEUTIC ALLIANCE RATING (Directions: All questions below refer to the meeting
that you just completed with this student. Please select one answer for each question). 1. In this meeting, how would you describe your relationship with
this student? Very
Poor Poor
Satis-
factory Good
Excel-
lent 2. In this meeting, how do you think the student will rate your
relationship with him/her? Very
Poor Poor
Satis-
factory Good
Excel-
lent
GLOBAL APPRAISALS
3. The student seemed engaged during this meeting. SD D N A SA
4. The student and I had a positive working alliance during this
meeting. SD D N A SA
5. The student seems likely to make a positive change in a target
discussed during today’s meeting. SD D N A SA
6. I feel the student benefitted from taking part in the meeting. SD D N A SA
Date:____________
MAP/Action Planning Therapeutic Alliance Meeting 1 (Interventionist Version)
THERAPEUTIC ALLIANCE RATING (Directions: All questions below refer to the meeting
that you just completed with this student. Please select one answer for each question). 1. In this meeting, how would you describe your relationship with this
student? Very
Poor Poor
Satis-
factory Good
Excel-
lent
2. In this meeting, how do you think the student will rate your
relationship with him/her? Very
Poor Poor
Satis-
factory Good
Excel-
lent
GLOBAL APPRAISALS
3. The student seemed engaged during this meeting. SD D N A SA
4. The student and I had a positive working alliance during this meeting. SD D N A SA 5. The student seems likely to make a positive change in a target
discussed during today’s meeting. SD D N A SA
6. I feel the student benefitted from taking part in the meeting. SD D N A SA
7. The student made progress on the initial goal from the 1st
meeting. SD D N A SA

235
Appendix P: Global Dimension Response Options for Motivational Interviewing Treatment
Integrity (MITI)
Cultivate
1 No explicit attention to, or preference for, the client’s language in favor of changing.
2 Sporadically attends to client language in favor of change – frequently misses opportunities to
encourage change talk 3 Often attends to the client’s language in favor of change but misses some opportunities to
encourage change talk.
4 Consistently attends to the client’s language about change and makes efforts to encourage it.
5 Shows a marked and consistent effort to increase the depth, strength, or momentum of the client’s language in favor of change.
Soften
1 Consistently responds to the client’s language in a manner that facilitates the frequency or depth of arguments in favor of the status quo.
2 Usually chooses to explore, focus on, or respond to the client’s language in favor of the status quo.
3 Gives preference to the client’s language in favor of the status quo but may show some instances of
shifting the focus away from sustain talk. 4 Typically avoids an emphasis on client language favoring the status quo.
5 Shows a marked and consistent effort to decrease the depth, strength, or momentum of the client’s
language in favor of status quo. Partnership
1 Actively assumes the expert role for the majority of the interaction with the client. Collaboration or
partnership is absent. 2 Superficially responds to opportunities to collaborate.
3 Incorporates client’s contributions but does so in a lukewarm or erratic fashion.
4 Fosters collaboration and power sharing so that the client’s distributions impact the session in ways
that they otherwise would not. 5 Actively fosters and encourages power sharing in the interaction in such a way that client’s
contribution substantially influences the nature of the session.
Empathy
1 Gives little or no attention to the client’s perspective.
2 Makes sporadic efforts to explore the client’s perspective. Clinician’s understanding may be
inaccurate or may detract from the client’s true meaning. 3 Actively trying to understand the client’s perspective, with modest success.
4 Makes active and repeated efforts to understand the client’s point of view. Shows evidence of
accurate understanding of the client’s worldview, although mostly limited to explicit content.
5 Shows evidence of deep understanding of client’s point of view, not just for what has been explicitly stated but what the client means but has not yet said.
Adapted from Moyers, T.B., Manuel, J.K., & Ernst, D. (2014). Motivational Interviewing Integrity Coding Manual 4.2. Unpublished manual.

236
Appendix Q: Permission to use MITI Coding Manual 4.2

237
Appendix R: Permission to use TAQS included in Peabody Treatment Progress Battery

238
Appendix S: Social/Behavioral Investigators and Key Personnel Refresher Course

239
Appendix T: IRB Amendment Approval

240