Embed Size (px)
Citation preview

1
Investigating the effects of Al2O3 nano particle prepared by ultrasonic and
microwave on the drilling fluid flowing properties
Abstract
In this paper, the tests are designed for investigation of the effects of the synthesized
Al2O3 nano particle prepared by ultrasonic and microwave on the drilling fluid flowing
properties. Rheological and thermal properties of drilling fluid with nano particle are
surveyed. Nano particles which are prepared with two different methods of ultrasonic and
microwave are applied in drilling fluid. Experiments are held in heated tube section for
simple drilling fluid and drilling fluid which contains 1% nano Aluminum oxide.
Results illustrate on the numerical difference between values obtained from ultrasonic
nano drilling fluid and those are obtained from microwave nano drilling fluid. Reynolds
number increases (1.38 times), Prandtl number decreases (0.222 times) and Stanton
number decreases (0.89 times) using ultrasonic method compares with data which are
obtained from simple drilling fluid. Application of microwave method shows 1.34 times
increase, 0.223 times decrease and 0.93 times decrease in amounts of Reynolds number,
Prandtl number and Stanton number, respectively, compares with data from simple
drilling fluid. Just dynamic viscosity decreases about 30% using both ultrasonic and
microwave method.

2
Experimental results introduce a new challenge in selection of preparation method of
nano particles which are utilized in drilling fluid.
Key Words: Rheology; Drilling fluid; Heat properties; Microwave; Ultra-sonic.
1. Introduction
1.1. Rheology science
The rheology is defined as the science of deformation and flow of matter. As a theoretical
subject, the rheology is a branch of physics and physical chemistry; commonly classified
as a branch of fluid mechanics [1, 2]. The rheology itself has been acknowledged as a
separate scientific branch since the mid 1920’s. All real materials will deform to some
extent when subjected to stress. If the material is an ideal liquid it may ”deform
continuously” or flow, when a force is applied. For ideal solids the deformation will be
elastic [3]. The relationship between the applied force and the resulting deformation is a
unique function of each specific material. For fluids, i.e. liquids and gases, this function
is known as a rheological property of the material [4, 5].
1.1.1. Viscosity
Viscosity is the representation of the internal resistance to deformation, a fluid shows
under stress. In common language, one usually refers the viscosity to”how thick” the
fluid is [6, 7]. This means that the ”thicker” the fluid is the greater the internal friction is.

3
Viscosity is the most elementary property dealt with in the rheology. For some fluids the
viscosity can be expressed through a coefficient, but for most fluids it is more a factor
dependent on other properties [8, 9 and 10]. These properties can be, but not limited to,
temperature, pressure, shear rate, on how the fluid has been treated before, and under
which regimes the shear has influenced the fluid [11-14].
1.2. Rheological models
Fluids are classified by their rheological behavior American Petroleum Institute [12, 13].
All fluids are classified as either Newtonian or Non-Newtonian, the clearest distinction
between different types of fluids [14, 15].
1.2.1. Bingham Plastic
The Bingham plastic model, also known as the Yield Point (YP) model or simply the
Bingham model, describes a fluid with a yield stress component and a Newtonian
component [16-20]. The fluids that fit this model require a certain amount of shear stress
before flowing [21, 22]. After exceeding the critical stress value, the fluid yields and will
thereafter behave as a Newtonian fluid with increasing shear stress. Everyday examples
of Bingham fluids are mayonnaise and ketchup [23-25]. This model also includes fluids
that hold solids suspended [26, 27].

4
1.3. Fluid Mechanics
Fluid mechanics is the study of the forces involved in both still and flowing fluids [28,
29].
1.3.1. Reynolds number
Reynolds introduced a dimensionless number in order to compare fluid flow independent
of which medium surrounded them and other variables. The Reynolds number is the ratio
of inertial forces to viscous forces in fluid flow [30, 31].
1.4. Flow Regimes
Flow in circular pipes can behave in different ways. Most common fluids are transported
in circular pipes [32, 33]. This is because pipes can withstand a large difference in
pressure between the inside and outside of the pipe, without being significantly distorted
[34, 35]. The theory behind fluid flow is commonly well understood, yet only fully
developed laminar flow is theoretically obtained [36, 37]. Therefore flow with other
characteristics, like turbulent flow, must rely on experimental and empirical relations
[38]. The borderlines between laminar, transitional and turbulent flow regimes are set by
the Reynolds number of the flow [39]. For laminar flow, the viscous forces dominate,
while for turbulent flow the inertial forces play the bigger role American Petroleum

5
Institute [40]. All fluid flow inside a pipe has the velocity profile of zero at the pipe wall
due to no-slip condition to a maximum at the center of the pipe [41].
1.4.1. Laminar flow
Laminar flows are relatively easy to describe both mathematically, physically, and
graphically. Laminar flow is characterized by smooth streamlines and a highly ordered
motion. In general they have low Reynolds number values, and can therefore be
described as slow flowing. For circular pipes the flow regime is generally laminar if the
Reynolds number is under 2300 [42, 43]. The pressure required to move fluid under
laminar conditions increases when velocity or viscosity is increased. The velocity profile
of a laminar flow is quite easy to depict. In pipes, the cross section along the pipe, the
velocity profile will be parabolic [44, 45].
1.4.2. Turbulent Flow
Turbulent flows are characterized by velocity fluctuations for a single element particle
and a highly disordered motion [46, 47]. The reason behind these fluctuations is rapid
mixing between the fluid particles from adjacent layers [48, 49]. This leads to a
momentum transfer between fluid particles, and thereby increasing the friction force on
the pipe wall [50, 51]. Since the friction is higher for turbulent flow than laminar, a
higher pressure drop is needed for turbulent flows, which in reality often means artificial
power (pumping). Fluids flowing in circular pipes will act turbulent if the Reynolds

6
number is higher than approximately 4000. Fundamental theories are valid. It is quite
complicated to model the flow under such conditions, due to the irregular and unstable
nature of turbulence [52, 53].
1.4.3. Transitional Flow
The transition from laminar to turbulent flow does not happen suddenly. It occurs over
some regions where the flow fluctuates between laminar and turbulent. It is therefore
described as a separate regime. The transition is controlled by the relative importance of
viscous forces and inertial forces on the flow that is the Reynolds number [53, 54].
1.4.4. Friction factor
The Darcy friction is an important parameter that predicts the frictional energy loss of
drilling fluid in a pipe based on the velocity of the fluid and the resistance due to friction.
It is used almost exclusively to calculate head loss due to friction in flow.
DgfLVh f 2
2
= 1

7
1.6. Role of Drilling Fluid
The drilling fluid plays an integral part of all drilling operations, and should be optimized
according to different parameters to achieve the best results and industrial effectiveness
[55]. The main tasks for the drilling fluids are: A. Hole cleaning, getting the crushed
material out from the well. It is important that the hole is properly cleaned with regards to
completing the well. B. Controlling formation pressure (being a barrier). C. Buoyancy.
Keeping the drill string submersed reduces the effective weight of the drill string on the
hook load. This also reduces fatigue and costs (need less high strength steel in the top of
the drill string). D. Lubrication, smoothening operation for the bit and also the drill string
in long deviated/horizontal wells. E. Cooling, keeping the drill bit cool, in order to keep
change the mechanical properties of the bit. F. Provide power to the bit. Hydraulic power
is transmitted so that the can cones rotate (Only valid for roller-cone bits) [56, 57]. For
PDC bits the hydraulic power is used for jetting the crushed rock away from the bit teeth.
G. Keeping the wellbore stable with regards to chemical reactions [58]. Shale can be a
problem. H. Signal transfer. For real time measurements and logging, the drilling fluid
itself is used as the transfer medium for pressure waves. I. Costs. Drilling fluids are an
expensive part of the operations, and should be handled with care to avoid excessive
spending [59].

8
2. Materials and Method
2.1. Composition of drilling fluid
The composition of drilling fluid is classified according to the Table 1.
Table 1. Composition of drilling fluid
component Weight percentage
Water 48.67
glycol 2.38
Polyacrylamide 17.37
Sodium bicarbonate 3.6
Calcium carbonate 9.2
NaCl 16
Potassium chloride 2.78
2.2. Aluminium oxide nano particles
Aluminium oxide nano particle is an environmental friendly element and has a huge
variety of applications. Aluminum is available as essential mineral and is non-toxic in
low concentration.

9
2.2.1. Synthesis method of nano-sized 32OAl by ultra sonic
The amount of 1.16 gr of Aluminum oxide in powder form is dissolved in de-ionized
water contains 0.38 gr of citric acid crystals. Then Ammonium hydroxide is added
gradually (till obtaining pH=7) into the mixture and is homogenized effectively in ultra
sonic. To produce the powder form of aluminum oxide, the mixture is heated for 1h at
250 °C and then to 500 °C for 90 min to change the color of powder into bright yellow.
Nano particles diameter is in the range of 75-89 nm and morphology of particles are
characterized with SEM and TEM images and also, XRD.
2.2.2. Synthesis method of nano-sized 32OAl by microwave
The solution for synthesizing Al2O3 nanopowder was prepared by dissolving aluminum
chloride hexahydrate (AlCl3·6H2O, Merck) into aqueous HCl (domestic product). The
resulting solution was continuously stirred using a magnetic stirrer for 7 hours and
concurrently heated by a hot plate to 60 ˚C and kept at this temperature until obtaining a
transparent gel. The obtained gel was aged for 72 h at room temperature and oven dried
in air at 80˚C for about 48 h. The dried gel was ground and then exposed to microwave
heating (2.45 GHz and 900 W) in a home made oven for 7, 10 and 15 min. Finally, the
nano particles diameter is in the range of 77-85 nm are synthesized.

10
Figure 1 shows the SEM, TEM. Also, the Table 2 illustrates the XRD of aluminum oxide
nano particles. In addition, the Table 3 shows the specifications of the used nano
aluminum oxide.
Figure 1-a. The SEM of aluminum oxide nano particles.
Figure 1-b. The TEM of aluminum oxide nano particles.

11
Table 2. The amount of XRD of aluminum oxide nano particles.
XRD 2teta
211 21
220 30
311 35
400 43
422 54
511 57
440 63
620 72
533 75
444 80
The physical property of synthesized aluminum oxide nano particles is mentioned in the
Table 3.
Table 3. Physical properties of aluminum nano particles
Aluminum oxide nano properties
Assay ≥95% Trace metal
basis
Form Nano powder
Resistivity > 410 µΩ-Cm at 20C
Average Particle
Size
75 - 89nm
(approximately)
12
2.2.3. Experimental set up
The experimental set up includes mixing tank, adiabatic tube test section and electrical
heater is used to survey the behavior of nano drilling fluid with two types of ultrasound
nano and microwave nano. Nano drilling fluid is mixed by 30% water in mixing tank,
passing through an electrical heater to reach the desired temperature in range of 25 C to
85 C. Vertical adiabatic test tube with 0.32 m and 0.025 m in length and diameter,
respectively is used. Digital sensors transmit the obtaining parameters to the control box.
Finally, nano drilling fluid is collected in a tank. All parameters are obtained with one
type of drilling fluid then all the set up is drained and washed with water stream injection
from water inlet port located in mixing tank.

13
Figure 2. Schematic of experimental set up.

14
2.3. Composition of drilling fluid and aluminum oxide nano particles
At the beginning the nano particles of aluminum oxide is synthesized and then the
different types of that (by ultra-sonic and microwave method) is blended with drilling
fluid. Finally, the flowing and thermal properties of the produced mixture are reported in
results and discussion section.
2.4. Rheology measurements
There are different methods and equipment for measuring the rheological properties of a
fluid. In the drilling business the most common way is by using a Fann 35 Viscometer. A
viscometer is a rotational type of rheometer and can only perform measurements under
one flow condition (one shear rate at one specific temperature).
2.4.1. Fann 35 Viscometer
A Fann 35 viscometer has six different settings, speeds/shear rates, in order to measure
the viscosity of the fluid. Since there are only six shear rates, a model is applied to the
measurements, making extrapolations possible. This gives an idea on how the fluid
behavior will be under changing circumstances. The standard approaches for calculation
the Bingham model coefficients in SI units, as explained in literature. After the stress dial
readings are converted to SI units and a correction factor of 1.06 are added, the plastic
viscosity ( plm ) is defined as:

15
300
.
600
.300600
gg
ttm
-
-=pl
2
The subscripts indicate rotation speed in RPM. The yield point is found by rearranging
Equation 3.
600
.
600 gmtt ply -= 3
2.4.2. Funnel viscosity
Funnel viscosity is commonly measured by a Marsh funnel, and is a timed rate of flow
for a specified fluid volume. It is a quick reference that is routinely made on a drilling
fluid system in the drilling industry. However, instead of measuring shear rate to shear
strain, it measures Extensional viscosity.
2.4.3. Empirical correlations to compute heat transfer performance of drilling fluid
Laboratory measurements have usually determined the relationship for heat transfer
between a flowing fluid and a solid surface. These measurements, either for natural or
forced convection, are normally correlated in terms of dimensionless parameters such as

16
the Nusselt (Nu) or the Stanton (St) numbers. The convective heat-transfer coefficient (h)
has been recognized as a complicated function of the fluid properties and the flow
geometry. Specific correlations of drilling fluids are depending on the flow regime
(laminar or turbulent). Some of these correlations have been used for calculating heat flux
in numerical modeling studies of the heat transfer associated with the geothermal well
drilling.
2.4.4. Thermal diffusivity
Thermal diffusivity is a material-specific property for characterizing unsteady heat
conduction. This value describes how quickly a drilling fluid reacts to a change in
temperature. In order to predict cooling processes or to simulate temperature fields, the
thermal diffusivity must be known; it is a requisite for solving the Fourier differential
equation for unsteady heat conduction.
3. Results and Discussion
This work presents the hydrodynamic and thermal behavior of nano drilling fluid as
dynamic and thermal properties and constants due to changes in three different
parameters. The independent parameters are temperature, length and method type of nano
preparation. All the obtained adapt from nano fluid contain 1% nano particle are
compared with the gathered data from simple drilling fluid. Considering the role of

17
drilling fluid as a drill coolant and rock barrier in drilling performances, some properties
such as specific heat of capacity, thermal conductivity, thermal diffusivity Prandtl
number and peclet number and Stanton number are determined. Also, effective viscosity,
dynamic viscosity and kinematic viscosity, average velocity, friction factor, Reynolds
number and yield point.
3.1. Thermal properties
1.15
1.2
1.25
1.3
1.35
1.4
0 10 20 30 40 50 60 70 80 90 100
Temperature (C)
The
rmal
con
duct
ivity
(W/m
C)
Without nanoUltrasonic (1% nano)Microwave (1% nano)
Figure 3. Thermal conductivity versus temperature.
The effect of changes in process temperature on the amount of thermal conductivity is
shown in Figure 3. Obviously, nano metal oxide has proper thermal conductivity due to
the metallic nature, so thermal conductivity of nano drilling fluid contains metal oxide is
higher than thermal conductivity of simple drilling fluid. The dependency of fluid

18
thermal conductivity on temperature is shown in Figure 3. Also, the effect of addition of
just 1% nano particle in drilling fluid is shown in Figure 3. This diagram illustrates the
effect of preparation method of nano fluid on the amounts of thermal conductivity.
Temperature changing from 30 C to 90 C increase the amount of thermal conductivity
from 2 (W/m.C) to 2.7 (W/m.C) for drilling fluid without nano particles. The amounts of
thermal conductivity increases about 5.6% and 2.8% using nano fluid which is prepared
by ultrasonic and microwave method, respectively. Temperature values higher than 50 C
show the higher difference from simple drilling fluid. So, the higher amount of thermal
conductivity transfers heat fast from drilling fluid to the well walls decreases the wear
and thermal corrosion of down drilling equipments, helps in cooling of equipments. On
the other hand, this heat transfer to the wall may have shock effect on the wall.
Considering these factors, nano drilling fluid which is prepared by ultrasonic method
shows the highest value of thermal conductivity. Finally, selection of the proper amount
of thermal conductivity is dependent on multi parameters.

19
4200
4300
4400
4500
4600
4700
4800
4900
5000
5100
0 10 20 30 40 50 60 70 80 90
Temperature (C)
Cp
(J/k
g.C
)Without nanoUltrasonic (1% nano)Microwave(1% nano)
Figure 4. Heat capacity versus temperature.
Figure 4 shows the effect of temperature on the amount of specific heat of capacity of
drilling fluid. The increase in temperature values increases the amount of heat of
capacity. Also, the addition of nano particle increases the amount of specific heat of
capacity. Both microwave and ultrasonic type of nano fluid show the same values of
specific heat of capacity, approximately. The value of heat capacity which is obtained at
65 C may be the measuring error. The higher value of specific heat of capacity indicates
the higher capability of drilling fluid toward the temperature changes. So, degradation
problems may be controlled by the higher value of specific heat of capacity which results
more stable values of temperature in drilling fluid.

20
0.0E+00
5.0E-08
1.0E-07
1.5E-07
2.0E-07
2.5E-07
0 10 20 30 40 50 60 70 80 90
Temperature (C)
The
rmal
diff
usiv
ity (m
2 /s)
Without nanoUltrasonic (1% nano)Microwave (1% nano)
Figure 5. Thermal diffusivity versus temperature.
The amounts of thermal diffusivity versus temperature are shown in Figure 5. The higher
amounts of thermal diffusivity show the higher capability of conductance of drilling fluid
versus the amounts of heat which is stored in the drilling fluid. The higher amount of
thermal diffusivity is favorable as a characteristic property of drilling fluid.
100105110115120125130135140145
0 0.05 0.1 0.15 0.2 0.25 0.3 0.35 0.4
Length (cm)
Pran
dtle
Num
ber
Without nanoUltrasonic (1% nano)Microwave (1% nano)

21
Figure 6. Prandtle number versus length.
Prandtle number shows the role of cinematic viscosity and thermal diffusivity together.
This dimensionless number is one important number in performance quality of drilling
fluid. Proper thermal diffusivity and cinematic viscosity is important on transferring
rocks and heat transfer from fluid to the environment. Changes in the amount of prandtle
number are negligible through the tube section of experimental set up. Addition of 1%
nano particle into the drilling fluid decreases the prandtle number value 22% and 23%
using ultrasonic and microwave, respectively.
0
20
40
60
80
100
120
140
60 65 70 75 80 85 90
Temperature (C)
Stan
ton
num
ber
Ultrasonic (1% nano)Microwave (1% nano)Without nano
Figure 7. Stanton number versus length.
Figure 7 shows values of Stanton number versus the length of tube section. The increase
in the amount of Stanton number is obtained through the length. Stanton number shows
the ratio of heat transferred into the fluid to the thermal capacity of fluid. Values related

22
to the nano fluid show the lower amounts than those are obtained from simple drilling
fluid. Microwave type of nano drilling fluid shows the lowest values of Stanton number.
0
50000
100000
150000
200000
250000
0 0.05 0.1 0.15 0.2 0.25 0.3 0.35
Length (cm)
Pecl
et n
umbe
r
Without nano Microwave (1% nano) Ultrasonic (1% nano)
Figure 8. Peclet number versus length.
Figure 8 shows the amounts of Peclet number through the tube length. Peclet number
shows the effect of Reynolds and Prandtl number, together. The decrease trend is shown
through the tube for three types of drilling fluid according to the Figure 8. The decrease
trend in amounts of Prandtl number can indicate this trend in amounts of Peclet number.
Addition of nano particle (1%) shows a little bit higher values of Peclet number. The
highest values of Peclet number are related to the nano drilling fluid which is prepared by
microwave method.

23
3.2. Hydrodynamic properties
Velocity changes through the tube are important in properties of drilling fluid. Figure 9
shows the values of velocity versus tube section.
1.521.541.561.581.6
1.621.641.661.681.7
1.72
0 0.05 0.1 0.15 0.2 0.25 0.3 0.35
Length (cm)
Ave
rage
vel
ocity
(m/s
)
Without nanoUltrasonic (1% nano)Microwave (1% nano)
Figure 9. Average velocity versus length.
The values of velocity commonly decrease in tube because of friction and viscous
dissipation. The changes in velocity through 0.3 meter of tube for simple drilling fluid
without nano particle are from 1.7 m/s to 1.53 m/s. Addition of 1% nano particle
decreases the velocity loss through the tube. Ultrasonic method prepared nano fluid
changes the values of average velocity from 1.7 m/s to 1.68 m/s. The changes in velocity
using microwave method nano fluid are from 1.7 m/s to 1.66 m/s. So, ultrasonic nano
drilling fluid seems to present better hydrodynamic performance. This may relate to the
lower viscosity of nano drilling fluid. So, values of viscosities are measured below.

24
05
1015202530354045
0 10 20 30 40 50 60 70 80 90
Temperature (C)
Dyn
amic
vis
cosi
ty (c
p)
Without nanoUltrasonic(1% nano)Microwave(1% nano)
Figure 10. Dynamic viscosity versus temperature.
Figure 10 shows values of dynamic viscosity versus temperature. Dynamic viscosity is
responsible of amount of viscous dissipation. Obviously, the increase in temperature
values decreases values of fluid dynamic viscosity. This trend is obtained for nano
drilling fluid. Also, the lower values of dynamic viscosity are obtained using nano
drilling fluid. This may describe the lower changes in amounts of average velocity for
nano drilling fluid. Temperature changes from 25 C to 85 C, changes the values of
dynamic viscosity from 40 cp to 25 cp for simple drilling fluid. The same mentioned
temperature changes causes the changes from 31 cp to 18 cp for ultrasonic prepared nano
drilling fluid 30 cp to 14 cp for microwave prepared nano drilling fluid.

25
0.0E+00
5.0E-06
1.0E-05
1.5E-05
2.0E-05
2.5E-05
3.0E-05
3.5E-05
4.0E-05
0 10 20 30 40 50 60 70 80 90 100Temperature (C)
Cine
mat
ic v
isco
sity
(m2 /s
)
Without nanoUltrasonic (1% nano)Microwave(1% nano)
Figure 11. Cinematic viscosity versus temperature.
The effect of temperature on the amount of cinematic viscosity is shown in Figure 11.
The increase in temperature values decreases values of cinematic viscosity. Of course, the
lower values of dynamic viscosity describe the lower values of cinematic viscosity.
0
10
20
30
40
50
60
0 10 20 30 40 50 60 70 80 90
Temperature (oC)
Effe
ctiv
e vi
scos
ity
Without nano Microwave (1% nano) Ultrasonic (1 % nano)
Figure 12. Effective viscosity versus temperature.

26
Effective viscosity versus temperature is shown in Figure 12. The amounts of effective
viscosity decrease with temperature increase from 30 C to 80 C. Values of effective
viscosity for drilling fluid without nano changes from 51.2 to 7.7. The changes of
effective viscosity for microwave nano drilling fluid and for ultrasonic nano drilling fluid
are from 41.12 to 2.12 and from 39.7 to 1.9, respectively.
02468
101214161820
0 20 40 60 80 100Temperature (C)
Yiel
d po
int (
lbf/1
00ft2 )
Without nano
Ultrasonic (1% nano)
Microwave (1% nano)
Figure 13. Yield point versus temperature.
Figure 13 shows the values of yield point versus different temperatures. The increase in
the amount of temperature from 30 C to 80 C decreases the amount of yield point from
18.7 to 13.05 for simple drilling fluid without nano particle. Addition of nano particle
(1%) by method of ultrasonic and microwave decreases the values of yield point from
13.8 to 10.03 and from 12 to 5.9, respectively. Amounts of yield point indicate on the
ability of drilling mud to carry rocks out of well. The higher amounts of yield point cause
higher pressure loss during drilling. So, nano drilling fluid which is made by microwave

27
method shows the best amounts of yield point comparing with the other simple drilling
fluid and ultrasonic drilling fluid.
0200400600800
100012001400160018002000
0 0.05 0.1 0.15 0.2 0.25 0.3 0.35
Length (cm)
Rey
nold
s num
ber
Without nanoUltrasonic (1% nano)Microwave (1% nano)
Figure 14. Reynolds number versus length.
Figure 14 shows the amounts of Reynolds number through the tube at 38 C operation
temperature. Reynolds number includes the effect of some important properties which are
average velocity and kinematic viscosity. The decrease trend of density by temperature is
obviously depends on the higher amount of mean length of free path of molecules of
drilling fluid at higher temperatures and the decrease in the amount of molecules in one
unit of volume.
So, the total difference in Reynolds number through 0.3 m is 135.3, 18 and 13 units for
drilling fluid without nano, ultrasonic and microwave drilling fluid respectively. So,
ultrasonic nano drilling fluid seems to show more stable Reynolds number and flow
regime through the tube.
28
0.0285
0.029
0.0295
0.03
0.0305
0.031
0.0315
0.032
0 0.05 0.1 0.15 0.2 0.25 0.3 0.35
Length (cm)
Fric
tion
fact
or
Without nano Ultrasonic(1%nano) Microwave (1% nano)
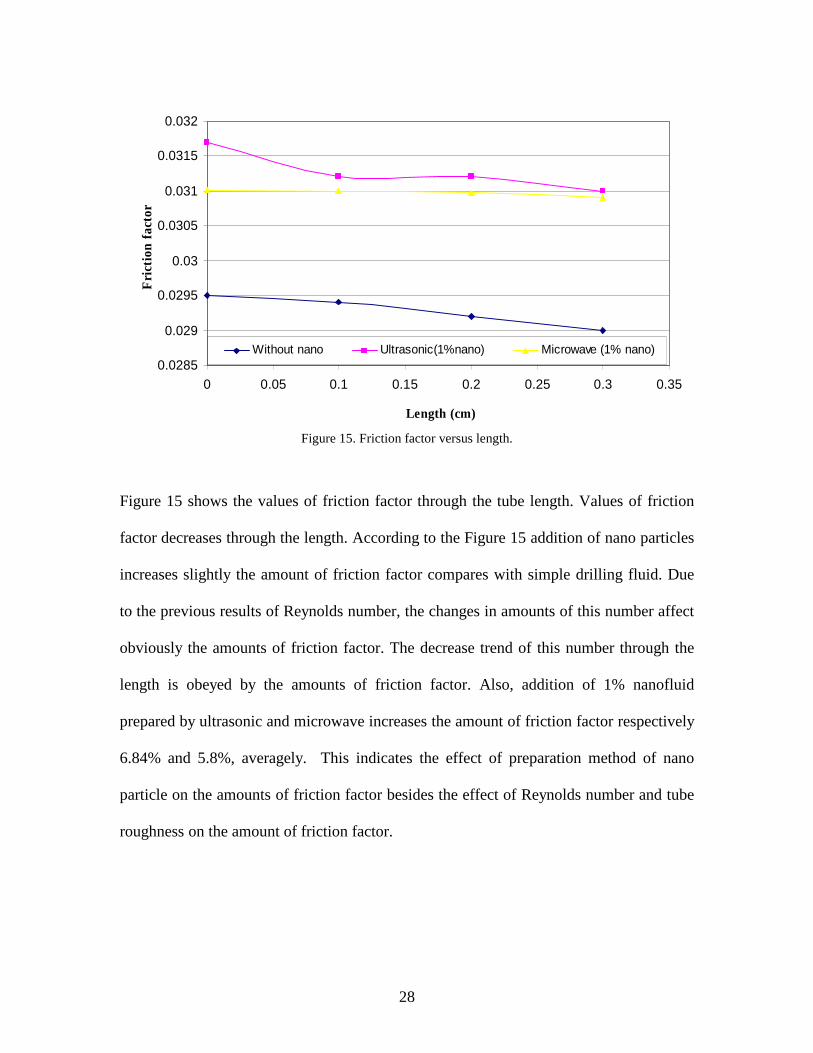
Figure 15. Friction factor versus length.
Figure 15 shows the values of friction factor through the tube length. Values of friction
factor decreases through the length. According to the Figure 15 addition of nano particles
increases slightly the amount of friction factor compares with simple drilling fluid. Due
to the previous results of Reynolds number, the changes in amounts of this number affect
obviously the amounts of friction factor. The decrease trend of this number through the
length is obeyed by the amounts of friction factor. Also, addition of 1% nanofluid
prepared by ultrasonic and microwave increases the amount of friction factor respectively
6.84% and 5.8%, averagely. This indicates the effect of preparation method of nano
particle on the amounts of friction factor besides the effect of Reynolds number and tube
roughness on the amount of friction factor.

29
4. Conclusions
Drilling fluids play a major role in drilling purposes in oil and gas industries. In this
study, thermal and rheological specifications of drilling fluid in ranges of temperature
through the experimental tube section, resembling well condition, are obtained. Thermal
specifications are also considered. The purpose of this experimental work is to find the
answer of this question:" Does the method of preparation of nano Al2O3 particle affect
the behavior of nano drilling fluid?" So, experiments are handled to find the amounts of
thermal conductivity, heat capacity, thermal diffusivity, Prandtl and Stanton number,
average velocity, dynamic viscosity, kinematic viscosity, effective viscosity, yield point,
Reynolds number and friction factor. Obtained results are valuable to predict the behavior
of nano drilling fluid in the determined conditions. However, this area needs more
investigations.
All experimental values of nano drilling properties are compared with the amounts which
are obtained for simple drilling fluid. Summary of the obtained results are mentioned
below:
1. Addition of 1% nano aluminum oxide into drilling fluid decreases values of
plastic viscosity, effective viscosity, dynamic viscosity and yield point, generally.
2. Ultrasonic nano drilling fluid decreases value of plastic viscosity averagely about
12.9%, effective viscosity about 40%, dynamic viscosity about 30% and yield
point about 27%.

30
3. Microwave nano drilling fluid decreases value of plastic viscosity averagely about
9.3%, effective viscosity about 44%, dynamic viscosity about 30% and yield point
about 44%.
4. Addition of 1% nano aluminum oxide which is prepared by ultrasonic method
into drilling fluid increases the amount of specific heat of capacity 9.2%, friction
factor 6.84% and velocity about 4.4%, averagely.
5. Addition of 1% nano aluminum oxide which is prepared by microwave method
into drilling fluid increases the amount of specific heat of capacity 6.7%, friction
factor 5.8% and velocity about 3.7%, averagely.
Also, the comparative results are briefly presented in below chart as the fraction of value
of nano drilling fluid to the value related to the simple drilling fluid:
Table 4. The comparative results of some basic parameters.
property Re Pr St α Pe
Ultrasonic nano
particle+ drilling
fluid
1.38 0.222 0.89 0.88 1.07
Microwave nano
particle+drilling
fluid
1.34 0.223 0.93 0.89 1.04

31
Final conclusion introduces a new viewpoint about the effect of method of preparation of
nano aluminum oxide on the nano drilling fluid. So, although the preparation method of
nano particle affects the behavior of nano drilling fluid but this doesn't show any
considerable effect. The difference between the results of ultrasonic drilling fluid and
microwave nano fluid can be bold under high temperature and high pressure conditions.