Embed Size (px)
Citation preview

Investigating Power Laws in Hurricane Damages
Calvin BlackwellCollege of Charleston
Special Thanks to Kathryn Williams

Paper Summary
• The distribution of yearly damages due to hurricanes in the US is ‘fat‐tailed.’
• The tail of the distribution is so ‘fat’ that the variance of damages, conditional on being in the tail, is potentially unbounded.

Most Damaging Hurricanes, 1900 –2005 (Pielke et al. 2008)
Hurricane Year Normalized DamagesGreater Miami 1926 $157 BKatrina 2005 $81 BGalveston (1) 1900 $78 BGalveston (2) 1915 $62 BAndrew 1992 $58 BNew England 1938 $37 B

Power Law Distributions
Normal Distribution:12
/
Power Law Distribution:2
Discovered Power Laws
• City Size• Asset Market Movements• Earthquakes (Richter Scale is a logarithmic scale)
• Hurricanes (Corral et al. 2010)• Lots of others

Tail Effects (Nordhaus, 2012)
• For power law tails, conditional on being in the tail, the distribution of extreme events is wide.– Ex: Normal distribution 200 year event
• Typical event is 12% larger than 200 year event
– Ex: Power law distribution 200 year event• For earthquakes (ζ < 1), typical event is 1000% larger than 200 year event
• 2011 Japanese earthquake biggest ever in Japan!

Interesting Facts About Power Laws
• Two parameters: ζ and xmin
• ζ determines all the moments of the distribution.– If ζ < 1, mean is divergent– If ζ < 2, variance is divergent– pattern holds for higher moments
• Smaller ζ means ‘fatter’ tail• xmindetermines where power law behavior begins

Question
• Do hurricane damages in US have a power law tail?
• If so, what is ζ?• Or is distribution
– lognormal?– exponential?
1 2 3 4 5x
0.1
0.2
0.30.4
0.50.6
0.7
f x

Data
• Pielke et al. (2008) data set of normalized economic hurricane damages from 1900 – 2005
• Damages = direct losses determined immediately after hurricane
• Damages normalized to be estimated as if the (historical) hurricane made landfall under contemporary levels of societal development– Controls for inflation, wealth and population
• Damages aggregated by year, not hurricane
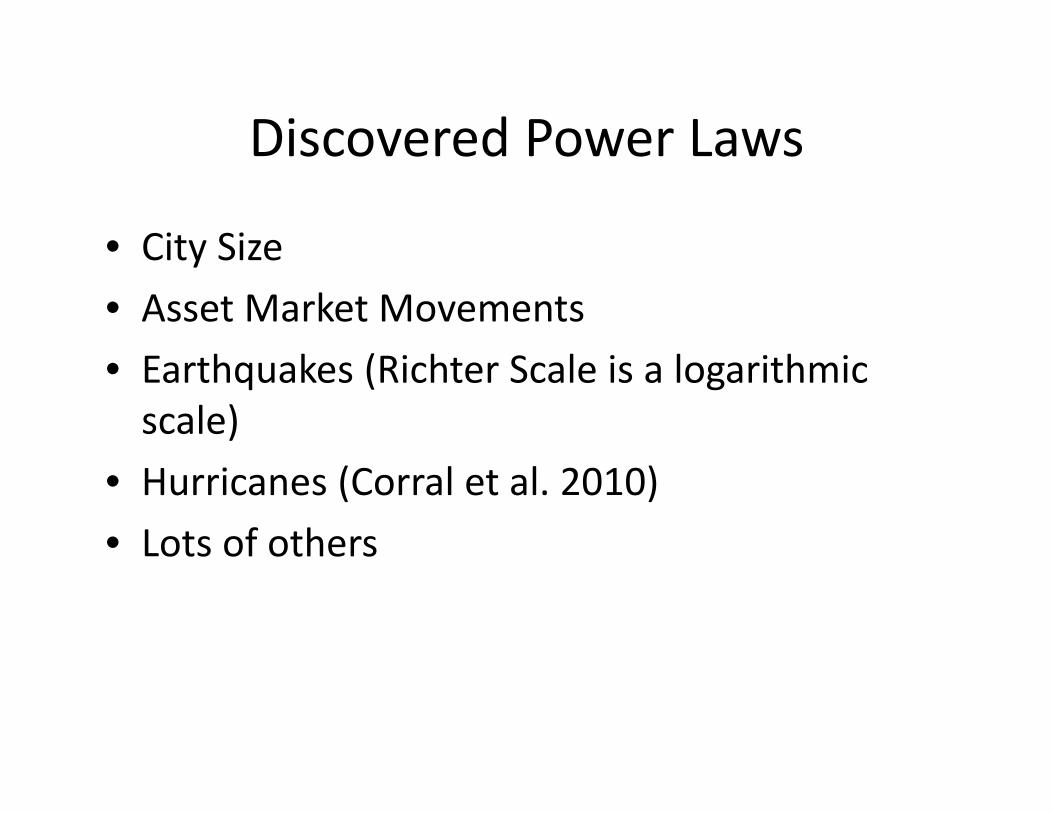
Descriptive Statistics
N Min Max Mean Std. Dev.
PL05 Damage 106 0 161 10.3 23.2
CL05 Damage 106 0 144 10.1 21.8

Histograms – Untransformed Data

Histogram ‐ Log(Damages) Scale

Histogram ‐ Log‐Log Scale

Power Law Estimation
• To estimate ζ, use Hill’s MLE:
• To calculate xmin follow suggestions of Clauset, Shalizi & Newman (2009):– Estimate ζ for each possible xmin and find:
– Choose xminwith smallest KS value.
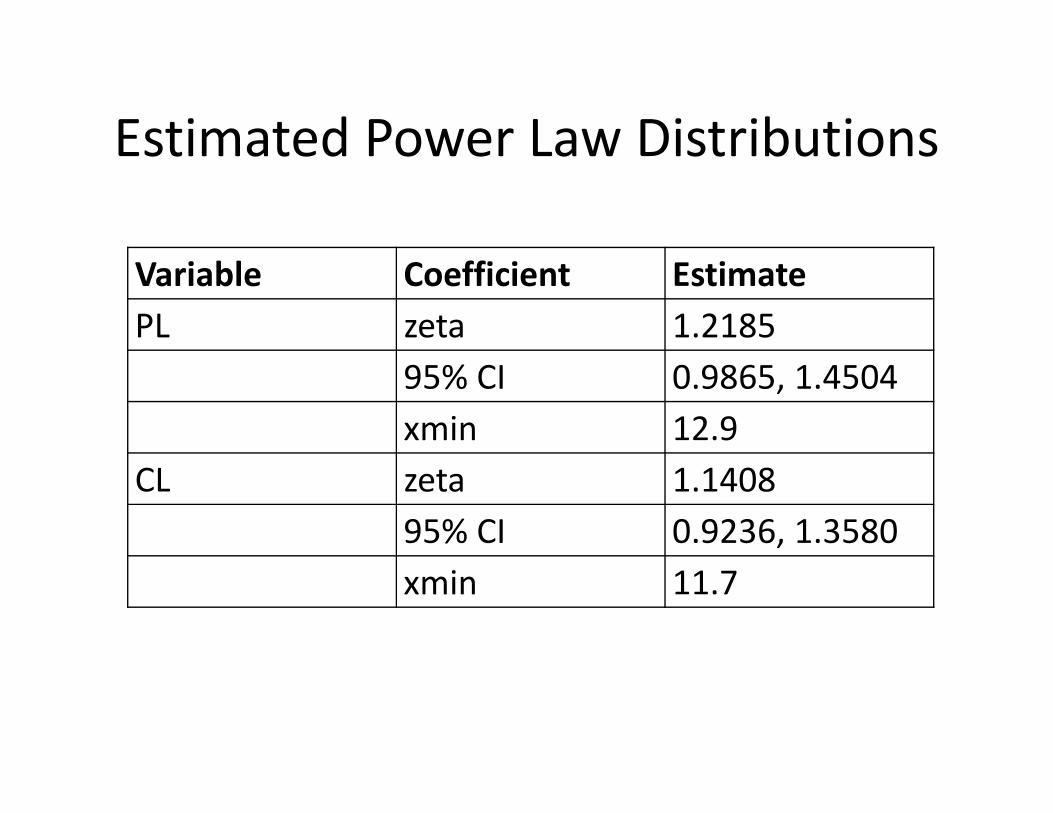
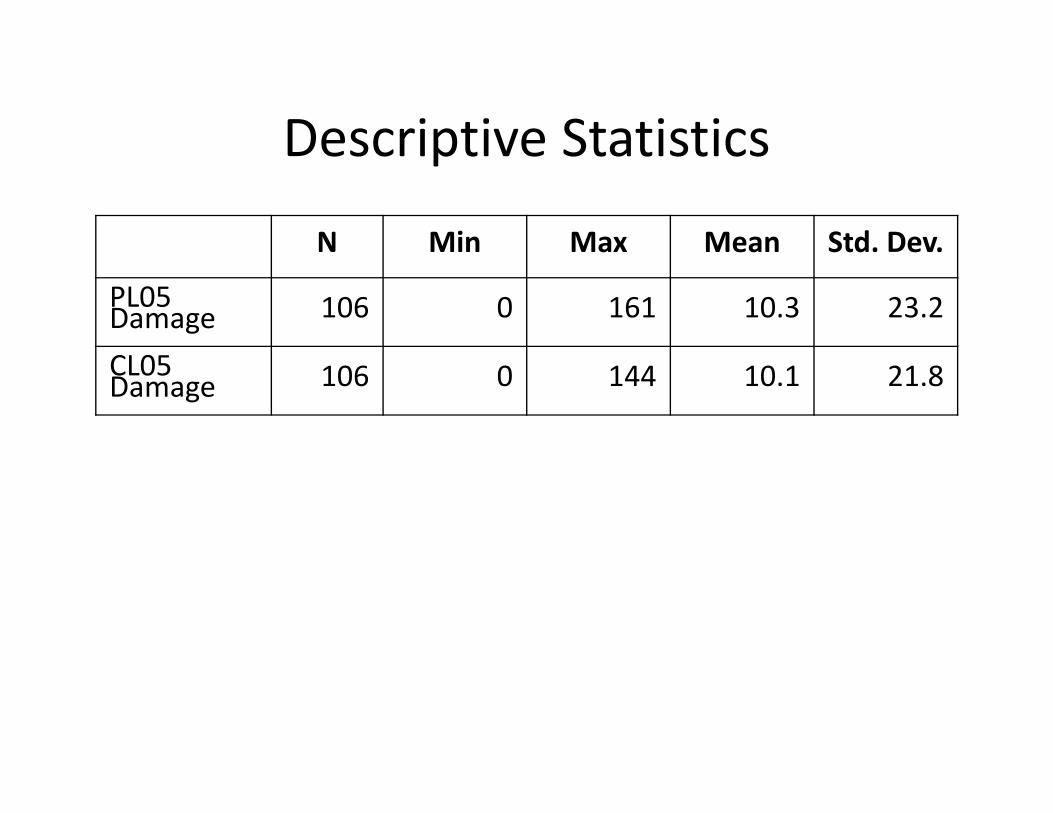
Estimated Power Law Distributions
Variable Coefficient EstimatePL zeta 1.2185
95% CI 0.9865, 1.4504xmin 12.9
CL zeta 1.140895% CI 0.9236, 1.3580xmin 11.7

Goodness of Fit Tests for Power Law Distribution (Clauset et al., 2009)
1. Generate many synthetic data sets from estimated PL distribution.
2. Re‐estimate xmin and ζ for each synthetic data set.
3. Calculate a KS statistic for each synthetic data set by comparing to true distribution.
4. Count the proportion of times the original KS statistic exceeds the KS statistic from the synthetic data sets – proportion is p‐value.

K‐S Tests of Distributions
Variable Hypothesized Distribution
p‐value
PL Normal 0.000Exponential 0.000Log‐Normal 0.799Power Law 0.414
CL Normal 0.000Exponential 0.000Log‐Normal 0.760Power Law 0.156

Future Work
• Likelihood ratio tests to directly compare goodness of fit.– Nested hypothesis tests for tail.

Conclusion
• Hurricane damages may follow a power law or a lognormal distribution.
• If power law, variance of damages is estimated to be unbounded.