Embed Size (px)
Citation preview

Investigating improvements in quality of survey estimates by updating auxiliary information in the sampling frame using returned and modelled data
Alan Bentley, Salah Merad and Kevin Moore

Overview
• Motivation
• Modelling
• Evaluation of benefits to estimation

Motivation
• Employment Headcount– current size stratifier
• 0-9; 10-19; 20-49; 50-99; 100-299; 300+
• Issues• Burden on businesses with large
number of Part Time employees• Homogeneity of strata
• Full Time Equivalent (FTE) Employees – suggested as alternative
• FTE = Full Time + 0.5*Part Time

Motivation
• Updating of register via a sample survey - Business Register and Employment Survey (BRES)
• Large businesses updated every year• Small businesses less often
• Regression Modelling – suggested to improve timeliness of frame data
• Predict• Full Time & Part Time; or• Full Time Equivalent – for every local unit

Data Available
• Survey Data (current Business Register)• Employees • Region • Industry • Age• Time of last update • Number of local units in enterprise group
• Administrative Data• Employees (from PAYE – Pay As You Earn)• Turnover (from VAT – Value Added Tax)

Data Structure
BR
BRS BRBRS
PAYE PAYEPAYE PAYE
BRBRSPAYE
VAT VAT VAT VAT
BRBRSPAYEVAT
at least one of at least one of

Regression Modelling
• FTE Dependent Variable
• Modelling for business <100 employment
f FTE x

Regression Modelling
• Model identified includes the following covariates:
• Register employees• PAYE employees• VAT turnover• Number of local units in enterprise group• Time of last update• Region• Industry• Significant interactions of these

Variable Transformations

Log Transformation

Model Residuals

Model Residuals – After Noise Added

Test for Constant Variance
• Breusch-Pagan test for heteroscedasticity
• Squared residuals regressed against covariates in substantive model
• Under null hypothesis: ~
• Strong evidence to reject the null hypothesis: residuals appear to have non constant variance
2nR k

Explanatory Power of the Model
R2
Full Model 81.5
Simple Model – register employees as only predictor
79.6

Domain analysis of R2
R2
Industry Simple Model
Full Model Difference
Manufacturing 82.1 84.2 2.1Electricity, Gas & Water
68.0 68.8 0.9
Construction 62.9 68.1 5.2Wholesale 81.6 83.4 1.8Hotels and Restaurants
66.3 73.3 7.0

Model validation by data splitting
Full Data
Training
Validation
50%
50%
R2
Training 81.7
Validation 81.4

Model validation by bootstrap
Full DataBootstrap
Sample
Sample withreplacement
• Efron (1983)
• Over optimism less than 0.05%

Back-transformation
• Simple back-transformation will give under-estimates of the dependent variable on the original scale
• Wooldridge (2000) gives an adjustment for the log back-transformation:
2ˆ
ˆ ˆexp exp log2
y y

Benefits to business survey estimation
• Monthly Production Inquiry (MPI)• Monthly Inquiry into Distribution Services Sector
(MIDSS)
• Using an expansion estimator:
• Assuming Neyman allocation, variance due to stratification:
1
ˆh
Hh
yUh
NV t S
N
2
2
1
ˆ 1 h
HyUh
hh h h
SnV t N
N n
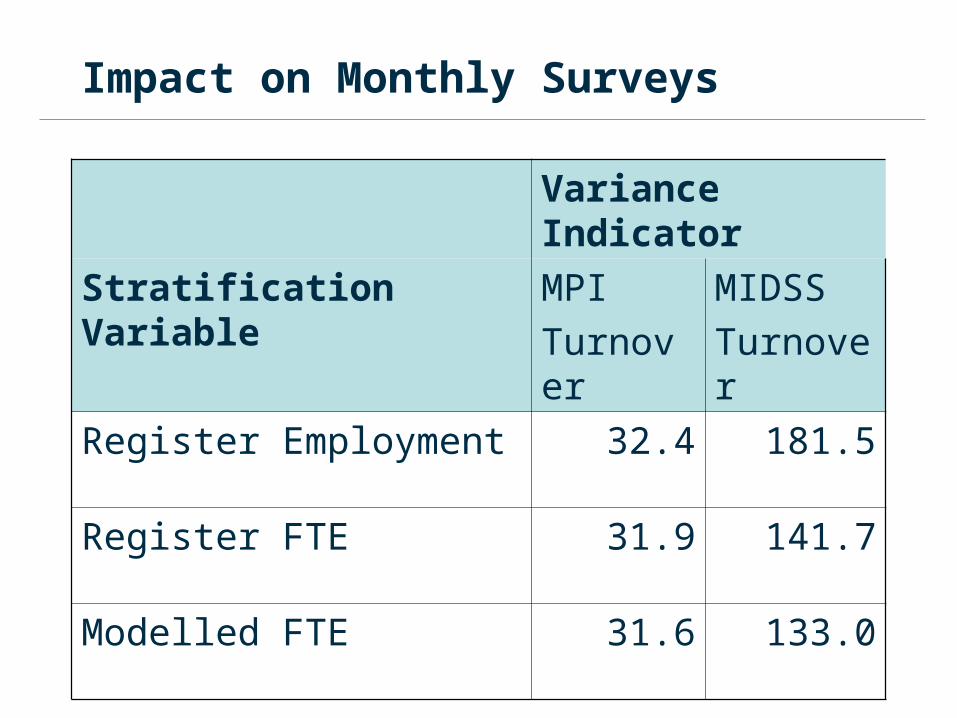
Impact on Monthly Surveys
Variance Indicator
Stratification Variable MPI
Turnover
MIDSS
Turnover
Register Employment 32.4 181.5
Register FTE 31.9 141.7
Modelled FTE 31.6 133.0

Concluding Remarks
• Model identified for predicting FTE employees• High R2 and high predictive power• Non constant variance• Large reliance on one covariate – employment
headcount
• Benefits to sample design and estimation• FTE a useful frame variable• Greatest benefit to sampling in service industries• Additional benefit from modelling appears small

Areas for further work
• Improvements to modelling• Heteroscedasticity – Multilevel modelling?• More recent data (2005 – 2008)• BRES data
• Improvements to evaluation• Impact on other business sample surveys• Impact at industry level• Impact under ratio estimation • Correlations between modelled FTE and survey
variables: FTE as auxiliary• Pilot study