Embed Size (px)
Citation preview

RESULTS PRESENTATIONFOR THE PERIOD ENDED
30 SEPTEMBER 2019
INVESTEC PROPERTY FUND

2
Glossary
CCS Cross currency swaps
CGT Capital gains tax
Edcon Edcon Holdings Limited
EV Enterprise value
GAV Gross asset value
GBF General banking facility
HFS Held for sale
IAPF Investec Australia Property Fund
Ingenuity or ING Ingenuity Property Investments Limited
IPF or The Fund Investec Property Fund Limited and its subsidiaries
IRS Interest rate swaps
Izandla or Izandla Property Fund Izandla Property Fund Proprietary Limited
MTM Mark to market
NAV Net asset value
NPI Net property income
PEL Pan-European logistics
PELI Pan-European light industrial
UK Fund Nestor Investment Holdings Limited
WALE Weighted average lease expiry
3
1. Six months in review
2. Financial review
3. Balance sheet management
4. SA property portfolio
5. Projects
6. Capital expenditure and sustainability
7. SA investments
8. Offshore investments
9. Capital allocation
10. Looking ahead
11. Annexures
Contents

SIX MONTHS IN REVIEW

5
Key highlightsFor the first half of the FY2020 year
New leadership settled• Complementary skills with similar philosophies and aligned behind a common purpose and strategy
• Supported by an experienced board of directors comprised of both property and financial / business skills
SA portfolio is resilient and maintained positive growth despite local headwinds• 1.3% base NPI growth
› 3.6% if Edcon rental rebate and tenant failures excluded
• Focus on letting – 89% of space expiring within the period re-let
• Low vacancy maintained – marginally up from 2.4% (March 2019) to 3.9%
• Total net cost to income increased to 20.9% (March 2019: 18.8%)
› Remains flat if Edcon and abnormal bad debts excluded
PEL platform continues to bolster portfolio performance• Further €21.5m invested
› 8 properties acquired (Netherlands, France and Poland) – GAV of €151m
• €106m deployed to date (€44m remaining)
• Current investment return of 11.9% in EUR (12.3% in ZAR); capital uplift since initial investment of 20.2% in EUR
• 20.1% total return for the period (in EUR)
• Letting activity ahead of business plan – 100% of total expiries let at positive reversion of 8.2%
• Portfolio vacancy of 1.2% – reduced from 5.1% at March 2019
• Initial €10m investment into PELI platform to acquire 25% interest – €54.5m remaining

6
Key highlightsFor the first half of the FY2020 year (continued…)
Further investment in UK Fund represents attractive enhancement to initial investment• Increased stake in UK Fund from 10% to 32.5% – £25m investment
• Acquired a portfolio of 3 retail warehouses for £14.7m (net initial yield of 7%)
• Expected to generate annualised total return of c.10% (in GBP)
Sell down of IAPF to facilitate successful ASX listing• Decreased stake from 20.9% to 9.9% to support ASX listing in May 2019 – R584m proceeds• 27.4% total shareholder return for the period
Capital recycling and investment activity implemented on an earnings enhancing basis• Sold R843m assets across SA and Australia and raised R519m debt to fund expansion
› Blended yield of 7.0%
• Exited minority Ingenuity position• Redeployed into Europe and UK
› Average return of 8.3%, higher returns generated on a risk-adjusted basis
• Balance used to fund local expansion and refurbishment / capital expenditure
Balance sheet strength further enhanced with sufficient capacity for growth• Gearing at 37.3% (March 2019: 35.9%) – marginal increase due to offshore activity
› SA cost of funding remains flat at 9.1%
• All balance sheet metrics enhanced› Hedging increased to 94% (March 2019: 84%)› Swap and debt maturity increased to 3.7 and 3.6 years respectively
• Balance sheet remains significantly unencumbered • Limited liquidity risk for the next 12 months
7
Key highlightsFor the first half of the FY2020 year (continued…)
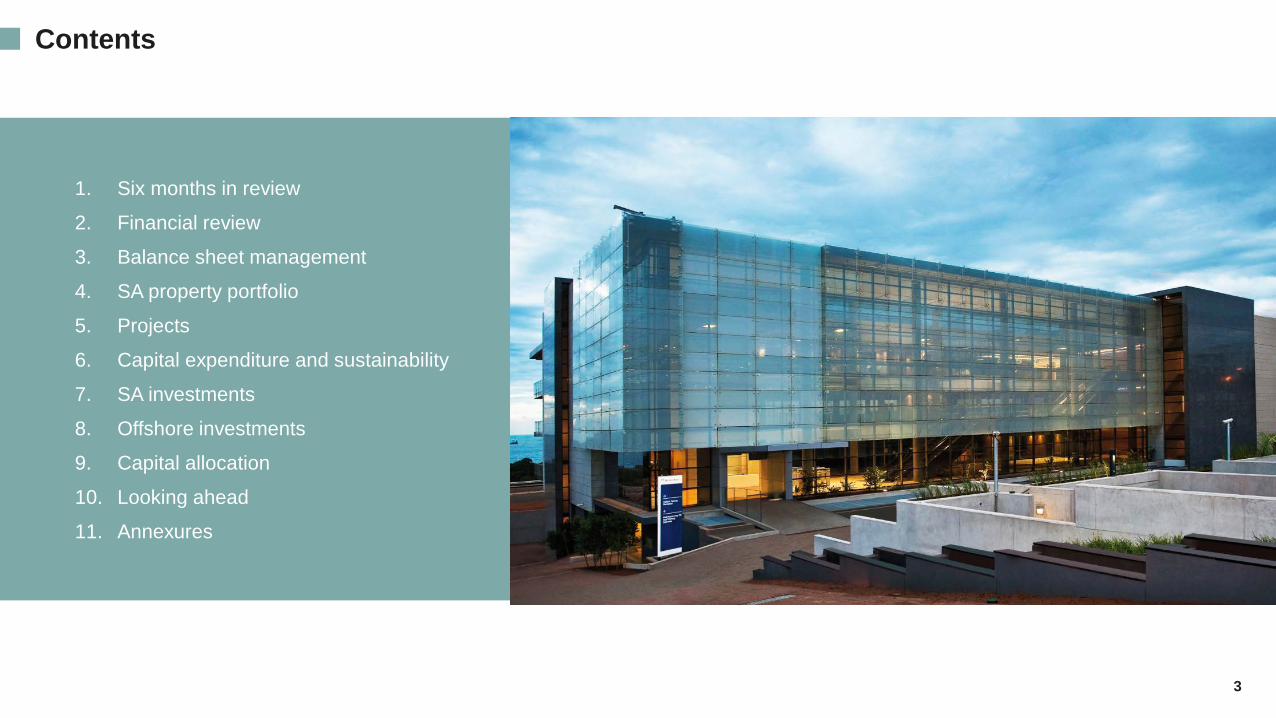
On track to deliver on full year DPS within FY20 guidance range• H1 2020 distribution growth of 3.1%• DPS growth impacted by tenant failures and Edcon rental rebate – c.3% impact on DPS growth YTD• Fund on track to deliver full year DPS in line with guidance of 3-5%
› assumes no material change to operating environment and no material client failures
› SA portfolio likely to deliver low single-digit growth
› Achieving upper end of guidance range dependent on timely deployment into European platforms

8
Key metrics – H1 2020Good performance in a challenging environment
8
1.3%like-for-like net propertyincome growth
(Sep 2018: 1.7%)
2.9 yearsWeighted averagelease expiry
(Mar 2019: 2.8 years)70.9 cps(Sep 2018: 68.8 cps)
3.1%half year distribution growth
89.0%of space expired in the period renewed or re-let
(Mar 2019: 94.2%)
20.9%total cost to income ratio
(Mar 2019: 18.8%)
3.9%vacancy
(Mar 2019: 2.4%)1
SA portfolio in focus
94.0% interest rate exposure hedged (Mar 2019: 84.0%)
Swap expiry extended to 3.7 yrs (Mar 2019: 3.4 yrs)
7.1%all-in cost of funding decreased
(Mar 2019: 7.9%)
1.5%increase in NAV driven by performance of offshore investments
37.3% gearingTarget below 35%
(Mar 2019: 35.9%)
Balance sheet metrics
Offshore performance
Balance sheet composition
81.4% South Africa 18.6% Offshore
11.9% investment return8.2% capital uplift
EUR 20.1%total return from PEL YTD
GBP 10%anticipated total return from UK Fund
27.4%total shareholder return from IAPF YTD
13.0% including strategic development vacancy
(Mar 2019: 84.8%) (Mar 2019: 15.2%)

9
Operational strategyLiving the strategy in the Fund’s H1 2020 accomplishments…
Focus onlong-term value
creation
M&A- remain
opportunistic
Strategicoffshoreplatforms
Peopleon the ground
Propertypurists
Disciplinedapproach to
capital allocationand assetrecycling
Balance sheetmanagement
9
• Strive to differentiate ourselves through:› Best of breed assets› Client experience and creating an out-
of-the-ordinary experience for tenants› Unlocking the potential of space
• Targeted initiatives:› To anticipate and mitigate leasing risk through
early lease renewals and higher tenant retention
› Guerrilla tactics to source and secure
• Focused on repositioning SA assets:› Extracting value from existing assets› Positioning old / non-core assets for sale› Making hold / invest / sell decisions› Identifying ‘core-plus’ assets where
we can work on unlocking value• Operational efficiencies
• Explored opportunities in SA:› across asset classes – industry
consolidation› in unlisted space
• Assessed M&A opportunities to the value of ±R24bn in SA but turned them down
• Disposal of non-core and under-performing assets› more efficiently allocate capital
• Active balance sheet and treasury management• Well-positioned balance sheet
• Further deployment into UK and European platforms• Investment into new PELI platform
• PEL has gained scale • Performance is supporting overall IPF portfolio growth
• Offshore investments provide optionality
• Review of minority positions• Exited Ingenuity investment
• Sold down IAPF holding• Disposed of 4 properties - non-core

FINANCIAL REVIEW

11
1. Total NPI decreased due to sale of 4 properties (this was offset by savings in funding costs)2. Decreased due to disposal of 2 buildings in H2 2019 and 4 buildings in H1 20203. Includes income from IAPF (R37.9m), UK Fund (R8.8m), PEL portfolio (R86.1m) and Izandla (R16.6m), change in composition of investments4. Comprise fund expenses and asset management fee. Management fee increased as the EV increased and the Zenprop discount reduced
6. Interest from Izandla not serviced is not distributed, however more has been serviced in FY20 – in line with business plan7. Withholding tax on IAPF dividend and CGT on partial disposal of investment in IAPF
5. Decreased due to proceeds received on sale of buildings and IAPF shares used to pay down debt, offset by deployment into European platforms and UK Fund
Distribution statement3.1% H1 2020 DPS growth, in line with guidance
11
ActualSep 2019
Rm
Prior yearSep 2018
Rm±
%Net property income (excl. straight lining)¹ 701.2 720.7 (2.7)Base net property income 679.6 670.6 1.3Acquisitions and disposals2 21.6 50.0 (56.7)Income from investments3 149.4 135.1 10.6 Notional cost of Ingenuity funding 4.4 4.4 -Other operating expenses4 (50.2) (46.1) (9.0)Net finance costs5 (275.8) (300.3) 8.2 Izandla JPIK interest not received6 (1.3) (6.0) 78.1 Antecedent dividend - 1.55 (100.0)Taxation (net of deferred tax and CGT)7 (5.5) (2.7) (107.8)Net distribution income 522.2 506.6 3.1 Number of shares 736.3 736.3 -Total distribution per share (cents) 70.9 68.8 3.1
12
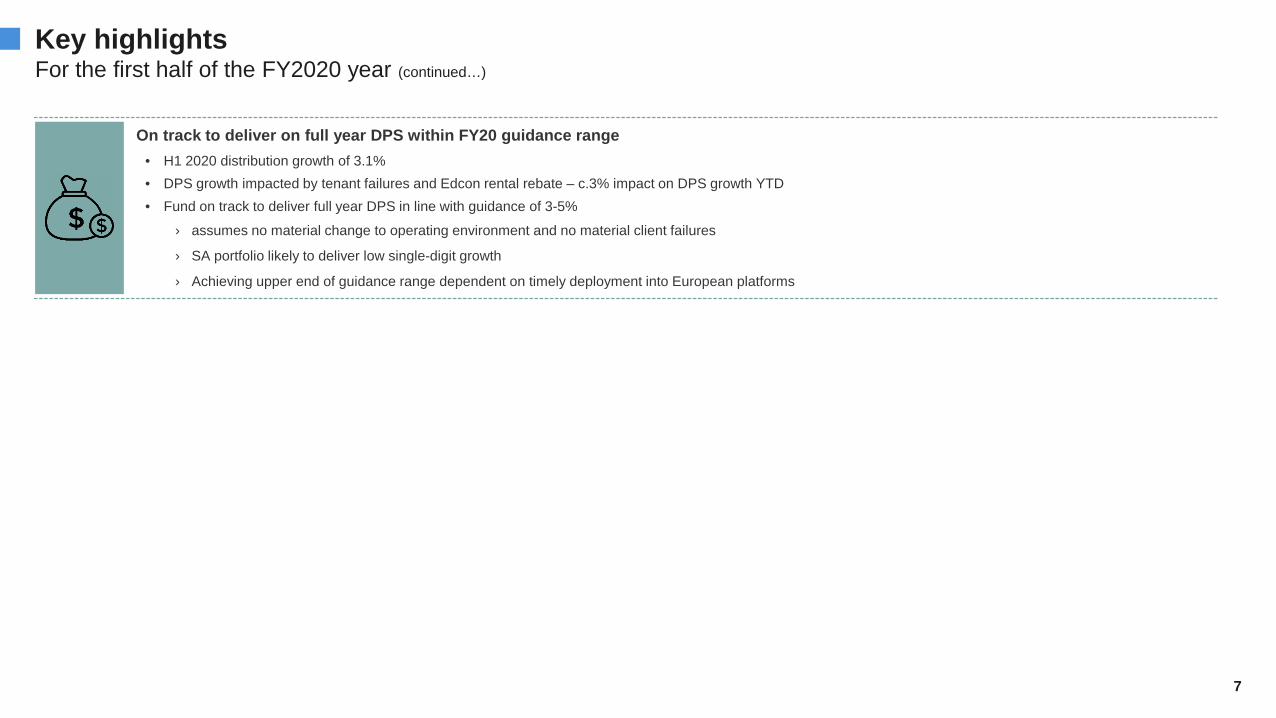
Dividend bridgeOffshore investments – remains a key contributor to growth
507 52233 9 25(19) (29) (4)
HY19distribution
Increased PELplatform revenue
Reduction inincome from IAPF
BaseNPI growth
Acquisitionsand disposals
NPI
Reduction of netfinancecosts
Operatingcosts¹
HY20distribution
Rm
1. Increase in operating costs largely attributable to decrease in Zenprop discount

13
Summarised income statementSignificant fair value gains achieved on IAPF investment
13
ActualSep 2019
Rm
Prior yearSep 2018
Rm±
%Net property income(incl. straight line adjustment) 689.6 744.3 (7.3)
Other operating expenses (50.2) (46.1) (9.0)Fair value adjustments 251.8 367.2 (31.4)
Mark to market – derivatives1 (94.6) 10.5 (1 001.2)Foreign exchange translation2 31.5 (42.5) 174.1 Mark to market – investment property (0.3) (51.7) 99.4 Mark to market – investments3 169.9 220.4 (22.9)Mark to market – PEL portfolio4 143.5 (39.1)(Loss)/profit on sale of investment property 1.8 (5.0) 135.9
Net finance costs5 (275.8) (300.2) 8.1 Income from investments6 177.0 133.0 33.1 Taxation7 (51.6) (7.2) (617.1)Accounting profit after tax 740.8 891.0 (16.9)
1. Negative MTM on derivatives is largely driven by negative MTM on IRS book due to flattening of the IRS curve and on CCS due to ZAR weakness2. Movements in the EUR and GPB exchange rate, relating to foreign debt and investments3. Comprises IAPF increase of R183.8m (increase in share price from R12.86 to R15.72) and Ingenuity decrease of R13.9m (closing price R1.05)4. Marginal tightening of cap rate on underlying property portfolio5. Lower due to proceeds received on sale of buildings and IAPF shares – offset by deployment into PEL6. Includes income received from IAPF (R70.5m), UK Fund (R6.1m), PEL portfolio (R86.1m) and Izandla (R14.3m)7. Deferred tax on IAPF
14
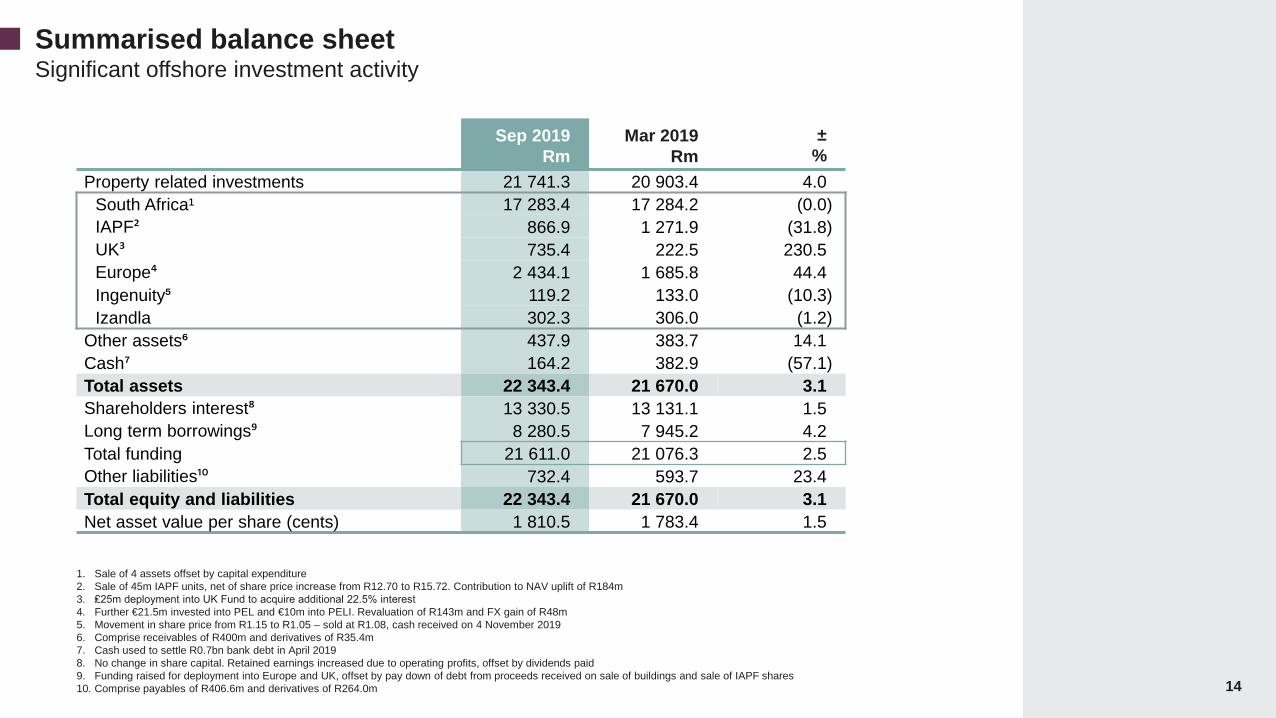
Summarised balance sheetSignificant offshore investment activity
14
1. Sale of 4 assets offset by capital expenditure2. Sale of 45m IAPF units, net of share price increase from R12.70 to R15.72. Contribution to NAV uplift of R184m3. ₤25m deployment into UK Fund to acquire additional 22.5% interest4. Further €21.5m invested into PEL and €10m into PELI. Revaluation of R143m and FX gain of R48m5. Movement in share price from R1.15 to R1.05 – sold at R1.08, cash received on 4 November 20196. Comprise receivables of R400m and derivatives of R35.4m7. Cash used to settle R0.7bn bank debt in April 20198. No change in share capital. Retained earnings increased due to operating profits, offset by dividends paid9. Funding raised for deployment into Europe and UK, offset by pay down of debt from proceeds received on sale of buildings and sale of IAPF shares10. Comprise payables of R406.6m and derivatives of R264.0m
Sep 2019Rm
Mar 2019Rm
±%
Property related investments 21 741.3 20 903.4 4.0 South Africa¹ 17 283.4 17 284.2 (0.0)IAPF² 866.9 1 271.9 (31.8)UK³ 735.4 222.5 230.5 Europe⁴ 2 434.1 1 685.8 44.4 Ingenuity⁵ 119.2 133.0 (10.3)Izandla 302.3 306.0 (1.2)
Other assets⁶ 437.9 383.7 14.1 Cash⁷ 164.2 382.9 (57.1)Total assets 22 343.4 21 670.0 3.1 Shareholders interest⁸ 13 330.5 13 131.1 1.5 Long term borrowings⁹ 8 280.5 7 945.2 4.2 Total funding 21 611.0 21 076.3 2.5 Other liabilities¹⁰ 732.4 593.7 23.4 Total equity and liabilities 22 343.4 21 670.0 3.1 Net asset value per share (cents) 1 810.5 1 783.4 1.5

15
Sep 2019Rm % of total
Mar 2019Rm % of total
SA investment property 17 283.4 79.5 17 284.1 82.7Ingenuity 119.2 0.5 115.8 0.6 Izandla 302.3 1.4 278.5 1.5 South African assets 17 704.9 81.4 17 678.4 84.8IAPF 866.9 4.0 1 251.8 6.1 UK Fund 735.4 3.4 222.5 1.1 European portfolio 2 434.1 11.2 1 379.0 8.0Offshore assets 4 036.4 18.6¹ 2 853.4 15.2 Total Investments 21 741.3 100.0 20 531.8 100.0
Balance sheet constructRemain committed to SA
1. Increased by 2.9% from year end as a result of deployment into UK Fund, PEL and PELI platforms, offset by sell down of IAPF
South Africa
UK
Australia
PEL
PELI
Return
Risk
Asset risk vs. return profile• Investment strategy progressing towards assets
that offer higher risk-adjusted returns
• Balance sheet remains diversified across SA & developed markets (82% SA focused)
Represents asset size / investment value
15

161. Additional deployment into PEL of €21.5m, initial investment into PELI of €10m, revaluation of the underlying portfolio amounting to R153m, income accrual and forex gains of R80m2. Deployment of additional £25m to increase stake to 32.5%3. Sale of 45m units in IAPF of R584m, offset by positive MTM on revaluation of R183m4. Debt drawn to fund acquisition activity, offset by proceeds from sales
Net asset value bridgeGrowth from investments (IAPF and PEL) offset by negative fair value movements on swap book
R’000
1 2
3
13,131 13,331
Opening NAV InvestmentPEL & PELI
InvestmentUK Fund
Sale of IAPF Movement indebt & cash
Working capital Movement inMTM & other
Closing NAV4
748
513 (405)
(554)
10 (112)

BALANCE SHEET MANAGEMENT
18
1. Increased due to new debt raised of R500m, with an average debt expiry of 5.5 years2. Includes all interest rate swaps and cross currency swaps over total debt3. Shown net of cash4. Secured assets as a percentage of total investments5. Secured debt as a percentage of total debt facilities6. Reduced to c.50% post period end (balance of sale proceeds received)
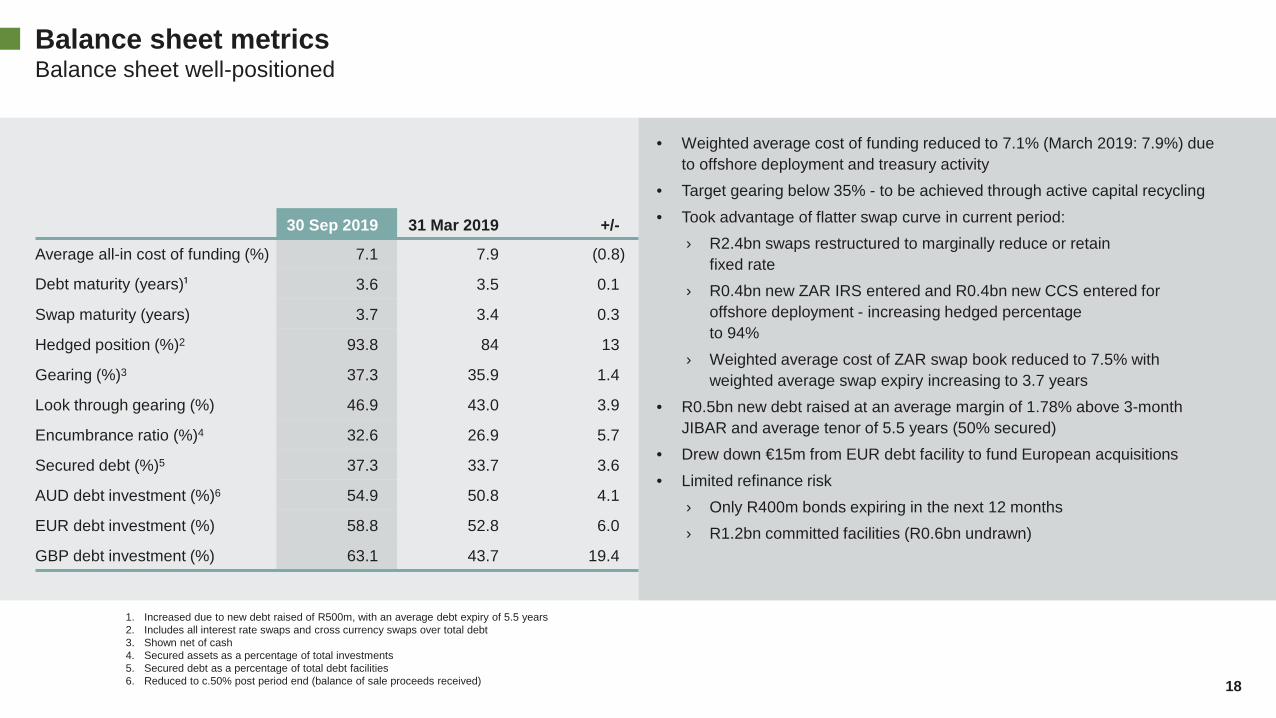
Balance sheet metricsBalance sheet well-positioned
30 Sep 2019 31 Mar 2019 +/-
Average all-in cost of funding (%) 7.1 7.9 (0.8)
Debt maturity (years)¹ 3.6 3.5 0.1
Swap maturity (years) 3.7 3.4 0.3
Hedged position (%)2 93.8 84 13
Gearing (%)3 37.3 35.9 1.4
Look through gearing (%) 46.9 43.0 3.9
Encumbrance ratio (%)4 32.6 26.9 5.7
Secured debt (%)5 37.3 33.7 3.6
AUD debt investment (%)6 54.9 50.8 4.1
EUR debt investment (%) 58.8 52.8 6.0
GBP debt investment (%) 63.1 43.7 19.4
• Weighted average cost of funding reduced to 7.1% (March 2019: 7.9%) due to offshore deployment and treasury activity
• Target gearing below 35% - to be achieved through active capital recycling• Took advantage of flatter swap curve in current period:
› R2.4bn swaps restructured to marginally reduce or retainfixed rate
› R0.4bn new ZAR IRS entered and R0.4bn new CCS entered for offshore deployment - increasing hedged percentageto 94%
› Weighted average cost of ZAR swap book reduced to 7.5% with weighted average swap expiry increasing to 3.7 years
• R0.5bn new debt raised at an average margin of 1.78% above 3-month JIBAR and average tenor of 5.5 years (50% secured)
• Drew down €15m from EUR debt facility to fund European acquisitions• Limited refinance risk
› Only R400m bonds expiring in the next 12 months› R1.2bn committed facilities (R0.6bn undrawn)
19
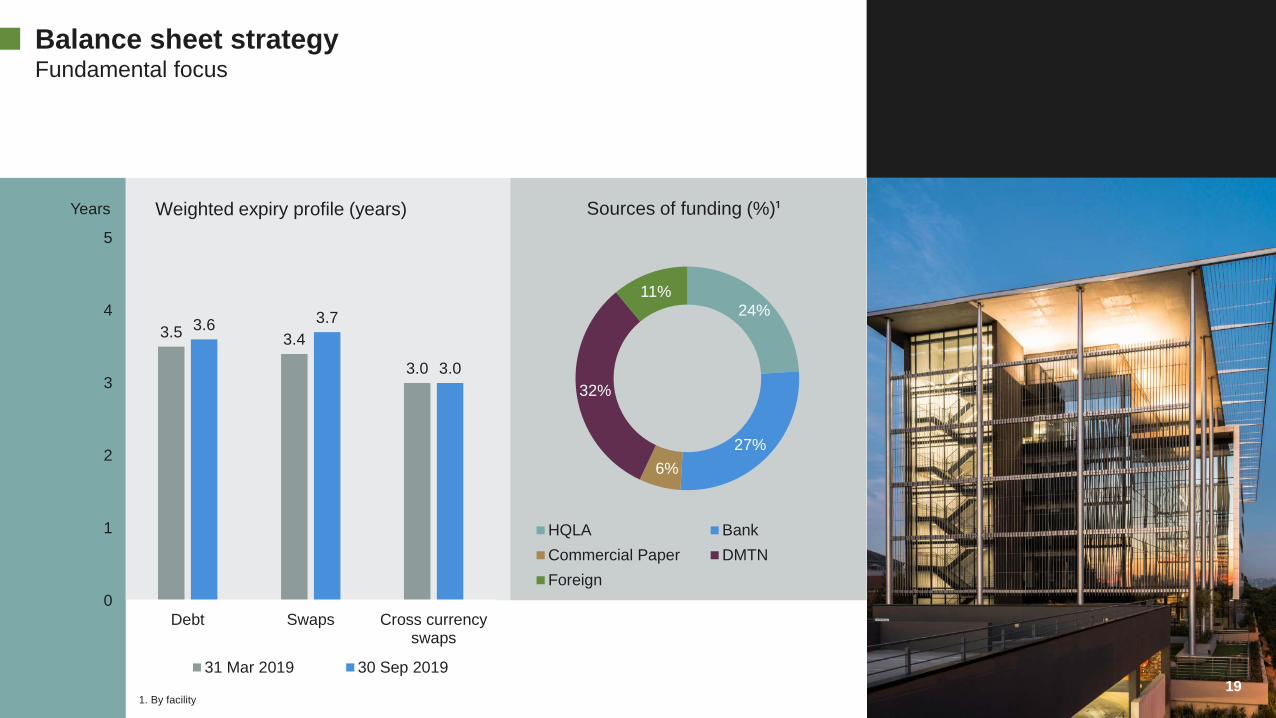
Balance sheet strategyFundamental focus
19
24%
27%6%
32%
11%
HQLA BankCommercial Paper DMTNForeign
3.5 3.4
3.0
3.6 3.7
3.0
0
1
2
3
4
5
Debt Swaps Cross currencyswaps
31 Mar 2019 30 Sep 2019
Sources of funding (%)¹Weighted expiry profile (years)
1. By facility
Years

20
Balance sheet strategyLooking forward
¹R400m bonds expiring, R452m commercial paper. IPF has sufficient committed facilities in the event investors choose not to roll²³Bank facilities of R300m (R160m drawn)R590m bonds - ample backstop facilities in place
2%9%
14%
28%33%
14%
0% 0%
16%10%
19%15%
19%14%
4% 3%0%
10%
20%
30%
40%
FY20 FY21 FY22 FY23 FY24 FY25 FY26 FY27Total swaps Total debt
Debt and swap expiry (%)
7%3%
15%
0% 0% 0% 0% 0%0% 0% 0%
12%
0% 0% 0% 0%
9%7%
4% 3%
8%4% 4%
0%0% 0% 0% 0%
11% 10%
0%3%
0%
5%
10%
15%
20%
FY20 FY21 FY22 FY23 FY24 FY25 FY26 FY27ZAR bank Foreign bank DMTN HQLA
Debt expiry (%)
¹
²³
R1.2bn committed facilitiesof which R0.6bn is undrawn (excluding GBF)
covers all imminent refinance risk

SA PROPERTY PORTFOLIO

221. Including legal tenants 3.6% (Sep 2018: 3.1%)2. Including strategic development vacancy 3.0%
SA property portfolioNPI growth despite macro-economic challenges
Property portfolio
• SA portfolio remains under pressure – positive letting performance and marginal uptick in vacancy, offset by increase in bad debts resulting from business failures and poor economy
• Total NPI decreased due to sale of 4 assets in H1 2020 and 2 assets in H2 2019. Base NPI growth subdued due to negative reversions, void periods and increased bad debts
• Cost to income ratio increased – key drivers as follows:› Low core rental growth of 0.4%, Edcon rental rebate, voids and negative reversions in prior and current year› Slight increase in variable costs – letting related costs due to increased letting activity› Significant increase in bad debts due to business failures and liquidations (4 large clients)› Fixed costs increased by 2.9% – well controlled, below inflation› Increase in net utility costs and net rates primarily due to void periods and council revaluations
• Vacancy increased 1.5% since March 2019 due to uptick in industrial off very low base• 89% of total expiries let YTD (full year – 84%)
ActualSep 2019
Rm
Prior yearSep 2018
Rm±
%Gross income 850.9 828.1 2.8
Net expense (171.3) (157.4) (8.8)
Base net property income 679.6 670.6 1.3Acquisitions and disposals 21.6 50.0 (56.7)Net property income(excl. straight lining) 701.2 720.6 (2.7)
Total net cost to income ratio 20.9% 19.3% 1.6%
Arrears % collectibles¹ 2.0% 1.0% 1.0%
22
Sep 2019 Mar 2019No. of properties 99 102
GLA (m²) 1 191 375 1 197 921
Vacancy 3.9% 2.4%²
WALE (years) 2.9 2.8
In-force escalation 7.5% 7.6%
Property asset value R17.3bn R17.3bn
231. Including legal tenants 4.4% (Sep 2018: 2.0%)
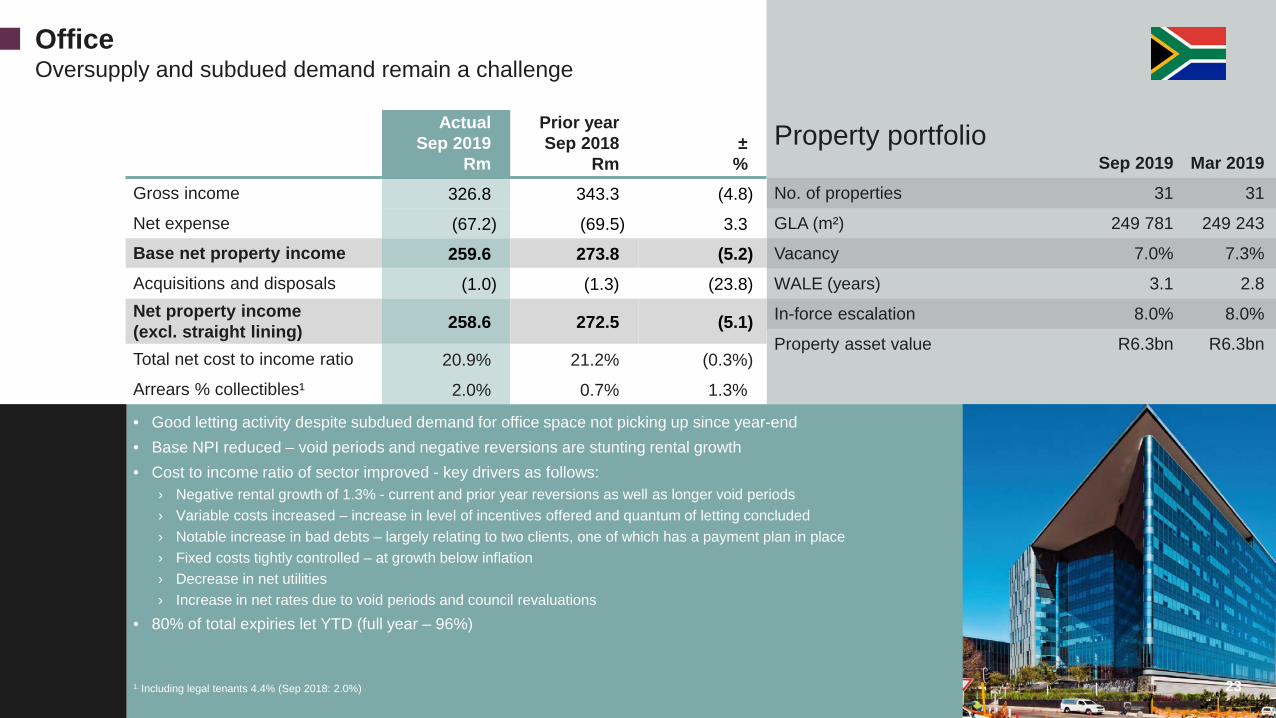
OfficeOversupply and subdued demand remain a challenge
Property portfolio
• Good letting activity despite subdued demand for office space not picking up since year-end• Base NPI reduced – void periods and negative reversions are stunting rental growth• Cost to income ratio of sector improved - key drivers as follows:
› Negative rental growth of 1.3% - current and prior year reversions as well as longer void periods› Variable costs increased – increase in level of incentives offered and quantum of letting concluded› Notable increase in bad debts – largely relating to two clients, one of which has a payment plan in place› Fixed costs tightly controlled – at growth below inflation› Decrease in net utilities› Increase in net rates due to void periods and council revaluations
• 80% of total expiries let YTD (full year – 96%)
ActualSep 2019
Rm
Prior yearSep 2018
Rm±
%Gross income 326.8 343.3 (4.8)Net expense (67.2) (69.5) 3.3 Base net property income 259.6 273.8 (5.2)Acquisitions and disposals (1.0) (1.3) (23.8)Net property income(excl. straight lining) 258.6 272.5 (5.1)
Total net cost to income ratio 20.9% 21.2% (0.3%)Arrears % collectibles¹ 2.0% 0.7% 1.3%
23
Sep 2019 Mar 2019No. of properties 31 31
GLA (m²) 249 781 249 243
Vacancy 7.0% 7.3%
WALE (years) 3.1 2.8
In-force escalation 8.0% 8.0%
Property asset value R6.3bn R6.3bn

241. Including legal tenants 4.1% (Sep 2018: 5.7%)
IndustrialUnder pressure given increase in bad debts and arrears
Property portfolio
• Sector resilient in challenging market – excellent letting• Client base under pressure as evidenced by rise in bad debts and arrears• Base NPI increased – good rental growth from shorter void periods,
offset by increase in bad debts• Cost to income ratio of sector increased – key drivers as follows:
› Good rental growth of 7.8% – shorter void periods in FY20› Variable costs stable year on year› Material increase in bad debts – low volume of tenants but high value in arrears› Fixed costs growth in line with inflation› Slight under recovery of net utilities and net rates to due to void periods
• Vacancy increased 2.8% since March 2019, due to additional vacancy at Riverhorse-IHD and Lerwick Road
• 88% of total expiries let YTD (full year – 84%)
ActualSep 2019
Rm
Prior yearSep 2018
Rm±
%Gross income 183.5 172.7 6.2 Net expense (34.0) (30.3) (12.4)Base net property income 149.5 142.5 4.9 Acquisitions and disposals 3.2 26.3 (87.9)Net property income(excl. straight lining) 152.7 168.8 (9.6)
Total net cost to income ratio 19.2% 17.0% 2.2%Arrears % collectibles¹ 3.8% 3.4% 0.4%
24
Sep 2019 Mar 2019No. of properties 37 38
GLA (m²) 527 723 531 501
Vacancy 4.0% 1.2%
WALE (years) 2.8 2.9
In-force escalation 7.5% 7.7%
Property asset value R3.8bn R3.7bn
251. Including legal tenants 2.8% (Sep 2018: 3.5%)². Including strategic development vacancy 1.8% (Mar 2019: 2.6%)
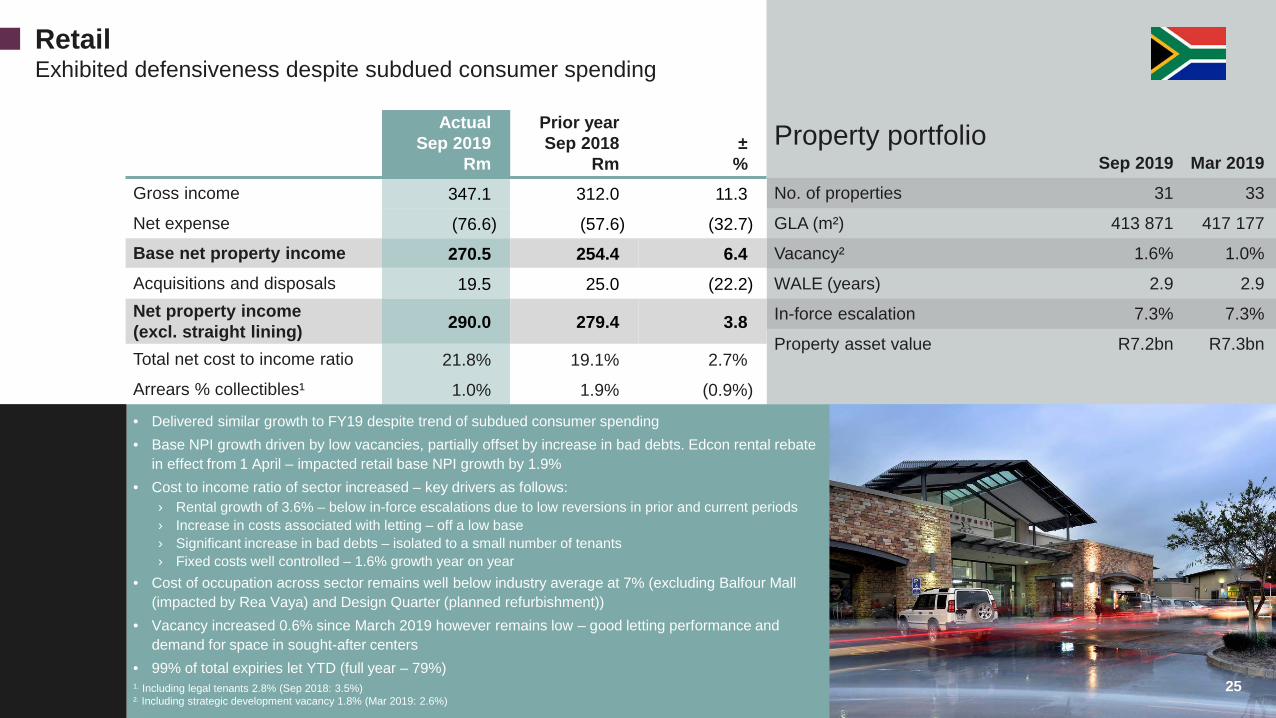
RetailExhibited defensiveness despite subdued consumer spending
Property portfolio
• Delivered similar growth to FY19 despite trend of subdued consumer spending• Base NPI growth driven by low vacancies, partially offset by increase in bad debts. Edcon rental rebate
in effect from 1 April – impacted retail base NPI growth by 1.9%• Cost to income ratio of sector increased – key drivers as follows:
› Rental growth of 3.6% – below in-force escalations due to low reversions in prior and current periods› Increase in costs associated with letting – off a low base› Significant increase in bad debts – isolated to a small number of tenants› Fixed costs well controlled – 1.6% growth year on year
• Cost of occupation across sector remains well below industry average at 7% (excluding Balfour Mall (impacted by Rea Vaya) and Design Quarter (planned refurbishment))
• Vacancy increased 0.6% since March 2019 however remains low – good letting performance and demand for space in sought-after centers
• 99% of total expiries let YTD (full year – 79%)
ActualSep 2019
Rm
Prior yearSep 2018
Rm±
%Gross income 347.1 312.0 11.3 Net expense (76.6) (57.6) (32.7)Base net property income 270.5 254.4 6.4Acquisitions and disposals 19.5 25.0 (22.2) Net property income(excl. straight lining) 290.0 279.4 3.8
Total net cost to income ratio 21.8% 19.1% 2.7%Arrears % collectibles¹ 1.0% 1.9% (0.9%)
25
Sep 2019 Mar 2019No. of properties 31 33
GLA (m²) 413 871 417 177
Vacancy² 1.6% 1.0%
WALE (years) 2.9 2.9
In-force escalation 7.3% 7.3%
Property asset value R7.2bn R7.3bn
26
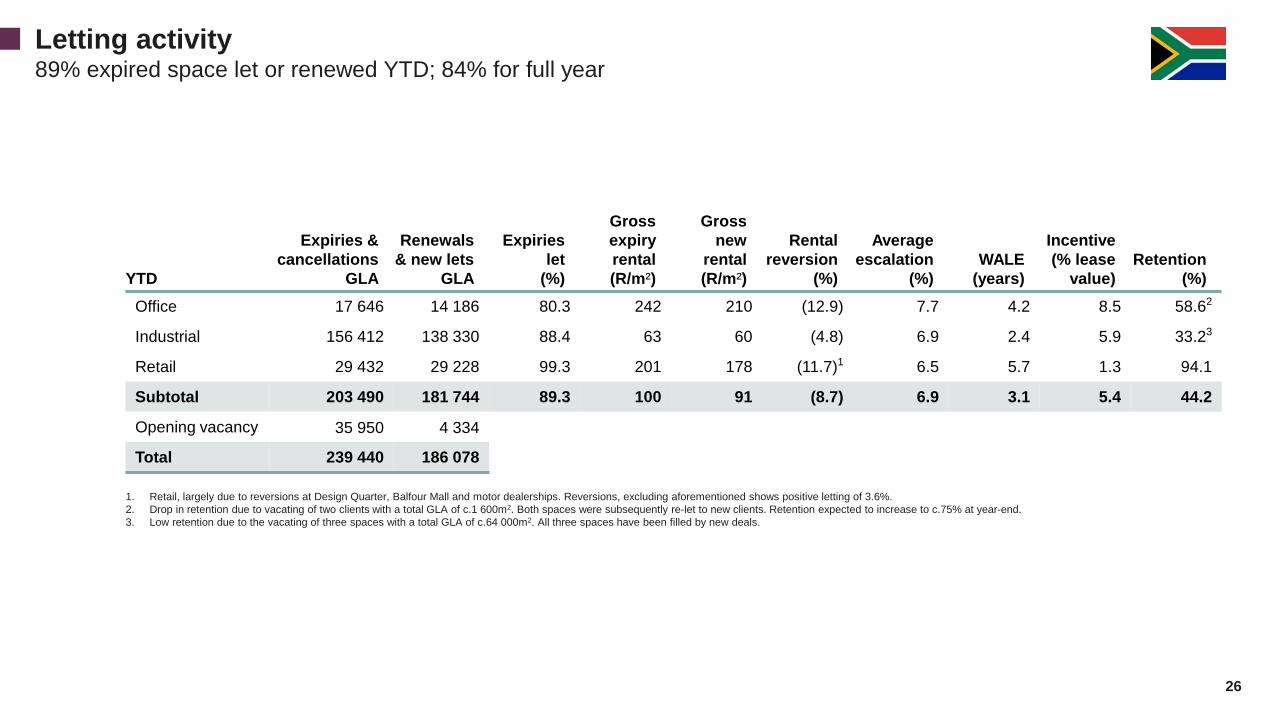
1. Retail, largely due to reversions at Design Quarter, Balfour Mall and motor dealerships. Reversions, excluding aforementioned shows positive letting of 3.6%.2. Drop in retention due to vacating of two clients with a total GLA of c.1 600m2. Both spaces were subsequently re-let to new clients. Retention expected to increase to c.75% at year-end.3. Low retention due to the vacating of three spaces with a total GLA of c.64 000m2. All three spaces have been filled by new deals.
Letting activity89% expired space let or renewed YTD; 84% for full year
YTD
Expiries & cancellations
GLA
Renewals& new lets
GLA
Expiries let
(%)
Gross expiry rental(R/m²)
Gross new
rental(R/m²)
Rental reversion
(%)
Average escalation
(%)WALE
(years)
Incentive(% lease
value)Retention
(%)Office 17 646 14 186 80.3 242 210 (12.9) 7.7 4.2 8.5 58.62
Industrial 156 412 138 330 88.4 63 60 (4.8) 6.9 2.4 5.9 33.23
Retail 29 432 29 228 99.3 201 178 (11.7)1 6.5 5.7 1.3 94.1
Subtotal 203 490 181 744 89.3 100 91 (8.7) 6.9 3.1 5.4 44.2
Opening vacancy 35 950 4 334
Total 239 440 186 078

27
Carrying amount
31 March 2019(Rm)
Revaluation and straight
lining(Rm)
Other capital
movements(Rm)
Directors’ valuation
30 Sep2019(Rm)
Totalchange
(%)
Revaluation and straight
lining(%)
Forward yield
(%)
Prior year yield
(%)Office 6 243.4 4.1 49.3 6 296.8 0.9% 0.1% 9.8% 9.4%Industrial 3 572.0 (0.7) 40.7 3 612.0 1.1% 0.0% 9.4% 9.5%Retail 6 653.5 43.8 66.1 6 763.4 1.7% 0.6% 8.4% 8.4%Total base 16 468.9 47.2 156.1 16 672.2 1.2% 0.3% 9.0% 9.0%Acquisitions - - 52.3 52.3 - - 4.4% 0.0%Held for sale 815.3 (52.3) (204.1) 558.8 (31.5%) (9.4%) 10.5% 8.8%Total portfolio 17 284.2 (5.1) 4.3 17 283.3 0.0% 0.0% 9.1% 9.0%
Property valuationsRealistic forward yield of 9.1%
27
Notes: • Directors’ valuation performed on total portfolio - properties revalued if significant changes in forecast net property income• Cap rates remained stable since year end• Net property income assumptions used are realistic and reflect the challenging environment• Acquisitions refers to 1 small property purchased in the current period

PROJECTS

29Existing
Re-positioning of offices• 96% of customers (office tenants, office clientele and retail customers)
utilise the basement parking• Cradock Avenue access provides thoroughfare for taxi commuters
however, commuters not spending time in the Firs – not our target market therefore negatively impacting first impressions of office lobby
• Plan to close off access to Cradock Avenue – reposition entranceof the offices
• Create sense of arrival in basement and improve reception area
ProjectsThe Firs
What do we expect from this upgrade?• Recognised as premier office space in Rosebank• Command higher than average market rents in Rosebank• Attract users that will remain with us longer than anticipated
- as a result of on-site amenities within walking distance to office space
The Firs• A Rosebank landmark – mixed-use precinct• Phase 1 retail refurbishment – well on its way to being established
as a food destination• Offices generate significant interest for niched office users• Positioning as “Where business-people meet and eat”
Proposed
29

30
• Work in progress for some time – 3-5 years• Has all the location and target market requirements of a
regional mall – IPF has not been able to take full advantage of positioning as a result of changing market dynamics and delays with Rea Vaya (impacting access)
• Have a better understanding of target market – where they come from, catchment area, what customers want
• Positioning mall to meet their needs
ProjectsBalfour Mall
30Existing
Proposed
What will this achieve? • Be the Mall of the people – safe and ‘the place’ to hang out
Acquisition of Highlands Mall - assists in positioning
Allow free flow of feet from Louis Botha Avenue (current taxi rank), general vehicular traffic, and huge volume of pedestrians
Income of Highlands Mall is made up of a complex retail mix – mainly informal and not IPF’s target market
Introduce exciting food and entertainment complex on parking deck with mechanical access from ground floor
Planned repositioning and reconfiguration – aim to retain income but lose a fair portion of current GLA
Community initiative – converting a portion of Standard Bank space into a study center for school children

31
4 Sandown Valley Crescent
ProjectsOther
31
Fleurdal Mall Phase 3
• Extension unveiled on 1 August – bigger, better shopping experience
• Added 6 000m² – increasing size of mall from 24 000m² to 30 000m²
• Launch received significant digital media exposure and featured in print publications
• Presented a brand identity – better access to offices• Improve visibility along Sandown Valley Crescent – give a better sense of arrival
Site used to stress test several client service initiatives – R&D department for office portfolio• Sense of arrival• Basement identity• High tech• Restaurant• Introducing meeting rooms and collaboration space on the ground floor for all tenants in property

CAPITAL EXPENDITURE AND SUSTAINABILITY
33
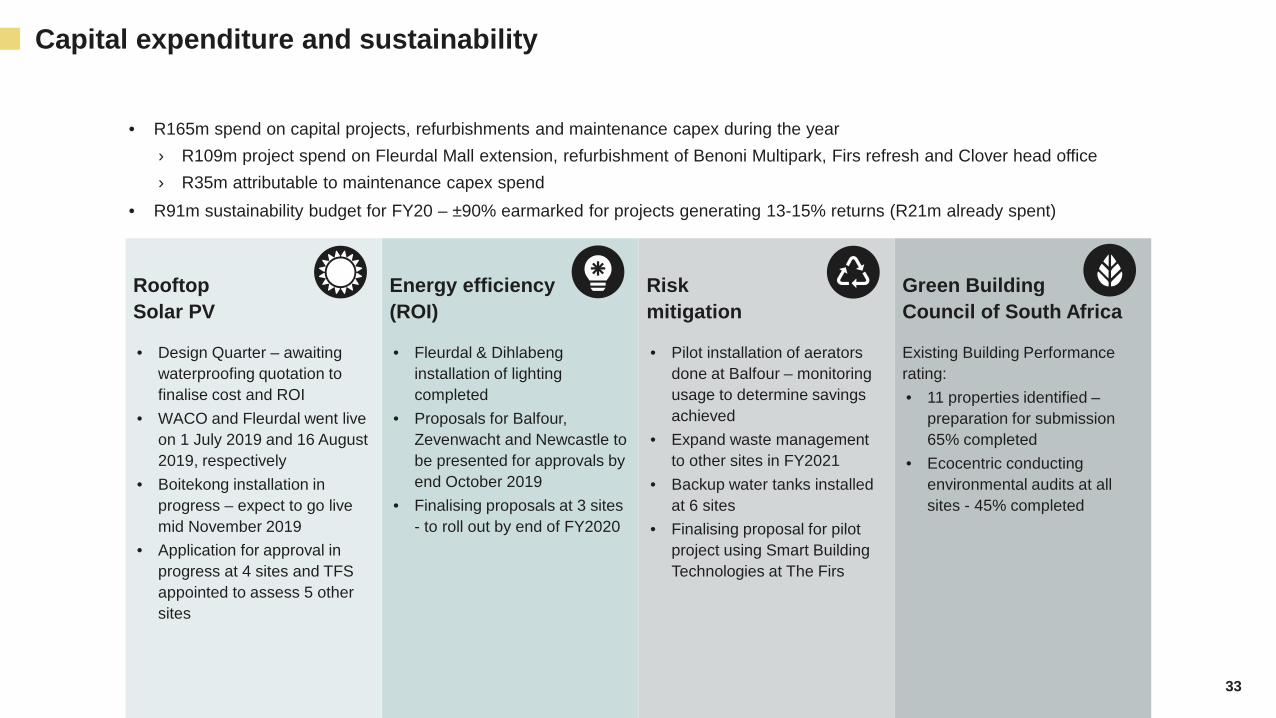
Capital expenditure and sustainability
RooftopSolar PV
• Design Quarter – awaiting waterproofing quotation to finalise cost and ROI
• WACO and Fleurdal went live on 1 July 2019 and 16 August 2019, respectively
• Boitekong installation in progress – expect to go live mid November 2019
• Application for approval in progress at 4 sites and TFS appointed to assess 5 other sites
Energy efficiency(ROI)
• Fleurdal & Dihlabeng installation of lighting completed
• Proposals for Balfour, Zevenwacht and Newcastle to be presented for approvals by end October 2019
• Finalising proposals at 3 sites - to roll out by end of FY2020
Riskmitigation
• Pilot installation of aerators done at Balfour – monitoring usage to determine savings achieved
• Expand waste managementto other sites in FY2021
• Backup water tanks installed at 6 sites
• Finalising proposal for pilot project using Smart Building Technologies at The Firs
Green BuildingCouncil of South Africa
Existing Building Performance rating:• 11 properties identified –
preparation for submission 65% completed
• Ecocentric conducting environmental audits at all sites - 45% completed
• R165m spend on capital projects, refurbishments and maintenance capex during the year› R109m project spend on Fleurdal Mall extension, refurbishment of Benoni Multipark, Firs refresh and Clover head office› R35m attributable to maintenance capex spend
• R91m sustainability budget for FY20 – ±90% earmarked for projects generating 13-15% returns (R21m already spent)

SA INVESTMENTS

35
Izandla
SA investments
• There has been no further investment by IPF intothe empowerment vehicle during the current period
• The shareholder loan granted to Izandla in FY19 to supportdevelopment of a client facility is likely to be refinancedby external funds before the end of the financial year
• Exited minority interest
› Ingenuity repurchased all ING shares held by IPFat R1.08 per share, as part of a general offer to all shareholders to repurchase their shares and de-list the company from the JSE
› Selling price at 29% premium to purchase price
• The disposal is part of IPF’s focused strategy to recycle capital into assets that generate higher risk-adjusted returns
Ingenuity
35
OFFSHORE INVESTMENTS

37
Pan-European logistics portfolioPlatform gaining scale
37
€106m deployed to date• Further €21.5m invested during the period to acquire a further 8 properties
across Netherlands, France and Poland (GAV of €151m)• €106m deployed to date – €44m remaining of €150m commitment• Portfolio comprises assets to the value of c.€671m (March 2019: €516m)• 60% of investment value hedged at average rate of 1.87%• 100% of income over the next 5 years hedged at rates between R16.49 –
R23.41
Performance tracking ahead of business plan (BP)• Strong letting has been concluded at positive average reversions
across the portfolio› 80% of opening vacancy let and 100% of year-to-date expiries let
at average reversion of positive 8.2%• Occupancy level at 98.8% (March 2019: 94.9%)• WAULT improved to 4.9 years (March 2019: 4.5 years)• Investment return on initial portfolio of 11.9% in EUR (12.3% in ZAR) and capital
uplift since initial investment of 20.2% in EUR (8.2% in the current period)• Total return for H1 2020 is 20.1% and since inception is 43.7% (in EUR)
France 184 11Germany 213 10Italy 45 3Netherlands 102 9Poland 91 10Spain 36 2Total 671 45

38
Pan-European logistics portfolio – letting activity100% of expired space let YTD
38
Highlights• 80% opening vacancy let• 100% of YTD expiries let at a reversion of positive 8.2%
Expiries & cancellations
Renewals & new lets Expiries let
Gross expiry rental
Gross new rental
Rental reversion WALE
GLA GLA (%) (€/m²) (€/m²) (%) (years)Netherlands 55 597 55 597 100 50 55 10.0 3.0France 6 010 6 010 100 45 43 (3.0) 3.0Poland 37 937 37 937 100 34 36 6.7 10.0Subtotal 99 544 99 544 100 44 47 8.2 4.7 Opening vacancy 51 211 40 793Total 150 755 140 337
39
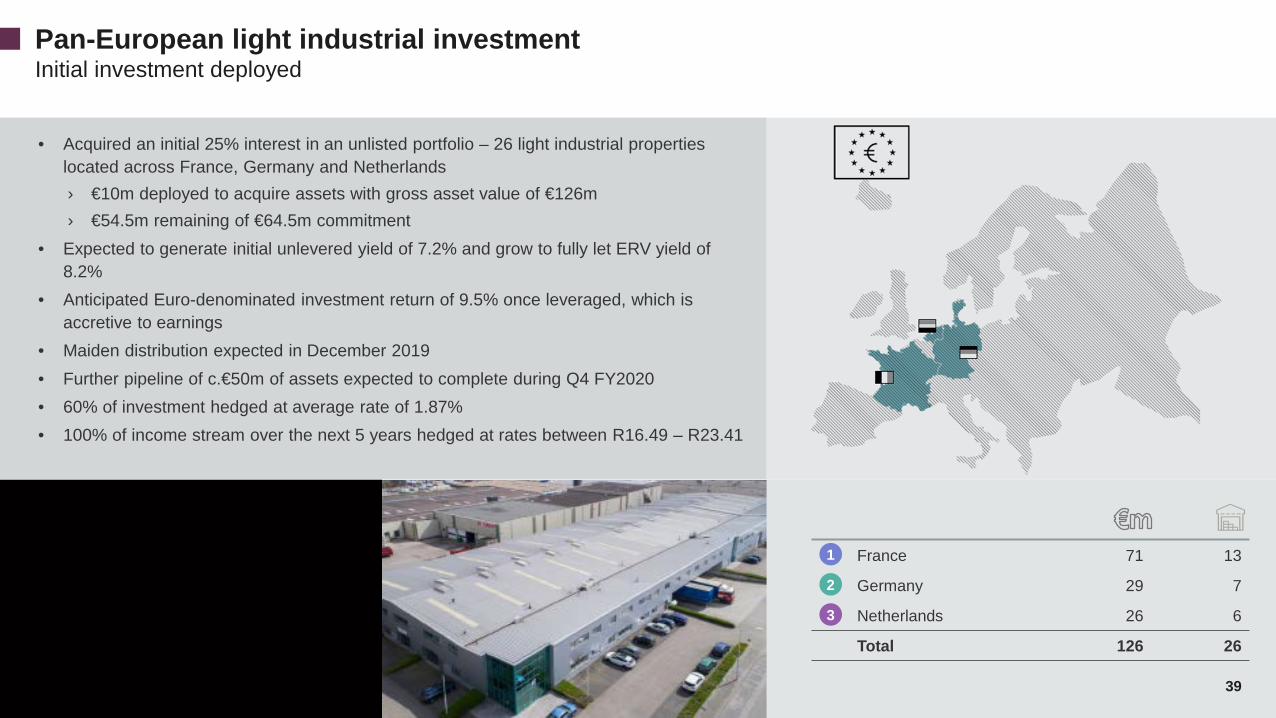
• Acquired an initial 25% interest in an unlisted portfolio – 26 light industrial properties located across France, Germany and Netherlands› €10m deployed to acquire assets with gross asset value of €126m› €54.5m remaining of €64.5m commitment
• Expected to generate initial unlevered yield of 7.2% and grow to fully let ERV yield of 8.2%
• Anticipated Euro-denominated investment return of 9.5% once leveraged, which is accretive to earnings
• Maiden distribution expected in December 2019• Further pipeline of c.€50m of assets expected to complete during Q4 FY2020• 60% of investment hedged at average rate of 1.87% • 100% of income stream over the next 5 years hedged at rates between R16.49 – R23.41
Pan-European light industrial investmentInitial investment deployed
39
France 71 13
Germany 29 7
Netherlands 26 6
Total 126 26
1
2
3

40
Key highlights• IAPF completed ASX listing in May 2019• In conjunction with the listing:
› IAPF undertook a primary capital raise of A$100m› IPF undertook a secondary capital raise and sold down 45m units
raising net proceeds of R584m • Strong demand received and offer was oversubscribed
› Final subscription price of A$1.32, above lower end of offer range• IPF interest reduced from 20.9% to 9.9%
› Further diluted to 9.0% post IAPF accelerated bookbuild offering of A$84m undertaken post interim period end
• Share price today of R16.12 (A$1.56) – 24% uplift since 31 March 2019• As expected, distribution received post ASX listing reduced by 10% on a like-
for-like basis (to align with other ASX listed REITs and best practice in Australia)
› Offset by 4% growth in FEC rate on a ZAR basis• Total return to IPF for the period was 27.4%• IAPF acquired three industrial properties during the period for purchase
consideration of A$81m at initial yield of 7.3%
IAPFASX-listing established and well received
40
Share price performance since ASX listing (A$)
95%
100%
105%
110%
115%
120%
125%
27-May 27-Jun 27-Jul 27-Aug 27-Sep 27-Oct
IAP AU A-REIT Index
19%
2%
Key portfolio metricsSep 2019 Mar 2019
No. properties 31 28
Total value of property AUD 1,180m AUD 1,063m
Value of investment R0.9bn R1.3bn
WALE (years) 4.6 4.7
Vacancy 0.1% 0.6%
NAV per unit AUD 1.33 AUD 1.30
Gearing 26.8% 38.1%

41
Further investment• IPF acquired an additional 22.5% interest in the UK Fund for £25m
increasing its shareholding to 32.5%› Total value of investment in UK Fund at £37.2m› IPF’s influence in the UK Fund has evolved to a position of joint control on
the back of the increased equity stake and shareholder rights
• 63% of investment value hedged at average rate of 2.43%• 100% of income stream over the next five years hedged at rates
between R18.52 and R26.06
Performance• 40% of opening vacancy let and no expiries in the current period• Expected to generate a post-tax income return of c.5% and total return of
c.10% p.a. in GBP
Acquisition activity• In September 2019, the UK Fund acquired a portfolio of 3 freehold retail
warehouse properties valued at £14.7m at net initial yield of 7%› Value on this portfolio can be unlocked by undertaking a conversion
to light industrial
UK FundStrategic investment and provides optionality
Key portfolio metrics
411Increase in vacancy due to tenant insolvency in one asset
UK portfolio Sep 2019 Mar 2019
Total value of property £254.1m £233.8m
Value of investment R721m R680m
Historical income return p.a. 5.4% 5.4%
WALE (years) 9.9 11.7
GLA (m²) 100 840 89 520
Vacancy 3.8%1 2.2%
Number of properties 13 10

9CAPITAL ALLOCATION
43
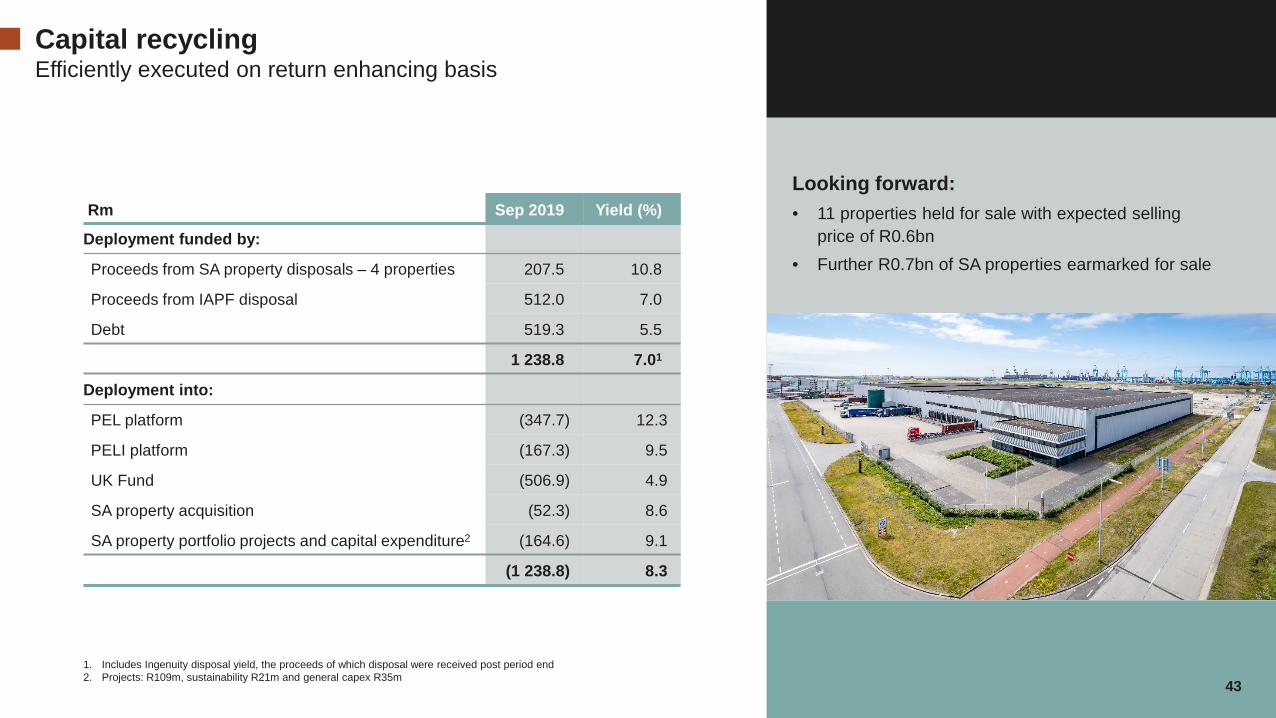
Capital recyclingEfficiently executed on return enhancing basis
43
Rm Sep 2019 Yield (%)
Deployment funded by:
Proceeds from SA property disposals – 4 properties 207.5 10.8
Proceeds from IAPF disposal 512.0 7.0
Debt 519.3 5.5
1 238.8 7.01
Deployment into:
PEL platform (347.7) 12.3
PELI platform (167.3) 9.5
UK Fund (506.9) 4.9
SA property acquisition (52.3) 8.6
SA property portfolio projects and capital expenditure2 (164.6) 9.1
(1 238.8) 8.3
Looking forward:• 11 properties held for sale with expected selling
price of R0.6bn• Further R0.7bn of SA properties earmarked for sale
1. Includes Ingenuity disposal yield, the proceeds of which disposal were received post period end2. Projects: R109m, sustainability R21m and general capex R35m

10LOOKING AHEAD

45
Focus on navigating the SA portfolio through the economic slow down…• Continue repositioning the portfolio
› Support performing assets and sell underperforming ones› Focus on property fundamentals ahead of anything else
• Proactive asset management› Extract value from existing assets› Anticipate and mitigate leasing risk› Monitoring of arrears and continual client engagement to manage bad debts› Guerilla leasing tactics› Timing of capex
• Investing in customer relationship management
• Continue to explore opportunistic M&A activity
… with further deployment into offshore platforms where growth is emerging• Continue to support and grow platforms
• Seek to increase offshore exposure beyond 20%
• Provides optionality – intention to gain control over time
• Continued deployment into Pan-European platforms
H2 2020 prioritiesWhat to expect over the next 6 months
45
Focus on client experience • 4 Sandown Valley Crescent• The Firs• Balfour• Zevenwacht
45
46
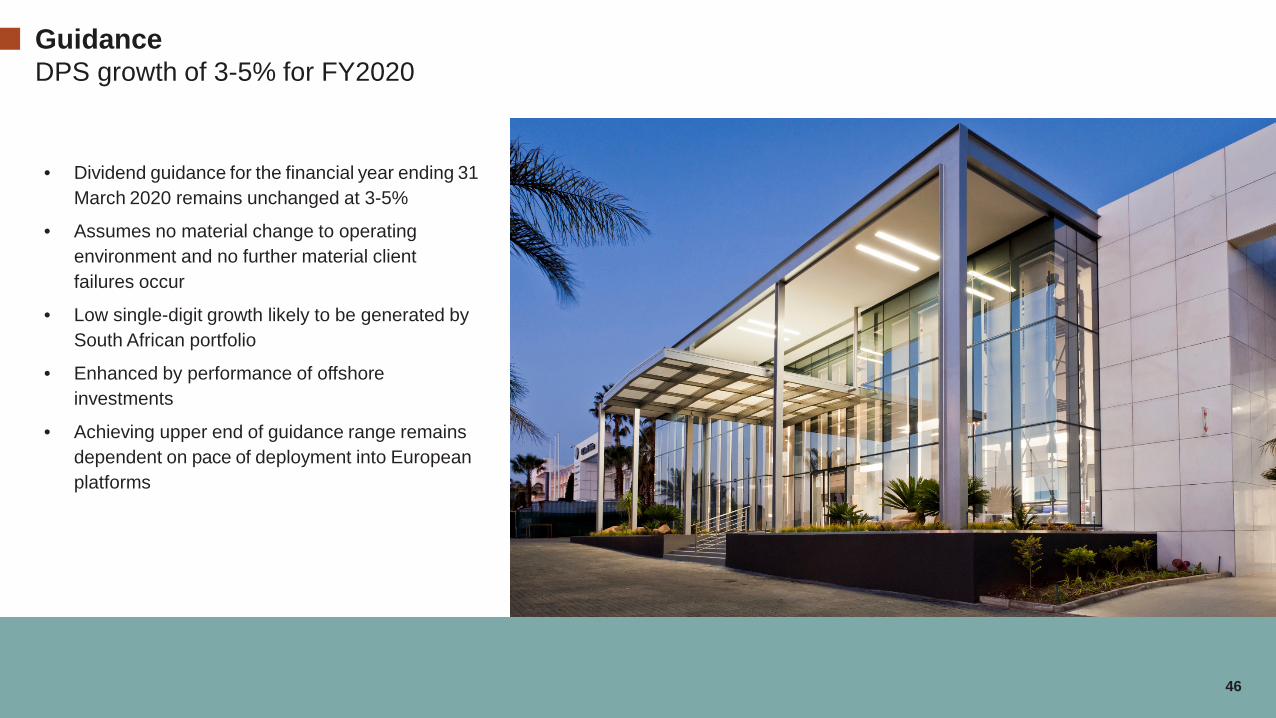
• Dividend guidance for the financial year ending 31March 2020 remains unchanged at 3-5%
• Assumes no material change to operating environment and no further material client failures occur
• Low single-digit growth likely to be generated by South African portfolio
• Enhanced by performance of offshore investments
• Achieving upper end of guidance range remainsdependent on pace of deployment into Europeanplatforms
GuidanceDPS growth of 3-5% for FY2020
46

47
• Good performance in H1 2020
• South Africa – excellent letting statistics have been marred by an increase in bad debts
• Positive capital allocation in terms of deployment and disposal activity improving the quality of the balance sheet
• PEL platform continues to drive distribution growth
• Guidance remains unchanged
Conclusion
47

11ANNEXURES

49
AppendixStrategic pillars Deliver sustainable long-term returns by…
…ensuring best of breed assets
…focusing onclient experience
as a key differentiator
…unlockingthe potential of space
Revenue securityand growth
Client serviceexcellence
Value add asset management andcapital allocation
Cost efficiencyand systemoptimisation
• Early engagement• Solutions based• Proactive asset
management
• Delivering an out-of-the-ordinary experience
• Differentiating IPF in a commoditised environment
• Understanding of and delivering on client needs
• Best of breed assets• Positioning the portfolio
for growth• Active capital recycling• Proactive balance sheet
management• Diversified investment
base• Maximise returns on a
long-term risk-adjusted basis
• Speed and agility• Margin preservation• Controllable costs tightly
managed
49
50
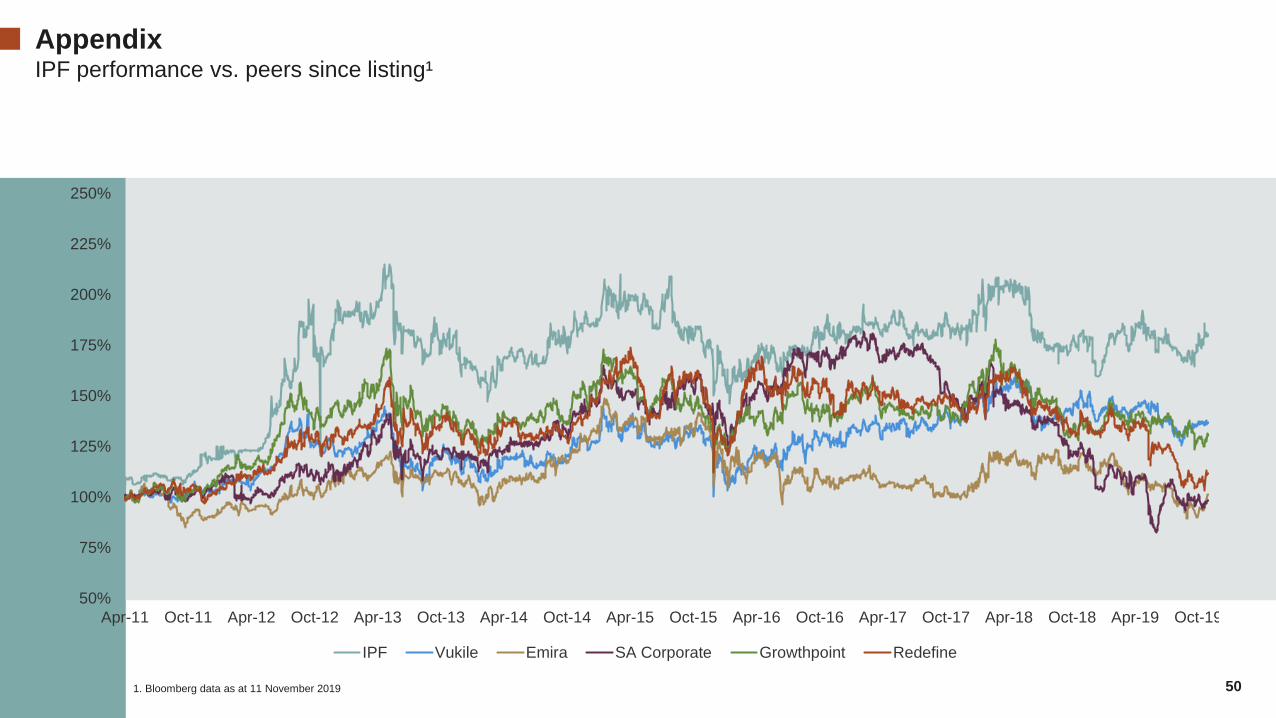
Appendix IPF performance vs. peers since listing¹
1. Bloomberg data as at 11 November 2019
50%
75%
100%
125%
150%
175%
200%
225%
250%
Apr-11 Oct-11 Apr-12 Oct-12 Apr-13 Oct-13 Apr-14 Oct-14 Apr-15 Oct-15 Apr-16 Oct-16 Apr-17 Oct-17 Apr-18 Oct-18 Apr-19 Oct-19
IPF Vukile Emira SA Corporate Growthpoint Redefine

51Source: Bloomberg as at 22 July 2019 and 1 November 2019; Rebosis removed from graph as it distorts it with discount of 40.5% in April 2019Note: Market capitalisation shown for shares with 2 classes is the combined market capitalisation (i.e. Dipula, Fortress, Gemgrow and Rebosis)
Sector forward yieldsTrend of negative sentiment in the market continues – yields slightly pushed out since year end
IAPF
Atta
cq
Equi
tes
Fortr
ess
A
Res
ilient
Stor
-Age
Libe
rty 2
Deg
rees
Gro
wth
poin
t
Vuki
le
Exem
plar
IPF
Dip
ula
A
Tran
scen
d
Hyp
rop
Fairv
est
Safa
ri
Arro
whe
ad A
Spea
r
Oct
odec
SA C
orpo
rate
Emira
Red
efin
e
Hos
pita
lity
Tow
er
Fortr
ess
B
Indl
upla
ce
Arro
whe
ad B
Text
on
Dip
ula
B
Acce
lera
te
Del
ta
Gearing 27% 36% 27% 32% 27% 25% 16% 36% 39% 36% 37% 42% 43% 35% 27% 13% 41% 38% 38% 37% 36% 44% 16% 34% 32% 30% 41% 47% 42% 39% 44%
Market cap (R'bn) 9.9 9.7 11.5 34.5 26.6 5.9 6.3 66.9 18.3 2.9 11.3 3.7 0.9 15.1 1.9 1.4 5.1 1.9 4.2 7.9 6.5 43.9 4.4 1.7 34.5 1.5 5.1 1.1 3.7 1.9 0.7
5.3% 7.
0% 7.4%
7.6%
8.6%
8.3%
8.9% 10
.1%
10.6
%
10.6
%
10.4
%
11.6
%
11.4
%
11.4
%
12.9
%
12.5
%
11.8
%
11.9
%
13.3
%
13.3
%
12.8
%
14.9
%
15.8
%
15.4
%
17.5
%
18.9
%
21.5
%
19.3
% 24.7
%
28.8
%
55.8
%
5.7%
6.6% 7.3%
7.4%
8.7%
8.4%
8.9% 9.5%
10.0
%
10.0
%
9.9% 10.6
%
12.8
%
11.3
%
12.5
%
12.3
%
12.0
%
9.6% 10
.8%
12.6
%
11.9
%
11.7
%
11.9
% 17.1
%
14.2
%
18.4
%
15.3
%
18.1
%
14.1
%
14.9
%
26.4
%
0%
20%
40%
60%
IAPF
Atta
cq
Equi
tes
Fortr
ess
A
Res
ilient
Stor
-Age
Libe
rty 2
Deg
rees
Gro
wth
poin
t
Vuki
le
Exem
plar IPF
Dip
ula
A
Tran
scen
d
Hyp
rop
Fairv
est
Safa
ri
Arro
whe
ad A
Spea
r
Oct
odec
SA C
orpo
rate
Emira
Red
efin
e
Hos
pita
lity
Tow
er
Fortr
ess
B
Indl
upla
ce
Arro
whe
ad B
Text
on
Dip
ula
B
Acce
lera
te
Del
ta
Friday, 1 November 2019 Monday, 22 July 2019Friday, 1 November 2019 Monday, 22 July 2019
10.6%10.2%

52Source: Bloomberg as at 11 October 2019
Price/NAVInvestec relative to peers
1.23
1.23
1.21
1.08
1.07
1.04
0.97
0.95
0.89
0.87
0.84
0.83
0.80
0.75
0.74
0.73
0.71
0.66
0.63
0.61
0.57
0.56
0.56
0.54
0.46
0.46
0.46
0.46
0.44
0.40
0.19
0.09
0.03
1.18
1.25
1.12
1.06
1.03
1.24
0.61
0.96
0.96
0.88
0.86
0.92
0.85
0.89
0.87
0.72
0.60
0.78
0.68
0.73
0.57
0.64
0.52
0.91
0.53
0.41
0.75
0.59
0.45
0.63
0.42
0.20
0.06
0.0
0.2
0.4
0.6
0.8
1.0
1.2
1.4
Stor
-Age
Equi
tes
IAPF
Dip
ula
A
Arro
whe
ad A
Fortr
ess
A
Res
ilient
Vuki
le
Gro
wth
poin
t
Fairv
est
IPF
Exem
plar
Fortr
ess
B
Spea
r
Red
efin
e
Libe
rty 2
Deg
rees
Tran
scen
d
Emira
SA C
orpo
rate
Hyp
rop
Atta
cq
Oct
odec
Safa
ri
Tow
er
Hos
pita
lity
Text
on
Reb
osis
A
Arro
whe
ad B
Indl
upla
ce
Dip
ula
B
Acce
lera
te
Del
ta
Reb
osis
B
Friday, 11 October 2019 Monday, 22 July 2019
Discount increased to 16% to NAV

53
Portfolio composition
40%
38%
22%
RetailOfficeIndustrial
Sectoral spread by revenue
42%
36%
22%
RetailOfficeIndustrial
Sectoral spread by asset value
53
35%
21%
44%
RetailOfficeIndustrial
Sectoral spread by GLA
54
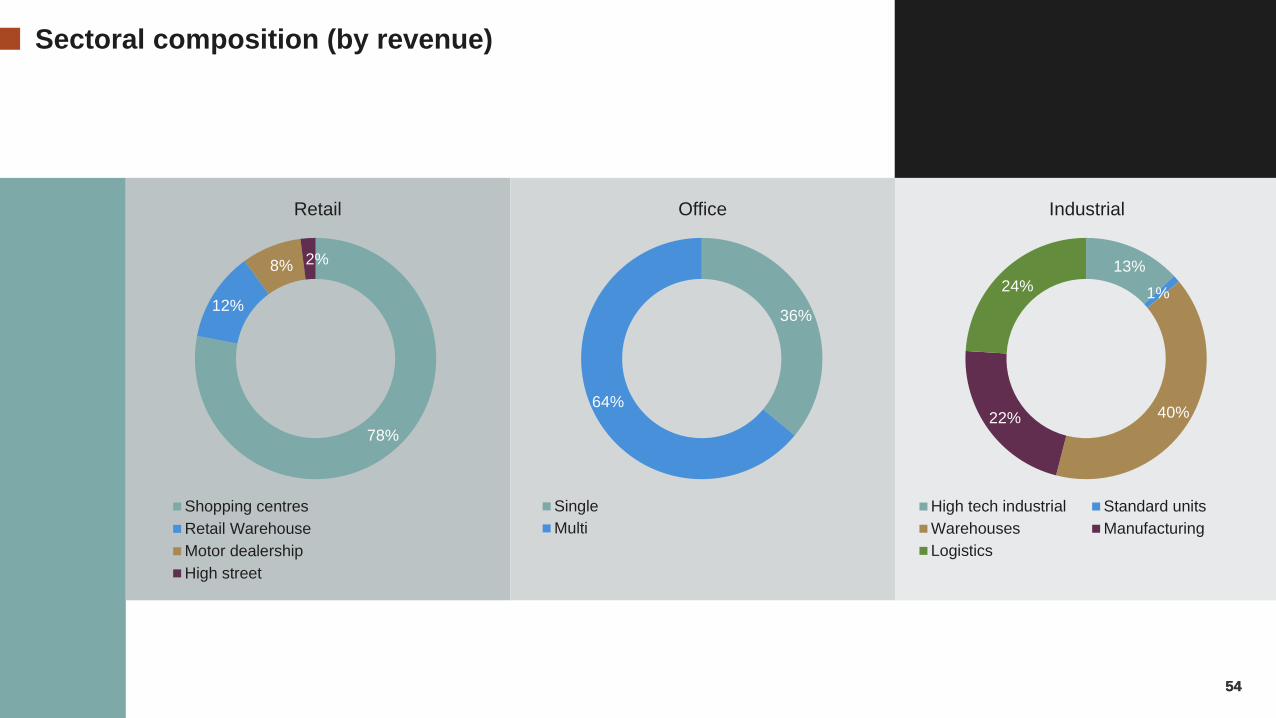
Sectoral composition (by revenue)
78%
12%
8% 2%
Shopping centresRetail WarehouseMotor dealershipHigh street
Retail
36%
64%
SingleMulti
Office
54
13%1%
40%22%
24%
High tech industrial Standard unitsWarehouses ManufacturingLogistics
Industrial

55
2%
5%
9%8%
14%
4% 4%
1%
6%7%
5%
8%6%
10%12%
10%
17%16%
23%
34%
0%
10%
20%
30%
40%
2020 2021¹ 2022 2023 April 2023 Onwards
Office Industrial Retail Portfolio
Lease expiry (by revenue)89% of YTD expiries already let and 89% for full year

56
• Average density of R2 370/m² (excluding Design Quarter and Balfour)• Amongst top 3 in chosen peer group – trading density growth of 2%
including Design Quarter and Balfour Mall (3.5% excluding) • Peer group trading density growth ranged from 2.8% (Vukile) to 0.8%
(Hyprop). Redefine and Growthpoint growing at 1.6% and 1.9% respectively
RetailTrading performance
• Positive growth in a tough environment – only Balfour Mall and Design Quarter showing negative growth
• Balfour trade expected to improve with Rea Vaya and precinct development plan
• Design Quarter – potential redevelopment plan in place• Dihlabeng flat growth – strategy to refresh tenant mix. Excluding
vacant stores, trade of remaining stores in line with past performance
• Long term growth expected to be in line with long term wage growth (4%-4.5%)
• Centers resilient in a difficult market, holding onto market share• Newcastle taking market share back from nearby competitors as a
result of improved tenant mix
7.9% 6.1% 5.4% 5.1%
(0.2%)(3.4%) (4.4%)
Fleurdal Kriel Zevenwacht Newcastle Dihlabeng Design Quarter Balfour
56
Retail – Average annual turnover growth (%)
5.8% 6.0%5.2% 5.3% 5.0%
4.3% 4.1% 4.1% 4.5% 4.4% 4.7% 4.7%
Oct Nov Dec Jan Feb Mar Apr May Jun Jul Aug Sep
Average like-for like turnover excluding Design Quarter and Balfour Mall (%)
1,630
2,370
1,7702,140 2,290
2,6702,200 2,310 2,340 2,370
Balfour BoitekongMall
DesignQuarter
Dihlabeng Fleurdal Great NorthRoad Plaza
Kriel Musina Newcastle Zevenwacht
Average trading density by centre (R/m²)
2019 2020

57
Top 10 tenants
Tenant name %Investec 5.4
Cliffe Dekker Hofmeyr 4.7
Woolworths 2.8
Innovation 2.4
Nedbank Group 1.9
Fluxmans Attorneys 1.8
Samsung Electronics Co. Ltd 1.4
Clover 1.2
Bigen Africa 1.1
ELB Engineering 1.1
Tenant name %Altron Ltd 2.2
Kevro Trading (Pty) Ltd 1.7
RT Group (Pty) Ltd 1.5
General Electric Ltd 1.4
Adcock Ingram Healthcare 1.1
Tiger Brands Ltd 0.9
Martin & Martin (Pty) Ltd 0.9
Waco International 0.9
AGCO Corporation 0.7
Naspers Limited 0.5
Tenant name %Massmart 5.8
Shoprite Checkers Group 3.0
Bidvest 2.1
Edcon Group 1.7
Mr Price Group 1.6
Foschini Group 1.4
Pick 'n Pay Group 1.3
Woolworths 1.2
Pepkor Group 1.0
Zenth Park Trading 0.8
OfficeGross revenue% of total portfolio
IndustrialGross revenue% of total portfolio
RetailGross revenue% of total portfolio
58
The information contained herein is for information purposes only and readers should not rely on such information as advice in relation to a specific issuewithout taking financial, banking, investment or professional advice. Although information has been obtained from sources believed to be reliable, InvestecProperty Fund Limited (Reg. No.2008/011366/06) and or any affiliates (collectively “Investec Property”), do not warrant its completeness or accuracy. Opinionsand estimates represent Investec’s view at the time of going to print and are subject to change without notice.
Past performance is not indicative of future returns. The information contained herein does not constitute an offer or solicitation of investment, banking orfinancial services by Investec Property. Neither Investec Property nor Investec Bank Limited shall be held liable in respect of any claim, damages or loss ofwhatever nature arising in connection with such information. Investec Property accepts no liability for any loss or damage of whatsoever nature including butnot limited to loss of profits, goodwill or any type of financial or other pecuniary or direct or special indirect or consequential loss however arising, whether innegligence or for breach of contract or other duty as a result of use of or reliance on the information contained in this document whether authorised or not.
This document/publication may not be reproduced in whole or in part or copies distributed without the prior written consent of Investec Property.
Disclaimer

![[ SHEESHAM WOOD FURNITURE ] - MakeShop · 02 SHEESHAM WOOD FURNITURE 03 IAPF-305 size :W60D30H95 price: 38,000+TAX IAPF-306 size :W90D30H70 price: 42,000+TAX PRAH1053 size :W73D43H50](https://img.dokumen.tips/doc/110x75/605a686faa18fd0c01437c2b/-sheesham-wood-furniture-makeshop-02-sheesham-wood-furniture-03-iapf-305-size.jpg)