Embed Size (px)
Citation preview
Inverse Regulation of Inflammationand Mitochondrial Function in Adipose
Tissue Defines Extreme InsulinSensitivity in Morbidly Obese Patients
The Harvard community has made thisarticle openly available. Please share howthis access benefits you. Your story matters
Citation Qatanani, Mohammed, Yejun Tan, Radu Dobrin, Danielle M.Greenawalt, Guanghui Hu, Wenqing Zhao, Jerrold M. Olefsky,Dorothy D. Sears, Lee M. Kaplan, and Daniel M. Kemp. 2013.“Inverse Regulation of Inflammation and Mitochondrial Functionin Adipose Tissue Defines Extreme Insulin Sensitivity in MorbidlyObese Patients.” Diabetes 62 (3): 855-863. doi:10.2337/db12-0399.http://dx.doi.org/10.2337/db12-0399.
Published Version doi:10.2337/db12-0399
Citable link http://nrs.harvard.edu/urn-3:HUL.InstRepos:12064536
Terms of Use This article was downloaded from Harvard University’s DASHrepository, and is made available under the terms and conditionsapplicable to Other Posted Material, as set forth at http://nrs.harvard.edu/urn-3:HUL.InstRepos:dash.current.terms-of-use#LAA

Inverse Regulation of Inflammation and MitochondrialFunction in Adipose Tissue Defines Extreme InsulinSensitivity in Morbidly Obese PatientsMohammed Qatanani,
1,2Yejun Tan,
1,3Radu Dobrin,
1,3Danielle M. Greenawalt,
1,3Guanghui Hu,
1,3
Wenqing Zhao,1,3
Jerrold M. Olefsky,4Dorothy D. Sears,
4Lee M. Kaplan,
5and Daniel M. Kemp
1,2
Obesity is associated with insulin resistance, a major risk factorfor type 2 diabetes and cardiovascular disease. However, not allobese individuals are insulin resistant, which confounds our un-derstanding of the mechanistic link between these conditions. Weconducted transcriptome analyses on 835 obese subjects withmean BMI of 48.8, on which we have previously reported geneticassociations of gene expression. Here, we selected ;320 nondi-abetic (HbA1c ,7.0) subjects and further stratified the cohort intoinsulin-resistant versus insulin-sensitive subgroups based onhomeostasis model assessment–insulin resistance. An unsuper-vised informatics analysis revealed that immune response andinflammation-related genes were significantly downregulatedin the omental adipose tissue of obese individuals with extremeinsulin sensitivity and, to a much lesser extent, in subcutaneousadipose tissue. In contrast, genes related to b-oxidation and thecitric acid cycle were relatively overexpressed in adipose ofinsulin-sensitive patients. These observations were verified byquerying an independent cohort of our published dataset of 37subjects whose subcutaneous adipose tissue was sampled beforeand after treatment with thiazolidinediones. Whereas the immuneresponse and inflammation pathway genes were downregulatedby thiazolidinedione treatment, b-oxidation and citric acid cyclegenes were upregulated. This work highlights the critical role thatomental adipose inflammatory pathways might play in the path-ophysiology of insulin resistance, independent of body weight.Diabetes 62:855–863, 2013
The number of obese individuals worldwide hasreached two billion, leading to an explosion ofobesity-related health problems associated withincreased morbidity and mortality (1,2). The in-
crease in the prevalence of obesity is strongly correlatedwith an increase in type 2 diabetes mellitus, reaching ep-idemic proportions in the United States (3,4). A key etio-logical factor linking obesity to type 2 diabetes mellitus isinsulin resistance, characterized by decreased responsein the cellular actions of insulin, leading to an impaired
ability of insulin to inhibit glucose output from the liverand to promote glucose uptake in fat and muscle (5,6). Thephysiological mechanisms connecting obesity to insulinresistance have received intense investigation in recentyears and several hypotheses have emerged, such as ec-topic lipid accumulation in liver and muscle secondary toobesity-associated increase in serum free fatty acids, al-tered production of various adipocyte-derived factors(collectively known as adipokines), and low-grade infla-mmation of white adipose tissue resulting from chronicactivation of the innate immune system (7,8).
The association between obesity and insulin resistanceis likely a cause-and-effect relationship because humanand animal studies indicate that weight loss and weightgain correlate closely with increasing and decreasing in-sulin sensitivity, respectively (9–11). However, not allobese individuals are insulin-resistant. In fact, insulinsensitivity can vary up to six-fold in this population, whichhighlights the importance of identifying genetic and envi-ronmental factors that place obese individuals at thegreatest risk for obesity-related complications (12–14). Ithas been recognized that the adipose tissue, in addition toits role as an energy storage depot, is a bona fide endo-crine organ with a key role in controlling whole-bodymetabolism (7,15). Adipose tissue actively secretes cyto-kines and hormones that regulate food intake, glucosemetabolism, and whole-body nutrient homeostasis (16).The expansion of adipose tissue in obesity is associatedwith the activation of chronic proinflammatory pathwaysand macrophage infiltration, which ultimately impairs itsfunction as an energy depot as well as an endocrine glandwith detrimental consequences for the whole body (7,17–19).However, despite increasing awareness of the role infla-med adipose tissue plays in obesity-related insulin re-sistance, there is limited understanding of the molecularsignals that differentiate insulin-resistant from insulin-sensitive obese individuals. This is because the majority ofstudies in this area have focused on comparisons of leanand obese individuals, obviating the potential causal fac-tors of body weight per se on insulin sensitivity (20,21).These studies, however, could not reveal the gene ex-pression signature responsible for the metabolically com-promised status of obese individuals independent of theirweight. A few recent studies of very small cohorts havebeen reported that point to a role for adipocyte size anddifferentiation potential, as well as to modest increases ina limited set of inflammatory genes in the development ofinsulin resistance, independent of obesity (22–27).
Because equally obese individuals can differ dramati-cally in their overall sensitivity to insulin, we performed ahighly powered transcriptome study of our previously pub-lished transcription dataset from .800 obese individuals to
From 1Discovery and Preclinical Sciences, Merck Research Laboratories, Rah-way, New Jersey; 2Diabetes and Endocrinology, Merck Research Laborato-ries, Rahway, New Jersey; 3Informatics and Analysis, Merck ResearchLaboratories, Rahway, New Jersey; the 4Division of Endocrinology and Me-tabolism, Department of Medicine, University of California, San Diego, LaJolla, California; and the 5Gastrointestinal Metabolism Laboratory, Massa-chusetts General Hospital and Harvard Medical School, Boston, Massachu-setts.
Corresponding author: Daniel M. Kemp, [email protected] 4 April 2012 and accepted 27 September 2012.DOI: 10.2337/db12-0399This article contains Supplementary Data online at http://diabetes
.diabetesjournals.org/lookup/suppl/doi:10.2337/db12-0399/-/DC1.M.Q. and Y.T. contributed equally to this study.� 2013 by the American Diabetes Association. Readers may use this article as
long as the work is properly cited, the use is educational and not for profit,and the work is not altered. See http://creativecommons.org/licenses/by-nc-nd/3.0/ for details.
diabetes.diabetesjournals.org DIABETES, VOL. 62, MARCH 2013 855
ORIGINAL ARTICLE

identify the molecular pathways associated with insulinsensitivity, independent of body mass (28). Specifically, weconducted a comprehensive transcription profiling analy-sis on subcutaneous and omental adipose tissue samplescollected from this entire cohort of obese subjects duringbariatric surgery procedures. Our results emphasize therole of the immune system and mitochondrial function inthe etiology of insulin resistance, independent of obesity.
RESEARCH DESIGN AND METHODS
Roux-en-Y gastric bypass (RYGB) profiling study. Omental and subcu-taneous adipose tissues were collected between 2000 and 2007 from patientsbefore undergoing gastric bypass surgery at Massachusetts General Hospital.Demographic data including age, race, and gender for both the entire cohortand the selected subpopulation in our analysis are shown in SupplementaryFig. 1. Additional metabolic traits are summarized in Supplementary Fig. 3,which shows the distribution of BMI, white blood cell (WBC) count, fastingglucose, HbA1c, log10(Insulin), log10(HOMA-IR), LDL, and triglyceride, as wellas a table summary of the minimum, maximum, median, and 25% and 75%percentiles for these traits. Samples were collected in RNAlater (Ambion/Applied Biosystems) stored at 280°C and shipped to Rosetta InpharmaticsGene Expression Laboratory, Seattle, Washington, for extraction, amplifi-cation, labeling, and microarray processing (28). RNA was converted tofluorescently labeled cRNA that was then hybridized to custom 44 K DNAoligonucleotide microarrays manufactured by Agilent Technologies as de-scribed previously (29). Gene expression data were analyzed using RosettaResolver gene expression analysis software (version 7.0; Rosetta Biosoftware,Seattle, WA) and MATLAB (The MathWorks, Natick, MA). The expression dataare available at GEO super series (Accession ID GSE24335). ANOVA analysisand Pearson correlation analysis were performed to select gene signaturesthat were differentially expressed between high HOMA-IR and low HOMA-IRsubgroups from nondiabetic patients with HbA1c ,7%. Monte Carlo simulationfrom a randomly permuted dataset was used to estimate and control the falsediscovery rate. In general, the omental and subcutaneous fat samples weretaken from the same individual, but a small portion of fat tissue profiles weremissing because of sample quality and array profiling quality issues. Table 1shows the overlapping samples (i.e., samples from the same individual).Peroxisome proliferator–activated receptor g drug treatment profiling
study. Microarray data from a previously published study (30) were analyzedusing the tools described. Adipose tissue biopsies were performed in normallean subjects, obese insulin-resistant nondiabetic subjects, and obese insulin-resistant type 2 diabetic subjects (n = 8, 9, and 20, respectively) before andafter 3-month treatment with either pioglitazone or rosiglitazone. RNA fromthe adipose tissue samples was profiled on Affymetrix Human Genome U133Plus 2.0 Arrays. The array contains a total of 54,675 probe sets. A total of 74arrays were available and used for the analysis. The dataset includes 38 pro-files obtained from 19 subjects before and after pioglitazone treatment, and 36profiles obtained from 18 subjects before and after rosiglitazone treatment.The log ratio of gene expression is calculated by subtracting the log intensityof baseline study from the log intensity of the compound treatment.National Health and Nutrition Examination Survey data analysis. Na-tional Health and Nutrition Examination Survey III Survey data were down-loaded from the Centers for Disease Control and Prevention website http://www.cdc.gov/nchs/nhanes.htm. This survey includes .31,311 subjects andwas conducted from 1988 to 1994. BMI data for subjects older than 20 yearswere extracted and plotted along with BMI data obtained from the obesesubjects in the RYGB profiling study. HOMA-IR was calculated as fastingplasma glucose multiplied by fasting plasma insulin, with the units [(mg/dL)3(mU/mL)]/405, according to the protocol described previously (31).Pathway enrichment analysis. Enrichment of GO Biological Process terms inthe annotation of sets of probes was tested using Gene Set Annotator in theMerck Target and Gene Information (TGI) System, which provides pathwayenrichment analysis to finds gene sets in which a user-supplied set of identifiers
is significantly enriched. The P value was calculated using the hypergeometricdistribution, and the E value was calculated using the Bonferroni adjusted Pvalue. Top 20 significantly enriched pathways with E value ,0.005 were listedfor the selected omental tissue signature genes; for the side-by-side compari-son purpose, top 20 pathways ranked by E value also were listed for the se-lected subcutaneous tissue signature genes. Gene overlap was based onhuman database identification numbers. The allowed maximum and minimumgene set sizes for the pathway terms were 500 and 5, respectively.Method and statistical algorithm used to select significantly
differentially expressed genes in low and HOMA-IR analysis. Within non-diabetic patients and patients not using medicine, we selected subjects withHbA1c #7. The following steps were taken. For step 1, subjects were rankedby HOMA-IR trait, then ANOVA was conducted (parametric) and Kruskal-Wallis (nonparametric) analyses were performed to select genes that weredifferentially expressed between the top 10% and bottom 10% of patientgroups. Then, we identified the intersect genes that have P#0.01 in bothANOVA and Kruskal-Wallis analyses. For step 2, we repeated step 1 for the top15% and bottom 15% of patient groups. For step 3, we repeated step 1 for thetop 20% and bottom 20% of patient groups. For step 4, we performed a union ofthe selected genes from steps 1–3. For step 5, we conducted Pearson (para-metric) and Spearman (nonparametric) correlation analyses between the logratio data of gene expression and log10 (HOMA-IR) trait, and selected genesthat have correlation P#0.01 in both Pearson and Spearman analyses. For step6, we intersected selected genes between steps 4 and 5. The resulting differ-entially expressed genes for HOMA-IR trait in omental and subcutaneous tis-sues were 968 and 546, respectively. For step 7, we conducted Monte Carlosimulation, randomly permuted HOMA-IR trait, and then repeated steps 1–6 todetermine the number of selected false-positive genes using the same statisti-cal approaches. Finally, for step 8, we repeated step 7 250 times using themedian of the number of selected false-positive genes to calculate the falsediscovery rate.
The numbers of false-positive genes selected by the described Monte Carloprocess from the omental and subcutaneous tissue profiles were 94 and 68,respectively; therefore, the false discovery rates for these high and low HOMA-IR gene selections were 9.7% and 12.5% for the omental and subcutaneoustissues, respectively.
We used the Rosetta custom Agilent 44 K array. The array contains multipleprobes for some genes. In the gene selection step, we treated each probe in-dependently and did not intend to combine different probes for the same genebecause we believed that different probe design for the same gene constitutesa systemic, instead of random, bias in detecting the gene expression level. Onlyin the pathway analysis step did we combinemultiple probes for the same genesand we counted the gene only once in the enrichment test.Algorithm of unsupervised clustering. We used the hierarchical agglom-erative clustering for the algorithm of unsupervised clustering figure. The basicalgorithm was performed as follows: 1) we computed the distance matrix ofthe genes by using log10 ratio data, and we computed the similarity function of1 2 cosine correlation; 2) we amalgamated the data in the distance matrix byfusing a gene or groups of genes that were most similar, and the average linkwas used to calculate the distance from a cluster to all remaining unclusteredpoints; and 3) we computed the dendrogram (returning a tree structure). Thetree is a top-down collection of tree nodes such that the root node has a dis-tance of 0.0. We believe that this unsupervised clustering algorithm is ideal tobuild a cluster hierarchy among the hidden data structure, and thus reveal thepatterns of coexpression among selected signature genes.
RESULTS
A total of 835 omental and 697 subcutaneous fat sampleswere profiled using whole-genome microarrays to deter-mine gene transcription levels in samples from obese in-dividuals undergoing bariatric surgery. To test hypothesesregarding insulin sensitivity in this obese cohort, we ex-cluded those patients with type 2 diabetes mellitus, asdefined by their physician’s diagnosis, those with plasmaHbA1c levels .7.0, or those who were using diabetes me-dication. We also excluded patients using long-term med-ications such as statins to minimize pharmacologicaleffects on gene expression. As a result of this filteringprocess, the final sample set consisted of 387 omental and323 subcutaneous fat expression profiles (Table 1). Thedistribution of the BMI of the studied cohort comparedwith the BMI of National Health and Nutrition Examina-tion Survey III survey is shown in Fig. 1A. In general,
TABLE 1Patient pool samples used in this study
Total patientsamples Nondiabetic
Nondiabetic andno medicine
Omental 835 463 387Subcutaneous 697 379 323
INFLAMMATION CORRELATED WITH IR INDEPENDENT OF BMI
856 DIABETES, VOL. 62, MARCH 2013 diabetes.diabetesjournals.org

a wide distribution of HOMA-IR and HbA1c was observedacross the entire cohort, as shown in Fig. 1B, and partic-ularly within the nondiabetic subgroup not using medica-tion there was a broad range of HOMA-IR, highlighting theexistence of both extremely insulin-sensitive and insulin-resistant obese individuals. Therefore, we aimed to deter-mine whether gene expression patterns could be identifiedthat correlate with the profound variability in insulin sen-sitivity in obese individuals, independent of BMI.
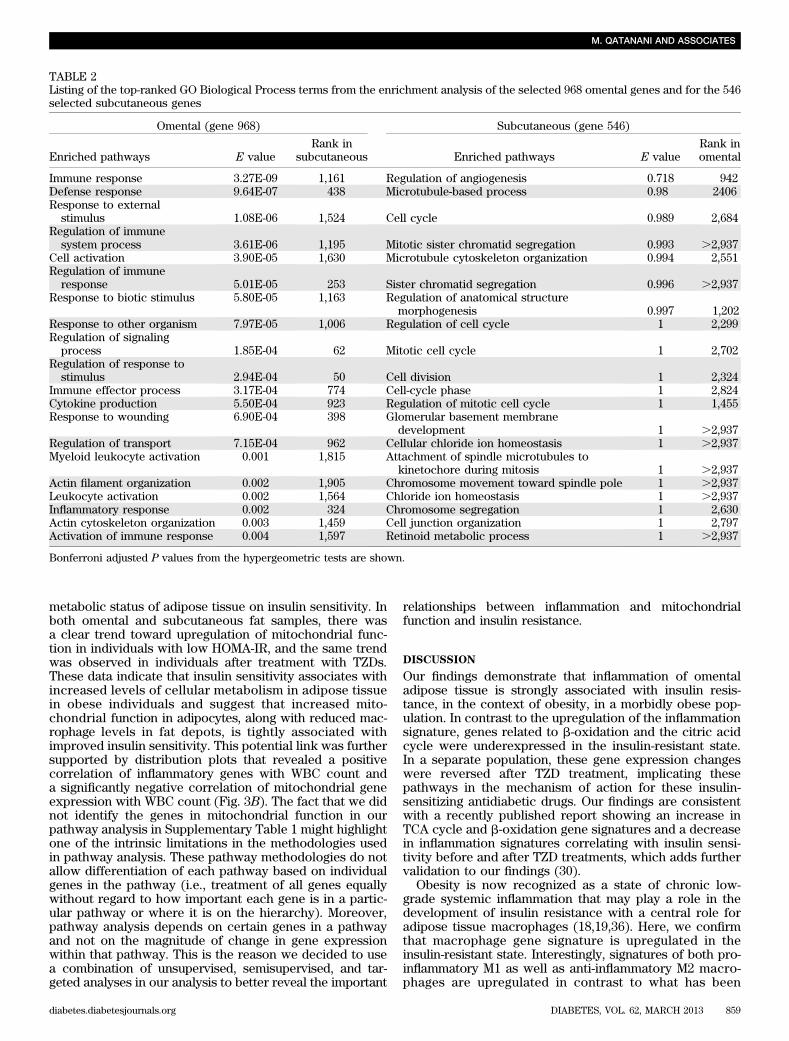
We conducted correlation analyses in the nondiabeticnonmedicated subgroup to identify genes displaying sig-nificant association with HOMA-IR. In addition, we con-ducted ANOVA analyses in which we selected the top andbottom 15 percentiles based on HOMA-IR and directlycompared these two groups for differentiated expressionpatterns (Fig. 1C, D). It is worth noting that the HOMA-IRof the bottom 15 percentile in our obese insulin-sensitivesubpopulation is similar to the HOMA-IR in a lean nondia-betic general population cohort (HOMA-IR, 2.8; interquartilerange, 1.55) (32). The heat maps revealed hierarchicalclustering and significant differentiation in gene expres-sion across the HOMA-IR spectrum in both subcutaneoustissue and omental tissue, implicating both adipose depotsas key phenotypic effectors of insulin sensitivity in obeseindividuals. Next, we conducted pathway enrichment an-alyses comprising the subgroup significantly associatedwith insulin sensitivity in omental (968 genes) and sub-cutaneous (546 genes) tissue samples. Description of thesegenes is presented in Supplementary Table 1. The rankorder of pathways that were most significantly repre-sented by the differential gene expression data are listedin Table 2. In omental tissue, inflammatory and immune-related pathway annotations were highly enriched in thegene set that showed significant regulation between ex-tremes of insulin sensitivity. In contrast, in subcutaneousfat, we did not identify any significant pathway enrichmentbased on the 546 differentially expressed genes. Correla-tion analysis of HOMA-IR and the demographic traits,including age, race, and gender, showed no significantcorrelation (Supplementary Fig. 2). We realize that thelack of correlation between these factors and HOMA-IRdoes not preclude a correlation in expression of someHOMA-IR correlated transcripts. Hence, to strengthen ouranalysis, our gene expression data have been normalizedby multiple steps, including the gender, age, and ethnicgroups as described (28).
Progression from the unsupervised analysis to a semi-supervised approach enabled better resolution of the roleof inflammatory and immune pathway regulation in adi-pose tissue with respect to whole-body insulin sensitivity.A set of 191 unique genes (270 probes) that have beenassociated with immune function were obtained from In-genuity (Ingenuity Systems, www.ingenuity.com) and wereexamined by comparing relative gene expression levels inomental or subcutaneous fat between those individualswith high HOMA-IR and those with low HOMA-IR. Inquerying this integrated gene set, it was clear that theimmune response pathway was downregulated in bothfat depots of insulin-sensitive compared with insulin-resistant obese individuals, but that the signal was signif-icantly more associated with insulin sensitivity in theomental versus subcutaneous fat (Fig. 2A). To better-qualifythis observation, we leveraged a second gene expressiondata set from a separate cohort that provided relative genetranscription levels in subcutaneous fat from individualswho had undergone thiazoladinedione (TZD) treatment
for 3 months (30). TZDs are a class of insulin-sensitizerdrug that have been shown to robustly improve HOMA-IRin humans (33). As expected, the immune response sig-nature showed an overall reduction in expression level,consistent with the inverse response observed in the in-sulin resistant state. When broken-down to individual genes,the immune response gene set showed a highly significantinverse correlation between the two cohorts, consistentwith the directionality of HOMA-IR response in theseseparate studies (parametric Pearson correlation; corre-lation degree, 20.60071; P = 6.4e-20) (Fig. 2B). This degreeof negative correlation at the level of individual genes in-dicated that immune response was oppositely regulatedbetween insulin-resistant patients with high HOMA-IRlevel and subjects with improved insulin sensitivity afterTZD treatment, further validating the observation that themajority of known immune genes were highly associatedwith the level of insulin resistance.
Elevated WBC count is a marker of inflammation andhas been reported to associate with insulin resistance anddevelopment of type 2 diabetes mellitus (34). We assessedwhether specific adipose depots expressed an associationbetween WBC levels and expression of genes known to beinvolved in immune response. Shown in Fig. 2C are nor-malized distribution charts for the correlation coefficientsbetween expression of the known immune genes and WBCcount. In omental tissue, 225 out of 270 probes for theknown immune genes had a positive correlation with theWBC count, whereas 45 out of 270 probes had a negativecorrelation. The P value for this uneven distribution fromthe sign test was 1e227, indicating that the majority of theknown immune genes were associated with the high WBCin obese individuals with elevated HOMA-IR. In subcu-taneous tissue, 185 out of 270 probes had a positive cor-relation with the WBC and 85 out of 270 probes hada negative correlation, and the degree of unevenness wassignificant with P = 1e29. In conclusion, the majority of theknown immune genes in both omental and subcutaneoustissues were overexpressed and positively associated withWBC count, although the degree of association betweengene expression and WBC counts was much stronger inomental tissue than in subcutaneous tissue. However, weobserved little correlation between WBC and HOMA-IRtraits among the entire cohort in this dataset (Supple-mentary Fig. 4). This highlights the complex relationshipsamong WBC counts, HOMA-IR, and immune genes, andsupports the possibility that the changes in gene expres-sion are not a reflection of changes in cell number but aremore likely a reflection of changes in gene expressionwithin each cell.
Finally, we defined small gene sets that relate to specificcell functions or cell phenotypes involved in the adiposeinflammation response triggered by obesity (35). Thesesubcellular signatures then were examined for associationwith insulin sensitivity. Notably, signatures related to mac-rophage cells were clearly upregulated as a function ofhigh HOMA-IR, whereas there was no clear trend observedin mast cell signatures in the omental or subcutaneousadipose depots, but T-cell signatures were upregulatedmainly in the omental depot (Fig. 3A). Concordantly, themacrophage signatures trended in the opposite directionin subcutaneous adipose tissue from subjects treated withTZDs, consistent with improved insulin sensitivity andlower HOMA-IR. Gene sets related to mitochondrial func-tions of b-oxidation and the tricarboxylic acid (TCA) cyclewere of specific interest with respect to implications of
M. QATANANI AND ASSOCIATES
diabetes.diabetesjournals.org DIABETES, VOL. 62, MARCH 2013 857

FIG. 1. A: The BMI distribution curve (magenta) for patients who were involved in the RYGB profiling experiments, and the BMI distribution curve(gray) for the general population in National Health and Nutrition Examination Survey (NHANES) III survey. B: A dot plot comparing HOMA-IRtrait vs. HbA1c trait for the patients who were involved in our profiling studies (nondiabetic, did not use any medicine, and had HbA1c <7%; gray).The red dots represent patients who had higher HOMA-IR level (top 15%), the blue dots represent patients who had lower HOMA-IR level (bottom15%) among the patients included in the profiling analysis. C: A heat map showing the one-dimensional histogram of the 968 selected omentalgenes that differentiate between high and low HOMA-IR levels in the unsupervised analysis. Magenta in the heat map indicates upregulation andcyan indicates downregulation for the individual patient sample compared with the pool of all patient samples. D: A heat map showing theone-dimensional histogram of the 546 selected subcutaneous genes that differentiate between high and low HOMA-IR levels in the unsupervisedanalysis. The methodology used for calculating the algorithms for unsupervised clustering can be found in the Supplementary Materials. (A high-quality digital representation of this figure is available in the online issue.)
INFLAMMATION CORRELATED WITH IR INDEPENDENT OF BMI
858 DIABETES, VOL. 62, MARCH 2013 diabetes.diabetesjournals.org
metabolic status of adipose tissue on insulin sensitivity. Inboth omental and subcutaneous fat samples, there wasa clear trend toward upregulation of mitochondrial func-tion in individuals with low HOMA-IR, and the same trendwas observed in individuals after treatment with TZDs.These data indicate that insulin sensitivity associates withincreased levels of cellular metabolism in adipose tissuein obese individuals and suggest that increased mito-chondrial function in adipocytes, along with reduced mac-rophage levels in fat depots, is tightly associated withimproved insulin sensitivity. This potential link was furthersupported by distribution plots that revealed a positivecorrelation of inflammatory genes with WBC count anda significantly negative correlation of mitochondrial geneexpression with WBC count (Fig. 3B). The fact that we didnot identify the genes in mitochondrial function in ourpathway analysis in Supplementary Table 1 might highlightone of the intrinsic limitations in the methodologies usedin pathway analysis. These pathway methodologies do notallow differentiation of each pathway based on individualgenes in the pathway (i.e., treatment of all genes equallywithout regard to how important each gene is in a partic-ular pathway or where it is on the hierarchy). Moreover,pathway analysis depends on certain genes in a pathwayand not on the magnitude of change in gene expressionwithin that pathway. This is the reason we decided to usea combination of unsupervised, semisupervised, and tar-geted analyses in our analysis to better reveal the important
relationships between inflammation and mitochondrialfunction and insulin resistance.
DISCUSSION
Our findings demonstrate that inflammation of omentaladipose tissue is strongly associated with insulin resis-tance, in the context of obesity, in a morbidly obese pop-ulation. In contrast to the upregulation of the inflammationsignature, genes related to b-oxidation and the citric acidcycle were underexpressed in the insulin-resistant state.In a separate population, these gene expression changeswere reversed after TZD treatment, implicating thesepathways in the mechanism of action for these insulin-sensitizing antidiabetic drugs. Our findings are consistentwith a recently published report showing an increase inTCA cycle and b-oxidation gene signatures and a decreasein inflammation signatures correlating with insulin sensi-tivity before and after TZD treatments, which adds furthervalidation to our findings (30).
Obesity is now recognized as a state of chronic low-grade systemic inflammation that may play a role in thedevelopment of insulin resistance with a central role foradipose tissue macrophages (18,19,36). Here, we confirmthat macrophage gene signature is upregulated in theinsulin-resistant state. Interestingly, signatures of both pro-inflammatory M1 as well as anti-inflammatory M2 macro-phages are upregulated in contrast to what has been
TABLE 2Listing of the top-ranked GO Biological Process terms from the enrichment analysis of the selected 968 omental genes and for the 546selected subcutaneous genes
Omental (gene 968) Subcutaneous (gene 546)
Enriched pathways E valueRank in
subcutaneous Enriched pathways E valueRank inomental
Immune response 3.27E-09 1,161 Regulation of angiogenesis 0.718 942Defense response 9.64E-07 438 Microtubule-based process 0.98 2406Response to externalstimulus 1.08E-06 1,524 Cell cycle 0.989 2,684
Regulation of immunesystem process 3.61E-06 1,195 Mitotic sister chromatid segregation 0.993 .2,937
Cell activation 3.90E-05 1,630 Microtubule cytoskeleton organization 0.994 2,551Regulation of immuneresponse 5.01E-05 253 Sister chromatid segregation 0.996 .2,937
Response to biotic stimulus 5.80E-05 1,163 Regulation of anatomical structuremorphogenesis 0.997 1,202
Response to other organism 7.97E-05 1,006 Regulation of cell cycle 1 2,299Regulation of signalingprocess 1.85E-04 62 Mitotic cell cycle 1 2,702
Regulation of response tostimulus 2.94E-04 50 Cell division 1 2,324
Immune effector process 3.17E-04 774 Cell-cycle phase 1 2,824Cytokine production 5.50E-04 923 Regulation of mitotic cell cycle 1 1,455Response to wounding 6.90E-04 398 Glomerular basement membrane
development 1 .2,937Regulation of transport 7.15E-04 962 Cellular chloride ion homeostasis 1 .2,937Myeloid leukocyte activation 0.001 1,815 Attachment of spindle microtubules to
kinetochore during mitosis 1 .2,937Actin filament organization 0.002 1,905 Chromosome movement toward spindle pole 1 .2,937Leukocyte activation 0.002 1,564 Chloride ion homeostasis 1 .2,937Inflammatory response 0.002 324 Chromosome segregation 1 2,630Actin cytoskeleton organization 0.003 1,459 Cell junction organization 1 2,797Activation of immune response 0.004 1,597 Retinoid metabolic process 1 .2,937
Bonferroni adjusted P values from the hypergeometric tests are shown.
M. QATANANI AND ASSOCIATES
diabetes.diabetesjournals.org DIABETES, VOL. 62, MARCH 2013 859

FIG. 2. A: Heat map showing the expression of the known immune function genes in the omental and subcutaneous tissues of patients with high vs.low HOMA-IR levels in the RYGB profiling experiments and in the subcutaneous tissues of a different cohort of diabetic and nondiabetic subjectswho received pioglitazone and rosiglitazone treatments in the peroxisome proliferator–activated receptor g (PPARg) profiling experiment. Thedata shown are the average of log10 of the ratio of gene expression between the high HOMA-IR patient group and the low HOMA-IR patient groupfor RYGB cohort, and the average of log10 of the ratio of gene expression for patients receiving PPARg treatments and without PPARg treatmentfor the PPARg study cohort. B: Dot plot analysis showing the comparison of correlation coefficients between gene expression and HOMA-IR levelin the RYGB profiling experiments vs. the correlation coefficients between gene expression and HOMA-IR level in the PPARg profiling experimentfor the known immune function genes. The magenta line is the least-squares fitted line for the comparison dot plot. C: Bar charts showing theevenness of the distribution of correlation coefficients for the expression of immune genes and WBCs in omental tissue (left, green) and insubcutaneous tissue (right, blue). The number of genes in each bin in the raw histogram is divided by the total number of genes in all bins to givethe normalized histogram. The red curves are the distribution of correlation coefficients for all 44 K array genes with WBCs. (A high-quality digitalrepresentation of this figure is available in the online issue.)
INFLAMMATION CORRELATED WITH IR INDEPENDENT OF BMI
860 DIABETES, VOL. 62, MARCH 2013 diabetes.diabetesjournals.org

observed in animal studies (37). Moreover, gene signa-tures of T cells were upregulated with no difference inmast cell signature (38,39). It is not clear whether thedifference in the inflammatory signature profile is attrib-utable to changes in gene expression or attributable to adifference in immune cell recruitment to the adipose tis-sue, which will be the subject of a future study. Moreover,the divergence in the gene signature changes betweenpioglitazone and rosiglitazone, particularly in the genesrepresenting the TCA cycle, is worth noting. This cannotbe explained completely by the fact that that pioglitazoneis a weaker peroxisome proliferator–activated receptor
g agonist, given that this phenomenon is not obvious inthe other gene signatures (40). Deeper analysis of thesedifferences might help us understand the triggers for theadverse events associated with the different TZD treat-ments.
It is difficult to determine a causal relationship betweenadipose tissue inflammation and insulin resistance fromthe current study. However, it is known that higher totalleukocyte counts precede and predict the incident risk oftype 2 diabetes mellitus (34). More recently, studies haveshown that insulin resistance in mice with differentialsusceptibility to diabetes is preceded by differences in the
FIG. 3. A: Heat map showing the expression of the literature-curated inflammation and mitochondrial function genes in the RYGB and peroxisomeproliferator–activated receptor g (PPARg) profiling experiments. As in Fig. 2, the data shown are the average of log10 of the ratio of gene ex-pression between the high HOMA-IR patient group and the low HOMA-IR patient group for RYGB cohort, and the average of log10 of the ratio ofgene expression for patients receiving PPARg treatments and those without PPARg treatment for the PPARg study cohort. B: Bar charts showingthe evenness of the distribution of correlation coefficients for the relationships between expression of inflammation genes (left) and WBC count,and for the relationships between expression of mitochondrial function genes (right) and WBC count. The number of genes in each bin in the rawhistogram is divided by the total number of genes in all bins to give the normalized histogram. The red curves are the distribution of correlationcoefficients for the relationships between expression of all 44 K array genes and WBC count. (A high-quality digital representation of this figure isavailable in the online issue.)
M. QATANANI AND ASSOCIATES
diabetes.diabetesjournals.org DIABETES, VOL. 62, MARCH 2013 861

inflammatory response of adipose tissue, emphasizing thenotion that inflammation of adipose tissue might playa role in the etiology of insulin resistance independent ofbody weight (41). This suggests that targeting inflamma-tory pathways might prevent the development of insulinresistance and diabetes. A recent study shows that patientsusing anti-inflammatory drugs against rheumatoid arthritisor psoriasis had a significantly lower risk of developmentof diabetes (42). Rodent models also have shown that diet-induced insulin resistance is blunted when adipose tissueinflammation is blocked (36,43). Our data implicate astronger role for visceral fat inflammation versus sub-cutaneous fat inflammation in the etiology of insulin re-sistance, which is consistent with studies that show thatthese adipose tissue depots have unique inflammatorypatterns, and which supports the notion that the omentaldepot is a stronger contributor to insulin resistance (44).Finally, several studies have suggested that depot-specificadipocyte size may be linked to inflammation and can bea major factor driving insulin resistance (22,25,45,46). In-creased adipocyte size of omental adipose tissue was as-sociated with insulin resistance and, among moderatelyobese individuals, an increased proportion of small adi-pose cells is associated with inflammation in subcutaneousadipose tissue, which may reflect impaired adipogenesisor terminal differentiation (22,25). The latter notion waselegantly demonstrated in a recent article that showsthat genetic predisposition for type 2 diabetes mellitus,but not obesity, is associated with an impaired ability torecruit new adipose cells to store excess lipids in thesubcutaneous adipose tissue, thereby promoting ectopiclipid deposition (47). Studying the relationship among in-sulin resistance, inflammation, and adipocyte size in theobese subjects in our study will help highlight the inter-play among these factors and will be the topic of futurestudies.
The results of our study highlight a different subpopu-lation of obese individuals who display an inflammatorysignature in their omental adipose tissue, which mightcontribute to their state of insulin resistance. It is possiblethat individuals with higher basal inflammatory signature,before becoming obese, are more at risk for develop-ment of insulin resistance, diabetes, and other metabolicdiseases. Understanding the mechanisms and pathwaysthat lead to these differences will equip us with impor-tant targets to help stem the tide of such a debilitatingdisease.
ACKNOWLEDGMENTS
M.Q., Y.T., R.D., D.M.G., G.H., W.Z., and D.M.K. are as-sociated with Merck Research Laboratories. No otherpotential conflicts of interest relevant to this article werereported.
M.Q., Y.T., R.D., D.M.G., W.Z., and D.D.S. researchedthe data. M.Q., Y.T., and D.M.K. wrote the manuscript. G.H.,J.M.O., and L.M.K. reviewed and edited the manuscriptand contributed to the discussion. D.M.K. is the guarantorof this work, had full access to all the data, and takesfull responsibility for the integrity of data and the accuracyof data analysis.
REFERENCES
1. Li Z, Bowerman S, Heber D. Health ramifications of the obesity epidemic.Surg Clin North Am 2005;85:681–701
2. Olshansky SJ. Projecting the future of U.S. health and longevity. Health Aff(Millwood) 2005;24(Suppl 2):W5R86–89
3. American Diabetes Association. Diabetes statistics. 2011. Available fromhttp://www.diabetes.org/diabetes-statistics/prevalence.jsp. Accessed 21 August2011
4. Zimmet P, Alberti KG, Shaw J. Global and societal implications of the di-abetes epidemic. Nature 2001;414:782–787
5. Flier JS. Obesity wars: molecular progress confronts an expanding epi-demic. Cell 2004;116:337–350
6. Kahn BB, Flier JS. Obesity and insulin resistance. J Clin Invest 2000;106:473–481
7. Qatanani M, Lazar MA. Mechanisms of obesity-associated insulin resis-tance: many choices on the menu. Genes Dev 2007;21:1443–1455
8. Goldfine AB, Fonseca V, Shoelson SE. Therapeutic approaches to targetinflammation in type 2 diabetes. Clin Chem 2011;57:162–167
9. Sims EA, Danforth E Jr, Horton ES, Bray GA, Glennon JA, Salans LB.Endocrine and metabolic effects of experimental obesity in man. RecentProg Horm Res 1973;29:457–496
10. Freidenberg GR, Reichart D, Olefsky JM, Henry RR. Reversibility of de-fective adipocyte insulin receptor kinase activity in non-insulin-dependentdiabetes mellitus. Effect of weight loss. J Clin Invest 1988;82:1398–1406
11. Bak JF, Møller N, Schmitz O, Saaek A, Pedersen O. In vivo insulin actionand muscle glycogen synthase activity in type 2 (non-insulin-dependent)diabetes mellitus: effects of diet treatment. Diabetologia 1992;35:777–784
12. McLaughlin T, Abbasi F, Lamendola C, Reaven G. Heterogeneity in theprevalence of risk factors for cardiovascular disease and type 2 diabetesmellitus in obese individuals: effect of differences in insulin sensitivity.Arch Intern Med 2007;167:642–648
13. Reaven G. All obese individuals are not created equal: insulin resistance isthe major determinant of cardiovascular disease in overweight/obese in-dividuals. Diab Vasc Dis Res 2005;2:105–112
14. Sims EA. Are there persons who are obese, but metabolically healthy?Metabolism 2001;50:1499–1504
15. Hotamisligil GS. Inflammation and metabolic disorders. Nature 2006;444:860–867
16. Rosen ED, Spiegelman BM. Adipocytes as regulators of energy balanceand glucose homeostasis. Nature 2006;444:847–853
17. Shoelson SE, Herrero L, Naaz A. Obesity, inflammation, and insulin re-sistance. Gastroenterology 2007;132:2169–2180
18. Weisberg SP, McCann D, Desai M, Rosenbaum M, Leibel RL, Ferrante AWJr. Obesity is associated with macrophage accumulation in adipose tissue.J Clin Invest 2003;112:1796–1808
19. Xu H, Barnes GT, Yang Q, et al. Chronic inflammation in fat plays a crucialrole in the development of obesity-related insulin resistance. J Clin Invest2003;112:1821–1830
20. Dahlman I, Kaaman M, Olsson T, et al. A unique role of monocyte che-moattractant protein 1 among chemokines in adipose tissue of obesesubjects. J Clin Endocrinol Metab 2005;90:5834–5840
21. Dolinková M, Dostálová I, Lacinová Z, et al. The endocrine profile ofsubcutaneous and visceral adipose tissue of obese patients. Mol Cell En-docrinol 2008;291:63–70
22. McLaughlin T, Sherman A, Tsao P, et al. Enhanced proportion of smalladipose cells in insulin-resistant vs insulin-sensitive obese individuals im-plicates impaired adipogenesis. Diabetologia 2007;50:1707–1715
23. McLaughlin T, Deng A, Gonzales O, et al. Insulin resistance is associatedwith a modest increase in inflammation in subcutaneous adipose tissue ofmoderately obese women. Diabetologia 2008;51:2303–2308
24. Liu A, McLaughlin T, Liu T, et al. Differential intra-abdominal adiposetissue profiling in obese, insulin-resistant women. Obes Surg 2009;19:1564–1573
25. Hardy OT, Perugini RA, Nicoloro SM, et al. Body mass index-independentinflammation in omental adipose tissue associated with insulin resistancein morbid obesity. Surg Obes Relat Dis 2011;7:60–67
26. Elbein SC, Kern PA, Rasouli N, Yao-Borengasser A, Sharma NK, Das SK.Global gene expression profiles of subcutaneous adipose and musclefrom glucose-tolerant, insulin-sensitive, and insulin-resistant individualsmatched for BMI. Diabetes 2011;60:1019–1029
27. Rasouli N, Kern PA, Elbein SC, Sharma NK, Das SK. Improved insulinsensitivity after treatment with PPARg and PPARa ligands is mediatedby genetically modulated transcripts. Pharmacogenet Genomics 2012;22:484–497
28. Greenawalt DM, Dobrin R, Chudin E, et al. A survey of the genetics ofstomach, liver, and adipose gene expression from a morbidly obese co-hort. Genome Res 2011;21:1008–1016
29. Hughes TR, Mao M, Jones AR, et al. Expression profiling using microarraysfabricated by an ink-jet oligonucleotide synthesizer. Nat Biotechnol 2001;19:342–347
INFLAMMATION CORRELATED WITH IR INDEPENDENT OF BMI
862 DIABETES, VOL. 62, MARCH 2013 diabetes.diabetesjournals.org

30. Sears DD, Hsiao G, Hsiao A, et al. Mechanisms of human insulin resistanceand thiazolidinedione-mediated insulin sensitization. Proc Natl Acad SciUSA 2009;106:18745–18750
31. Matthews DR, Hosker JP, Rudenski AS, Naylor BA, Treacher DF, TurnerRC. Homeostasis model assessment: insulin resistance and beta-cellfunction from fasting plasma glucose and insulin concentrations in man.Diabetologia 1985;28:412–419
32. Alssema M, Dekker JM, Nijpels G, Stehouwer CD, Bouter LM, Heine RJ;Hoorn Study. Proinsulin concentration is an independent predictor of all-cause and cardiovascular mortality: an 11-year follow-up of the HoornStudy. Diabetes Care 2005;28:860–865
33. Bhatia V, Viswanathan P. Insulin resistance and PPAR insulin sensitizers.Curr Opin Investig Drugs 2006;7:891–897
34. Vozarova B, Weyer C, Lindsay RS, Pratley RE, Bogardus C, Tataranni PA.High white blood cell count is associated with a worsening of insulinsensitivity and predicts the development of type 2 diabetes. Diabetes 2002;51:455–461
35. Anderson EK, Gutierrez DA, Hasty AH. Adipose tissue recruitment ofleukocytes. Curr Opin Lipidol 2010;21:172–177
36. Gregor MF, Hotamisligil GS. Inflammatory mechanisms in obesity. AnnuRev Immunol 2011;29:415–445
37. Lumeng CN, Bodzin JL, Saltiel AR. Obesity induces a phenotypicswitch in adipose tissue macrophage polarization. J Clin Invest 2007;117:175–184
38. Liu J, Divoux A, Sun J, et al. Genetic deficiency and pharmacologicalstabilization of mast cells reduce diet-induced obesity and diabetes inmice. Nat Med 2009;15:940–945
39. Feuerer M, Herrero L, Cipolletta D, et al. Lean, but not obese, fat is en-riched for a unique population of regulatory T cells that affect metabolicparameters. Nat Med 2009;15:930–939
40. Colca JR, McDonald WG, Waldon DJ, et al. Identification of a novel mitochon-drial protein (“mitoNEET”) cross-linked specifically by a thiazolidinedionephotoprobe. Am J Physiol Endocrinol Metab 2004;286:E252–E260
41. Mori MA, Liu M, Bezy O, et al. A systems biology approach identifies in-flammatory abnormalities between mouse strains prior to development ofmetabolic disease. Diabetes 2010;59:2960–2971
42. Solomon DH, Massarotti E, Garg R, Liu J, Canning C, Schneeweiss S. As-sociation between disease-modifying antirheumatic drugs and diabetesrisk in patients with rheumatoid arthritis and psoriasis. JAMA 2011;305:2525–2531
43. Fleischman A, Shoelson SE, Bernier R, Goldfine AB. Salsalate improvesglycemia and inflammatory parameters in obese young adults. DiabetesCare 2008;31:289–294
44. Alvehus M, Burén J, Sjöström M, Goedecke J, Olsson T. The human vis-ceral fat depot has a unique inflammatory profile. Obesity (Silver Spring)2010;18:879–883
45. Arner P, Bernard S, Salehpour M, et al. Dynamics of human adipose lipidturnover in health and metabolic disease. Nature 2011;478:110–113
46. Hoffstedt J, Arner E, Wahrenberg H, et al. Regional impact of adiposetissue morphology on the metabolic profile in morbid obesity. Diabetologia2010;53:2496–2503
47. Arner P, Arner E, Hammarstedt A, Smith U. Genetic predisposition for type2 diabetes, but not for overweight/obesity, is associated with a restrictedadipogenesis. PLoS One 2011;6:e18284
M. QATANANI AND ASSOCIATES
diabetes.diabetesjournals.org DIABETES, VOL. 62, MARCH 2013 863