Embed Size (px)
Citation preview

HAL Id: hal-00512949https://hal.archives-ouvertes.fr/hal-00512949
Submitted on 1 Sep 2010
HAL is a multi-disciplinary open accessarchive for the deposit and dissemination of sci-entific research documents, whether they are pub-lished or not. The documents may come fromteaching and research institutions in France orabroad, or from public or private research centers.
L’archive ouverte pluridisciplinaire HAL, estdestinée au dépôt et à la diffusion de documentsscientifiques de niveau recherche, publiés ou non,émanant des établissements d’enseignement et derecherche français ou étrangers, des laboratoirespublics ou privés.
INVENTORY MANAGEMENT PRACTICES ANDTHEIR IMPACT ON PERCEIVED PLANNING
PERFORMANCEPatrik Jonsson, Stig-Arne Mattsson
To cite this version:Patrik Jonsson, Stig-Arne Mattsson. INVENTORY MANAGEMENT PRACTICES AND THEIRIMPACT ON PERCEIVED PLANNING PERFORMANCE. International Journal of Production Re-search, Taylor & Francis, 2008, 46 (07), pp.1787-1812. �10.1080/00207540600988071�. �hal-00512949�

For Peer Review O
nly
INVENTORY MANAGEMENT PRACTICES AND THEIR IMPACT
ON PERCEIVED PLANNING PERFORMANCE
Journal: International Journal of Production Research
Manuscript ID: TPRS-2006-IJPR-0059.R1
Manuscript Type: Original Manuscript
Date Submitted by the Author:
14-May-2006
Complete List of Authors: Jonsson, Patrik; Chalmers University of Technology, Division of logistics and transportation Mattsson, Stig-Arne; Lund University, Department of industrial management and logistics
Keywords: MRP, INVENTORY CONTROL, MATERIALS MANAGEMENT, PERFORMANCE ANALYSIS
Keywords (user):
http://mc.manuscriptcentral.com/tprs Email: [email protected]
International Journal of Production Research

For Peer Review O
nly
Inventory management practices and their implications on
perceived planning performance
Patrik Jonsson* Stig-Arne Mattsson
Division of Logistics and Transportation Department of Industrial Management and
Logistics
Chalmers University of Technology Lund University
412 82 Gothenburg, Sweden Box 118, 221 00 Lund, Sweden
E-mail: [email protected] E-mail: [email protected]
Ph: +46317721336
Fax: +46317721337
*Corresponding author
Page 1 of 50
http://mc.manuscriptcentral.com/tprs Email: [email protected]
International Journal of Production Research
123456789101112131415161718192021222324252627282930313233343536373839404142434445464748495051525354555657585960
For Peer Review O
nly
Inventory management practices and their implications on
perceived planning performance
ABSTRACT
This paper focuses on the use of material planning methods to control material flow to
inventories of purchased items. The first sub-objective is to evaluate the perceived planning
performance of material planning methods used to control material flows in different
inventory types in manufacturing and distribution companies. The second sub-objective is
to evaluate the difference in perceived planning performance depending on the way
planning parameters are determined and the methods used. Five material planning methods
are studied: the re-order point method, the fixed order interval method, run-out time
planning, kanban and MRP. Analysis is based on survey data from 153 manufacturing and
53 distribution companies. Findings conclude that the use of material planning methods
differs depending on where along the material flow they are applied, whether the inventory
is located in a manufacturing or in distribution operations and between companies of
various sizes. The modes of applying a material planning method affect its perceived
performance. In particular, the way of determining and the review frequency of safety
stocks and lead times have great importance for the planning performance of MRP
methods, while the determination and review of order points, review frequencies and run-
out times were important for re-order point methods.
Page 2 of 50
http://mc.manuscriptcentral.com/tprs Email: [email protected]
International Journal of Production Research
123456789101112131415161718192021222324252627282930313233343536373839404142434445464748495051525354555657585960
For Peer Review O
nly
1
Keywords: inventory management, planning environment, planning parameters, materials
requirements planning, re-order point, performance
1. INTRODUCTION
This study deals with inventory management practices at the tactical planning level, also
known as material planning. It concerns balancing supply and demand – i.e. the initiation,
control and monitoring of manufacturing and purchasing orders in order to maintain an
uninterrupted material flow and value-adding activity in manufacturing and warehouses.
There are a number of material planning methods, which control material flows in different
ways, for example the re-order point, fixed order interval, run-out time, kanban and
material requirements planning (MRP) methods (e.g. Seetharama et al., 1995, Vollmann et
al., 2005). These methods may be more or less appropriate depending on the type of
inventory they control, i.e. if they are used for controlling the replenishment stocks of
purchased items used in manufacturing, controlling manufacturing or the replenishment of
finished goods stocks in distribution operations (Rabinovish and Evers, 2002). Material
planning methods can also be considered to perform differently well depending on the
environment where they are used (Krajewski et al., 1987, Berry and Hill, 1992, Jonsson and
Mattsson, 2003).
Material planning performance is partly a result of whether appropriate methods are
employed and whether they are used correctly. For example, a method could be expected to
perform better if lead times, safety stocks, re-order points, batch sizes etc. represent reality
rather than not. To do this, the parameters may need to be analytically determined (safety
stocks calculated from determined service levels etc.) rather than experience-based.
Page 3 of 50
http://mc.manuscriptcentral.com/tprs Email: [email protected]
International Journal of Production Research
123456789101112131415161718192021222324252627282930313233343536373839404142434445464748495051525354555657585960

For Peer Review O
nly
2
However, studies show that this is not always the case: “Surprisingly, many companies use
outdated, simplistic methods for allocating safety stocks, and they do not ever know it”
(Sandvig, 1998). Wilkinson (1996) writes that “in the last few years, we have worked for
over 30 clients, in excess of 90% of these did not set mathematically based safety stock
levels”. Jonsson and Mattsson (2006) conducted a longitudinal study of the use of material
planning methods in manufacturing companies between 1993 and 2005. They concluded
that a common way of determining parameters such as order quantities and safety stocks is
by general judgment and experience. They also concluded that the proportion of companies
with replanning capability in their Enterprise Resource Planning (ERP) systems has
increased, but only a minor portion of the companies use automatic replanning.
The parameters should also be updated periodically in order to adjust dynamically to the
changing environment. Furthermore, the planning frequency may have an important
performance impact, especially in environments characterised of uncertain demand (e.g.
Lee, 2002) where daily rather than weekly planning would probably result in more
appropriate plans. The Jonsson and Mattsson (2006) study also showed that parameters
used in the material planning methods were reviewed rather infrequently, typically once a
year or less in over half of the companies. For re-order point methods, there was a general
trend towards less frequent reviewing.
Consequently, planning performance may be affected by the type of inventory and the
planning environment where it is used and how parameters are determined in the first place,
how often they are reviewed or the planning frequency. However, there has been little
empirical analysis of the performance impacts of the planning environment and the way
material planning methods are used or how planning parameters are determined.
Page 4 of 50
http://mc.manuscriptcentral.com/tprs Email: [email protected]
International Journal of Production Research
123456789101112131415161718192021222324252627282930313233343536373839404142434445464748495051525354555657585960
For Peer Review O
nly
3
The first objective of this paper is to evaluate the perceived planning performance of
material planning methods used to control material flows in different inventory types in
manufacturing and distribution companies. The second objective is to evaluate the
perceived planning performance depending on the way planning parameters are determined
and the methods used. The analysis is based on survey data.
2. FRAME OF REFERENCE
2.1 Material Planning Methods for Inventory Management
The two essential questions to address in material planning are “When to order/deliver?”
and “How much to order?” – i.e. one time-related and one quantity-related. There are a
number of material planning methods, which answer these two questions in different ways
and can be categorised as working with dependent or independent demand. Materials
requirements planning (MRP) is the best known and most widely used method for
dependent demand. Re-order point methods (ROP), fixed order interval method (FOI), run-
out time planning (ROT) and kanban are common methods for independent demand (see
e.g. Vollmann et al., 2005). The run-out time planning method (e.g. Seetharama et al.,
1995) is synonymous with the cover time planning method (e.g. Segerstedt, 2006). These
five methods are included in this study.
Material planning methods have a number of different replenishment mechanisms (re-
order points, replenishment intervals, run-out times, number of kanbans and the MRP
calculation). However, they also include several common planning parameters, for example
safety stocks, lead times and order quantities.
Page 5 of 50
http://mc.manuscriptcentral.com/tprs Email: [email protected]
International Journal of Production Research
123456789101112131415161718192021222324252627282930313233343536373839404142434445464748495051525354555657585960
For Peer Review O
nly
4
2.2 Inventory Types and Perceived Material Planning Performance
Only a few studies focus on the adoption patterns of material planning methods in
different types of inventories. Newman and Sridharan (1992) studied the use of re-order
point methods, material requirements planning, kanban and OPT in US manufacturing
companies: 56% used MRP, 22% used re-order point methods, and 8% used kanban. In the
study by Cerveny and Scott (1989) in six different industries, 60% were MRP users.
Osteryoung et al. (1986) concluded that a majority of firms used re-order point methods for
controlling finished goods inventories compared to work in process and raw materials. This
is logical, since the items controlled in the finished goods inventory have independent
demand and cannot be derived by exploding and off-setting the demand through the bill-of-
materials as done in the MRP method. However, the distribution requirements planning
(DRP) and time-phased order point methods are MRP related alternatives to the re-order
point related methods in such an environment. An earlier study by Reuter (1978) concluded
that 85% of the examined companies used re-order point methods for placing orders with
suppliers. The study did not separate purchase of finished products and purchase of items to
be used as input to manufacturing. This may explain the heavy use of the re-order point
method. It is, however, also logical to believe that the re-order point method is suitable for
replenishment of inventories of purchased input items to manufacturing, especially for
those that are standard items used for making several different products and therefore have
quite even demand and picking frequency in the inventory. There are, however, studies
indicating a somewhat different usage pattern in various inventory types. Rabinovich and
Evers (2002) showed that MRP was used to a significantly greater extent than re-order
Page 6 of 50
http://mc.manuscriptcentral.com/tprs Email: [email protected]
International Journal of Production Research
123456789101112131415161718192021222324252627282930313233343536373839404142434445464748495051525354555657585960

For Peer Review O
nly
5
point methods in controlling material flows in raw material inventories, work in progress
and finished goods inventories. The differences in adoption patterns between the studies
may to some extent be explained by when they were conducted. Jonsson and Mattsson
(2006), for example, conducted a longitudinal study of the use of material planning
methods in 1993, 1999 and 2005. They showed that MRP has strengthened its position as
the most important material planning method and that the re-order point method decreased
in importance between 1993 and 1999. The re-order point method is still the secondly most
used method in industry. The study also showed that kanban has increased in use during the
last decade.
The performance of the material planning method can be estimated in different ways.
Firstly, it should constitute a good basis for achieving high operational performances, in
terms of costs, tied-up capital and customer service. Secondly, it should be user friendly,
i.e. easy to understand and use and efficient to operate. Operational performances could be
expected to be lower if a method is used in an inappropriate environment (e.g. Krajewski et
al., 1987, Berry and Hill, 1992). Jonsson and Mattsson (2003) explained how material
planning methods performed in four types of manufacturing environments. MRP performed
well in processes making complex customer products, but kanban did not. In processes
configuring products to order, all material planning methods were suitable but MRP had the
best fit. In batch production of standardised products, the re-order point methods had the
best fit together with MRP and in repetitive mass production all methods performed well,
however, kanban had the best fit. It was also identified that batch production of
standardised products had significantly more satisfied material planning users compared to
Page 7 of 50
http://mc.manuscriptcentral.com/tprs Email: [email protected]
International Journal of Production Research
123456789101112131415161718192021222324252627282930313233343536373839404142434445464748495051525354555657585960

For Peer Review O
nly
6
the other environments, thus, indicating that the material planning difficulties vary between
environments.
It is also reasonable to assume that planning methods are more or less suitable and
perform differently depending on whether they control raw material stocks, work in process
or finished goods inventories (Rabinovich and Evers, 2002). Methods based on dependent
demand (e.g. MRP) should have their greatest benefits for control of inventories in
manufacturing and for controlling inventories of purchased items to be included in
manufactured products. Methods based on independent demand (e.g. re-order point
methods) should, on the other hand, be most important and perform best for controlling
inventories of finished products and purchased items with low value and even demand.
None of the “traditional” material planning methods make capacity considerations.
However, there exist advanced planning and scheduling (APS) methods that conduct
concurrent priority and capacity planning. The use of APS methods is still low in industry.
No identified study has analysed the extent of APS use or how the APS related
methodology is used and its perceived performance output. This methodology is not
included in this study.
2.3 Modes of Application and Perceived Material Planning Performance
The performance of a material planning method can also be expected to differ depending
on the quality of the planning parameters, i.e. to what extent the parameters are correct
representations of reality (Sheu and Wacker, 2001). This may be a result of how the
parameters are determined in the first place or how the planning method is used, i.e. how
parameters are reviewed, and the modification and planning frequency of the orders.
Page 8 of 50
http://mc.manuscriptcentral.com/tprs Email: [email protected]
International Journal of Production Research
123456789101112131415161718192021222324252627282930313233343536373839404142434445464748495051525354555657585960

For Peer Review O
nly
7
Determining order quantities is essentially an issue of balancing ordering costs and
inventory carrying costs. Various categories of methods to accomplish such a balance can
be identified, for example dynamic and fixed quantity models (e.g. Huang, 2000).
Consequently, the approaches to determining the order quantity have a number of different
characteristics that may influence user friendliness and operational performance. Enns
(1999), for instance, showed the impact of various fixed order quantities on utilisation,
work in process and meeting due dates. The results emphasised the importance of selecting
proper batch sizes in MRP. Another study, by Wemmerlöv and Whybark (1984), showed
that dynamic lot-sizing models resulted in higher overall performances compared to other
models.
The optimum size of the order quantity is influenced by the current requirements. This
means that in order to maintain as optimal order quantities as possible they must be
reviewed periodically. How often this should be is an issue of balancing the cost of
reviewing them with the benefits of maintaining them closer to the optimum. Experience-
based quantities are normally more time consuming and costly to review than calculation-
based quantities. However, calculation-based quantities are more dependent on the quality
of the basic data in order to produce reliable measures.
To protect the material flow from disruptions due to uncertainties in demand and supply,
various safety mechanisms can be applied in all of the examined material planning
methods. The uncertainty in supply and demand can basically be managed in two ways: by
adding quantity buffers (i.e. using safety stock) or by adding time buffers (i.e. using safety
time). Whybark and Williams (1976) used simulation studies to conclude that there are
strong preferences for using safety lead times in MRP methods where demand or supply
Page 9 of 50
http://mc.manuscriptcentral.com/tprs Email: [email protected]
International Journal of Production Research
123456789101112131415161718192021222324252627282930313233343536373839404142434445464748495051525354555657585960
For Peer Review O
nly
8
timing uncertainty exists, and using safety stocks where there is uncertainty in either the
demand or supply quantity. Similar studies and findings relating to MRP methods
(Molinder, 1997) and fixed order interval methods (Benton, 1991) have been carried out.
In most companies safety stocks are determined based on experience or by adding a
fixed percentage to the lead-time demand (Jonsson and Mattsson, 2006). Of these
approaches the experience-based approach cannot be updated automatically and is therefore
more costly to review. Sandvig (1998), for example, states that surprisingly many
companies use outdated and simplistic methods for allocating safety stocks.
Accurate lead times are very important in all material planning methods. This is for
instance the case when calculating re-order points in re-order point methods, comparing
run-out times with replenishment lead times in run-out time planning, and when off-setting
start dates in material requirements planning. Lead times can be based on experience,
calculations in the ERP system or monitored actual time. Zijm and Buitenhek (1996)
discussed the problem with fixed lead times in MRP methods and compared it with
workload-dependent lead times which resulted in significantly higher performance.
Experience-based lead times have the same drawbacks as experience-based order quantities
and safety stocks.
The modes of determining order quantities, safety mechanisms and lead times affect the
possibility of obtaining accurate and appropriate measures. The frequency of reviewing the
parameters also affects the dynamics of the methods and thereby the operational
performance of the material planning (e.g. May, 1999). The review frequency is especially
important in situations of varying demand and supply (Zhau and Lee, 1993). The planning
frequency and ability of the method to automatically re-plan orders may result in more up-
Page 10 of 50
http://mc.manuscriptcentral.com/tprs Email: [email protected]
International Journal of Production Research
123456789101112131415161718192021222324252627282930313233343536373839404142434445464748495051525354555657585960

For Peer Review O
nly
9
dated parameters and thus having the same impact on operational planning performance.
However, frequent adjustments could also have an augmented effect, often referred to as
system nervousness. One way of decreasing the nervousness would be to work with longer
planning periods and by freezing time fences (Tang and Grubbström, 2002). Longer
planning horizons may actually worsen MRP performance in a situation of uncertain
demand but improve its performance in a deterministic case (Zhao and Lee, 1993). In
addition to these general modes of applying methods, there are also method-specific modes
– for example determination of order points, review periods, run-out times and number of
kanbans.
2.4 The Study Design
The study is designed and analysis conducted in two steps, according to the objectives. To
achieve high planning performance the material planning methods need to be used in
appropriate planning environments. Here, we separate three different planning
environments based on the type of inventory the method controls. The first type concerns
inventory of purchased items to be used in manufacturing operations. The second concerns
inventory of manufactured semi-finished goods and the third concerns inventory of
purchased finished products, i.e. inventories in distribution operations or spare parts. We
also separate the method use in small and large firms. In accordance with the previous
discussion, some differences in use and perceived planning performance is expected for the
respective methods in the different inventory types. This is the first part of the analysis (See
Figure 1).
Page 11 of 50
http://mc.manuscriptcentral.com/tprs Email: [email protected]
International Journal of Production Research
123456789101112131415161718192021222324252627282930313233343536373839404142434445464748495051525354555657585960

For Peer Review O
nly
10
To achieve high planning performance, the planning parameters used in the respective
method also have to reflect the conditions in the planning environment. This can be
accomplished by estimating them based on general judgement and experience. Setting
parameters based on general judgment and experience means, however, that the parameters
become very loosely connected to existing environmental conditions. By using analytical
methods when determining the planning parameters, such relationships can be more exactly
and accurately established. For example, the re-order point can more properly reflect the
current lead time and demand if it is determined as the sum of the demand during lead time
plus a safety stock rather than using a fixed number. Correspondingly, the safety stock can
reflect the current variation in demand and determined service levels if it is analytically
calculated rather than assessed as a fixed value.
As a result of frequent changes in the planning environment in most industries, planning
parameters must also be reviewed and updated for the methods to work correctly. This
concerns for instance changes in interest rates, ordering costs, demand, variation in demand
and lead times. The need to review and update the parameters regularly is a concern
irrespective of whether the parameters are manually estimated or analytically calculated by
the ERP system. Frequent parameter updating can, however, be more easily accomplished
by analytical methods. If, for example, the re-order point is determined as the demand
during lead time plus a safety stock rather than a fixed number, the economic order quantity
or other calculation method is used when determining order quantities, safety stock
calculations are applied based on determined service levels and lead times are based on
calculations in the ERP system, the parameters can automatically be updated when the
environment changes.
Page 12 of 50
http://mc.manuscriptcentral.com/tprs Email: [email protected]
International Journal of Production Research
123456789101112131415161718192021222324252627282930313233343536373839404142434445464748495051525354555657585960

For Peer Review O
nly
11
Another important concern in achieving high planning performance is planning
frequency. More frequent planning results in more updated plans, which in most situations
should lead to more accurate plans and thus higher planning performance. Less frequent
material planning means planning with longer intervals, which means longer lead times
from a planning perspective. This also contributes to increased uncertainty.
Manually modifying planned orders may have a positive performance impact because it
could result in the changed order becoming more accurate. However, changes will result in
alterations to other planned orders which may lead to lower performance. A manual change
may also negatively affect perceptions of user friendliness.
In ERP systems supporting MRP it is often possible to generate re-planning suggestions
and to automatically re-plan orders. Automatic re-planning overrules the planner, which
could result in low performance, but is on the other hand more cost efficient than manual
re-planning.
In accordance with the above discussion, the second part of the analysis relates to the
level of analytically determining parameters and the review frequency, planning frequency,
order modification and automatic re-planning ability when using the methods (Figure 1)
and their perceived performance impact. Planning performance is measured as the “user
friendliness” and “operational performance”. The performance impact is analysed with
statistical significance tests for the independent demand-oriented methods (re-order point,
fixed order interval and run-out time methods) as a group and for the dependent demand-
oriented MRP method. Descriptive data is also presented for the re-order point, fixed order
interval, run-out time and kanban methods, separately, but the samples are too small to
conduct statistical significance tests. The independent demand method group will hereafter
Page 13 of 50
http://mc.manuscriptcentral.com/tprs Email: [email protected]
International Journal of Production Research
123456789101112131415161718192021222324252627282930313233343536373839404142434445464748495051525354555657585960

For Peer Review O
nly
12
be denoted re-order point methods, as the methods (are) in several respects are variants of
the traditional re-order point method.
------------------------
Insert Figure 1 here
------------------------
3. METHODOLOGY
3.1 Selection and Data Collection
Data collection was made by a web-based survey. E-mails about participation in the survey
were sent to 573 member companies of the Swedish Production and Inventory Management
Society (PLAN), an affiliate of APICS. Of these 573, 153 companies responded, which is a
response rate of 31%. We expected most PLAN companies to be in manufacturing and thus
to use material planning methods for controlling stocks of purchased and manufacturing
items. In order to include companies using material planning methods in distribution
operations, the survey was also sent to logistics managers at all Swedish wholesaling
companies with more than 20 employees. Addresses were provided by the Swedish postal
service: 469 surveys were sent out and 53 useable responses were received, a response rate
of 11%. The questionnaire was quite long and some of the respondents from the
wholesaling company selection were probably not inventory management experts, which
may explain the relatively low response rates. About half of the respondents were from
mechanical engineering companies and more than half were large companies (Table 1).
Page 14 of 50
http://mc.manuscriptcentral.com/tprs Email: [email protected]
International Journal of Production Research
123456789101112131415161718192021222324252627282930313233343536373839404142434445464748495051525354555657585960

For Peer Review O
nly
13
Manufacturing companies with a turnover below SEK 100 million (equivalent to about 12
million Euro) or with less than 50 employees were defined as small. Those with a turnover
between SEK 100 million and SEK 300 million and with more than 50 employees were
considered medium-sized companies.
------------------------
Insert Table 1 here
------------------------
Generally speaking, PLAN members are distributed across manufacturing industries
according to the average for Swedish manufacturing (i.e. with about half of the companies
in the mechanical engineering sector). A reason for sending the questionnaire to PLAN
members was that they were likely to have an interest in manufacturing planning and be
familiar with the terminology used in the survey. Membership of PLAN is personal.
Therefore, we did not expect the studied companies to be more advanced users of planning
methods compared to the average for Swedish manufacturing, only that the respondents
were more aware of the manufacturing planning and control area compared to the average.
For the wholesaling companies, the situation is different. In this case, the survey was
addressed to logistics managers. Several different material planning situations and
applications could exist in one company, but we have included only one response per
company in this analysis. Respondents were requested to answer only those sections they
were familiar with and to pass the questionnaire to those in the company most qualified to
Page 15 of 50
http://mc.manuscriptcentral.com/tprs Email: [email protected]
International Journal of Production Research
123456789101112131415161718192021222324252627282930313233343536373839404142434445464748495051525354555657585960
For Peer Review O
nly
14
answer particular sections. Therefore, it should be safe to assume that the responses were
valid.
3.2 The Survey Instrument
There are four types of measures in this study. The first measures the use of the respective
material planning method. The second measures the planning environment, here
operationalised as inventory type. The third measures the mode of application of a specific
planning method, and the fourth measures the perceived performance of the planning
methods used. The classifications used and criteria measured follow the general
manufacturing planning and control definitions (e.g. Vollmann et al., 2005).
In evaluating the use of planning methods, respondents were given four alternatives: (1)
the method is not used, (2) the method is used as a complement, (3) the method is used as a
main method, (4) don’t know. Respondents marking alternatives 2 or 3 were coded as
users. “Main method” was defined as the method used for the majority of items.
Here, the planning environment concerns the type of inventory that the method
controlled. The respondents were given three alternatives: 1) control of inventories of
purchased items to be used in manufacturing operations, 2) control of manufactured semi-
finished goods , 3) control of inventories of finished goods or spare parts in distribution
operations.
The modes of application of the studied methods were measured in terms of the
following: choice of lot-sizing methods, ways of considering uncertainties, level of
analytical determination of re-order points, level of analytical determination of safety
stocks and safety times, level of analytical determination of lead times, reviewing
Page 16 of 50
http://mc.manuscriptcentral.com/tprs Email: [email protected]
International Journal of Production Research
123456789101112131415161718192021222324252627282930313233343536373839404142434445464748495051525354555657585960

For Peer Review O
nly
15
frequency of order quantities, reviewing frequency of safety stocks and safety times,
reviewing frequency of lead times, and planning frequencies. Some additional planning
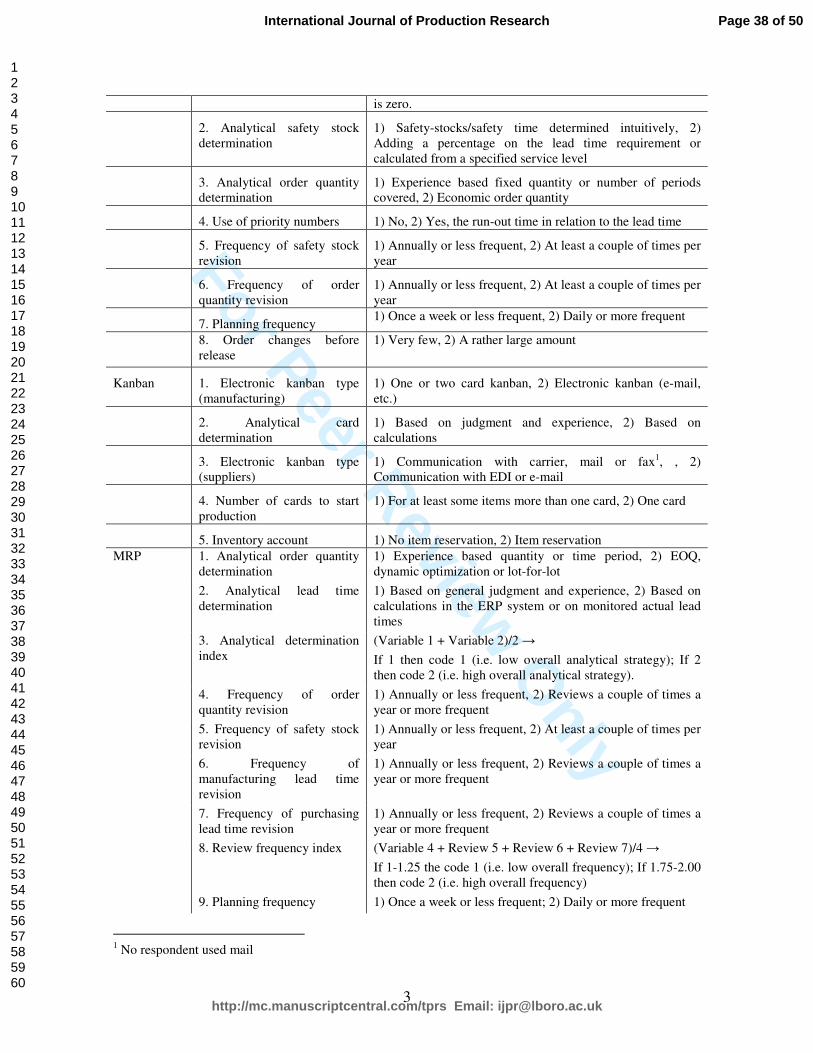
variables were included for run-out time planning and kanban (see Table 2). Answers were
coded “1” or “2”, in accordance with Table 2. For MRP and re-order point methods, four
indexes were formed, two for analytical parameter determination and two for parameter
review frequency. Table 2 shows the definitions of the variables and indexes used for the
re-order point methods and the MRP method.
------------------------
Insert Table 2 here
------------------------
Two variables and questions were used to measure the perceived planning performance: (1)
User friendliness (“How easy is the method to understand and use, and how time
consuming is it?”), and (2) Operational performance (“How well does the control of
inventories and material flows match your expectations, in terms of achieving low tied-up
capital, high customer service and few shortages?”). The answers were measured on seven-
point scales, where “1” represented “poor”/“not at all”, “4” satisfactory, and “7” “very
well”. Previous studies have used the perceived overall performance of manufacturing
(Safizadeh et al., 1996), the inventory turnover rate (Rabinovich et al., 2003) and inventory
days on hand in different inventories (Safizadeh and Ritzman, 1997) as measures for
materials management performance. To validate our two measures of perceived planning
performance we have included two measures that are in line with those tested and used in
Page 17 of 50
http://mc.manuscriptcentral.com/tprs Email: [email protected]
International Journal of Production Research
123456789101112131415161718192021222324252627282930313233343536373839404142434445464748495051525354555657585960
For Peer Review O
nly
16
previous studies. The first is about the perceived overall inventory turnover rate in relation
to the competitors in the industry (measured on a 7 point scale ranging from much lower to
much higher) and the second about the perceived overall delivery service performance to
customer in relation to the competitors in the industry (measured on a 7 point scale ranging
from much worse to much better). These validity tests are explained in the next section.
3.3 Reliability and Validity
To increase the reliability and validity of the questionnaire, it was pre-tested and a number
of questions were adjusted before finally sending out. Most respondents were PLAN
members. This should ensure familiarity with planning methods.
The industry and size of the respondents closely matched the demographics of Swedish
manufacturing firms in general (Olhager and Seldin, 2004). To increase the response rate
and to identify the reasons for non-responses, potential respondents received a reminder by
phone. Addresse(e)s were also requested to reply even if they did not intend to complete the
questionnaire. Four main reasons were given for not answering the questionnaire, with a
total of 111 non-reasonses. Fifty-four (49%) stated that their company had no production or
inventories and was therefore not relevant for the study; 27 (24%) did not have sufficient
knowledge to answer accurately; 23 (21%) did not have enough time or did not wish to
answer the questionnaire; and 7 (6%) no longer worked for the company. The population of
manufacturing companies could thus be adjusted to 533, which gives an adjusted response
rate of 29%. If 49% of all companies were irrelevant for study, then the response rate would
be 55%. The responding adjusted distribution company population is 455 and the adjusted
response rates 12% and 22% respectively. Chi-square tests did not reveal any significant
Page 18 of 50
http://mc.manuscriptcentral.com/tprs Email: [email protected]
International Journal of Production Research
123456789101112131415161718192021222324252627282930313233343536373839404142434445464748495051525354555657585960
For Peer Review O
nly
17
difference between respondents and non-respondents regarding company size or industry in
any of the surveys. It should therefore be possible to generalise the findings for most
manufacturing industries.
A four-page file with definitions and descriptions of the methods for material planning
was attached to the surveys. The aim was to ensure that the measures were valid and that
the respondents had the same definitions of planning methods, which further improved the
understanding and validity of the study.
The criterion-related (predictive) validity of the subjective measure of perceived
performance was tested by assessing the relationship between scores on the predictor scale
and measures of the perceived overall inventory turnover rate in relation to the competitors
in the industry (measured on a 7 point scale ranging from much lower to much higher) and
the perceived overall delivery service performance to customer in relation to the
competitors in the industry (measured on a 7 point scale ranging from much worse to much
better). Table 3 shows the bivariate correlations between the measures. For MRP there are
significant correlations between the perceived operational performance and both the
inventory turnover rate and delivery service. The correlation between the perceived user
friendliness and the delivery service is also significant. For the re-order point method there
are significant correlation between both the perceived operational performance and user
friendliness and the inventory turnover rate. However, the correlations with the delivery
service are not significant. The correlations with the inventory turnover rate are expected to
be higher than with the delivery service because the methods directly affects the inventory
levels but only indirectly the delivery service. For the fixed order interval, run-out time
planning and kanban methods the only significant correlation existed between the
Page 19 of 50
http://mc.manuscriptcentral.com/tprs Email: [email protected]
International Journal of Production Research
123456789101112131415161718192021222324252627282930313233343536373839404142434445464748495051525354555657585960
For Peer Review O
nly
18
operational performance and delivery service for kanban. The levels of significance are
lower for these methods, mainly because of lower number of respondents. The correlations
between the perceived operational performance and perceived user friendliness are
significant (p<0.01) for all methods. This is inline with the expectations that the user
friendliness is positively affected by the operational performance. The correlation
coefficient for the correlation between the two overall measures (inventory turnover rate
and delivery service) was 0.154, which was significant on the p<0.05 level. These tests
validate the appropriateness of using the perceived operational performance as a
performance measure, especially for the MRP and re-order point methods.
------------------------
Insert Table 3 here
------------------------
3.4 Statistical Tests
The level of measurement of the questions differed between nominal, ordinal and interval
scales. Therefore, various statistical methods were applied to analyse the data. The
selection of the methods followed the guidelines of for example Siegel and Castellan
(1988) and Hair et al. (1998). For scales of nominal and ordinal type, statistical analysis
was carried out using chi-square tests for goodness of fit. For scales of interval type,
ANOVA tests were used.
Page 20 of 50
http://mc.manuscriptcentral.com/tprs Email: [email protected]
International Journal of Production Research
123456789101112131415161718192021222324252627282930313233343536373839404142434445464748495051525354555657585960

For Peer Review O
nly
19
4. FINDINGS
The analysis is conducted in two stages, according to the stated objectives. First, we study
the use of methods to control the material flow in manufacturing companies’ inventories of
purchased and manufactured items and distribution operations’ inventories and compare the
perceived planning performance in different inventory types. Second, we compare the
modes of application of the methods between firms with low and high perceived planning
performance. Here, statistical significance tests are only conducted for the MRP and re-
order point methods, because too few respondents using the other methods, as discussed in
the methodology chapter.
4.1 Material Planning Methods in Different Inventory Types and Company Sizes
Table 4 shows the use of the five studied material planning methods to control the material
flow to inventories of purchased and manufactured items in manufacturing companies and
inventories in distribution companies. Re-order point and MRP methods are the
significantly most common methods of controlling the material flow of purchased items.
MRP is significantly most common in inventories of manufactured items compared to all
other methods, and re-order point methods is significantly more common in inventories in
distribution operations compared to all other methods. At first sight, it may be somewhat
surprising that MRP is used in distribution operations because the method is not designed
for controlling independent demand items. However, those saying they use MRP in
distribution operations may use time-phased order point or distribution requirements
planning, two variants of MRP. Kanban and run-out time planning are used in all inventory
types, while the fixed order interval method is not used to any great extent in manufacturing
Page 21 of 50
http://mc.manuscriptcentral.com/tprs Email: [email protected]
International Journal of Production Research
123456789101112131415161718192021222324252627282930313233343536373839404142434445464748495051525354555657585960
For Peer Review O
nly
20
companies. A reason for using re-order point related methods for controlling inventories of
purchased items can be explained by the fact that there is a great extent of low value items
and companies choose to control them with simpler replenishment methods than MRP.
------------------------
Insert Table 4 here
------------------------
Table 5 shows the number and percentages of main method users. The usage pattern is the
same as for the general usage described in Table 4. MRP is significantly the most important
main method of controlling material flows in inventories of purchased and manufactured
items in manufacturing companies, while re-order point methods are most important in
distribution operations.
------------------------
Insert Table 5 here
------------------------
Tables 6 and 7 show the perceived planning performance in different inventory types. No
significant difference was identified between inventory types for the respective methods.
This is surprising since the methods should be more or less suitable in the various inventory
types and manufacturing environments.
Page 22 of 50
http://mc.manuscriptcentral.com/tprs Email: [email protected]
International Journal of Production Research
123456789101112131415161718192021222324252627282930313233343536373839404142434445464748495051525354555657585960

For Peer Review O
nly
21
------------------------
Insert Tables 6 and 7 here
------------------------
We also analysed the usage and general planning performance of each inventory
management method in companies of various sizes and for companies in general, without
considering inventory types or company sizes. When comparing companies of various sizes
the significant difference with highest p-value existed for the general use of the fixed order
interval method with higher usage among small and medium sized companies and for main
method usage of the re-order point method with more users among small and medium sized
companies. The different usage of MRP between small/medium sized and large sized
companies was significant on the p<0.11 level with higher usage among large companies
(Table 8). This is expected, since the method to a larger extent relies on ERP support
compared to the other methods. The perceived planning performance did not, for any
method, differ significantly between companies of various sizes (Table 9). The only
significant difference in general user friendliness, i.e. without considering inventory type or
company size, existed between kanban and the period review method. For both MRP and
kanban the general operational performance was significantly higher compared to the re-
order point and fixed order interval methods. Thus, the previous two methods were
considered to be more user friendly, no matter inventory type were they are used or
company size.
------------------------
Page 23 of 50
http://mc.manuscriptcentral.com/tprs Email: [email protected]
International Journal of Production Research
123456789101112131415161718192021222324252627282930313233343536373839404142434445464748495051525354555657585960

For Peer Review O
nly
22
Insert Tables 8 and 9 here
------------------------
4.2 Parameter Determination and Method Usage
Table 10 shows a comparison between companies with perceived high and low
performance of the respective method, measured in terms of user friendliness and
operational performance. The two performance variables discussed in the methodology
chapter and in the previous section were used. Respondents marking “1”, “2” or “3” on the
7-point scales were defined as “low performance”; and firms and respondents marking “5”,
“6” or “7” were defined as “high performance” firms. The modes of application defined in
Table 2 were compared between the low and high performance firms using chi-square tests.
------------------------
Insert Table 10 here
------------------------
A few statistically significant differences between firms with low and high perceived
planning performance were identified for the re-order point and MRP methods.
For the re-order point methods, the degree of analytical order point determination (i.e.
calculating the order point as the sum of the demand during lead time plus safety stock
rather than using experience) and the frequency of order point revision differed
Page 24 of 50
http://mc.manuscriptcentral.com/tprs Email: [email protected]
International Journal of Production Research
123456789101112131415161718192021222324252627282930313233343536373839404142434445464748495051525354555657585960
For Peer Review O
nly
23
significantly between users with different perceived operational planning performance.
Firms generating future demand data through MRP or monthly forecast calculations also
showed significantly (at the p<0.10 level) higher operational performance compared to
those who used experience or simply the previous year’s demand. Furthermore, many order
changes before release were associated with significantly lower operational performance.
The only significantly characteristic mode of application among re-order point users who
find the methods user friendly is that they need to deal with fewer changes of planned
orders before release.
For MRP users, analytical lead-time determination, frequency of safety stock revision,
frequency of manufacturing lead-time revision and planning frequency differed most
significantly between users with various degrees of perceived operational planning
performance. MRP supported by an ERP system that generates re-planning suggestions is
considered significantly more user friendly than systems without re-planning support in the
ERP. Firms with higher frequencies of safety stock revision, purchasing lead-time revision
and lower numbers of order changes before order release also found the method more user
friendly compared to those that did not.
The findings confirm the expectations that analytical modes of determining parameters
and higher review frequencies have positive impacts on planning performance. However,
the relationships were only verified for some critical variables (determination and revision
of order points for re-order point methods and lead-time determination and revision and
safety stock revision for MRP) and not for the overall indexes, except for the review
frequency index for the operational re-order point performance and user friendliness of
MRP. The relationships were also only valid for the impact on the perceived operational
Page 25 of 50
http://mc.manuscriptcentral.com/tprs Email: [email protected]
International Journal of Production Research
123456789101112131415161718192021222324252627282930313233343536373839404142434445464748495051525354555657585960

For Peer Review O
nly
24
performance of the methods and not for their perceived user friendliness. It can, though, be
expected that the perceived user friendliness depends more on the user friendliness of
available ERP systems than on the method used. The assumption about the planning
frequency was verified for MRP regarding its impact on operational performance. The
assumption about order modification was verified for both methods and performance
measures, except for the operational performance of MRP. The assumption regarding
automatic re-planning was verified for its impact on user friendliness but not for
operational performance.
The reasons for high or low perceived planning performance among the fixed-order
interval and run-out time planning users follow the same pattern as for MRP and re-order
point users. Analytical determination of run-out time, order intervals and safety stocks
seems to be important, as well as, frequent safety stock determination and few order
changes before release. It is hard to draw and conclusions of the reasons for high or low
kanban performance. One possible tendency is, though, that users that only need one
kanban to start production show higher planning performance compared to those that need
several kanbans. This verifies the need for small set-up times and batch sizes in order to
successfully apply the kanban method. However, the findings related to the fixed-order
interval, run-out time and kanban methods are not based on statistical significance tests but
are rather visual analyses of the figures in Table 11.
------------------------
Insert Table 11 here
------------------------
Page 26 of 50
http://mc.manuscriptcentral.com/tprs Email: [email protected]
International Journal of Production Research
123456789101112131415161718192021222324252627282930313233343536373839404142434445464748495051525354555657585960

For Peer Review O
nly
25
5. DISCUSSION
The study showed that MRP is the most used and ROP the second most used method for
controlling material flows to inventories in manufacturing companies. In distribution
operations, however, ROP and ROP-related methods fixed order interval method, run-out
time planning and kanban) are the most commonly used main methods. The findings do not
verify the conclusions of Rabinovich and Evers (2002) that MRP related methods was also
the most important method for controlling finished goods inventories, for example stocks in
distribution operations.
MRP and kanban are perceived to result in better general performance compared to re-
order point and fixed order interval methods. This is interesting as MRP is more dependent
on the quality of the planning information and the ERP support than the other methods.
The most important application modes for achieving high operational planning
performance among re-order point users were to determine the order point as the demand
during the lead time plus a safety stock, and to frequently review this order point quantity.
By doing so the method becomes more dynamic, i.e. responsive to demand and lead-time
fluctuations. The method works best in a stable environment where the demand is smooth
and lead times are short and fixed. However, several companies use the method in other
environments and therefore require a more dynamic method in order to achieve a
satisfactory planning performance. A corresponding indirect effect could be achieved by
deriving the demand data from a requirements calculation or monthly forecasts instead of
using the previous year’s sales figures or an annual estimate. This performance impact was
also identified in the study. It shows the importance of combining several methods in an
Page 27 of 50
http://mc.manuscriptcentral.com/tprs Email: [email protected]
International Journal of Production Research
123456789101112131415161718192021222324252627282930313233343536373839404142434445464748495051525354555657585960
For Peer Review O
nly
26
integrated planning approach, and the possibility of using MRP as a complement to re-order
point methods.
The study showed that accurate lead times and safety stocks are two of the most critical
parameters for achieving high MRP performance. To achieve high accuracy, lead times
must be periodically reviewed to reflect the current situation faithfully. This is an issue of
balancing the cost of reviewing and the benefits of more accurate lead times.
Manufacturing lead times could be calculated automatically from filed data in the ERP
system or based on real-time logging of operation times. The same is true for safety stocks,
which should be properly determined and frequently reviewed to allow for dynamic and
efficient material planning. The identified importance of safety stock determination is
interesting, because studies show that only a minority of companies use analytical safety
stock approaches (e.g. Sandvig, 1998, Jonsson and Mattsson, 2006). Companies with a
daily MRP planning frequency also showed significantly higher planning performance
compared to those with weekly planning. The argument is the same as for more analytical
determination and frequent revision, as it results in a more dynamic method. It is also in
line with current practice. Jonsson and Mattsson (2006) showed that the majority of MRP
users changed from weekly to daily planning frequencies between 1993 and 1999 and that
daily planning now is the dominating planning frequency for all methods.
The findings further indicate that sufficient operational performance equates to a user
friendly method. If the method results in high operational performance, for example as a
result of analytically determined and frequently revised parameters, users are more likely to
find the method user friendly. However, other issues affect the perceived user friendliness,
for example, the characteristics of the ERP system that supports the planning process. For
Page 28 of 50
http://mc.manuscriptcentral.com/tprs Email: [email protected]
International Journal of Production Research
123456789101112131415161718192021222324252627282930313233343536373839404142434445464748495051525354555657585960

For Peer Review O
nly
27
MRP, the user friendliness is also higher with an ERP system with automatic re-planning
support, i.e. if the system is allowed to take more active control of the planning process.
The study shows that order quantity determination and revision have no impact at all on
planning performance. Rather, the re-order point (or the replenishment level, run-out time,
number of kanbans, respectively) is significantly the most important parameter to determine
and review in re-order point methods and safety stock and lead times in MRP. This finding
is interesting because order quantity related studies still receive greater emphasis in
research.
Guiding managerial implications of the study are summarised in Table 11. Issues to
consider and guidelines to follow are related to the three phases of designing and using
material planning methods; 1) matching method and planning environment, 2) designing
material planning method and 3) using material planning method.
------------------------
Insert Table 11 here
------------------------
6. CONCLUSIONS
The study concludes that the use of material planning methods differs depending on where
along the material flow they are applied, whether the inventory is located in a
manufacturing company or in distribution operations and between companies of various
sizes. The modes of applying a material planning method affect its perceived performance.
In particular, the way of determining and the review frequency of safety stocks and lead
times have great importance for the planning performance of MRP methods, while the
Page 29 of 50
http://mc.manuscriptcentral.com/tprs Email: [email protected]
International Journal of Production Research
123456789101112131415161718192021222324252627282930313233343536373839404142434445464748495051525354555657585960

For Peer Review O
nly
28
determination and review of order points, review frequencies and run-out times were
important for re-order point methods.
The present study has focused on the operational strategies for determining and
reviewing planning parameters and the planning frequencies of material planning methods.
The conclusions clearly indicate the importance of how the material planning methods are
applied, and in particular how the planning parameters are determined and reviewed, in
order to successfully manage material planning.
In every planning and control situation there are different planning conditions that
impact the possibility of favourable application modes, but which may also have a direct
impact on planning performance. Such conditions include, for example, the method support
in the ERP system, the educational and knowledge level of the material planning method,
management commitment, the organisational design and functioning of planning and
control, the available time for planning and control, the inventory accuracy and the lead-
time precision in the ERP system. To further understand how to successfully employ
material planning methods, it would thus be valuable to study the impact of planning
conditions on operational strategies and their direct effect on planning performance.
There is a need for more focused studies on specific methods. Here, significant test
could only be conducted for the MRP and re-order point methods. There is also a need for
more focused studies on different planning environments in order to better understand the
contextual impact on planning performance, for example, including the user environment
(knowledge, management support, planning organisation, software support, lead time
precision, etc.). A minority of the respondents represents distribution operations and the
response rate was quite low for distributing companies. Most studies on material planning
Page 30 of 50
http://mc.manuscriptcentral.com/tprs Email: [email protected]
International Journal of Production Research
123456789101112131415161718192021222324252627282930313233343536373839404142434445464748495051525354555657585960

For Peer Review O
nly
29
focuses on manufacturing operations. Therefore, it would be interesting with future studies
focusing on material planning in distribution operations. In this study, subjective measures
of the planning performance were used. Further development of instruments for measuring
the direct and indirect planning performance are needed.
REFERENCES
Benton, W.C. 1991. Safety stock and service levels in periodic review systems, Journal of
the Operations Research Society, 42, 1087-1095.
Berry, W. and Hill, T. 1992. Linking systems to strategy. International Journal of
Operations and Production Management, 12 (10), 3-15.
Cerveny, R. and Scott, L. 1989. A survey of MRP implementation. Production and
Inventory Management Journal, 30 (3), 31-35.
Enns, S. 1999. The effect of batch size selection on MRP performance. Computers &
Industrial Engineering, 37, 15-19.
Huang, S-T. 2000. Research on changes of total cost of dynamic economic lot size.
Production Planning & Control, 11 (1), 54-61.
Hair, J, Anderson, R, Tatham, R, Black, W. 1998. Multivariate data analysis, Prentice Hall,
London.
Jonsson, P. and Mattsson, S-A. 2003. The implication of fit between planning environments
and manufacturing planning and control methods. International Journal of Operations and
Production Management, 23 (8), 872-900.
Page 31 of 50
http://mc.manuscriptcentral.com/tprs Email: [email protected]
International Journal of Production Research
123456789101112131415161718192021222324252627282930313233343536373839404142434445464748495051525354555657585960

For Peer Review O
nly
30
Jonsson, P. and Mattsson, S-A. 2006. A longitudinal study of material planning
applications in manufacturing companies. Forthcoming in the International Journal of
Operations and Production Management.
Krajewski, L., King, B., Ritzman, L., Wong, D. 1987. Kanban, MRP and shaping the
manufacturing environment, Management Science, 33 (1), 39-57.
Lee, H. 2002. Aligning supply chain strategies with product uncertainties. California
Management Review, 44 (3), 105-119.
May, N. 1999. Managing safety stocks, Midrange ERP, October, 8.
Molinder, A. 1997. Joint optimization of lot-sizes, safety stocks and safety lead times in an
MRP system. International Journal of Production Research, 35 (4), 983-994.
Newman, W., and Sridharan, V. 1992. Manufacturing planning and control: Is there one
definite answer?. Production and Inventory Management Journal, 33 (1), 50-54.
Olhager, J. and Seldin, E. 2004. Supply chain management survey of Swedish
manufacturing firms. International Journal of Production Economics, 89, 353-361.
Osteryoung, J, Nosari, E, McCarty, D, Reinhart, W,. 1986. Use of the EOQ model for
inventory analysis. Production and Inventory Management Journal, 14 (3), 39-46.
Rabinovich, E. and Evers, P. 2002. Enterprise-wide adoption patterns of inventory
management practices and information systems. Transportation Research Part E, 38, 389-
404.
Rabinovich, E., Dresner, M., Evers, P. 2003. Assessing the effects of operational processes
and information systems on inventory performance. Journal of Operations Management,
21, 63-80.
Page 32 of 50
http://mc.manuscriptcentral.com/tprs Email: [email protected]
International Journal of Production Research
123456789101112131415161718192021222324252627282930313233343536373839404142434445464748495051525354555657585960

For Peer Review O
nly
31
Reuter. V. 1978. The big gap in inventory management. International Journal of
Purchasing and Materials Management, 14 (3), 227-230.
Safizadeh, H., Ritzman, L., Sharma, D., Wood, C. 1996. An empirical analysis of the
product-process matrix. Management Science, 42 (11), 1576-1591.
Safizadeh, H. and Ritzman, L. 1997. Linking performance drivers in production planning
and inventory control to process choice. Journal of Operations Management, 15, 389-403.
Sandvig, C. 1998. Simple solutions aren’t the best ones. IIE Solutions, 30 (12), 28-29.
Seetharama, N., McLeavey, D., Billington, P. 1995. Production planning and inventory
control. Prentice Hall, Englewood Cliffs.
Segerstedt, A. 2006. Master production scheduling and a comparison of materials
requirements planning and cover-time planning. Forthcoming in the International Journal
of Production Research.
Sheu, C., and Wacker, J.G. 2001. Effectiveness of planning and control systems: an
empirical study of US and Japanese firms. International Journal of Production Research,
39 (5), 887-905.
Siegel, S., and Castellan, N.J. 1988. Nonparametric statistics for the behavioral sciences,
McGraw-Hill.
Tang, O. and Grubbström, R. 2002. Planning and replanning the master production
schedule under demand uncertainty. International Journal of Production Economics, 78,
323-334.
Vollmann, T, Berry, W, Whybark, C, Jacobs, R. 2005. Manufacturing planning and control
for supply chain management, McGraw Hill, New York.
Page 33 of 50
http://mc.manuscriptcentral.com/tprs Email: [email protected]
International Journal of Production Research
123456789101112131415161718192021222324252627282930313233343536373839404142434445464748495051525354555657585960

For Peer Review O
nly
32
Wemmerlöv, U. and Whybark, D. 1984. Lot sizing under uncertainty in a rolling schedule
environment. International Journal of Production Research, 22 (3), 467-484.
Whybark, C. and Williams, J. 1976. “Material requirements planning under uncertainty”,
Decision Sciences, 7 (4).
Wilkinson, S. 1996. Service level and safety stock based on probability, Control, April, 23-
25.
Zhao, X. and Lee, T. 1993. Freezing the master production schedule under demand
uncertainty. Journal of Operations Management, 11, 185-205.
Zijm, W. and Buitenhek, R. 1996. Capacity planning and lead time management.
International Journal of Production Economics, 46/47, 165-179.
Page 34 of 50
http://mc.manuscriptcentral.com/tprs Email: [email protected]
International Journal of Production Research
123456789101112131415161718192021222324252627282930313233343536373839404142434445464748495051525354555657585960

For Peer Review O
nly
TABLES
Table 1 Characteristics of respondents
Table 2. Modes of application variables and measures
Table 3. Correlation between perceived planning performance and ITR/delivery service
Table 4. Number and percentages of method users
Table 5. Number and percentages of main method users
Table 6. Perceived user friendliness for the respective inventory management policy
Table 7. Perceived operational performance for the respective inventory management
policy
Table 8. Number and percentages of method and main method users with different
company sizes
Table 9. Perceived user friendliness and operational performance in general and in different
company sizes
Table 10 Modes of application among companies with perceived low and high performance
of main methods
Table 11. Managerial issues and guidelines related to planning phases
Page 35 of 50
http://mc.manuscriptcentral.com/tprs Email: [email protected]
International Journal of Production Research
123456789101112131415161718192021222324252627282930313233343536373839404142434445464748495051525354555657585960

For Peer Review O
nly
1
Table 1. Characteristics of respondents
Manufacturing
companies
Distribution operations
Number of
responses
Percentage Number of
responses
Percentage
Size:
Small & Medium sized
Large sized
45
103
30%
70%
100%
22
27
45%
55%
100%
Note: Chi-square 3.44 (sign p<0.07)
Page 36 of 50
http://mc.manuscriptcentral.com/tprs Email: [email protected]
International Journal of Production Research
123456789101112131415161718192021222324252627282930313233343536373839404142434445464748495051525354555657585960

For Peer Review O
nly
2
Table 2. Modes of application variables and measures Method Variable Measure
Re-order
point
methods
1. Analytical order quantity
determination
1) Experience based fixed quantity or number of periods
covered; 2) Economic order quantity
2. Analytical safety stock
determination
1) Safety-stocks included in the re-order point or based on
judgment and experience, 2) Adding a percentage on the lead
time requirement or calculated from a specified service level
3. Analytical order point
(replenishment level)
determination
1) Based on experience and judgment, 2) Calculated as lead-
time demand plus safety stock
4. Ways of estimating
demand
1) Experience or last year’s demand, 2) forecasting or MRP
5. Analytic determination
index
(Variable 1+Variable 2+Variable 3+Variable 4)/4 →
If 1-1.25 then code 1 (i.e. low overall analytical strategy); If
1.75-2.00 then code 2 (i.e. high overall analytical strategy).
6. Frequency of order
quantity revision
1) Annually or less frequent, 2) At least a couple of times per
year
7. Frequency of order point
revision
1) Annually or less frequent, 2) At least a couple of times per
year
8. Review frequency index (Variable 6+Variable 7)/2 →
If 1 then code 1 (i.e. low overall frequency); If 2 then code 2
(high overall frequency).
9. Planning frequency
1) Once a week or less frequent, 2) Daily or more frequent
10. Order changes before
release
1) Very few, 2) A rather large amount
Fixed order-
interval
method
1. Analytical determination of
the replenishment level
1) Based on experience and judgment, 2) Calculated as
demand during lead-time and review period plus safety stock
2. Analytical safety stock
determination
1) Safety-stocks included in the replenishment level or based
on judgment and experience, 2) Adding a percentage on the
lead time requirement or calculated from a specified service
level
3. Analytical determination of
review period
1) Based on experience and judgment, 2) calculated as the
economic order quantity
4. Analytical ways of
estimating demand
1) Experience or last year’s demand, 2) forecasting or MRP
5. Frequency of
replenishment level revision
1) Annually or less frequently, 2) At least a couple of times
per year
6. Frequency of review
period revision
1) Annually or less frequently, 2) At least a couple of times
per year
7. Order changes before
release
1) Very few, 2) A rather large amount
Run-out time
planning
1. Analytical determination of
the run-out time
1) Available inventory divided by last years demand or
available inventory divided by forecasted demand, 2)
Available inventory divided by MRP generated future
demand or period by period calculation when the inventory
Page 37 of 50
http://mc.manuscriptcentral.com/tprs Email: [email protected]
International Journal of Production Research
123456789101112131415161718192021222324252627282930313233343536373839404142434445464748495051525354555657585960
For Peer Review O
nly
3
is zero.
2. Analytical safety stock
determination
1) Safety-stocks/safety time determined intuitively, 2)
Adding a percentage on the lead time requirement or
calculated from a specified service level
3. Analytical order quantity
determination
1) Experience based fixed quantity or number of periods
covered, 2) Economic order quantity
4. Use of priority numbers 1) No, 2) Yes, the run-out time in relation to the lead time
5. Frequency of safety stock
revision
1) Annually or less frequent, 2) At least a couple of times per
year
6. Frequency of order
quantity revision
1) Annually or less frequent, 2) At least a couple of times per
year
7. Planning frequency 1) Once a week or less frequent, 2) Daily or more frequent
8. Order changes before
release
1) Very few, 2) A rather large amount
Kanban 1. Electronic kanban type
(manufacturing)
1) One or two card kanban, 2) Electronic kanban (e-mail,
etc.)
2. Analytical card
determination
1) Based on judgment and experience, 2) Based on
calculations
3. Electronic kanban type
(suppliers)
1) Communication with carrier, mail or fax1, , 2)
Communication with EDI or e-mail
4. Number of cards to start
production
1) For at least some items more than one card, 2) One card
5. Inventory account 1) No item reservation, 2) Item reservation
MRP 1. Analytical order quantity
determination
1) Experience based quantity or time period, 2) EOQ,
dynamic optimization or lot-for-lot
2. Analytical lead time
determination
1) Based on general judgment and experience, 2) Based on
calculations in the ERP system or on monitored actual lead
times
3. Analytical determination
index
(Variable 1 + Variable 2)/2 →
If 1 then code 1 (i.e. low overall analytical strategy); If 2
then code 2 (i.e. high overall analytical strategy).
4. Frequency of order
quantity revision
1) Annually or less frequent, 2) Reviews a couple of times a
year or more frequent
5. Frequency of safety stock
revision
1) Annually or less frequent, 2) At least a couple of times per
year
6. Frequency of
manufacturing lead time
revision
1) Annually or less frequent, 2) Reviews a couple of times a
year or more frequent
7. Frequency of purchasing
lead time revision
1) Annually or less frequent, 2) Reviews a couple of times a
year or more frequent
8. Review frequency index (Variable 4 + Review 5 + Review 6 + Review 7)/4 →
If 1-1.25 the code 1 (i.e. low overall frequency); If 1.75-2.00
then code 2 (i.e. high overall frequency)
9. Planning frequency 1) Once a week or less frequent; 2) Daily or more frequent
1 No respondent used mail
Page 38 of 50
http://mc.manuscriptcentral.com/tprs Email: [email protected]
International Journal of Production Research
123456789101112131415161718192021222324252627282930313233343536373839404142434445464748495051525354555657585960

For Peer Review O
nly
4
10. Order changes before
release
1) Very few; 2) A rather large amount
11. Automatic re-planning 1) No re-planning support in the ERP system, 2) ERP system
generates re-planning suggestions and/or conducts re-
planning
Page 39 of 50
http://mc.manuscriptcentral.com/tprs Email: [email protected]
International Journal of Production Research
123456789101112131415161718192021222324252627282930313233343536373839404142434445464748495051525354555657585960

For Peer Review O
nly
5
Table 3. Correlation between perceived planning performance and ITR/delivery service Objective performance Perceived performance
Inventory turnover rate
(ITR)
Delivery service
User friendliness
Re-order point
0.203* -0.040
User friendliness
Fixed order interval
-0.061 0.246
User friendliness
Run-out time planning
0.060 0.080
User friendliness
Kanban
-0.086 0.154
User friendliness
MRP
0.125 0.181*
Operational
performance
Re-order point
0.196* 0.020
Operational
performance
Fixed order interval
0.228 -0.001
Operational
performance
Run-out time planning
0.169 0.169
Operational
performance
Kanban
0.073 0.242*
Operational
performance
MRP
0.324** 0.262**
Note: Pearson correlation, *Significant (p<0.05); **Significant (p<0.01).
Page 40 of 50
http://mc.manuscriptcentral.com/tprs Email: [email protected]
International Journal of Production Research
123456789101112131415161718192021222324252627282930313233343536373839404142434445464748495051525354555657585960
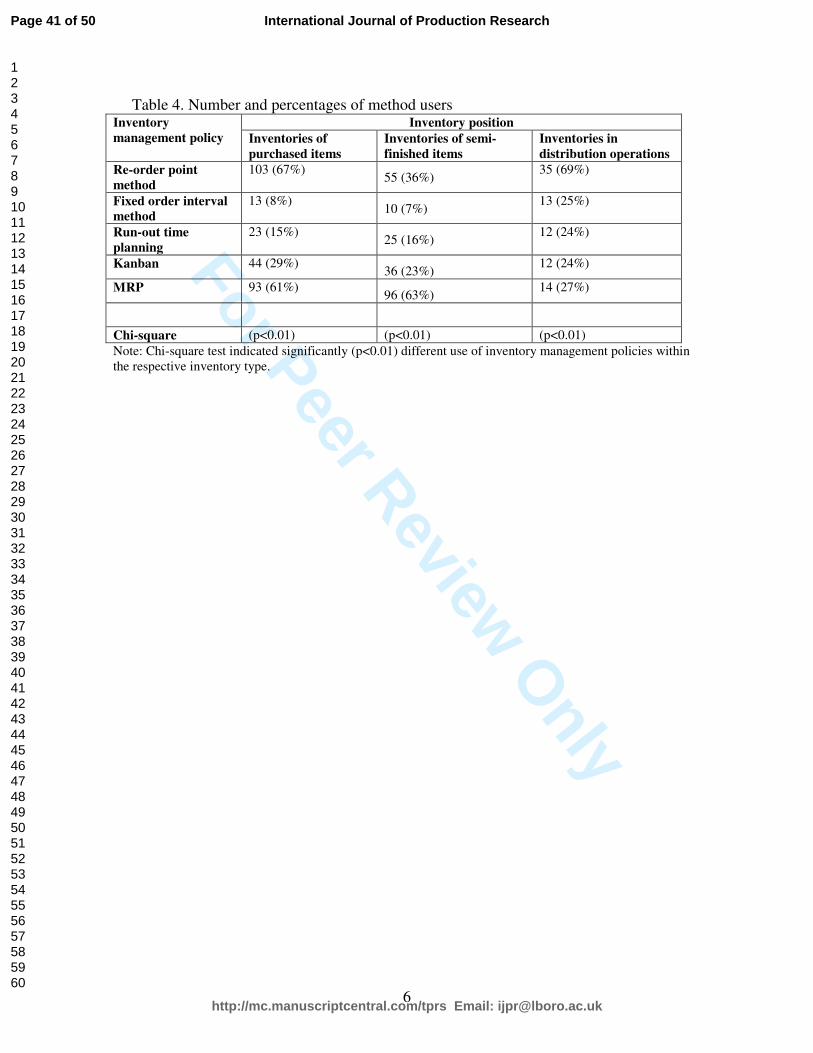
For Peer Review O
nly
6
Table 4. Number and percentages of method users Inventory position Inventory
management policy Inventories of
purchased items
Inventories of semi-
finished items
Inventories in
distribution operations
Re-order point
method
103 (67%) 55 (36%)
35 (69%)
Fixed order interval
method
13 (8%) 10 (7%)
13 (25%)
Run-out time
planning
23 (15%) 25 (16%)
12 (24%)
Kanban 44 (29%) 36 (23%)
12 (24%)
MRP 93 (61%) 96 (63%)
14 (27%)
Chi-square (p<0.01) (p<0.01) (p<0.01)
Note: Chi-square test indicated significantly (p<0.01) different use of inventory management policies within
the respective inventory type.
Page 41 of 50
http://mc.manuscriptcentral.com/tprs Email: [email protected]
International Journal of Production Research
123456789101112131415161718192021222324252627282930313233343536373839404142434445464748495051525354555657585960
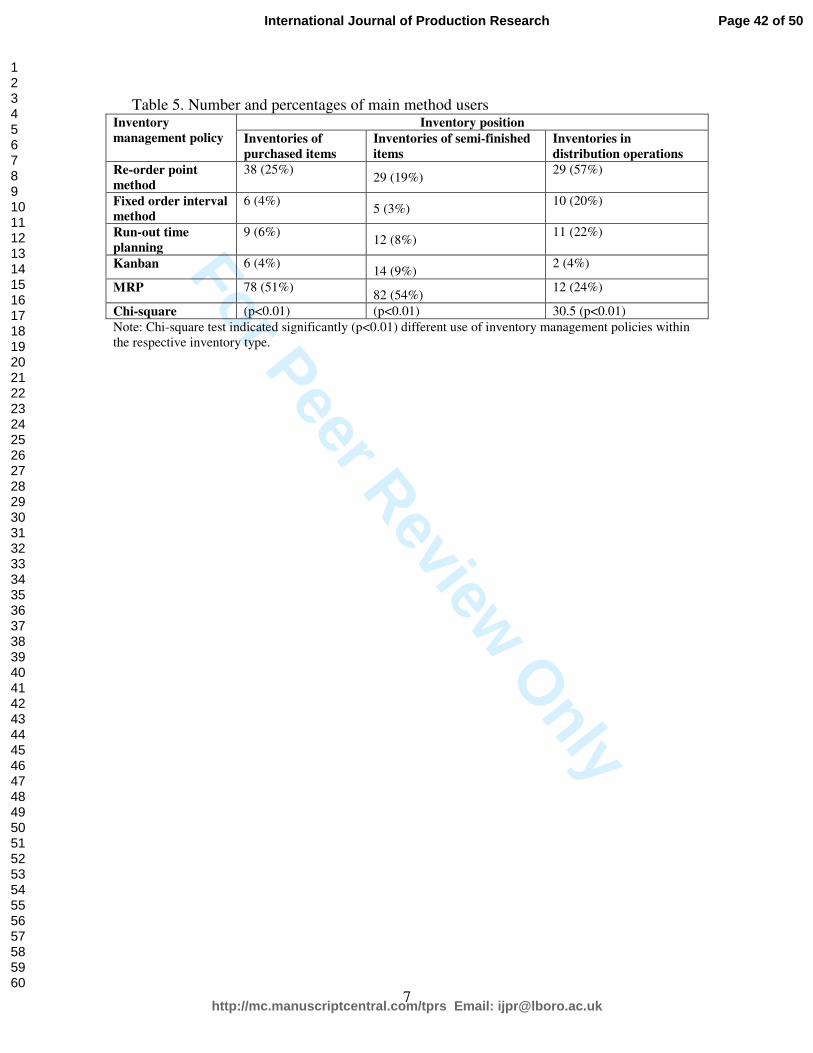
For Peer Review O
nly
7
Table 5. Number and percentages of main method users Inventory position Inventory
management policy Inventories of
purchased items
Inventories of semi-finished
items
Inventories in
distribution operations
Re-order point
method
38 (25%) 29 (19%)
29 (57%)
Fixed order interval
method
6 (4%) 5 (3%)
10 (20%)
Run-out time
planning
9 (6%) 12 (8%)
11 (22%)
Kanban 6 (4%) 14 (9%)
2 (4%)
MRP 78 (51%) 82 (54%)
12 (24%)
Chi-square (p<0.01) (p<0.01) 30.5 (p<0.01)
Note: Chi-square test indicated significantly (p<0.01) different use of inventory management policies within
the respective inventory type.
Page 42 of 50
http://mc.manuscriptcentral.com/tprs Email: [email protected]
International Journal of Production Research
123456789101112131415161718192021222324252627282930313233343536373839404142434445464748495051525354555657585960

For Peer Review O
nly
8
Table 6. Perceived user friendliness for the respective inventory management policy Inventory position Inventory
management
policy
Inventories in manufacturing
operations
Inventories in distribution
operations F- statistics
1
Re-order point
method 4.53 (1.11) 4.49 (1.31) 0.04
Fixed order
interval method 4.14 (1.25) 4.11 (1.49) 0.94
Run-out time
planning 4.73 (1.24) 4.13 (1.88) 0.11
Kanban 5.05 (1.41) 4.50 (2.22) 0.30
MRP 4.44 (1.24)
4.55 (1.14) 0.72
Note: 1 t tests between stocks in manufacturing operations and stocks in distribution operations.
Page 43 of 50
http://mc.manuscriptcentral.com/tprs Email: [email protected]
International Journal of Production Research
123456789101112131415161718192021222324252627282930313233343536373839404142434445464748495051525354555657585960

For Peer Review O
nly
9
Table 7. Perceived operational performance for the respective inventory management
policy Inventory position Inventory
management
policy
Inventories in manufacturing
operations
Inventories in distribution
operations F- statistics
1
Re-order point
method 3.90 (1.29) 4.18 (1.32) 1.31
Fixed order
interval method 3.85 (1.09) 3.29 (1.65) 1.50
Run-out time
planning 4.67 (1.21) 4.29 (1.44) 0.09
Kanban 4.84 (1.22) 4.40 (1.71) 1.01
MRP 4.51 (1.37)
4.24 (1.41) 0.69
Note: 1 t tests between stocks in manufacturing operations and stocks in distribution operations.
Page 44 of 50
http://mc.manuscriptcentral.com/tprs Email: [email protected]
International Journal of Production Research
123456789101112131415161718192021222324252627282930313233343536373839404142434445464748495051525354555657585960

For Peer Review O
nly
10
Table 8. Number and percentages of method and main method users with different
company sizes Company size Inventory
management policy
Small and medium
# (%)
Large
# (%)
Chi-square
Method users:
1. Re-order point
method
43 (63%) 85 (65%) 0.01
2. Fixed order interval
method
13 (19%) 12 (9%) 3.61*
3. Run-out time
planning
14 (21%) 33 (25%) 0.37
4. Kanban 22 (32%) 40 (31%) 0.06
5. MRP 40 (59%) 95 (73%) 1.15
Main method users:
1. Re-order point
method
36 (53%) 46 (35%) 3.58*
2. Fixed order interval
method
9 (13%) 17 (13%) 0.01
3. Run-out time
planning
5 (7%) 13 (10%) 0.31
4. Kanban 5 (7%) 13 (10%) 0.31
5. MRP 32 (47%) 86 (66%) 2.50
Note: No difference was significant on the p<0.05 level. * indicates differences that are
significant on the p<0.06 level.
Page 45 of 50
http://mc.manuscriptcentral.com/tprs Email: [email protected]
International Journal of Production Research
123456789101112131415161718192021222324252627282930313233343536373839404142434445464748495051525354555657585960

For Peer Review O
nly
11
Table 9. Perceived user friendliness and operational performance in general and in different
company sizes
Perceived user friendliness in different company sizes
Inventory
management policy
Small and
medium
Large F-statistics1
All
companies
1. Re-order point
method
4.55 (1.16) 4.48 (1.81) 0.10 4.52 (1.16)
2. Fixed order
interval method
3.89 (1.57) 4.30 (1.15) 0.96 4.12 (1.35)
[4]
3. Run-out time
planning
4.35 (1.27) 4.69 (1.24) 0.06 4.57 (1.25)
4. Kanban 5.00 (1.64) 4.94 (1.49) 0.03 4.97 (1.53)
[2]
5. MRP 4.43 (1.34) 4.48 (1.20) 0.06 4.46 (1.22)
F-statistics2 3.50**
Perceived operational performance in different company sizes
Small and
medium
Large F-statistics1
All
companies
1. Re-order point
method
4.10 (1.24) 3.91 (1.33) 0.73 3.97 (1.30)
[4,5]
2. Fixed order
interval method
3.50 (1.67) 3.67 (1.16) 0.13 3.59 (1.38)
[4,5]
3. Run-out time
planning
4.28 (1.23) 4.43 (1.36) 0.16 4.38 (1.30)
4. Kanban 4.50 (1.41) 4.89 (1.25) 1.41 4.78 (1.30)
[1,2]
5. MRP 4.35 (1.40) 4.51 (1.36) 0.41 4.47 (1.37)
[1,2]
F-statistics2 7.55**
Note: 1 t tests between small/medium and large sized companies.
2 ANOVA tests between different material
planning methods, without considering company size. *Significant on p<0.01 level; **Significant on p<0.05
level.
Page 46 of 50
http://mc.manuscriptcentral.com/tprs Email: [email protected]
International Journal of Production Research
123456789101112131415161718192021222324252627282930313233343536373839404142434445464748495051525354555657585960
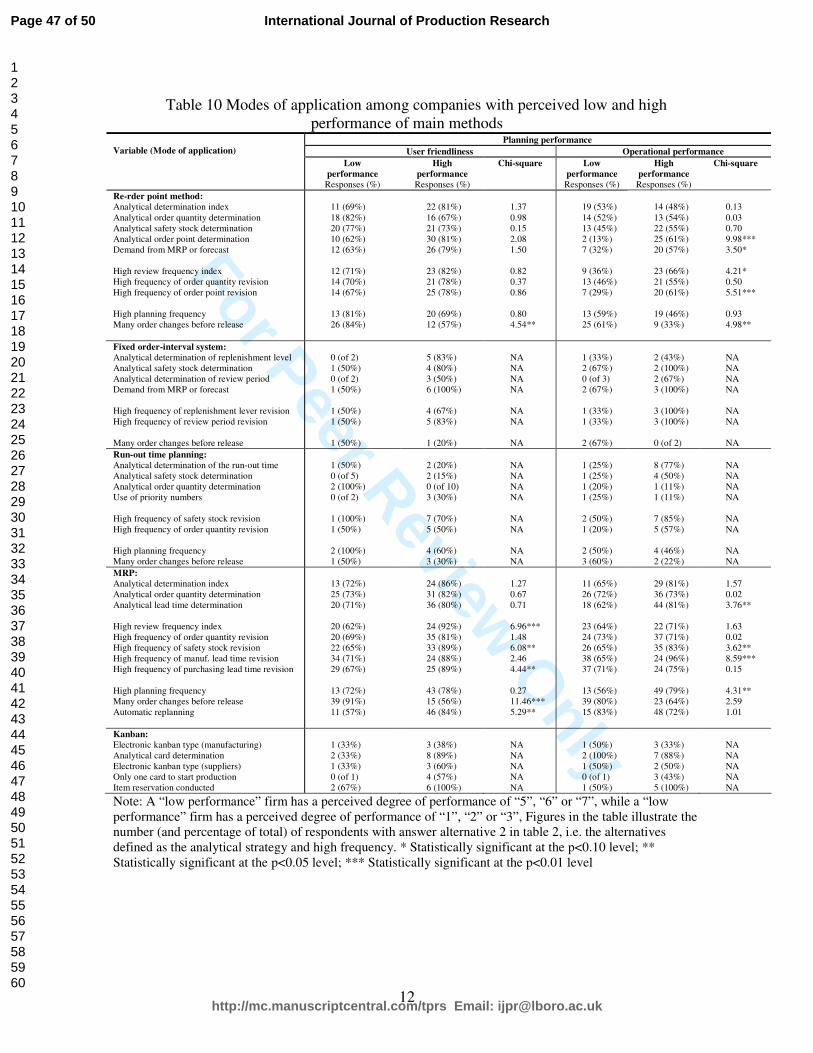
For Peer Review O
nly
12
Table 10 Modes of application among companies with perceived low and high
performance of main methods Planning performance
User friendliness Operational performance
Variable (Mode of application)
Low
performance
Responses (%)
High
performance
Responses (%)
Chi-square Low
performance
Responses (%)
High
performance
Responses (%)
Chi-square
Re-rder point method:
Analytical determination index
Analytical order quantity determination
Analytical safety stock determination
Analytical order point determination
Demand from MRP or forecast
High review frequency index
High frequency of order quantity revision
High frequency of order point revision
High planning frequency
Many order changes before release
11 (69%)
18 (82%)
20 (77%)
10 (62%)
12 (63%)
12 (71%)
14 (70%)
14 (67%)
13 (81%)
26 (84%)
22 (81%)
16 (67%)
21 (73%)
30 (81%)
26 (79%)
23 (82%)
21 (78%)
25 (78%)
20 (69%)
12 (57%)
1.37
0.98
0.15
2.08
1.50
0.82
0.37
0.86
0.80
4.54**
19 (53%)
14 (52%)
13 (45%)
2 (13%)
7 (32%)
9 (36%)
13 (46%)
7 (29%)
13 (59%)
25 (61%)
14 (48%)
13 (54%)
22 (55%)
25 (61%)
20 (57%)
23 (66%)
21 (55%)
20 (61%)
19 (46%)
9 (33%)
0.13
0.03
0.70
9.98***
3.50*
4.21*
0.50
5.51***
0.93
4.98**
Fixed order-interval system:
Analytical determination of replenishment level
Analytical safety stock determination
Analytical determination of review period
Demand from MRP or forecast
High frequency of replenishment lever revision
High frequency of review period revision
Many order changes before release
0 (of 2)
1 (50%)
0 (of 2)
1 (50%)
1 (50%)
1 (50%)
1 (50%)
5 (83%)
4 (80%)
3 (50%)
6 (100%)
4 (67%)
5 (83%)
1 (20%)
NA
NA
NA
NA
NA
NA
NA
1 (33%)
2 (67%)
0 (of 3)
2 (67%)
1 (33%)
1 (33%)
2 (67%)
2 (43%)
2 (100%)
2 (67%)
3 (100%)
3 (100%)
3 (100%)
0 (of 2)
NA
NA
NA
NA
NA
NA
NA
Run-out time planning:
Analytical determination of the run-out time
Analytical safety stock determination
Analytical order quantity determination
Use of priority numbers
High frequency of safety stock revision
High frequency of order quantity revision
High planning frequency
Many order changes before release
1 (50%)
0 (of 5)
2 (100%)
0 (of 2)
1 (100%)
1 (50%)
2 (100%)
1 (50%)
2 (20%)
2 (15%)
0 (of 10)
3 (30%)
7 (70%)
5 (50%)
4 (60%)
3 (30%)
NA
NA
NA
NA
NA
NA
NA
NA
1 (25%)
1 (25%)
1 (20%)
1 (25%)
2 (50%)
1 (20%)
2 (50%)
3 (60%)
8 (77%)
4 (50%)
1 (11%)
1 (11%)
7 (85%)
5 (57%)
4 (46%)
2 (22%)
NA
NA
NA
NA
NA
NA
NA
NA
MRP:
Analytical determination index
Analytical order quantity determination
Analytical lead time determination
High review frequency index
High frequency of order quantity revision
High frequency of safety stock revision
High frequency of manuf. lead time revision
High frequency of purchasing lead time revision
High planning frequency
Many order changes before release
Automatic replanning
13 (72%)
25 (73%)
20 (71%)
20 (62%)
20 (69%)
22 (65%)
34 (71%)
29 (67%)
13 (72%)
39 (91%)
11 (57%)
24 (86%)
31 (82%)
36 (80%)
24 (92%)
35 (81%)
33 (89%)
24 (88%)
25 (89%)
43 (78%)
15 (56%)
46 (84%)
1.27
0.67
0.71
6.96***
1.48
6.08**
2.46
4.44**
0.27
11.46***
5.29**
11 (65%)
26 (72%)
18 (62%)
23 (64%)
24 (73%)
26 (65%)
38 (65%)
37 (71%)
13 (56%)
39 (80%)
15 (83%)
29 (81%)
36 (73%)
44 (81%)
22 (71%)
37 (71%)
35 (83%)
24 (96%)
24 (75%)
49 (79%)
23 (64%)
48 (72%)
1.57
0.02
3.76**
1.63
0.02
3.62**
8.59***
0.15
4.31**
2.59
1.01
Kanban:
Electronic kanban type (manufacturing)
Analytical card determination
Electronic kanban type (suppliers)
Only one card to start production
Item reservation conducted
1 (33%)
2 (33%)
1 (33%)
0 (of 1)
2 (67%)
3 (38%)
8 (89%)
3 (60%)
4 (57%)
6 (100%)
NA
NA
NA
NA
NA
1 (50%)
2 (100%)
1 (50%)
0 (of 1)
1 (50%)
3 (33%)
7 (88%)
2 (50%)
3 (43%)
5 (100%)
NA
NA
NA
NA
NA
Note: A “low performance” firm has a perceived degree of performance of “5”, “6” or “7”, while a “low
performance” firm has a perceived degree of performance of “1”, “2” or “3”, Figures in the table illustrate the
number (and percentage of total) of respondents with answer alternative 2 in table 2, i.e. the alternatives
defined as the analytical strategy and high frequency. * Statistically significant at the p<0.10 level; **
Statistically significant at the p<0.05 level; *** Statistically significant at the p<0.01 level
Page 47 of 50
http://mc.manuscriptcentral.com/tprs Email: [email protected]
International Journal of Production Research
123456789101112131415161718192021222324252627282930313233343536373839404142434445464748495051525354555657585960

For Peer Review O
nly
13
Table 11. Managerial issues and guidelines related to planning phases
Phase Issue Guideline
1. Matching method and
planning environment
Inventory types • Re-order point methods are
appropriate methods for control of
material flows in distribution
operations inventories (finished
products and spare parts).
• MRP is the main method for
controlling inventories of
manufactured semi-finished items
with dependent demand and for
purchased items but re-order point
and especially kanban methods
could perform well if used for items
with appropriate characteristics.
• MRP and kanban have higher
general planning performance for
controlling inventories of semi-
finished goods compared to re-
order point and fixed order interval
methods.
2. Designing material
planning methods
Critical
parameters • For re-order point methods the
determination of re-order points and
safety stocks are critical for
achieving high perceived planning
performance
• For MRP the determination of lead
times and safety stocks are critical
for achieving high perceived
planning performance
3. Using material planning
methods
Critical
strategies • High review frequency of the
critical parameters is important for
achieving high perceived planning
performance.
• For MRP high planning frequency
is also important for achieving high
perceived planning performance.
• It is important to fine tune the
planning system so that only a
minority of the order suggestions
need to be modified before release
and that no “unnecessary”
modification is done.
Page 48 of 50
http://mc.manuscriptcentral.com/tprs Email: [email protected]
International Journal of Production Research
123456789101112131415161718192021222324252627282930313233343536373839404142434445464748495051525354555657585960

For Peer Review O
nly
FIGURES
Figure 1. The proposed relationships between inventory types, manufacturing planning
environment, planning parameters, planning frequency and planning performance.
Page 49 of 50
http://mc.manuscriptcentral.com/tprs Email: [email protected]
International Journal of Production Research
123456789101112131415161718192021222324252627282930313233343536373839404142434445464748495051525354555657585960

For Peer Review O
nly
1
Figure 1. The proposed relationships between inventory types, manufacturing planning
environment, planning parameters, planning frequency and planning performance.
Planning parameters
-Analytical determination
Way of using methods
-Review frequency
-Planning frequency
-Order modification
-Automativ re-planning
Planning performance
-User friendliness
-Operational performanceModes of applying method
Inventory of
purchased items
Inventory of
semi-finished
items
Inventory in
distribution
operations
Inventory types and manufacturing environment
Page 50 of 50
http://mc.manuscriptcentral.com/tprs Email: [email protected]
International Journal of Production Research
123456789101112131415161718192021222324252627282930313233343536373839404142434445464748495051525354555657585960


![The Impact of Lean Practices on Value to Customer · 2018-12-07 · The Impact of Lean Practices on Value to Customer 57 assembly & continuous fl ow]) and inventory strategy (make-to-order](https://img.dokumen.tips/doc/110x75/5f41ce5d377731442c44411c/the-impact-of-lean-practices-on-value-to-customer-2018-12-07-the-impact-of-lean.jpg)