Embed Size (px)
Citation preview

93
Int. J. Mech. Eng. & Rob. Res. 2013 V M Nistane and Srinivas Viswanath V, 2013
INVENTORY CONTROL BY TOYOTA PRODUCTIONSYSTEM KANBAN METHODOLOGY—A CASE
STUDY
V M Nistane1* and Srinivas Viswanath V1
*Corresponding Author: V M Nistane,[email protected]
In this paper, a single-item, multi-stage, sequential production system is considered. Materialsin the system are controlled by Kanban discipline. And total number of Kanbans over a givennumber of serial workstations is allocated. Three main objectives, the average throughput rate(to be maximized), the average workin-process (to be minimized), machine idle time should bereduced due to lack of material are considered. We provide the optimal inventory control policyand characterize its structural properties for the single-period model. Through an extensivenumerical study, we demonstrate that applied Toyota methodology policy is sufficiently accurateand close to optimal.
Keywords: average inventory; Inventory management; Toyota Production System TPS,KANBAN
INTRODUCTIONThere is a real problem facing by bearingindustry in deciding how to distribute bufferspace to reach or maintain throughput, yetreduce the work-in-process (WIP) and flowtime. One has to decide on the trade-ofbetween these factors. Traditionally this hasbeen done by using WIP inventory holdingcosts and lost order costs. We consider asingle-item, multi-stage, serial productionsystem. Kanban storage between sequentialworkstations is needed to support the smooth
ISSN 2278 – 0149 www.ijmerr.comVol. 2, No. 1, January 2013
© 2013 IJMERR. All Rights Reserved
Int. J. Mech. Eng. & Rob. Res. 2013
1 Department of Mechanical Engineering, Visveswaraya National Institute of Technology (VNIT), Nagpur, India.
operation of manufacturing. A high throughputrate is often achieved at the cost of a largeWIP, an undesirable relationship in today’smanufacturing world. The paper is the firstattempt to study and analyze the impacts offree shipping and free shipping quantity oninventory control policies. We focus on: (1)presenting structural analysis of optimalinventory policies, (2) proposing effectiveheuristic policies for multi-period inventorysystems, and (3) quantifying the impacts of freeshipping option and key parameters of the
Research Paper
94
Int. J. Mech. Eng. & Rob. Res. 2013 V M Nistane and Srinivas Viswanath V, 2013
model. We conduct an extensivecomputational study and show that the heuristicpolicy is sufficiently accurate and it providesclose-to-optimal solutions A Industrial Engineermust assess both the benefits from throughputand the cost of average work-in-process andthe average flow time, before reaching anyconclusions about increasing the throughputrate. Clearly, managers must consider theintangible costs of WIP, in order to makedecisions that give a desirable balancebetween average throughput rate, averageWIP and machine idle time. These costsinclude an increase in flow time. Theobscuration of problems such as machinedowntime and excessive setup times by WIP;quality effects; and, costs due to lostthroughput such as lost orders if demand ishigh.
LITERATURE REVIEWKanban, a technique for work and inventoryrelease, is a major component of Just-in-Time(JIT) and Lean Manufacturing philosophy.Kanban was originally developed at Toyota inthe1950’s as a way to manage material flowon the assembly line. Over the last threedecades, the Kanban process—a highlyefficient and effective factory productionsystem—has become a widely used tool in themanufacturing environment and globalcompetition.
Kanban stands for Kan- card, Ban- signal.The essence of the Kanban concept is that asupplier, The warehouse or the manufacturershould deliver components only when they areneeded so that there is no excess inventory.Within this system, workstations located alongproduction lines only produce or deliver
desired components when they receive a cardand an empty container, which indicates thatmore parts are needed in production.
In case of line interruptions, measures aretaken so that each workstation will only produceenough components to fill the container andthen stop. Kanban also limits the amount ofinventory in the process by acting as anauthorization to produce more inventories.Since Kanban is a chain process in whichorders flow from one process to another, theproduction or delivery of components is pulledthrough the production line, in contrast to thetraditional forecast-oriented method whereparts are pushed.
Advantages of Kanban Processing
• Provides quick and precise information
• Provides quick response to changes
• Avoids overproduction
• Minimizes waste
• Maintains full control
• Delegates responsibility to line workers
Through numerical studies, they show thatthe performance of the proposed Toyota policyis very close to that of the optimal policy and itsignificantly outperforms the policy undergeneral conditions. In this paper, we considera different and more complicated problemwhere the inventory system involves an orderquantity requirement, a fixed cost as well as abalanced inventory.
PROBLEM IDENTIFICATIONThe problem of 10 to 15% rise in WIP inventoryfor JC 8037 Cylindrical type of Bearing wasreported by the higher-up of the company whichwas a starting point for the project. Therefore

95
Int. J. Mech. Eng. & Rob. Res. 2013 V M Nistane and Srinivas Viswanath V, 2013
detailed study of the existing processes wasundertaken to quantify the exact rise of WIP,the cause and solution to remove thebottleneck. And moreover to control rawmaterials, bought out components andfinished goods of various bearings.
Study of Existing Process for theSelected Bearing
The company manufactures so many differenttypes and ranges of bearings which have been
discussed in the previous section, out of whichfollowing bearings have the more requirement.
• JC 8037
• JC 8038
• JC 8033
For study of the process Bill of Material(BOM) is very important. The following Table 1shows the BOM for the above mentionedcomponents.
Bearing Description Component Description Component Qty
JC8037 6X12LP ROLERS-CRB 1.000
JC 8037 INNER RINGSCRB 1.000
JC8037 CRB MACHINED CAGESSTEEL (Drg. No. 3CA-196)
JC8037 OUTER RINGSCRB 14.000
JC8038 6X12LP ROLERS-CRB 15.000
JC8037 INNER RINGSCRB 1.000
JC8037 CRB MACHINED CAGESSTEEL (Drg. No. 3CA-196)
JC8037 OUTER RINGSCRB 1.000
JC8033 6X12LP ROLERS-CRB 15.000
JC8037 INNER RINGSCRB 1.000
JC8037 CRB MACHINED CAGESSTEEL (Drg. No. 3CA-196)
JC8037 OUTER RINGSCRB 1.000
Table 1: BOM for the Selected Bearings
Above Figure 1 shows varies componentsfor the JC 8037. Outer ring, cage and needlesare the components for this type of bearing.
Cage and needles are produced in theinterplant and outer ring is manufactured in-house. So for outer ring we need to giveoperation scheduling for which we must knowthe material flow.
Block Diagram of ManufacturingProcess of CRB TypeMaterial flow diagram shows various workstations along with machines, efficiency of themachine, cycle time and change over time.
Figure 1: Components of JC 8037/8038Type Bearing
Note: JC = Jeau Circumferential (Gap between 1st and LastNeedle).

96
Int. J. Mech. Eng. & Rob. Res. 2013 V M Nistane and Srinivas Viswanath V, 2013
After study of the manufacturing linefollowing problems were observed.
• Increase in WIP inventory.
• Less utilization of available resources.
• Use of push system only.
The purpose of this project work is thereforeto develop a mathematical model which givesoptimized scheduling for a bearingsmanufacturing, identify wastes and makerecommendations for improvement.
WIP Was IncreasingFrom the collected data of month wise WIPinventory for the three types of selectedbearings as shown in the following Table 2 it isobserved that the WIP inventory is above thetargeted 6 days WIP inventory level as per thecompany standards.
As company was following 80/20 PQanalysis according to which 20% ofcomponents will contribute 80% of productionsuch as nearly 135 varieties of bearings for
Figure 2: Material Flow Diagrams for the OUTER RING JC 8037
Figure 3: PQ Analysis for the CRB Bearings

97
Int. J. Mech. Eng. & Rob. Res. 2013 V M Nistane and Srinivas Viswanath V, 2013
Table 2: WIP Inventory for Selected Components
Month-Wise Inventory Days of WIP on Shop Floor
Month JC 8037 Outer JC 8037 Inner JC 8038/33B
June 8.10 8.01 10.23
July 8.15 8.25 9.98
August 8.14 9.98 9.68
September 8.05 8.95 9.56
October 8.20 10.23 9.12
November 7.90 8.95 9.01
December 8.15 8.93 8.99
January 8.01 8.64 8.82
Figure 4: WIP Inventory for the JC 8037 Outer Ring in Days
Figure 5: WIP Inventory for the JC 8037 Inner Ring in Days
98
Int. J. Mech. Eng. & Rob. Res. 2013 V M Nistane and Srinivas Viswanath V, 2013
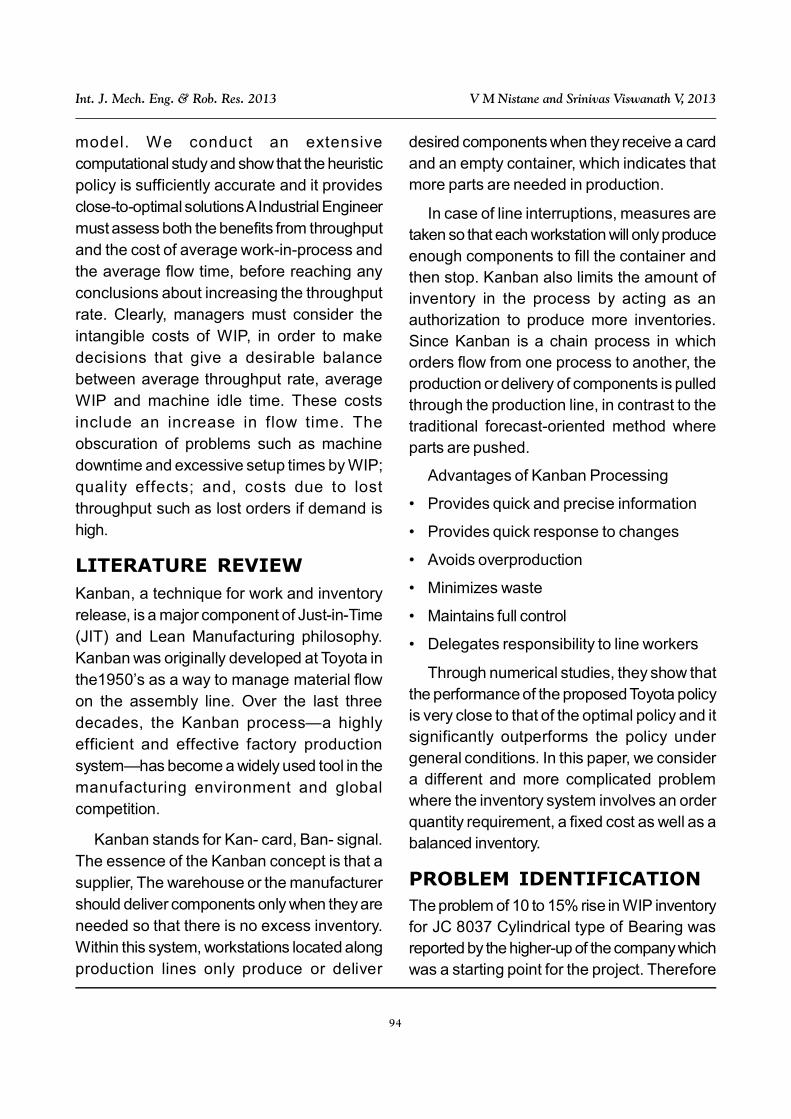
cylindrical roller bearings only 7 (seven)runners are there and remaining all varietiesare strangers. Here that is reason why we areconcentrating on Runner type components thatis JC8037/ JC 8038/JC 8038 B.
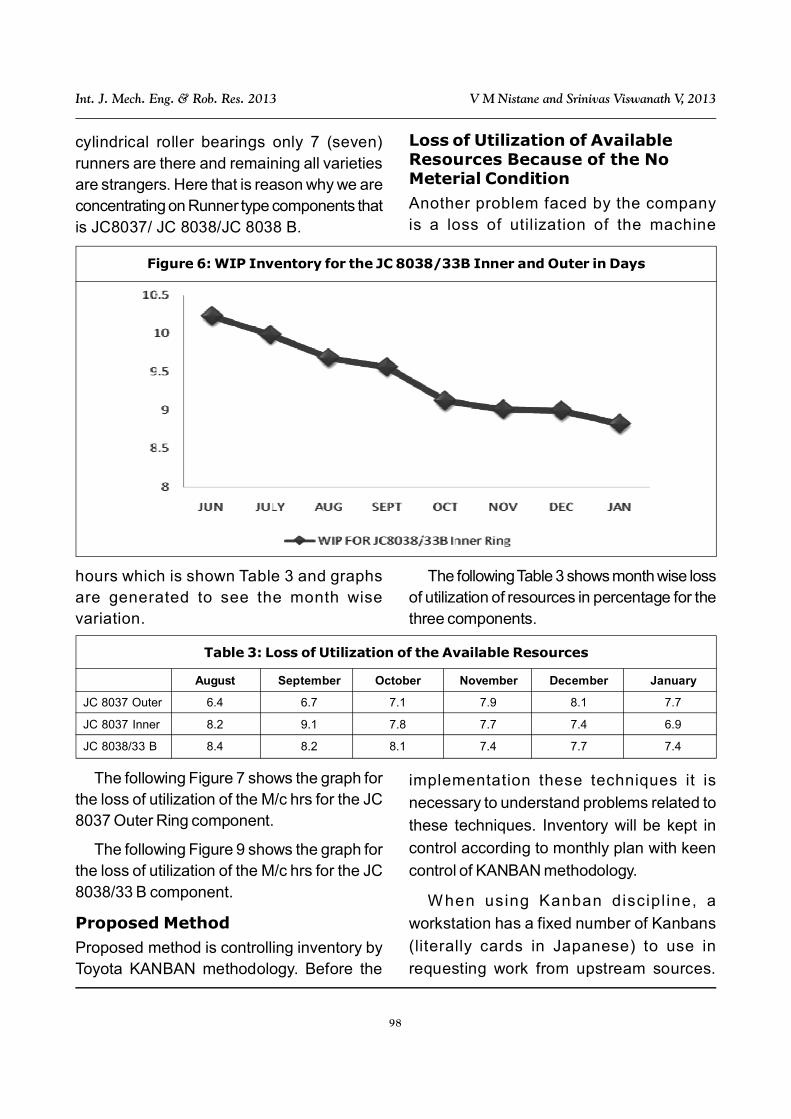
Loss of Utilization of AvailableResources Because of the NoMeterial Condition
Another problem faced by the companyis a loss of utilization of the machine
Figure 6: WIP Inventory for the JC 8038/33B Inner and Outer in Days
hours which is shown Table 3 and graphsare generated to see the month wisevariation.
The following Table 3 shows month wise lossof utilization of resources in percentage for thethree components.
August September October November December January
JC 8037 Outer 6.4 6.7 7.1 7.9 8.1 7.7
JC 8037 Inner 8.2 9.1 7.8 7.7 7.4 6.9
JC 8038/33 B 8.4 8.2 8.1 7.4 7.7 7.4
Table 3: Loss of Utilization of the Available Resources
The following Figure 7 shows the graph forthe loss of utilization of the M/c hrs for the JC8037 Outer Ring component.
The following Figure 9 shows the graph forthe loss of utilization of the M/c hrs for the JC8038/33 B component.
Proposed Method
Proposed method is controlling inventory byToyota KANBAN methodology. Before the
implementation these techniques it is
necessary to understand problems related to
these techniques. Inventory will be kept in
control according to monthly plan with keen
control of KANBAN methodology.
When using Kanban discipl ine, a
workstation has a fixed number of Kanbans
(literally cards in Japanese) to use in
requesting work from upstream sources.

99
Int. J. Mech. Eng. & Rob. Res. 2013 V M Nistane and Srinivas Viswanath V, 2013
Figure 7: Loss of Utilization of AvailableResource for the JC 8037 Outer Ring
in Percentage
Figure 8: Loss of Utilization of AvailableResource for the JC 8037 Inner Ring in
Percentage
Figure 9: Loss of AMchine Utilized Hoursfor JC8037/38/33
Once an item arrives, the requesting Kanbanis attached to the work unit until it leaves thework station. At that time, the work stationcan use the Kanban to request more itemsfrom upstream sources. This is referred toas a Kanban discipline by Mitra and Mitrani.Kanban discipline constitutes a—flexiblesystem that promotes close coordinationamong workstat ions in repetit ivemanufacturing. The goal of the Kanbansystem is to achieve a total invisibleconveyor system connecting all the externaland internal processes. The number ofKanbans at a workstation determines itsoutput buffer size.
Assumptions and Conditions
The following assumptions are used for allmodels:
• There is a single class (type) of items.
• The first workstation never waits for materialon which to work (an unlimited availabilityof raw materials).
• The last workstation never waits for demand(there is unlimited finished goods storagecapability).
• There is a single machine per workstation.
• There is no transportation time betweenworkstations.
Demand on average must be bigger thanor equal to the average throughput.
METHODOLOGYMathematical Model
As discussed earlier in the previous chapterthe manufacturing process WIP inventory wasincreasing and there was increase in the lossof utilization of resources as well. So there is

100
Int. J. Mech. Eng. & Rob. Res. 2013 V M Nistane and Srinivas Viswanath V, 2013
a need of proper scheduling technique whichtakes care of this problem.
The Gantt charts can be one of thetechniques to tackle this problem but theproblem with the technique is that it is a slowand time consuming process (Scarf, 1960).Each and every time we need to charts andalso beyond a certain limit of time span it isdifficult to read the charts. As the number ofoperations or number of batches in thescheduling increases in order toaccommodate the larger time span either theGantt charts have to be huge or the resolutionhas to be sacrificed. If there is a mathematicaltool by which we can solve the abovediscussed problem then it will be much easierto get the schedule.
Inventory has problems. Too many kanbansindicate excess in-process inventory. By
reducing the number of kanbans, problemsarea will come out of hiding so that they canbe improved. In this way the kanban systembecomes a valuable means to drive out wasteand continually improve the production system.
The proposed technique requires the dailyattainment of the track grinding that is the lastoperation of manufacturing process. Here thelogic of process is reverse type of process,i.e., last process requests number of parts forbefore process. The same amount of parts areprepared and sent, no excess parts are send.So inventory levels are balanced and noexcessive stocks are maintained.
Mathematical Model FormulationLogicThe main assumption here is daily attainmentfor the TG is 3500 components. Now followingsteps explain about other rows of the Table 4.
Day BGTG ODG FG SB Heat GS Total Inventory
1 3536 0 3438 – 30000 – 37974
2 3555 – 8000 – 22000 – 33555
3 3495 8000 – – 14000 – 25495
4 3668 0 8000 – 6000 – 17668
5 3778 0 0 – 36000 – 39778
6 3356 0 0 – 28000 – 31356
7 3669 8000 0 – 20000 – 31669
Average Inventory 29702
Table 4: WIP Inventory
• On 1st day WIP is 3438 at FG and 3536 atTG. Then total inventory is 37974 as shownin the last column of the row.
• On 2nd day, in TG column it shows the 3555because 3500 components the TGoperation is completed on 1st day. So totalinventory is now (13555 + 8000 + 22000) =33555. So on the 3rd day at ODG operation
remaining components are (11438 – 3438)= 8000 only.
• On 3rd day, in ODG operation it shows the8000 components which is less than thesafety stock. Then we need to increase thesafety stock for that we need to do HToperation for the components. That meanswe need to do 30000 components HT on

101
Int. J. Mech. Eng. & Rob. Res. 2013 V M Nistane and Srinivas Viswanath V, 2013
required for next day operation is beingproduced.
• On 7th day, there is 3500 components whichis less than the safety inventory level. So itis necessary to do another 8000 ODG
operation to fulfill the lack of safety inventorylevel.
So like this we can easily give the schedule.
In this mathematical model we need to givetrack grinding daily attainment only then we getthe operation scheduling for the day.
To Reduce Inventory Reduce Batch Sizes.
that day. Now inventory is (3595 + 8000 +14000 = 25495).
• On 4th day, there is no problem because atFG there are less components and normaldaily at track grinding components which aregreater than the safety inventory level.
• On 5th day at FG we have only 3500components which is less than the safetyinventory level. Therefore we need to do8000 components ODG operation on thatday.
• On 6th day, there is no problem becauseat ODG 8000 FG 8000 components
Figure 10: Calculation for Average Inventory Level
Calculation of Buffer Stock/Inventory Levels
The Kanban system supports level production.It helps to maintain stable and efficientoperations. The question of how manykanbans to use is a basic issue in tuning akanban system. If your factory makes productsusing mostly standard, repeated operations,
the number of kanbans can be determined
using the formula
K = DR * RT * (1 + )/NC
where,
DR = Daily Requirement (parts/day)
RT = Replenishment Time (days)
102
Int. J. Mech. Eng. & Rob. Res. 2013 V M Nistane and Srinivas Viswanath V, 2013
= Safety factor
NC = Number of parts per container
Inventory Level = [Daily ProductionRequirement * (1 + )] where = Safety
The number of kanbans you needdependent on the number of pallets orcontainers and their capacity. Lead times,safety margins or buffer inventory, andtransportation time for kanban retrieval are alsoimportant factors.
Several questions must be answered whendeciding the number of kanban to use.
• How many products can be carried on apallet?
• How many transport lots are needed, giventhe frequency of transport?
• Will a single product or mixed products betransported?
1. Production must be done is small lots.Reduce setup times to a minimum Cut leadtime to a minimum.
2. Buffer stocks that are kept as safetymargins against market fluctuations andproduction instability must eventually beeliminated. Short setup times make itpossible to respond quickly to change. AShort production cycle allows you to reducethe number of kanbans to the minimum sincereliable information about changes areeasily accessible and the system respondsrapidly.
Inventory Level
Inventory level is very important in between theprocess. That is also called as safety stocklevel which is calculated as below.
Inventory Level = [Daily ProductionRequirement * (1 + )]
Daily Production requirement for JC 8037Outer Ring = 4000 components
According to monthly plan
If safety factor = 1,
Inventory level for
JC 8037 Outer Ring = DR * (1 + )
= 4000 * (1 + 1) = 8000.
This inventory or safety stock keeping inbetween the process that is just before the TGand ODG operation.
Here it is to recognize that reverse processof maintaining inventory as safety stock levelbetween intermediate departments.Tomorrows’ stock requirements only will beprepared today and today’s requirement is onlyprepared yesterday. Here that is majorprinciple of material flow on shop floor.
• Inventory Level = [Daily ProductionRequirement * Replenishment time *(1 + )]
• Daily Production requirement for JC 8037= (57000/27) 2000
• Daily req. for JC 8037=2000
If safety factor = 1,
Inventory level for
JC 8037(RT = 7 days, lot size = 2000,batch size = 6000)
= DR * RT* (1 + )
= 2000 * 7 * (1 + 1)
= 28000
= 1, means safety stock for one day

103
Int. J. Mech. Eng. & Rob. Res. 2013 V M Nistane and Srinivas Viswanath V, 2013
IMPLEMENTATION PHASEAction Plan
In this section action plan has been discussed.
To Decide Kanban Methodology
After study of the existing process it was foundthat maximum inventory and lack of utilizationof available resources is with productionprocess. In the process of production WIPinventory was increasing more so to avoid thisit was decided to implement ToyotaProduction System KANBAN Methodology.
Monitoring Phase
Having implemented Toyota Methodology thenext most important step is to monitor the flowof materials. This step is important so as toknow whether an Just In Time, Toyotaimplementation is successfully running or not.This step is started from January 2009onwards.
Steps at Monitoring Phase• Daily production fulfillments according to
Monthly plan
• Attend daily Production Meeting
• Update Current status of Notice Board
• Attend breakdown and know the root cause
• Calculation of WIP inventory at starting ofevery month.
Present Proposed Method toManagement and Decide FurtherActionAbove results were presented to themanagement for taking further steps. To getproposed method green signal present it tothem those will get affected by this improvedmethod. Take every problem for discussionwith team and after answering it design the
solution on paper and gather necessary toolsto implement these solution. Getting proposalfrom top management is major thing it dependon understanding solution designed and howthat can solve the problem associated with theexisting process.
RESULTSAfter implementation of in Toyota Productionsystem TPS, the process was monitoredrigorously and the following results areachieved.
Reduction of WIP Inventory withSame OutputAfter implementation of Toyota Productionsystem TPS, WIP Inventory reduced by
• 15% for the component of the JC 8037Outer Ring,
• 12% for the component of the JC 8037 InnerRing,
• 15% for the JC 8038/33 B family ofcylindrical bearings.
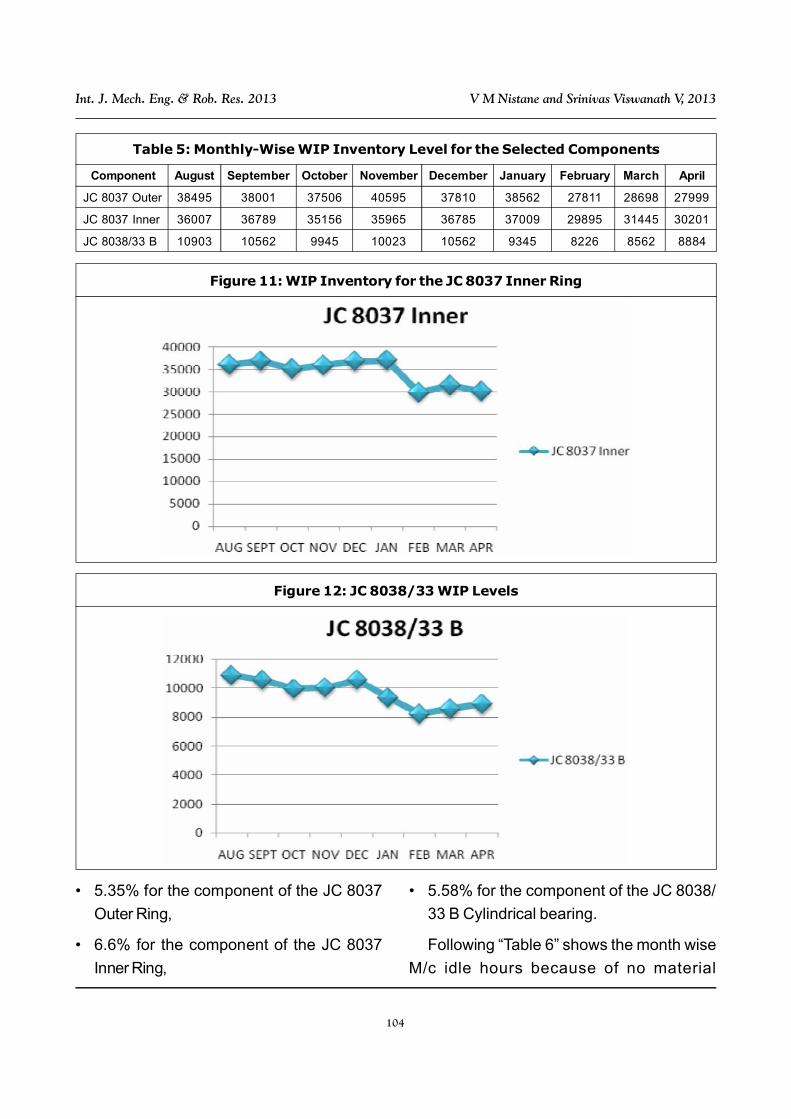
Following Table 5 shows the month wiseWIP inventory level for the Cylindrical bearingsfamily members.
Following Table 6 shows the comparison ofaverage of six months WIP inventory beforeimplementation and average of three monthsWIP inventory after implementation of the
Following Figure 12 shows how the variationhas taken in WIP inventory level for thecylindrical Bearings JC 8038/33 B
Utilization of Available ResourcesAfter implementation of integrated ToyotaKANBAN methodology the better utilization ofnumber of days, effective utilization manpowerhas been obtained.
104
Int. J. Mech. Eng. & Rob. Res. 2013 V M Nistane and Srinivas Viswanath V, 2013
Component August September October November December January February March April
JC 8037 Outer 38495 38001 37506 40595 37810 38562 27811 28698 27999
JC 8037 Inner 36007 36789 35156 35965 36785 37009 29895 31445 30201
JC 8038/33 B 10903 10562 9945 10023 10562 9345 8226 8562 8884
Table 5: Monthly-Wise WIP Inventory Level for the Selected Components
Figure 11: WIP Inventory for the JC 8037 Inner Ring
Figure 12: JC 8038/33 WIP Levels
• 5.35% for the component of the JC 8037
Outer Ring,
• 6.6% for the component of the JC 8037
Inner Ring,
• 5.58% for the component of the JC 8038/
33 B Cylindrical bearing.
Following “Table 6” shows the month wise
M/c idle hours because of no material
105
Int. J. Mech. Eng. & Rob. Res. 2013 V M Nistane and Srinivas Viswanath V, 2013
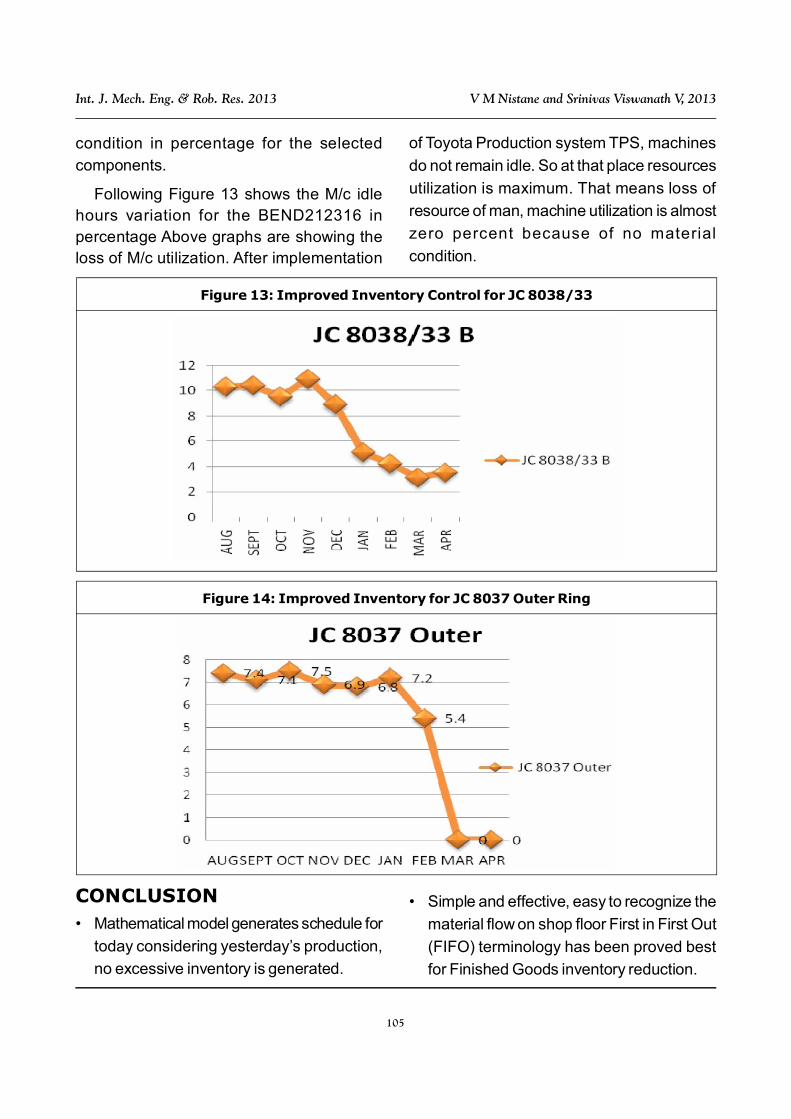
condition in percentage for the selectedcomponents.
Following Figure 13 shows the M/c idlehours variation for the BEND212316 inpercentage Above graphs are showing theloss of M/c utilization. After implementation
of Toyota Production system TPS, machines
do not remain idle. So at that place resources
utilization is maximum. That means loss of
resource of man, machine utilization is almost
zero percent because of no material
condition.
Figure 13: Improved Inventory Control for JC 8038/33
Figure 14: Improved Inventory for JC 8037 Outer Ring
CONCLUSION• Mathematical model generates schedule for
today considering yesterday’s production,
no excessive inventory is generated.
• Simple and effective, easy to recognize the
material flow on shop floor First in First Out
(FIFO) terminology has been proved best
for Finished Goods inventory reduction.

106
Int. J. Mech. Eng. & Rob. Res. 2013 V M Nistane and Srinivas Viswanath V, 2013
• WIP inventory reduced by 15% for the JC8037 Outer Ring of Cylindrical variety.
– 12% for the JC 8037 Inner Ring ofCylindrical variety,
– 32% for the JC 8038/33B variety ofBearings.
• Loss of resources man, machine utilizationreduced by:
– 7.1% for the JC 8037 Outer Ring ofCylindrical variety,
– 6.5% for the JC 8037 Inner Ring ofCylindrical variety,
– 6.7% for the JC 8038/33B variety ofbearings.
• Process flow has resulted in drasticreduction in inventory levels and hasfacilitated a smooth flow of operations dueto its online supply chain and shop floorexecution communication capability.
• In summary, time-advantaged companiesenjoy one or more of the following benefits,relative to their peers: increased productivity;pricing flexibility; reduced risks; reduced costsand increased response capability.
REFERENCES1. Altiok T (1996), “Performance Analysis of
Manufacturing Systems”, Springer Seriesin Operations Research, pp. 188-336.
2. Altiok T and Ranjan R (1995), “Multi-StagePull Type Production/Inventory Systems”,IIE Transactions, Vol. 27, pp. 190-200.
3. Heizer J and Render B (2001),Operations Management, 6th Edition,Upper Saddle River, New Jersey.
4. Law A M and Kelton W D (2003),Simulation Modeling and Analysis, TataMcGraw-Hill Publishing Company Ltd.,New Delhi.
5. Robb D J and Silver E A (1998), “InventoryManagement with Periodic Ordering andMinimum Order Quantities”, The Journalof the Operational Research Society,Vol. 49, pp. 1085-1094.
6. Ross S (1992), Applied ProbabilityModels with Optimization Applications,Dover, New York.
7. Scarf H (1960), “The Optimality of (s,S)Policies in the Dynamic InventoryProblem”, in Arrow K, Karlin S andSuppes P (Eds.), Mathematical Methodsin the Social Sciences, StanfordUniversity Press, Stanford.
8. Silver E, Pyke D and Peterson R (1998),Inventory Management and ProductionPlanning and Scheduling, Wiley, NewYork.