Embed Size (px)
Citation preview

COMMISSION OF THE EUROPEAN COMMUNITIES Programme on Community action on the prevention of AIDS and certain other communicable diseases DG SANCO Agreement No. VS/1999/3504 (99CVF4-031)
INVASIVE NEISSERIA MENINGITIDIS IN EUROPE – 2001
Project leaders: Dr Mary Ramsay and Prof Andrew Fox Scientific Co-ordinator: Sarah Handford
Communicable Disease Surveillance Centre Health Protection Authority 61 Colindale Ave, London, NW9 5EQ
Tel. +44-20-8200-6868 Fax. +44-20-8200-7868 Email: [email protected] July 2001

SUMMARY
Introduction The surveillance network for invasive meningococcal disease in Europe began in 1999 as part of the European Union Invasive Bacterial Infections Surveillance (EU-IBIS) project, building upon existing surveillance networks for bacterial meningitis in Europe. The aims of the network are to improve the epidemiological information on meningococcal disease in Europe, to improve the laboratory capacity to accurately characterise isolates of N. meningitidis and to form a focus for wider collaboration with non-EU countries. Methods Agreed usage of a minimum dataset and standard case definitions for N. meningitidis has enabled valid comparisons to be made of the disease epidemiology within Europe, and hence assist the monitoring of epidemiological changes. Information collected on the surveillance systems and the vaccination programme(s) in use by each participant country has also aided interpretation of the epidemiological analyses. Improvements in the laboratory capacity within the EU to accurately characterise N. meningitidis have been achieved through gaining information on systems in use by participants, and by undertaking an External Quality Assurance Scheme (EQAS) with the participant reference laboratories. The EQAS helped identify any existing problems in correctly serotyping N. meningitidis isolates, and will enable corrections/assistance in laboratory methods to be made, hence improving comparability of data between countries. Results In 2001 the incidence of reported culture-confirmed meningococcal disease varied between 0.2 and 6.5 per 100,000 across collaborating countries. This is likely to reflect both genuine differences in disease epidemiology and in ascertainment. In three countries, ascertainment of laboratory confirmed infection has been increased by around 100% following the introduction of PCR and it is likely that similar increases will be achieved in other countries when access to and awareness of PCR diagnosis improves. The burden of meningococcal disease is highest in young children, although in most countries a smaller, secondary peak in incidence is observed in teenagers. Serogroup B is the most common cause of invasive meningococcal disease in Europe, followed by serogroup C. The proportion of cases attributable to serogroup C disease is highly variable. Austria, Belgium and the Netherlands have experienced increases in the proportion of serogroup C disease between 1999 and 2001, whereas the proportion in England & Wales, Greece and Ireland has decreased following the implementation of serogroup C conjugate vaccine campaigns. Disease presentation is also highly variable throughout Europe and it is unclear whether this is due to reporting differences, or if there are genuine differences in presentation. The case-fatality rate is 6-7% on average, although this varies by age and serogroup. The range of CFR estimates are between 0 and 13%, suggesting that ascertainment of outcome is also an issue. Conclusions This project has demonstrated the successful development of existing networks towards the objective of providing high quality surveillance information on meningococcal infection in the European Union and neighbouring countries. The importance of the reference and diagnostic microbiology under-pinning this data cannot be over-emphasised. The laboratory questionnaire and the quality assurance scheme suggest that standards in reference laboratories in the EU are high.
2

CONTENTS SUMMARY .............................................................................................................................. 2 1. INTRODUCTION ............................................................................................................ 5
1.1 Project aims............................................................................................................. 5 2. METHODS ....................................................................................................................... 6 3. RESULTS......................................................................................................................... 7
3.1.1 Conjugate Meningococcal C vaccination programmes ....................................... 7 3.2 Laboratory Diagnostic Methods Questionnaire ....................................................... 7 3.3 Summary of case data received for 2001 ................................................................. 8 3.4 The epidemiology of invasive meningococcal disease in Europe............................ 8
3.4.1 Incidence of culture-confirmed cases .................................................................. 8 3.4.2 Incidence of PCR-confirmed cases.................................................................... 10 3.4.3 Age distribution of culture confirmed cases of invasive meningococcal disease 10 3.4.4 Incidence of meningococcal disease serogroup B, by year and agegroup......... 11 3.4.5 Incidence of meningococcal disease serogroup C, by year and agegroup......... 11 3.4.6 Age-specific incidence of group B and C infection by country......................... 12 3.4.7 Proportion of meningitis to septicaemia in culture-confirmed cases of invasive meningococcal disease,................................................................................................... 12 3.4.8 Distribution of serogroups in invasive meningococcal disease, ........................ 13 1999-2001 ....................................................................................................................... 13 3.4.9 Distribution of serotypes of group C and B meningococcal disease ................. 14 3.4.10 Overall case fatality rates .............................................................................. 14 3.4.11 Case fatality ratio by serogroup..................................................................... 14 3.4.12 Case fatality ratio by age for serogroup B and C infections by age .............. 14 3.4.13 Antibiotics resistance .................................................................................... 15
3.5 Impact of conjugate group C meningoccal disease vaccination programmes on the epidemiology of the disease ................................................................................................ 15 3.6 Rapid sentinel surveillance of W135 infection ...................................................... 17
4. CONCLUSIONS ............................................................................................................ 19 5. PROJECT ACHIEVEMENTS ....................................................................................... 22
5.1 Improvements in the epidemiological information on N. meningitidis within the EU . 22 5.2 Improvements in the laboratory capacity within the EU to accurately identify N. meningitidis isolates ............................................................................................................ 22 5.3 Forming a focus for wider collaboration with non European Union countries and candidate European Union countries .................................................................................. 22 APPENDIX 1: DATA TABLES......................................................................................... 24
3
Figure 1: Incidence of culture-confirmed meningococcal disease per 100,000 population ...... 9
Figure 2: Age distribution of culture-confirmed meningococcal disease in Austria, Belgium, Czech Republic, Denmark, England & Wales, Finland, France, Germany, Greece, Malta, Netherlands, Norway, Portugal and Spain: 1999, 2000, 2001........................................ 11
Figure 3: No. of culture-confirmed cases of invasive meningococcal disease serogroup C cases in countries with established conjugate group C meningococcal vaccine programmes (England & Wales, Ireland and Spain combined), by age group and year, 1999-2001 ....................................................................................................................... 16
Figure 4: No. of culture-confirmed invasive meningococcal disease serogroup C cases in EU-IBIS countries without established nationwide conjugate group C meningococcal vaccination programmes, by age group and year, 1999-2001. ....................................... 16
Figure 5: Proportion of culture-confirmed meningococcal disease serogroup C cases that are serotype P2.2a – 1999-2001............................................................................................ 17
Table i: Conjugate meningococcal group C vaccination programmes in the EU, as at January 2002. ................................................................................................................................. 7
Table ii: Incidence of culture-confirmed cases of invasive meningococcal disease by country, 2001. ................................................................................................................................. 9
Table iii: Proportion of cases due to serogroup C by country, 1999-2001.............................. 13
Table iv: Susceptibility of N. meningitidis to penicillin, by country: 2001............................. 15
Table v: Distribution of meningococcal disease caused by W135:2a:1.2,5 (or strains phenotypically compatible) in the 6 sentinel surveillance countries, by case status, from week 36 in 2000 to week 30 in 2002 inclusive. .............................................................. 18
Table vi: Distribution of cases of meningococcal disease caused by W135 strains compatible with W135:2a:1.2,5 in the six sentinel surveillance countries, by case status, in compatible periods in 2001 and 2002 (the 23 weeks following the Hajj) ...................... 18
4

1. INTRODUCTION
The European Commission Decision No. 2119/98/EC for setting up a network for the epidemiological surveillance and control of communicable diseases in the European Community stated that ‘bacterial meningitis’ was a priority. Invasive disease due to Neisseria meningitidis comes within this priority and this project has built on two surveillance networks that already exist within Europe. The European Monitoring Group on Meningococci (EMGM) is a consortium of reference microbiologists and epidemiologists working in Europe to exchange information on meningococcal infection. Secondly, a network for surveillance of bacterial meningitis in Europe was established in 1988 and is supported by commercial funding. This project aims to build on these networks, avoiding any duplication of activity, and to be in line with the Charter Group’s priorities of the EU Communicable Disease Network. Using the frameworks already established, a DG SANCO surveillance network for N. meningitidis disease was established in all 15 EU countries and 4 non-EU countries (2000-2001) to improve epidemiological information and laboratory capacity to characterise isolates of this invasive bacterial infection. The number of countries, either EU Accession countries or countries outside the EU, contributing to the network is gradually increasing. In early 2004, approximately 10 Accession Countries will be formally admitted to the EU, and hence a sizeable increase will be seen in the number of countries participating in the network
1.1 Project aims
1. To improve the epidemiological information on invasive meningococcal disease
within the European Union. 2. To improve the laboratory capacity to accurately characterise the isolates of N.
meningitidis using standardised methods. 3. To form a focus for future wider collaboration with non European Union and
candidate European Union countries in Europe.
As meningococcal disease is relatively uncommon, this project will allow pooling of such data to increase the power of any epidemiological analysis. European wide analysis should be able to detect changes in serogroup and serotype distribution, which is important in formulation of vaccination strategies. In addition, by pooling data from all countries, the populations under surveillance will be composed of a wider variety of ethnic groups. This project will set standards for the epidemiological surveillance of infections and for methods used in reference laboratories. Countries will be able to learn from models of good practice in other member states, and these standards can also be applied in other countries, especially Candidate EU and non-European Union countries. In addition, establishment of this network may facilitate the early dissemination of advances in therapy and in public health control measures and lead to the harmonisation of guidance on the control of meningococcal disease. This project will also provide a model and a focus for future research and public health collaborations, for example the evaluation of other new vaccines such as conjugate pneumococcal vaccines. This project will provide substantial and up-to-date epidemiological information from which meningococcal disease vaccination policy can be developed within individual countries. It may also facilitate the eventual harmonisation of vaccine schedules in the European Union. The project provides an established network for the rapid dissemination of changes in the epidemiology of an infection that may have public health significance. In addition, it facilitates the rapid exchange of information on imported strains of N. meningitidis infections.
5

2. METHODS Questionnaires on the surveillance system(s) and the laboratory diagnostic methods were sent to all the participating countries at the start of the network in 2000. Countries joining the network later were also requested to complete the two questionnaires. The information gained from both these questionnaires is important in the correct interpretation of the data that was provided by each individual country. The agreed minimum data set is used by each contributing partner. This data set includes age, sex, date of onset, method of confirmation, site of identification, grouping, typing and subtyping results (as appropriate). (Appendix 2) Analysis of age-specific incidence rates, temporal trends and diversity of N. meningitidis infections will be compared. In countries with vaccination programmes, coverage data will also be requested and comparison of rates of infection in both vaccinated and unvaccinated cohorts will be interpreted in conjunction with coverage, schedule and vaccine used, years since implementation and method of introduction. Standard case definitions developed as part of the previous collaborations are used in this project. Where surveillance is performed using other definitions, datasets are re-coded to provide comparable data for all participating countries. The descriptive epidemiology were analysed using standard statistical packages on the minimum data set provided for N. meningitidis infection. Currently, because of the small number of countries yet using routine PCR confirmation, most data analyses and comparisons were performed on culture-confirmed cases only. A rapid reporting surveillance scheme for the W135 Hajj strain (W135;P2.2a; P1.5, P1.2 or compatible phenotype) was established in September 2000 in six sentinel EU reference laboratories. Throughout 2001 the reference laboratories reported case details weekly to CDSC Colindale. Information on whether the case was a pilgrim, a contact of a pilgrim or had no known link to the Hajj, has helped monitor the disease and its spread within Europe. In 2001 an external quality assurance scheme (EQAS) was undertaken using standard micro reagents. A panel of well-characterised strains were freeze-dried and an annual selection was sent to each national or regional reference laboratory. These laboratories characterised the strains according to their routine practice and returned the results to the coordinating laboratory. The results of testing were compared with known identity of the organism and returned to each centre. Aggregate results were anonymised for use in this report and for sharing with the group as a whole. Discussion of problems with identification will occur. Dissemination of results from the surveillance of invasive N. meningitidis disease in the EU occurred through project reports to the network participants of the epidemiological analyses, and presentation of results at meetings and scientific conferences. Monthly reports on the N. meningitidis W135 Rapid Reporting Scheme were placed in the Eurosurveillance Weekly. Feedback reports were given to the microbiologist network participants on the External Quality Assurance Scheme (EQAS). Posters were presented at the 13th International Pathogen Neisseriae Conference (IPNC). With the completion of this report information will be placed on the shared website, and regular updates made. No funding was available for a meeting of the collaborators within this project in 2001, but a good percentage of the partners were able to meet at the 2001 EMGM meeting in Orebro, Sweden. Also, a meeting of EU-IBIS/meningococci partners was held within the time of the 13th International Pathogen Neisseriae Conference (IPNC) in Oslo, Norway, 1-6 September 2002.
6

3. RESULTS 3.1 Summary of surveillance systems Every participating country submitted a surveillance questionnaire. Information on the methods of surveillance were presented in the previous report.
3.1.1 Conjugate Meningococcal C vaccination programmes
Within the surveillance systems questionnaire, countries also provided information about conjugate meningococcal group C vaccination programmes. Routine vaccination programmes are now in place in Ireland, Iceland, Luxembourg, Netherlands, Spain, the United Kingdom and part of Belgium, and catch-up programmes of varying structures have been undertaken in each of these countries. (Table i) Table i: Conjugate meningococcal group C vaccination programmes in the EU, as at January 2002. Country Routine Year Catch-up Year Voluntary Year Belgium 1. Wallonie 2. Flanders
Yes Yes
2002 2002
<6 years 1-3 yrs 1-6 yrs & 14-17 yrs
2002 2001 2002
Greece No 0-6 yrs Yes 2001 Iceland Yes 2002 Ireland Yes 2000 <23 yrs 2000 Luxembourg No 12 mths-19 yrs 2001-2002 Netherlands Yes 2002 1-19 yrs Jun-Oct 2002 Portugal (Madeira only)
No 2002
Spain Yes 2000 < 6 yrs Oct 2000 UK Yes 1999 < 18 yrs
19-25 yrs Nov 1999-2000 Dec 2001-2002
Before the introduction of the conjugate MenC vaccination programmes, the only mass campaign using polysaccharide vaccine that was reported in the EU occurred in Spain in the period Sept-Nov 1997. Polysaccharide vaccine A+C was administered to the population aged 18 months to 19 years in 16 of the 19 autonomous Spanish regions. 3.2 Laboratory Diagnostic Methods Questionnaire Laboratory diagnostic questionnaires were received from fourteen laboratories. The description of methods used was published in the previous report.
7

3.3 Summary of case data received for 2001 Seventeen countries have supplied disaggregated case data for 2001 to the co-ordinating centre in CDSC, Colindale, London. Information on 6,829 cases was supplied by the collaborators for 2001. No case data was provided by Luxembourg or Sweden for 2001. Data is fairly complete for age, serogroup, serotype and serosubtype, and method of confirmation. Source(s) of data influence the completeness of case ascertainment, and the completeness of typing information. The differing degree of completeness of data received from the collaborating countries reflects the differences in both the referral of isolates to reference laboratories, and in the reconciliation of data sources/surveillance systems within the countries. For example, Portugal was only able to provide data on cases referred to the reference laboratory. As the referral rate is known to be less than 80% of all culture confirmed cases, the numbers given for Portugal in the following tables will be lower than an expected national total. Similar issues may be relevant to data supplied from other countries, and countries are encouraged to let the centre know of any similar caveats to the data supplied. 3.4 The epidemiology of invasive meningococcal disease in Europe
3.4.1 Incidence of culture-confirmed cases
The incidence of culture confirmed invasive meningococcal disease varied widely between the participating network countries over 2001. (Table ii) Six countries exhibited rates of under 1.0 per 100,000 population, four countries were between 1-2/100,000, five between 2-4/100,000, while Iceland and Netherlands were both above 4/100,000 population. England and Wales, Greece, Ireland and Spain have all shown decreases in the overall incidence of meningococcal disease over the three years 1999-2001. (Table 1) Meanwhile, notable increases over these three years were seen in Austria, Belgium, France, Germany, and the Netherlands.(figure 1)
8
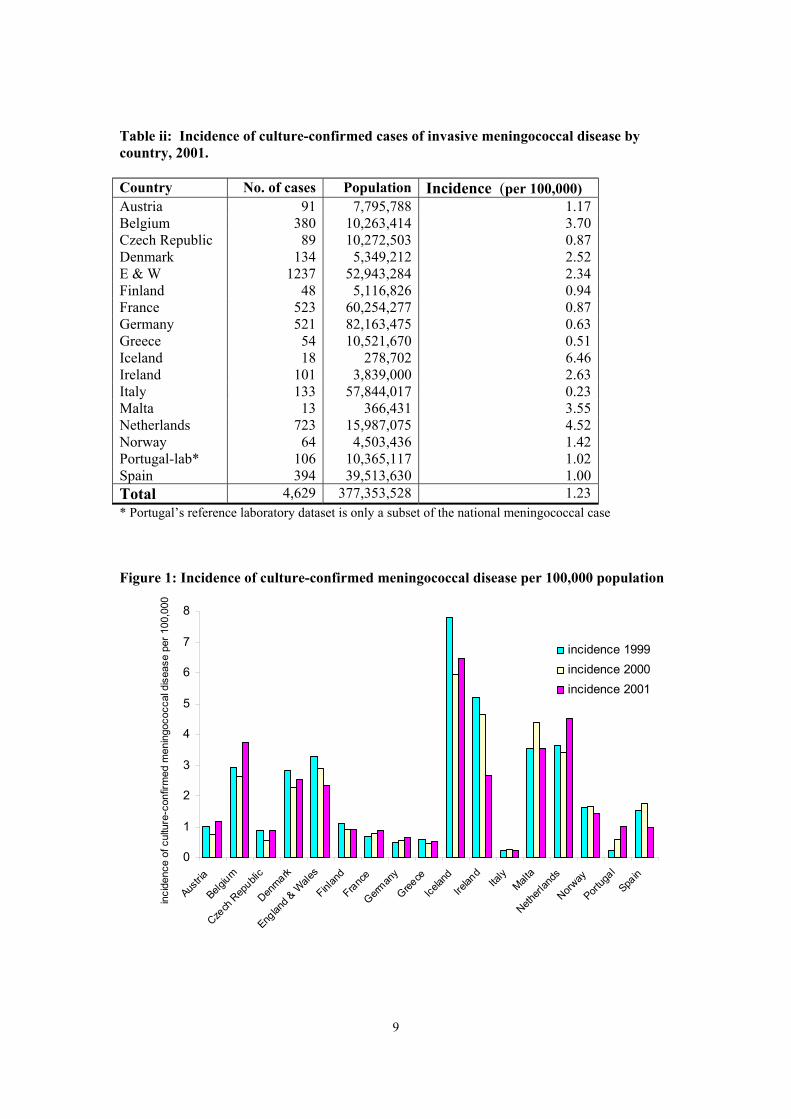
Table ii: Incidence of culture-confirmed cases of invasive meningococcal disease by country, 2001. Country No. of cases Population Incidence (per 100,000) Austria 91 7,795,788 1.17 Belgium 380 10,263,414 3.70 Czech Republic 89 10,272,503 0.87 Denmark 134 5,349,212 2.52 E & W 1237 52,943,284 2.34 Finland 48 5,116,826 0.94 France 523 60,254,277 0.87 Germany 521 82,163,475 0.63 Greece 54 10,521,670 0.51 Iceland 18 278,702 6.46 Ireland 101 3,839,000 2.63 Italy 133 57,844,017 0.23 Malta 13 366,431 3.55 Netherlands 723 15,987,075 4.52 Norway 64 4,503,436 1.42 Portugal-lab* 106 10,365,117 1.02 Spain 394 39,513,630 1.00 Total 4,629 377,353,528 1.23 * Portugal’s reference laboratory dataset is only a subset of the national meningococcal case
Figure 1: Incidence of culture-confirmed meningococcal disease per 100,000 population
0
1
2
3
4
5
6
7
8
Austria
Belgium
Czech
Rep
ublic
Denmark
Englan
d & W
ales
Finlan
d
France
German
y
Greece
Icelan
dIre
land
Italy
Malta
Netherl
ands
Norway
Portug
al
Spain
inci
denc
e of
cul
ture
-con
firm
ed m
enin
goco
ccal
dis
ease
per
100
,000
incidence 1999incidence 2000incidence 2001
9
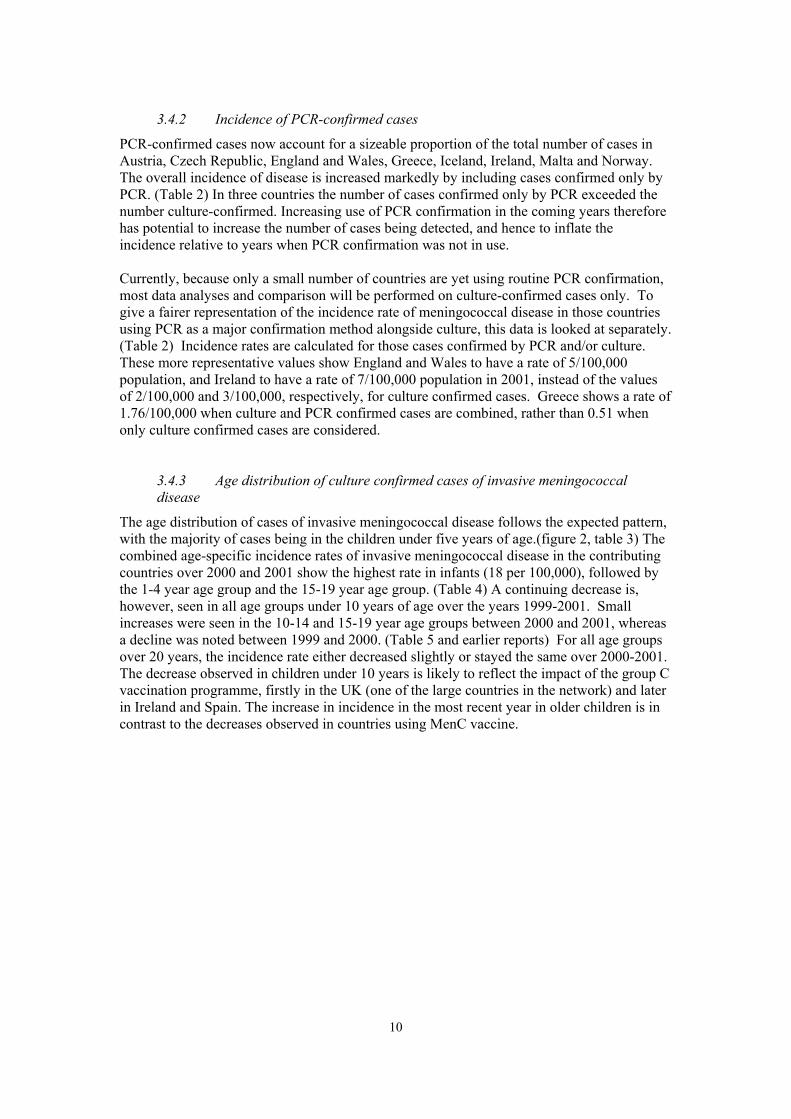
3.4.2 Incidence of PCR-confirmed cases
PCR-confirmed cases now account for a sizeable proportion of the total number of cases in Austria, Czech Republic, England and Wales, Greece, Iceland, Ireland, Malta and Norway. The overall incidence of disease is increased markedly by including cases confirmed only by PCR. (Table 2) In three countries the number of cases confirmed only by PCR exceeded the number culture-confirmed. Increasing use of PCR confirmation in the coming years therefore has potential to increase the number of cases being detected, and hence to inflate the incidence relative to years when PCR confirmation was not in use. Currently, because only a small number of countries are yet using routine PCR confirmation, most data analyses and comparison will be performed on culture-confirmed cases only. To give a fairer representation of the incidence rate of meningococcal disease in those countries using PCR as a major confirmation method alongside culture, this data is looked at separately. (Table 2) Incidence rates are calculated for those cases confirmed by PCR and/or culture. These more representative values show England and Wales to have a rate of 5/100,000 population, and Ireland to have a rate of 7/100,000 population in 2001, instead of the values of 2/100,000 and 3/100,000, respectively, for culture confirmed cases. Greece shows a rate of 1.76/100,000 when culture and PCR confirmed cases are combined, rather than 0.51 when only culture confirmed cases are considered.
3.4.3 Age distribution of culture confirmed cases of invasive meningococcal disease
The age distribution of cases of invasive meningococcal disease follows the expected pattern, with the majority of cases being in the children under five years of age.(figure 2, table 3) The combined age-specific incidence rates of invasive meningococcal disease in the contributing countries over 2000 and 2001 show the highest rate in infants (18 per 100,000), followed by the 1-4 year age group and the 15-19 year age group. (Table 4) A continuing decrease is, however, seen in all age groups under 10 years of age over the years 1999-2001. Small increases were seen in the 10-14 and 15-19 year age groups between 2000 and 2001, whereas a decline was noted between 1999 and 2000. (Table 5 and earlier reports) For all age groups over 20 years, the incidence rate either decreased slightly or stayed the same over 2000-2001. The decrease observed in children under 10 years is likely to reflect the impact of the group C vaccination programme, firstly in the UK (one of the large countries in the network) and later in Ireland and Spain. The increase in incidence in the most recent year in older children is in contrast to the decreases observed in countries using MenC vaccine.
10

Figure 2: Age distribution of culture-confirmed meningococcal disease in Austria, Belgium, Czech Republic, Denmark, England & Wales, Finland, France, Germany, Greece, Malta, Netherlands, Norway, Portugal and Spain: 1999, 2000, 2001
0%
2%
4%
6%
8%
10%
12%
14%
16%
18%
20%
<1 1 to 4 5 to 9 10 to 14 15 to 19 20 to 24 25 to 44 45 to 64 65+
age group
% o
f cas
es in
age
grou
p
1999
2000
2001
Austria, Czech Republic, England & Wales, Greece, Iceland, Ireland and Norway confirmed a proportion of their invasive meningococcal disease cases by PCR-only. The age distribution of the PCR-only confirmed cases shows a very similar pattern to that of the culture-confirmed cases. (Tables 5) Data on the age distribution of PCR confirmed cases from Greece, Czech Republic and Iceland only became available for 2001. It is expected that other countries will add PCR data as the methods become more readily available.
3.4.4 Incidence of meningococcal disease serogroup B, by year and agegroup
The incidence of serogroup B meningococcal disease in the European Union was highest in the children under one year of age. (Table 6). A smaller secondary peak in the incidence of serogroup B was seen in the 15-19 year old age group, but remains low in all older age groups. Between 2000 and 2001 a decrease was seen in under ones (16.69 to 13.24). Apart from the 10-14 year age group, the incidence in all other age groups decreased between 2000 and 2001. These decreases were smallest in the age groups over 25 years.
3.4.5 Incidence of meningococcal disease serogroup C, by year and agegroup
Similar to the incidence of serogroup B, the incidence of serogroup C in the EU is greatest in the infant population (2.10), but is also high in the 1-4 years age group (1.65) A secondary peak is seen in the 15-19 year olds (0.95). (Table 7) In nearly all age groups, except the 15-19 years age group, a decrease in incidence rate was observed between 2000 and 2001. The largest decreases were shown in the under ones and in the 1-4 year olds : 2.63 to 2.10 and 2.24 to 1.65, respectively. These decreases are likely to be influenced by the impact of MenC conjugate vaccination programme.
11

3.4.6 Age-specific incidence of group B and C infection by country
The incidence of culture-confirmed meningococcal disease serogroups B and C by age group varied widely amongst the participating countries. However, all showed a similar pattern in the age groups with the highest and the lowest incidence rates. For the incidence of serogroup B, all countries had the highest rate in the under ones year olds, and the vast majority had a second peak in incidence in the 15-19 year olds. This held true for 1999, 2000 and 2001. (table 27 & previous report) The variation in rates between countries in 2001 was very wide, but this may reflect small numbers in some countries. In the under one year old age group it varied from 0.0 (Malta) to 45.5 (Ireland). The pattern was less consistent for the age-specific serogroup C incidence rate amongst participant countries. In 2001, ten of the 17 contributing EU countries displayed the highest incidence rate of serogroup C disease in the under one year olds, with a secondary increase in incidence in the 15-19 year olds (or in the nearest age group to this). (tables 28 & previous report) Countries not displaying this in were Denmark, Finland, Germany, Italy, Malta, Netherlands and Norway. Of these countries, Denmark, Netherlands and Norway had a higher rate in the 15-19 year olds than in the under ones. Caution must be taken with countries such as Finland and Malta, as case numbers are very small in comparison to other participant countries.
3.4.7 Proportion of meningitis to septicaemia in culture-confirmed cases of invasive meningococcal disease,
The proportion of culture confirmed cases reported with meningitis varied widely by country and also varied within each country over the three years. The reasons for these differences are unclear but seem to be consistent within each country. Overall, the proportion of culture-confirmed meningococcal disease cases presenting with meningitis was 59%, 61% and 64% in 1999, 2000 and 2001, respectively.(tables 8,9&10 ) In 2001, nine of the sixteen countries contributing this data exhibited proportions of greater than 60% for meningitis to septicaemia.(table 8) Cultured confirmed group B cases displayed, overall, the proportion of cases with meningitis to be in the range 63%-65% over year 1999-2001. The majority of countries had greater than 60% of reported cases diagnosed with meningitis. (tables 15&16) The proportion of cases with meningitis in the culture-confirmed Group C cases was lower than for group B, 50% in 1999, 53% in 2000 and 49% in 2001. (tables 17&18) Once again, the majority of countries had greater than 60% of their Group C cases presenting with meningitis, whilst England and Wales, Ireland and Malta displayed the opposite pattern.
12

3.4.8 Distribution of serogroups in invasive meningococcal disease, 1999-2001
Group B is the major cause of invasive meningococcal disease in Europe, causing the majority of infections in all countries except Iceland. (table 12 & previous report) The second most common serogroup is group C, but the proportion of cases caused by group C infection is quite variable between countries, ranging from 8% to 78% in 2001. A number of countries have shown an increase in the proportion of cases caused by Group C over 1999, 2000 and 2001: Austria, Belgium, and Netherlands showing big increases. But it is notable that the proportion of group C infections in England and Wales, Greece, and Ireland have all declined over 1999-2001, reflecting the impact of conjugate meningococcal group C vaccine. (Table iii). Table iii: Proportion of cases due to serogroup C by country, 1999-2001
% Group C
1999 2000 2001
<10% - Malta Malta 10-19% Austria
Denmark Finland Netherlands Norway
Austria Denmark Netherlands Norway
England & Wales* Finland Ireland*
20-29% Belgium France Germany Italy Malta
Czech Republic England & Wales* Finland France Germany Greece Italy
Denmark Germany Greece Italy Norway Spain*
30-39% England & Wales* Greece Ireland* Spain*
Belgium Ireland* Spain*
Czech Republic France Netherlands
40+% Czech Republic Iceland Portugal-lab
Iceland Portugal-lab
Austria Belgium Iceland Portugal-lab
* countries implementing MenC vaccination during this period The serogroup distribution of the PCR-only confirmed cases is difficult to interpret, as the distribution will be affected by the serogroups each particular country is testing for and by the sensitivity of the grouping PCRs (Tables 14) The latter explanation probably accounts for the high proportion of cases that were PCR-confirmed but not grouped. Other than groups B and C, serogroups W135, Y, X, Z/29E and A were the major groups identified. Group W135 is the most common of these and the number of W135 cases increased from 1999 to 2001 in Belgium, England and Wales, and Norway.(table 20) These countries and a number of others, particularly France, observed an increase in the number of W135 cases from 1999 to 2000 in association with the Hajj in 2000. In 2001, the total number of W135 cases remained similar to that of 2000.(table 19 & previous report) Greece experienced a sizeable increase in the number of Group A cases between 1999 to 2001. This is believed to be due to importation from Russia (personal communication).
13

3.4.9 Distribution of serotypes of group C and B meningococcal disease
The leading serotype of group C was C2a, with C2b as the second most common. Overall, serotype C2a increased steadily from 1999 to 2001. This increase was seen in 8 individual countries who supplied data for all three years.(Tables 21, 22 & 23) In 1999, serotype 2a was the leading type associated with group C disease in nine of the 15 countries who contributed data but by 2001, serotype 2a had become the most common type in 12 countries (Table 25). Group B infections appear to be more diverse, with more than 50% of cases in the “other” category. (Tables 24 & previous reports)) There are considerable differences between countries in strain composition. Of the two major group B sero-subtypes identified (B:15:1.7,1.16 and B:4:1.4), the leading strain in most countries was consistent between years 1999-2001. Spain displays a very different pattern from other contributing countries over these three years. The B:4:1.15 strain was dominant; comprising approximately one quarter of the serotyped B strains in each year. In 2001, 6% of the serotyped group B strains were not-typable, and in Austria, France and Spain this was in the range of 12-16%.
3.4.10 Overall case fatality rates
The overall case fatality rates (CFR) for all cases of laboratory confirmed meningococcal disease in 1999, 2000 and 2001 were 6-7%. (Table 29) Between 2000 and 2001 case fatality rates in Belgium and Czech Republic showed an increase of 2% or greater, and Norway has had a decrease of 8% from 1999 to 2001. Because of differences in method of coding deaths, and to allow comparison of CFR between countries, the denominator included all cases and therefore cases with unknown outcome were assumed to have survived. Using this method, the CFR ranged from 0% to 13% in 2001, although it is recognised that reporting of outcome was likely to vary in completeness between countries. Variation between countries is present, and care must be taken when making comparisons purely on CFRs, as the case numbers vary greatly within our study partners. The exclusion of PCR confirmed cases made minimal difference to the case fatality rates observed for the majority of individual countries, suggesting that CFR did not vary between cases confirmed by culture and by PCR.(table 30) However, England and Wales saw an increase from 2000-2001 of 3%, and small increases were observed in a few countries. The resulting overall CFR for laboratory confirmed cases excluding those cases confirmed only by PCR confirmed cases increased from 6% in 2000 to 8% in 2001.
3.4.11 Case fatality ratio by serogroup
The highest case fatality ratio in the EU countries in 2001 was seen amongst cases with serogroup W135 infection (15%) followed by serogroup C infection (11.0%). (Table 31) France was the only country with recorded deaths due to infection with serogroup A meningococcal disease. Overall, the CFR for serogroup C cases is approximately double that of serogroup B cases. Detailed analysis of CFR in relation to the phenotypic characteristics of the strain is being conducted.
3.4.12 Case fatality ratio by age for serogroup B and C infections by age
Age specific case fatality rates for serogroup B infection (Table 32) decreases from the under one year old age group to 15-19 year age group, and then increases steadily to its highest value in the population over 65 years of age. The overall pattern of CFR by age for serogroup C infection is for it to decrease from under ones to 10-14 year olds, from where it steadily increases with age.
14

3.4.13 Antibiotics resistance
Twelve countries (Austria, Belgium, Czech Republic, Denmark, England & Wales, Germany, Greece, Iceland, Italy, Malta, Netherlands, Portugal and Spain) contributed antibiotic minimum inhibitory concentration (MIC) data for isolates tested for antibiotic susceptibility. The proportion of such strains in each country varies widely in 2001. (table iv) This difference probably, in part, reflects differences in methods used. The overall percentage of isolates with MICs between 0.06-1.99 for penicillin was 53% in 1999, 61% in 2000 and 54% in 2001.(tables 34 & 35) However, collection of additional years of data, and further analysis of this data, will be necessary before conclusions can be drawn. As part of the DGXII funded EU-MENNET project, Spain is be leading a work package to look at standardisation of assays of penicillin sensitivity. Table iv: Susceptibility of N. meningitidis to penicillin, by country: 2001
Country 2001 MIC <= 0.06 MIC >0.06 and <2.00 Total Austria 66 (80%) 16 (20%) 82Belgium 328 (92%) 30 (8%) 358Czech Republic 56 (97%) 2 (3%) 58
Denmark 67 (54%) 57 (46%) 124E&W 439 (35%) 823 (65%) 1262Germany 31 (6%) 490 (94%) 521Greece-lab 35 (83%) 7 (17%) 42Iceland 14 (78%) 4 (22%) 18Italy 60 (98%) 1 (2%) 61Malta 2 (15%) 11 (85%) 13Netherlands 1 (6%) 16 (94%) 17Portugal-lab* 82 (77%) 24 (23%) 106Spain-lab* 212 (54%) 182 (46%) 394Total 1393 (46%) 1663 (54%) 3056* Greek and Spanish reference laboratory data was used here as it was the only dataset with antibiotic resistance * Portugal’s reference laboratory data only is used here, and in 1999 includes only a small number of reporting labs/hospitals
3.5 Impact of conjugate group C meningoccal disease vaccination programmes on the epidemiology of the disease
The introduction of MenC vaccination programmes into England and Wales, Ireland and Spain has seen a notable decrease in the number of culture confirmed group C meningococcal disease cases in all the age groups that have received routine vaccination or been within the catch-up programmes run at the beginning of each countries campaign. (figure 3) Looking at the combined data of countries that did not have MenC vaccination programmes established in the 1999-2001 period, the reverse pattern can be seen: a increase in the number of group C cases in all age groups over the three year period. (figure 4) This has been paralleled by an overall increase in these countries of the proportion of serogroup C cases that are serotype P2.2a, the hypervirulent strain of this serogroup. (figure 5). In 2002, other countries introduced MenC vaccination programmes (table (i)), and the impact of these will be seen in future reports.
15

Figure 3: No. of culture-confirmed cases of invasive meningococcal disease serogroup C cases in countries with established conjugate group C meningococcal vaccine programmes (England & Wales, Ireland and Spain combined), by age group and year, 1999-2001
0
50
100
150
200
250
<1 1 to 4 5 to 9 10 to 14 15 to 19 20 to 24 25 to 44 45 to 64 65+age group
no o
f cul
ture
con
firm
ed c
ases
199920002001
Figure 4: No. of culture-confirmed invasive meningococcal disease serogroup C cases in EU-IBIS countries without established nationwide conjugate group C meningococcal vaccination programmes, by age group and year, 1999-2001.
0
20
40
60
80
100
120
140
160
180
200
220
<1 1 to 4 5 to 9 10 to 14 15 to 19 20 to 24 25 to 44 45 to 64 65+
age group
num
ber o
f cul
ture
con
firm
ed c
ases 1999
2000
2001
16

Figure 5: Proportion of culture-confirmed meningococcal disease serogroup C cases that are serotype P2.2a – 1999-2001
0
10
20
30
40
50
60
70
80
90
Belgium Germany Netherlands All countrieswithout MenC
vaccine
%
199920002001
3.6 Rapid sentinel surveillance of W135 infection
In 2000, outbreaks of W135 meningococcal disease were observed in a number of European countries amongst people returning from the Muslim pilgrimage to Mecca in Saudi Arabia (The Hajj) and their contacts. Prior to Hajj 2000, different vaccines had been recommended for pilgrims in each country, some using AC polysaccharide vaccine with others using quadrivalent (A/C/Y/W135) vaccine. In 2001, many countries recommended quadrivalent vaccine, but sufficient quantity was not available for all pilgrims. In 2002 the Saudi Arabian authorities required all pilgrims to be vaccinated with QV before Hajj visas were issued. In response the outbreaks seen in 2000 amongst returning pilgrims and contacts, EU-IBIS established, in September 2000, a sentinel reporting system for the Hajj 2000 outbreak strain in six EU member states. National reference laboratories in France, Germany, Ireland, Netherlands, Spain, and England and Wales reported weekly all cases of W135:2a:1.2,5 or compatible strains. The aims of this surveillance system were:
1. to rapidly monitor the spread of W135 outbreak strain in Europe, and 2. to inform future interventions within Europe and in relation to travel.
Between week 36 in 2000 and week 30 in 2002, a total of 159 cases of W135:2a:1.2,5 (or compatible strains) were reported from the six sentinel reference laboratories in the EU. Of the total number of cases, 7 were pilgrims, 31 were contacts of pilgrims and 121 were cases
17
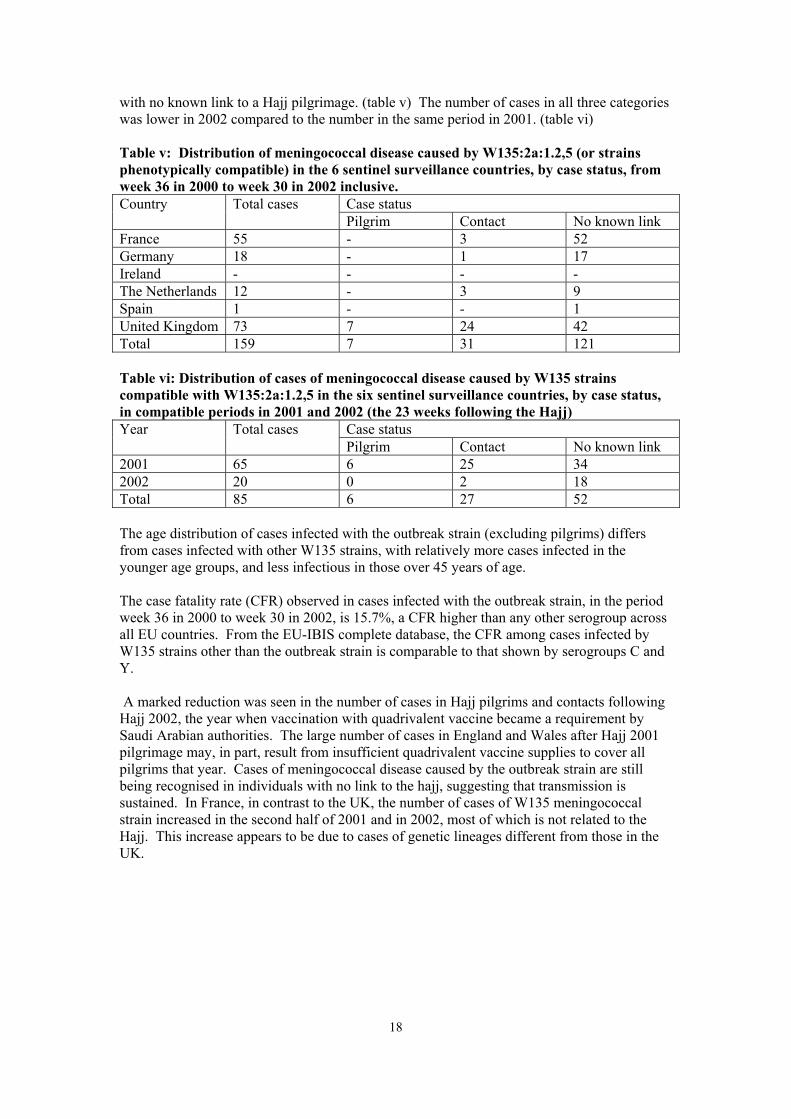
with no known link to a Hajj pilgrimage. (table v) The number of cases in all three categories was lower in 2002 compared to the number in the same period in 2001. (table vi) Table v: Distribution of meningococcal disease caused by W135:2a:1.2,5 (or strains phenotypically compatible) in the 6 sentinel surveillance countries, by case status, from week 36 in 2000 to week 30 in 2002 inclusive.
Case status Country Total cases Pilgrim Contact No known link
France 55 - 3 52 Germany 18 - 1 17 Ireland - - - - The Netherlands 12 - 3 9 Spain 1 - - 1 United Kingdom 73 7 24 42 Total 159 7 31 121 Table vi: Distribution of cases of meningococcal disease caused by W135 strains compatible with W135:2a:1.2,5 in the six sentinel surveillance countries, by case status, in compatible periods in 2001 and 2002 (the 23 weeks following the Hajj)
Case status Year Total cases Pilgrim Contact No known link
2001 65 6 25 34 2002 20 0 2 18 Total 85 6 27 52 The age distribution of cases infected with the outbreak strain (excluding pilgrims) differs from cases infected with other W135 strains, with relatively more cases infected in the younger age groups, and less infectious in those over 45 years of age. The case fatality rate (CFR) observed in cases infected with the outbreak strain, in the period week 36 in 2000 to week 30 in 2002, is 15.7%, a CFR higher than any other serogroup across all EU countries. From the EU-IBIS complete database, the CFR among cases infected by W135 strains other than the outbreak strain is comparable to that shown by serogroups C and Y. A marked reduction was seen in the number of cases in Hajj pilgrims and contacts following Hajj 2002, the year when vaccination with quadrivalent vaccine became a requirement by Saudi Arabian authorities. The large number of cases in England and Wales after Hajj 2001 pilgrimage may, in part, result from insufficient quadrivalent vaccine supplies to cover all pilgrims that year. Cases of meningococcal disease caused by the outbreak strain are still being recognised in individuals with no link to the hajj, suggesting that transmission is sustained. In France, in contrast to the UK, the number of cases of W135 meningococcal strain increased in the second half of 2001 and in 2002, most of which is not related to the Hajj. This increase appears to be due to cases of genetic lineages different from those in the UK.
18
4. CONCLUSIONS This project has demonstrated the successful development of existing networks towards the objective of providing high quality surveillance information on meningococcal infection in the European Union and neighbouring countries. The improved quality of the data is demonstrated by the inclusion of cases confirmed by PCR in more countries and by the improved completeness of data provided (eg. data on age is now supplied by Greece). The data provided on meningococcal disease shows marked variations in overall incidence. Excluding very small countries, a twenty-fold variation in the incidence of culture confirmed infection was seen in 2001. This is likely to reflect both genuine differences in the epidemiology and in ascertainment. The contribution of each of these is difficult to quantify, but secular trends within countries and between age-groups and serogroups are likely to be valid in most instances. Countries should be aware, however, of the major influence that changes in clinical and laboratory practice can exert on ascertainment. For example, reduced used of lumbar puncture for the diagnosis of meningitis, the use of pre-admission antibiotics and the introduction of new laboratory tests. The potential for ascertainment to change because of new technological advances is illustrated by the data provided on PCR diagnosis for those countries where the test is being used routinely. In three countries, ascertainment of laboratory confirmed infection has been increased by around 100% and it is likely that similar increases will be achieved in other countries when access to and awareness of PCR diagnosis improves. The ability to confirm and group a larger number of meningococcal infections, however, is clearly a major advance that will improve the data available and help to better establish the burden of disease with a view to vaccine introduction. We hope that countries without a routine service can learn from other countries in the project about the development and provision of such services. The age-specific incidence and age-distribution of meningococcal disease follows the pattern previously described, with the majority of cases in children under five. Minor differences were noted in the age distribution between countries. Group B is still the commonest cause of infection in Europe, although the proportion of disease due to group C varies quite considerably. The proportion of group C infection did change within countries over the years 1999-2001. In some instances this was due to the introduction of a group C vaccine, in others it may reflect changes in epidemiology such as the introduction of a hyper-virulent strain. Identification of such changes at a European level is important, as it may predict changes that will subsequently take place in neighbouring countries. For groups other than B and C, there was also variation in the predominant strains between countries and between years. In 2000, a dramatic increase in cases due to W135 infection had been observed in several countries in association with the Hajj, and another epidemic of the Hajj strain disease was seen following Hajj 2001. In many countries, small numbers of cases prevent valid interpretation of such changes but this phenomenon illustrates the strength of the European project in pooling data from many countries. In late 2000 a rapid reporting system was established by EU-IBIS in sentinel EU countries for the W135 Hajj strain. This scheme monitored the spread of this strain in Europe and was able to monitor the impact of the Saudi Arabian government’s vaccination requirement for entry to Hajj 2002. A dramatic decrease in the number of Hajj-linked cases was seen in 2002, and this has continued after the Hajj 2003, also. As well as changes in serogroup, there are differences in major serotypes of group C and group B within Europe. Changes were noted in the predominant group C serotype in two countries and may be associated with a future shift in incidence or case-fatality rates. The major group C serotype was P2.2a in 12 countries. Six countries have shown an increase in the proportion of group C cases of serotype P2.2a over 1999-2001, and four of these have
19
shown a steady increase in the overall, and group C, case fatality rates. The increase in serogroup C serotype 2a infection in many countries without MenC programmes is of concern in view of the association between this serotype and strains of the ST-11 complex. The introduction of strains from the latter complex has been associated with increases in incidence and high case fatality rates in many developed countries (including Canada, UK, Czech Republic). Group B strain variation is seen across Europe, and phenotypic data displayed in this study, and from previous records, shows marked variation in the prevalent strains across Europe. Observation over more years will allow the early recognition of emerging strains that might be missed within any one country. Consideration needs to be given to the substantial proportion of group B strains that are non-typable for serotype and serosubtype. Differences in the proportions may reflect different methods or reagents in use and should be established via the EQAS scheme. Molecular analysis of meningococcal strains is part of the DGXII funded EU-MENNET project and may shed light on this area in future years. Analysis of case fatality ratio is prone to difficulties for a variety of reasons. We suspect that the figures presented here are an underestimate of true fatality ratios, as there is likely to be under-ascertainment of outcome in some countries. Comparison between countries is unlikely to be valid as it may be explained by differences in ascertainment, in age distribution or serogroup/serotype distribution between countries. Comparison between serogroups and age-groups however is likely to reflect genuine differences. Analysis indicates that fatality is higher in older individuals. Case fatality ratios for group B infections are low overall, and in most countries lower than that observed for group C or for other serogroups. Case fatality for group Y and W135, however, is high, and the CFR for W135 increased in 2000 and 2001. This occurred at the same time as the incidence increased in association with the Hajj and is probably due to the main Hajj-associated strain belonging to a hyper-virulent lineage (ST-11 complex). The impact of vaccination on the epidemiology of meningococcal disease in Europe is small so far. As the UK is one of the largest countries, the impact of conjugate group C vaccine (introduced in late 1999 for those under 18 years) has had a small impact on the overall incidence and a larger impact on the incidence of group C infection. Ireland and Spain have also recently introduced vaccine and other countries are likely to implement vaccination over the next year or so. In future, therefore, data may need to be presented separately for those countries with vaccination programmes. Demonstration of a change in the epidemiology is likely to encourage neighbouring countries to consider vaccination, particularly if the incidence of group C infection increases or case-fatality becomes higher than previously observed. The flexible rapid reporting system that was established in September 2000 for the meninogocccal W135 strain associated with the Hajj 2000 outbreak has shown to be an important asset in informing intervention policies. Circulation of the outbreak strain in Europe continued throughout 2001 and 2002. However, rates of disease in Western Europe have remained low, substantially lower than for group B or C infections. Although true penicillin resistance has not been observed, a substantial proportion of strains have MICs in the range of 0.06-1.99. In general, the proportion is fairly constant between years. In 2001, 54% of cases tested for antibiotic sensitivity were in this range. There were dramatic differences in the proportion of isolates with reduced penicillin sensitivity between countries. This difference probably reflects differences in methods used. In general, the proportion is fairly constant between years. The clinical significance of this finding is not fully established but resistance patterns are being investigated further as part of EU-MENNET.
20

Data on EU-IBIS and on meningococcal infection in Europe is now presented on the EU-IBIS web-site. Future developments include a web-enabled database for performing live queries and the eventual availability of web-based reporting from participant countries.
21

5. PROJECT ACHIEVEMENTS This project has made considerable contributions to:
1. improving epidemiological information on Neisseria meningitidis; 2. improving the laboratory capacity of countries within the EU to accurately
identify isolates of N. meningitidis; 3. forming a focus for wider collaboration with non European Union countries
and candidate European Union countries 5.1 Improvements in the epidemiological information on N. meningitidis within the EU A combination of tools has been used to improve the epidemiological information on N. meningitidis within the EU. The surveillance system questionnaires from participant countries have allowed greater understanding of the data supplied by each country and have helped to explain any limitations in the data supplied. Use of a minimum dataset and analysis by standard case definitions for meningococcal infection has enabled valid comparisons to be made of the disease epidemiology between member countries, and hence to assist the monitoring of epidemiological changes within Europe. Information collected on the vaccination programme(s) being introduced in various participant countries has also aided interpretation of the epidemiological analyses. The availability of data on laboratory methods used in identification of N. meningitidis and on the characterisation of isolates also contributes significantly to the understanding comparability of the epidemiological information between EU countries. A rapid reporting surveillance system for meningococcal disease W135; P2.2a. P1.2,5 was established in sentinel reference laboratories in the EU in late 2000 and continued through 2001 and 2002. The aims were to rapidly monitor the spread of the W135 outbreak strain in Europe, and to inform future interventions in Europe, and in relation to travel. 5.2 Improvements in the laboratory capacity within the EU to accurately identify N.
meningitidis isolates These improvements will be achieved through gaining information on systems in use by participant countries, and by feedback of information from the External Quality Assurance Scheme (EQAS) with the participant reference laboratories. Questionnaires completed by network members on the laboratory methods used in the identification of N. meningitidis gave information that, and, as with the surveillance system questionnaire results, allowed greater understanding of any limitations that could impact on the data individual countries supplied. The EQAS helped identify any existing problems in correctly serotyping N. meningitidis isolates, and enabled corrections/assistance in laboratory methods to be made, hence improving comparability of data between countries. In collaboration with EU-MENNET improvements may also be made in the methods used for assessing and comparing data on penicillin sensitivity. 5.3 Forming a focus for wider collaboration with non European Union countries and
candidate European Union countries Through establishment of this N. meningitidis disease surveillance network in the European Union, with standard case definitions, minimum dataset, and laboratory quality assurance scheme, and a website, a focus for wider collaboration with non-EU and candidate EU countries is provided. Involvement of the Czech Republic and Malta in this collaboration has increased the population under surveillance. It is hoped that other non-EU countries will join the collaboration later.
22

5.4 Establishment of web-site Data on EU-IBIS and on meningococcal infection in Europe is now presented on the EU-IBIS web-site. Future developments include a web-enabled database for performing live queries and the eventual availability of web-based reporting from participant countries.
23

APPENDIX 1: DATA TABLES
24

INDEX OF TABLES Table 1: Incidence of culture-confirmed cases of invasive meningococcal disease, by country and
year...........................................................................................................................................3
Table 2: Incidence of Culture confirmed cases and/or PCR confirmed cases – 1999-2001............4
Table 3: Age distribution of culture-confirmed meningococcal disease in Austria, Belgium, Czech Republic, Denmark, England & Wales, Finland, France, Germany, Greece**, Iceland, Ireland, Italy, Malta, Netherlands, Norway, Portugal* and Spain: 1999, 2000 & 2001.......................4
Table 4: Age specific incidence of culture-confirmed meningococcal disease in the reporting countries (Austria, Belgium, Czech Republic, Denmark, E&W, Finland, France, Germany, Greece*, Iceland, Ireland, Italy, Malta, Netherlands, Norway, Portugal and Spain): 2000 & 2001 ...........................................................................................................................................5
Table 5: Age distribution of culture and/or PCR confirmed cases of invasive meningococcal disease in Austria, Czech Republic*, England & Wales, Greece*, Iceland*, Ireland and Norway : 1999, 2000 & 2001....................................................................................................................6
Table 6: Age specific incidence rate (per 100,000 population) of culture-confirmed meningococcal disease serogroup B in the EU reporting countries: 1999, 2000 and 2001 ….check totals and populations for all years, though ..............................................................................................6
Table 7: Age specific incidence rate (per 100,000 population) of culture-confirmed meningococcal disease serogroup C in the EU reporting countries: 1999, 2000 and 2001… ..........................6
Table 8: Proportion of meningitis and septicaemia in culture-confirmed cases of meningococcal disease by country, 1999...........................................................................................................7
Table 9: Proportion of meningitis and septicaemia in culture-confirmed cases of meningococcal disease by country, 2000...........................................................................................................7
Table 10: Proportion of meningitis and septicaemia in culture-confirmed cases of meningococcal disease by country, 2001...........................................................................................................8
Table 11: Proportion of meningitis in culture confirmed cases of invasive meningococcal disease, 1999, 2000 and 2001.................................................................................................................8
Table 12: Proportion of invasive meningococcal disease in culture-confirmed cases by serogroup and country – 2001....................................................................................................................9
Table 13: Proportion of cases due to serogroup C by country, 1999-2001 ......................................9
Table 14: Proportion of invasive meningococcal disease in Culture- or PCR-confirmed cases by serogroup and country – 2001 ..................................................................................................10
Table 15: Proportion of cases presenting with meningitis in the Group B culture confirmed cases, by country: 1999 & 2000 ...............................................................................................................11
Table 16: Proportion of cases presenting with meningitis in the Group B culture confirmed cases, by country: 2001.............................................................................................................................12
Table 17: Proportion of cases presenting with meningitis in the Group C culture-confirmed cases, by country: 1999& 2000 ................................................................................................................13
Table 18: Proportion of cases presenting with meningitis in the Group C culture-confirmed cases, by country: 2001.............................................................................................................................14
Table 19: No. (Proportion) of invasive meningococcal disease in culture-confirmed cases other than serogroup B and C, by country – 2001 (NGA’s left out of this table, but incl. In total known)...................................................................................................................................................15
Table 20: Major serogroup of invasive meningococcal disease cases other than groups B and C amongst the contributing countries: 1999-2001.......................................................................16
Table 21: No. of cases (%) of group C serotypes by country : 1999 (cases where serotype known/given).............................................................................................................................17
Table 22: No. of cases (%) of group C serotypes by country : 2000 (in cases where serotype known/given).............................................................................................................................17
Table 23: No. of cases (%) of group C serotypes by country : 2001 (in cases where serotype known/given).............................................................................................................................18
Table 24: No. of cases (%) of selected group B phenotypes by country : 2001 (cases where serotype known/given).............................................................................................................................19
Table 25: Major serotype of group C invasive meningococcal disease amongst the contributing countries 1999-2001..................................................................................................................20
Table 26: Major serotype of group B invasive meningococcal disease amongst the contributing countries 1999-2001..................................................................................................................20
Table 27: Age specific incidence (per 100,000) of culture-confirmed Group B meningococcal disease by country : 2001..........................................................................................................21
Table 28: Age specific incidence (per 100,000) of culture-confirmed Group C meningococcal disease by country : 2001..........................................................................................................22
Table 29: Case fatality ratio in laboratory confirmed cases of meningococcal disease, by country: 1999-2001..................................................................................................................................23
Table 30: Case fatality ratio in laboratory confirmed cases (minus PCR) of meningococcal disease, by country: 1999-2001 ..............................................................................................................24
Table 31: Case Fatality Ratio in laboratory confirmed cases of invasive meningococcal disease, by serogroup: 2001.........................................................................................................................25
Table 32: Case Fatality Ratio in laboratory confirmed cases of group B and group C meningococcal disease, by age group: 1999 –2001 (where age group given)..................................................26
Table 33: Case fatality rate amongst culture-confirmed cases of meningococcal disease presenting with meningitis, by country: 1999, 2000 & 2001 (i.e. meningitis plus men/sept combined).27
Table 34: Susceptibility of N. meningitidis to penicillin, by country: 1999 & 2000........................28
Table 35: Susceptibility of N. meningitidis to penicillin, by country: 2001.....................................28

Table 1: Incidence of culture-confirmed cases of invasive meningococcal disease, by country and year.
1999 2000 2001Country No. of
cases Population Incidence No. of
cases Population Incidence No. of
cases Population Incidence
Austria 80 7,795,788 1.03 58 7,795,788 0.74 91 7,795,788 1.17Belgium 297 10,213,752 2.91 267 10,239,085 2.61 380 10,263,414 3.70Czech Republic 89 10,282,784 0.87 57 10,272,503 0.56 89 10,272,503 0.87Denmark 151 5,313,577 2.84 121 5,330,020 2.27 134 5,349,212 2.51E & W 1704 51,820,200 3.29 1534 52,943,284 2.90 1237 52,943,284 2.34Finland 57 5,116,826 1.11 48 5,116,826 0.94 48 5,116,826 0.94France 394 59,146,337 0.67 464 60,254,277 0.77 523 60,254,277 0.87Germany 402 82,163,475 0.49 452 82,163,475 0.55 521 82,163,475 0.63Greece 63 10,516,366 0.60 50 10,516,366 0.48 54 10,521,670 0.51Iceland 21 269,735 7.79 16 269,735 5.93 18 278,702 6.46Ireland 189 3,626,087 5.21 169 3,626,087 4.66 101 3,839,000 2.63Italy 129 57,679,895 0.28 153 57,844,017 0.27 133 57,844,017 0.23Malta 13 366,431 3.60 16 366,431 4.37 13 366,431 3.55Netherlands 574 15,760,225 3.64 544 15,863,950 3.43 723 15,987,075 4.52Norway 73 4,445,329 1.64 74 4,478,497 1.65 64 4,503,436 1.42Portugal-lab* 21 9,920,760 0.21 59 9,920,760 0.59 106 10,365,117 1.02Spain-lab** 602 39,418,017 1.53 692 39,465,702 1.75 394 39,513,630 1.00Total 4859 373,855,584 1.30 4774 376,466,803 1.27 4,629 377,377,857 1.23 * Portugal’s reference laboratory dataset is only a subset of the national meningococcal case data and in 1999 includes only a small number of reporting labs/hospitals ** Spain’s reference laboratory data only is used here

Table 2: Incidence of Culture confirmed cases and/or PCR confirmed cases – 1999-2001 Country 1999 2000 2001 No. of
cases Population Incidence No. of
cases Population Incidence No. of
cases Population Incidence
Austria 89 7,795,788 1.14 68 7,795,788 0.87 109 7,795,788 1.40Czech Republic 89 10,282,784 0.87 57 10,272,503 0.55 100 10,272,503 0.97E & W 2784 51,820,200 5.37 2651 52,943,284 5.01 2832 52,943,284 5.35Greece 123 10,516,366 1.17 160 10,516,366 1.52 185 10,521,670 1.76Iceland - - 20 278,702 7.18Ireland 429 3,626,087 11.83 390 3,626,087 10.76 273 3,839,000 7.11Malta - - 14 366,431 3.82Norway 76 4,445,329 1.71 83 4,478,497 1.85 71 4,503,436 1.58Total 3,590 88,486,554 4.06 3,409 89,632,525 3.80 3,604 90,520,814 3.98 (3.97)** minus Iceland & Malta figures Table 3: Age distribution of culture-confirmed meningococcal disease in Austria, Belgium, Czech Republic, Denmark, England & Wales, Finland, France, Germany, Greece**, Iceland, Ireland, Italy, Malta, Netherlands, Norway, Portugal* and Spain: 1999, 2000 & 2001
Age group (years) Year <1 1-4 5-9 10-14 15-19 20-24 25-44 45-64 65+ Total
known No % No % No % No % No % No % No % No % No % No 1999 771 16.4 1305 27.7 503 10.7 368 7.8 730 15.5 235 5.0 302 6.4 271 5.8 228 4.8 47132000 765 16.6 1225 26.7 457 9.9 304 6.6 580 12.6 265 5.8 397 8.6 345 7.5 258 5.6 45962001 691 15.2 1170 25.7 413 9.1 345 7.6 656 14.4 248 5.5 392 8.6 365 8.0 269 5.9 4549Total 2227 16.1 3700 26.7 1373 9.9 1017 7.3 1966 14.2 748 5.4 1091 7.9 981 7.1 755 5.4 13,858**Greece only included for 2001
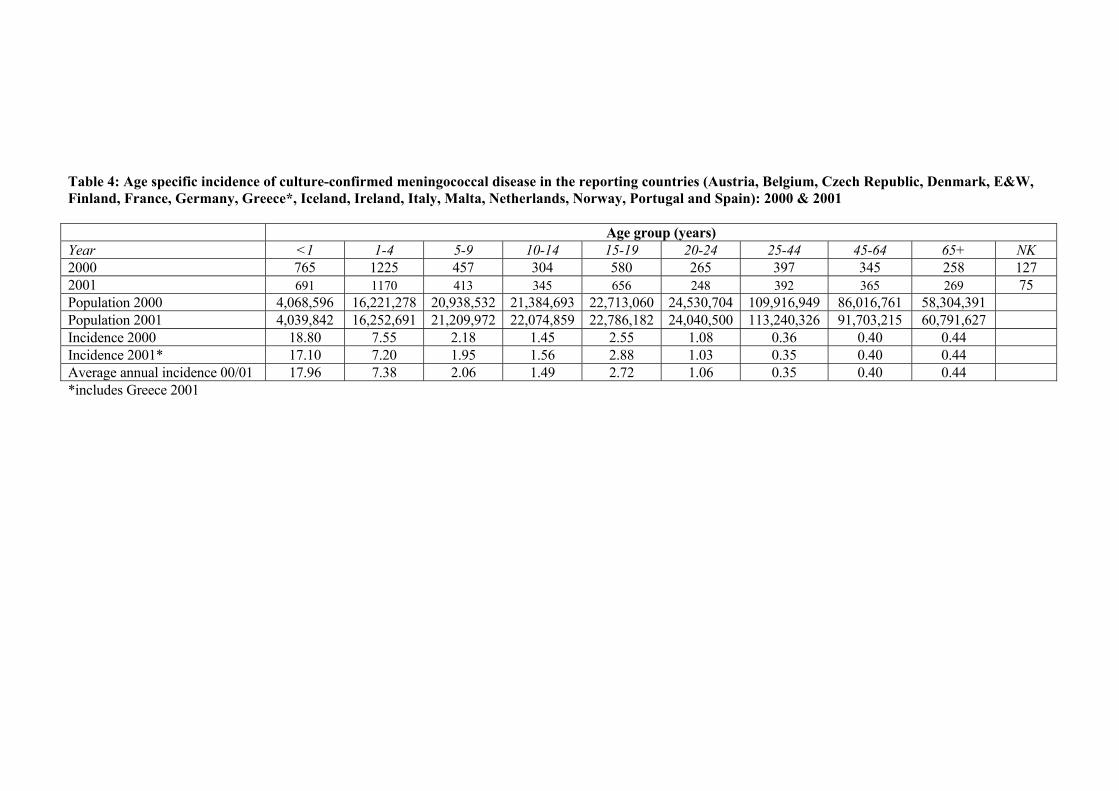
Table 4: Age specific incidence of culture-confirmed meningococcal disease in the reporting countries (Austria, Belgium, Czech Republic, Denmark, E&W, Finland, France, Germany, Greece*, Iceland, Ireland, Italy, Malta, Netherlands, Norway, Portugal and Spain): 2000 & 2001
Age group (years) Year <1 1-4 5-9 10-14 15-19 20-24 25-44 45-64 65+ NK2000 765 1225 457 304 580 265 397 345 258 1272001 691 1170 413 345 656 248 392 365 269 75 Population 2000 4,068,596 16,221,278 20,938,532 21,384,693 22,713,060 24,530,704 109,916,949 86,016,761 58,304,391 Population 2001 4,039,842 16,252,691 21,209,972 22,074,859 22,786,182 24,040,500 113,240,326 91,703,215 60,791,627Incidence 2000 18.80 7.55 2.18 1.45 2.55 1.08 0.36 0.40 0.44Incidence 2001* 17.10 7.20 1.95 1.56 2.88 1.03 0.35 0.40 0.44Average annual incidence 00/01 17.96 7.38 2.06 1.49 2.72 1.06 0.35 0.40 0.44*includes Greece 2001

Table 5: Age distribution of culture and/or PCR confirmed cases of invasive meningococcal disease in Austria, Czech Republic*, England & Wales, Greece*, Iceland*, Ireland and Norway : 1999, 2000 & 2001
Age group Year <1 year 1-4 years 5-9 years 10-14 years 15-20 years 20-24 years 25-44 years 45-64 years 65+ years Total
known No. % No. % No. % No. % No. % No. % No. % No. % No. % 1999 616 18% 965 29% 351 10% 247 7% 474 14% 149 4% 231 7% 188 6% 123 4% 33442000 574 18% 922 29% 291 9% 199 6% 349 11% 175 6% 292 9% 243 8% 133 4% 31782001* 602 20% 798 26% 290 10% 214 7% 353 12% 151 5% 273 9% 221 7% 133 4% 3035Total 1792 19% 2685 28% 932 10% 660 7% 1176 12% 475 5% 796 8% 652 7% 389 4% 9557*only 2001 data for Czech Republic, Greece & Iceland Table 6: Age specific incidence rate (per 100,000 population) of culture-confirmed meningococcal disease serogroup B in the EU reporting countries: 1999, 2000 and 2001
< 1 year 1-4 years 5-9 year 10-14 years 15-19 years 20-24 years 25-44 years 45-64 years 65 years plus Year
TotalNo. Rate No. Rate No. Rate No. Rate No. Rate No. Rate No. Rate No. Rate No. Rate
1999 3315 568 13.96 950 5.86 415 1.98 258 1.21 468 2.06 155 0.66 193 0.18 173 0.20 135 0.232000 3196 679 16.69 893 5.51 322 1.54 189 0.88 381 1.68 157 0.64 227 0.21 217 0.25 131 0.222001* 2877 535 13.24 817 5.02 277 1.31 210 0.95 377 1.65 135 0.56 200 0.18 194 0.21 111 0.18* includes Greece Table 7: Age specific incidence rate (per 100,000 population) of culture-confirmed meningococcal disease serogroup C in the EU reporting countries: 1999, 2000 and 2001
< 1 year 1-4 years 5-9 year 10-14 years 15-19 years 20-24 years 25-44 years 45-64 years 65 years plus Year
TotalNo. Rate No. Rate No. Rate No. Rate No. Rate No. Rate No. Rate No. Rate No. Rate
1999 1518 132 3.24 391 2.41 167 0.80 152 0.71 293 1.29 106 0.43 97 0.09 99 0.12 80 0.14 2000 1389 107 2.63 363 2.24 156 0.75 110 0.51 200 0.88 102 0.42 149 0.14 108 0.13 94 0.162001* 1221 85 2.10 268 1.65 115 0.54 106 0.48 216 0.95 87 0.36 133 0.12 128 0.14 83 0.14* includes Greece

Table 8: Proportion of meningitis and septicaemia in culture-confirmed cases of meningococcal disease by country, 1999
Country Meningitis alone
Meningitis or Meningitis & Septicaemia combined
Septicaemia alone
Total
Austria 31 56 74% 20 26% 76Belgium 107 202 75% 68 25% 270Czech 42 63 71% 26 29% 89Denmark 33 112 74% 39 26% 151E&W 367 560 39% 860 61% 1420Finland 33 33 66% 17 34% 50France 270 314 80% 80 20% 394Germany 167 237 77% 70 23% 307Iceland 7 14 70% 6 30% 20Ireland 25 46 24% 143 76% 189Italy 69 88 68% 41 32% 129Malta 0 0 0% 12 100% 12Netherlands 195 341 80% 83 20% 424Norway 18 42 64% 24 36% 66Spain-lab* 156 276 63% 162 37% 438Total 1520 2384 59% 1651 41% 4035*Spanish reference laboratory data only is used here Table 9: Proportion of meningitis and septicaemia in culture-confirmed cases of meningococcal disease by country, 2000
Country Meningitis alone
Meningitis or Meningitis & Septicaemia combined
Septicaemia alone
Total
Austria 27 43 74% 15 26% 58Belgium 90 167 67% 81 33% 248Czech 38 46 82% 10 18% 56Denmark 28 88 73% 33 27% 121E&W 235 365 38% 608 63% 973Finland 26 26 65% 14 35% 40France 300 353 76% 111 24% 464Germany 197 281 77% 84 23% 365Iceland 6 10 71% 4 29% 14Ireland 20 41 24% 128 76% 169Italy 87 119 78% 34 22% 153Malta 3 8 50% 8 50% 16Netherlands 179 332 80% 81 20% 413Norway 19 46 67% 23 33% 69Spain-lab* 173 308 63% 181 37% 489Total 1428 2233 61% 1415 39% 3648* Spanish reference laboratory data only is used here
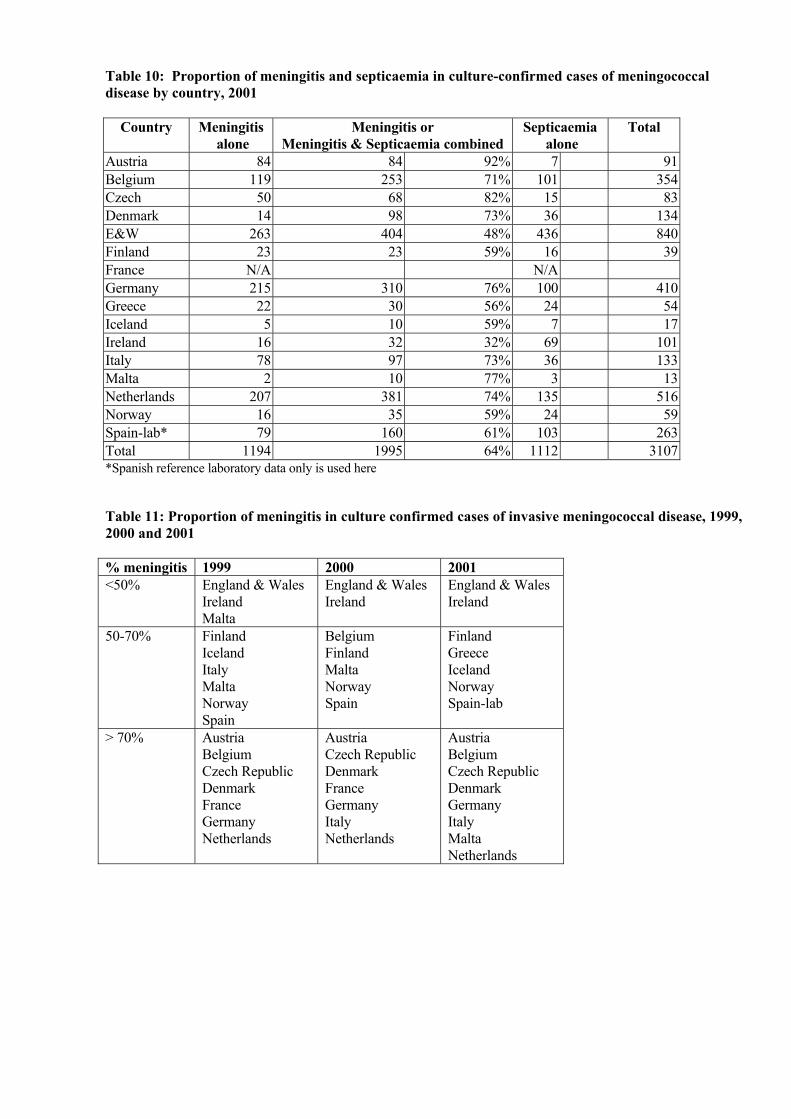
Table 10: Proportion of meningitis and septicaemia in culture-confirmed cases of meningococcal disease by country, 2001
Country Meningitis alone
Meningitis or Meningitis & Septicaemia combined
Septicaemia alone
Total
Austria 84 84 92% 7 91Belgium 119 253 71% 101 354Czech 50 68 82% 15 83Denmark 14 98 73% 36 134E&W 263 404 48% 436 840Finland 23 23 59% 16 39France N/A N/A Germany 215 310 76% 100 410Greece 22 30 56% 24 54Iceland 5 10 59% 7 17Ireland 16 32 32% 69 101Italy 78 97 73% 36 133Malta 2 10 77% 3 13Netherlands 207 381 74% 135 516Norway 16 35 59% 24 59Spain-lab* 79 160 61% 103 263Total 1194 1995 64% 1112 3107*Spanish reference laboratory data only is used here Table 11: Proportion of meningitis in culture confirmed cases of invasive meningococcal disease, 1999, 2000 and 2001 % meningitis 1999 2000 2001 <50% England & Wales
Ireland Malta
England & Wales Ireland
England & Wales Ireland
50-70% Finland Iceland Italy Malta Norway Spain
Belgium Finland Malta Norway Spain
Finland Greece Iceland Norway Spain-lab
> 70% Austria Belgium Czech Republic Denmark France Germany Netherlands
Austria Czech Republic Denmark France Germany Italy Netherlands
Austria Belgium Czech Republic Denmark Germany Italy Malta Netherlands
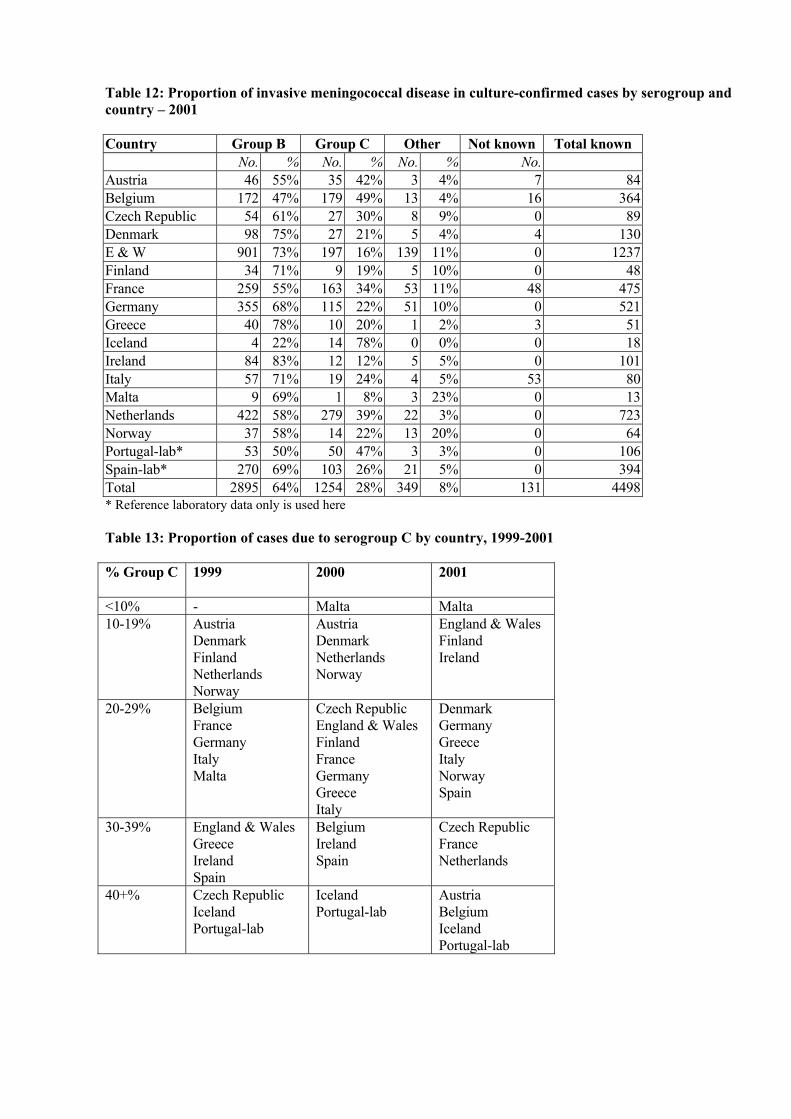
Table 12: Proportion of invasive meningococcal disease in culture-confirmed cases by serogroup and country – 2001 Country Group B Group C Other Not known Total known No. % No. % No. % No. Austria 46 55% 35 42% 3 4% 7 84 Belgium 172 47% 179 49% 13 4% 16 364 Czech Republic 54 61% 27 30% 8 9% 0 89 Denmark 98 75% 27 21% 5 4% 4 130 E & W 901 73% 197 16% 139 11% 0 1237 Finland 34 71% 9 19% 5 10% 0 48 France 259 55% 163 34% 53 11% 48 475 Germany 355 68% 115 22% 51 10% 0 521 Greece 40 78% 10 20% 1 2% 3 51 Iceland 4 22% 14 78% 0 0% 0 18 Ireland 84 83% 12 12% 5 5% 0 101 Italy 57 71% 19 24% 4 5% 53 80 Malta 9 69% 1 8% 3 23% 0 13 Netherlands 422 58% 279 39% 22 3% 0 723 Norway 37 58% 14 22% 13 20% 0 64 Portugal-lab* 53 50% 50 47% 3 3% 0 106 Spain-lab* 270 69% 103 26% 21 5% 0 394 Total 2895 64% 1254 28% 349 8% 131 4498 * Reference laboratory data only is used here Table 13: Proportion of cases due to serogroup C by country, 1999-2001 % Group C
1999 2000 2001
<10% - Malta Malta 10-19% Austria
Denmark Finland Netherlands Norway
Austria Denmark Netherlands Norway
England & Wales Finland Ireland
20-29% Belgium France Germany Italy Malta
Czech Republic England & Wales Finland France Germany Greece Italy
Denmark Germany Greece Italy Norway Spain
30-39% England & Wales Greece Ireland Spain
Belgium Ireland Spain
Czech Republic France Netherlands
40+% Czech Republic Iceland Portugal-lab
Iceland Portugal-lab
Austria Belgium Iceland Portugal-lab

Table 14: Proportion of invasive meningococcal disease in Culture- or PCR-confirmed cases by serogroup and country – 2001 Country Group B Group C Other Not grouped Total known No % No % No % No % No Austria 55 57% 39 40% 3 3% 0 0% 97Czech Republic 55 61% 27 30% 8 9% 0 0% 90 E & W 1688 73% 319 14% 184 8% 136 6% 2327 Greece 72 46% 14 9% 39 25% 32 20% 157Ireland 228 84% 34 12% 6 2% 5 2% 273Malta 9 64% 1 7% 3 21% 1 7% 14Norway 43 61% 14 20% 13 18% 1 1% 71Total 2150 71% 448 15% 256 8% 175 6% 3029

Table 15: Proportion of cases presenting with meningitis in the Group B culture confirmed cases, by country: 1999 & 2000
Country Year Meningitis alone
Meningitis OR (Meningitis & Septicaemia)
Septicaemia alone
Total Year Meningitis alone
Meningitis OR (Meningitis & Septicaemia)
Septicaemia alone
Total
Austria 1999 23 42 72% 16 58 2000 23 36 77% 11 47Belgium 1999 67 132 75% 44 176 2000 54 101 67% 49 150Czech Republic 1999 25 36 75% 12 48 2000 26 31 79% 8 39Denmark 1999 28 97 76% 30 127 2000 21 75 76% 24 99E&W 1999 249 347 43% 452 799 2000 166 252 42%. 353 605Finland 1999 24 24 77% 7 31 2000 17 17 71% 7 24France 1999 191 215 79% 55 270 2000 200 229 80% 57 286Germany 1999 129 183 81% 42 225 2000 143 206 80% 52 258Iceland 1999 2 5 50% 5 10 2000 3 4 80% 1 5Ireland 1999 16 34 28% 88 122 2000 14 29 29% 70 99Italy 1999 50 68 78% 19 87 2000 52 70 85% 12 82Malta 1999 0 0 0% 6 6 2000 3 8 53% 7 15Netherlands 1999 173 289 80% 72 361 2000 146 265 82% 60 325Norway 1999 14 34 62% 21 55 2000 14 35 69% 16 51Spain-lab* 1999 75 154 63% 89 243 2000 107 180 64% 102 282TOTAL 1999 1066 1660 63% 958 2618 2000 989 1538 65% 829 2367*Spanish reference laboratory data only is used here.

Table 16: Proportion of cases presenting with meningitis in the Group B culture confirmed cases, by country: 2001
Country Year Meningitis alone
Meningitis OR (Meningitis & Septicaemia)
Septicaemia alone
Total
Austria 2001 42 42 91% 4 46Belgium 2001 58 119 75% 39 158Czech Republic 2001 30 41 84% 8 49Denmark 2001 9 73 74% 25 98E&W 2001 205 315 51% 306 621Finland 2001 21 21 72% 8 29France 2001 Germany 2001 159 223 79% 59 282Greece 2001 15 22 55% 18 40Iceland 2001 0 3 75% 1 4Ireland 2001 13 26 31% 58 84Italy 2001 23 36 63% 21 57Malta 2001 1 6 67% 3 9Netherlands 2001 136 237 76% 75 312Norway 2001 10 21 58% 15 36Portugal-lab 2001 28 35 68% 18 53Spain-lab* 2001 60 111 59% 78 189TOTAL 2001 810 1331 65% 736 2067*Spanish reference laboratory data only is used here.

Table 17: Proportion of cases presenting with meningitis in the Group C culture-confirmed cases, by country: 1999& 2000
Country Year Meningitis alone
Meningitis OR (Meningitis & Septicaemia
Septicaemia alone
Total Year Meningitis alone
Meningitis OR (Meningitis
& Septicaemia)
Septicaemia alone
Total
Austria 1999 6 10 77% 3 13 2000 4 7 70% 3 10Belgium 1999 31 54 72% 21 75 2000 30 53 65% 29 82Czech Republic 1999 15 25 68% 12 37 2000 6 9 82% 2 11Denmark 1999 4 13 62% 8 21 2000 6 11 61% 7 18E&W 1999 97 183 33% 368 551 2000 48 86 29% 209 295Finland 1999 5 5 56% 4 9 2000 6 6 60% 4 10France 1999 50 67 80% 17 84 2000 56 70 71% 28 98Germany 1999 30 44 65% 24 68 2000 42 57 70% 24 81Iceland 1999 5 9 90% 1 10 2000 3 6 75% 2 8Ireland 1999 9 12 20% 49 61 2000 5 11 18% 51 62Italy 1999 15 17 65% 9 26 2000 11 18 55% 15 33Malta 1999 0 0 0 0% 1 10 0% 3 3 2000Netherlands 1999 18 45 85% 8 53 2000 30 61 77% 18 79Norway 1999 4 7 78% 2 9 2000 4 10 91% 1 11Spain-lab* 1999 74 111 61% 70 181 2000 63 122 62% 76 198TOTAL 1999 363 602 50% 599 1201 2000 314 527 53% 470 997*Spanish reference laboratory data only is used here

Table 18: Proportion of cases presenting with meningitis in the Group C culture-confirmed cases, by country: 2001
Country Year Meningitis alone
Meningitis OR (Meningitis & Septicaemia
Septicaemia alone
Total
Austria 2001 33 33 94% 2 35Belgium 2001 50 117 69% 52 169Czech Republic 2001 14 20 77% 6 26Denmark 2001 2 17 63% 10 27E&W 2001 25 48 34% 92 140Finland 2001 2 2 29% 5 7France 2001 Germany 2001 41 61 67% 30 91Greece 2001 4 5 50% 5 10Iceland 2001 5 7 54% 6 13Ireland 2001 2 5 42% 7 12Italy 2001 9 10 53% 9 19Malta 2001 0 1 100% 0 1Netherlands 2001 68 137 71% 57 194Norway 2001 5 8 57% 6 14Portugal-lab* 2001 23 34 69% 15 49Spain-lab* 2001 14 44 65% 24 68TOTAL 2001 297 549 63% 326 875*Portuguese and Spanish reference laboratory data only is used here

Table 19: No. (Proportion) of invasive meningococcal disease in culture-confirmed cases other than serogroup B and C, by country – 2001 (NGA’s left out of this table, but incl. In total known) Country Group A Group W135 Group X Group Y Group Z/29E Not known of
total Total known
No % No. % No. % No. % No. % No. No.Austria 0 1 1.2% 0 2 2.4% 0 7 84Belgium 0 10 2.7% 1 0.3% 0 0 16 364Czech Republic 4 4.5% 1 1.1% 0 3 3.4% 0 0 89 Denmark 2 1.5% 2 1.5% 0 1 0.8% 0 4 130E & W 2 0.2% 97 7.8% 7 0.6% 24 1.9% 4 0.3% 0 1237 Finland 0 1 2.1% 0 4 8.3% 0 0 48France 7 1.5% 31 6.5% 12 2.5% 13 2.7% 0 48 475Germany 1 0.2% 17 3.2% 0 22 4.2% 1 0.2% 0 521Greece 1 2.0% 0 0 0 0 3 51Iceland 0 0 0 0 0 0 18Ireland 0 2 2.0% 0 1 9.9% 0 0 101Italy 2 2.5% 2 2.5% 0 0 0 53 80Malta 0 0 0 0 1 7.7% 0 13Netherlands 0 14 1.9% 0 4 0.6% 2 0 723Norway 0 8 12.5 0 4 6.3% 0 0 64Portugal-lab* 0 2 1.9% 0 1 0.9% 0 0 106Spain-lab* 3 0.8% 4 1.0% 0 10 2.5% 4 1.0% 0 394Total 22 0.5% 192 4.3% 20 0.5% 89 2.0% 12 0.3% 131 4498* Portugal’s reference laboratory data only is used here * Spanish reference laboratory data only is used here

Table 20: Major serogroup of invasive meningococcal disease cases other than groups B and C amongst the contributing countries: 1999-2001 Major serogroup
1999 2000 2001
W135 England & Wales Ireland Malta Netherlands Portugal-lab
Austria Belgium Czech Republic (with A) Denmark England & Wales Finland France Greece-lab Netherlands Norway Portugal-lab Spain-lab
Belgium Denmark (with A) England & Wales France Ireland Netherlands Norway Portugal-lab
X Denmark (with Y) Y Austria
Belgium Czech Republic Denmark (with X) Finland France Germany Norway Spain-lab
Germany Iceland Ireland Italy
Austria Finland Germany Spain-lab
29E
- - Malta
A
Greece Italy
Czech Republic (with W135)
Czech Republic Denmark (with W135) Greece

Table 21: No. of cases (%) of group C serotypes by country : 1999 (cases where serotype known/given) Country P2.2a P2.2b NT Other Total
No % No % No % No % Austria 1 7% 6 43% 5 36% 2 14% 14 Belgium 29 38% 34 44% 10 13% 4 5% 77 Czech Republic 20 83% 3 13% 1 4% 0 0% 24 Denmark 8 38% 1 5% 2 10% 10 48% 21 E & W 429 67% 65 10% 123 19% 23 4% 640 Finland 1 11% 2 22% 6 67% 0 0% 9 France 31 31% 38 38% 24 24% 7 7% 100 Germany 33 38% 24 27% 20 23% 11 13% 88 Greece 14 78% 0 0% 4 22% 0 0% 18 Ireland 34 81% 4 10% 1 2% 3 7% 42 Italy 15 75% 0 0% 3 15% 2 10% 20 Malta 1 100% 0 0% 0 0% 0 0% 1 Netherlands 61 74% 14 17% 4 5% 3 4% 82 Norway 4 40% 1 10% 1 10% 4 40% 10 Spain 40 17% 175 76% 8 3% 7 3% 230 Total 721 52% 367 27% 212 15% 76 6% 1376 Table 22: No. of cases (%) of group C serotypes by country : 2000 (in cases where serotype known/given) Country P2.2a P2.2b NT Other Total
No % No % No % No % Austria 6 60% 4 40% 0 0% 0 0% 10 Belgium 40 47% 31 36% 10 12% 4 5% 85 Czech Republic 9 90% 0 0% 1 10% 0 0% 10 Denmark 12 67% 1 6% 1 6% 4 22% 18 E & W 332 74% 31 7% 76 17% 12 3% 451 Finland 3 30% 0 0% 6 60% 1 10% 10 Germany 38 40% 17 18% 35 36% 6 6% 96 Greece 8 80% 1 10% 1 10% 0 0% 10 Ireland 47 92% 3 6% 1 2% 0 0% 51 Italy 12 50% 6 25% 5 21% 1 4% 24 Malta 0 0% 1 100% 0 0% 0 0% 1 Netherlands 71 67% 21 20% 10 9% 4 4% 106 Norway 8 67% 3 25% 0 0% 1 8% 12 Spain 56 24% 147 63% 31 13% 1 0% 235 Total 642 57% 266 24% 177 16% 34 3% 1119

Table 23: No. of cases (%) of group C serotypes by country : 2001 (in cases where serotype known/given) Country P2.2a P2.2b NT Other Total
No % No % No % No % Austria 17 50% 11 32% 5 15% 1 3% 34 Belgium 122 69% 47 26% 7 4% 2 1% 178 Czech Republic 13 59% 0 0% 9 41% 0 0% 22 Denmark 9 36% 5 20% 6 24% 5 20% 25 E & W 164 83% 6 3% 21 11% 6 3% 197 Finland 3 33% 0 0% 5 56% 1 11% 9 France 65 53% 36 30% 16 13% 5 4% 122 Germany 73 63% 19 17% 17 15% 6 5% 115 Greece 3 38% 2 25% 1 13% 2 25% 8 Ireland 6 100% 0 0% 0 0% 0 0% 6 Italy 8 53% 6 40% 1 7% 0 0% 15 Malta 0 0% 0 0% 1 100% 0 0% 1 Netherlands 216 77% 37 13% 15 5% 11 4% 279 Norway 4 33% 1 8% 5 42% 2 17% 12 Spain-lab 53 51% 38 37% 8 8% 4 4% 103 Total 756 67% 208 18% 117 10% 45 4% 1126

Table 24: No. of cases (%) of selected group B phenotypes by country : 2001 (cases where serotype known/given) B:NT:NT/
P1.15/NT B:NT:1.9 B:15:1.7,1.16 B:4:1.4 B:2a
subtypes B:NT:P1.5 and/or P1.2
B:P3.1:NT/NT/NT
B:NT:NT/NT/NT
Other Total
No. % No. % No. % No. % No % No. % No. % No. % No. % No.Austria 2 4% 0 0% 12 26% 1 2% 0 0% 3 7% 0 0% 6 13% 22 48% 46Belgium 0 0% 0 0% 9 5% 79 47% 7 4% 9 5% 1 1% 6 4% 58 34% 169Czech Rep. 1 3% 0 0% 3 9% 2 6% 1 3% 5 15% 0 0% 2 6% 20 59% 34Denmark 1 1% 2 2% 45 49% 1 1% 1 1% 0 0% 4 4% 4 4% 34 37% 92E&W 112 12
% 71 8% 31 3% 201 22% 14 2% 28 3% 26 3% 35 4% 383 43% 901
Finland 1 3% 1 3% 2 6% 5 15% 0 0% 1 3% 1 3% 2 6% 21 62% 34France 5 3% 2 1% 1 1% 33 17% 2 1% 7 4% 8 4% 23 12% 111 58% 192Greece 0 0% 0 0% 0 0% 6 17% 5 14% 0 0% 0 0% 0 0% 25 69% 36Germany 6 2% 3 1% 49 14% 34 10% 5 1% 17 5% 4 1% 16 5% 221 62% 355Ireland 0 0% 6 12% 1 2% 18 35% 0 0% 1 2% 0 0% 0 0% 26 50% 52Italy 0 0% 1 2% 5 11% 2 4% 1 2% 1 2% 0 0% 3 7% 33 72% 46Malta 0 0% 0 0% 0 0% 0 0% 0 0% 0 0% 0 0% 0 0% 9 100% 9Netherlands 2 1% 5 1% 15 4% 115 27% 3 1% 3 1% 6 1% 15 4% 258 61% 422Norway 3 10
% 0 0% 7 23% 2 6% 0 0% 0 0% 2 6% 2 6% 15 48% 31
Spain 19 7% 10 4% 3 1% 7 3% 8 3% 10 4% 5 2% 42 16% 166 61% 270 Total 152 6% 101 4% 183 7% 506 19% 47 2% 85 3% 57 2% 156 6% 1402 52% 2689TOTAL = all culture confirmed serotyped/serosubtyped B’s incl. B; NT; NT/NT/NT

Table 25: Major serotype of group C invasive meningococcal disease amongst the contributing countries 1999-2001 Major serotype
1999 2000 2001
2a Czech Republic Denmark England and Wales Germany Greece Italy Ireland Netherlands Norway
Austria Belgium Czech Republic Denmark England and Wales Germany Greece Ireland Italy Netherlands
Austria Belgium Czech Republic Denmark England & Wales France Germany Greece Ireland Italy Netherlands Spain
2b Austria Belgium France Spain
Norway Spain
NT Finland Finland Finland Malta Norway
Table 26: Major serotype of group B invasive meningococcal disease amongst the contributing countries 1999-2001 Major serotype
1999 2000 2001
B:15:P1.7, P.16 Austria Denmark France (with B4: P1.4) Germany Norway
Austria Denmark Germany Italy Norway
Austria Denmark Germany Italy
B:4: P1.4 Belgium England & Wales Finland France (with B:15:P1.7, P.16) Greece Ireland Italy Netherlands
Belgium England & Wales Finland Greece Ireland Netherlands
Belgium England & Wales Finland France Greece Ireland Netherlands Norway
Note: The major Group B serotype over 1999-2001 in both Spain and Malta was B:4:1.15

Table 27: Age specific incidence (per 100,000) of culture-confirmed Group B meningococcal disease by country : 2001
<1 yr 1-4yrs 5-9yrs 10-14yrs 15-19yrs 20-24yrs 25-44yrs 45-64yrs 65+yrs NKCountry
Totalcases No Inc No Inc No Inc No Inc No Inc No Inc No Inc No Inc No Inc No
Austria 46 9 9.93 9 2.48 5 1.08 4 0.91 8 1.59 1 0.15 3 0.13 3 0.17 4 0.34 0Belgium 172 29 25.68 57 12.28 12 1.93 16 2.64 27 4.39 8 1.27 8 0.26 11 0.45 4 0.23 0Czech Republic 54 10 11.12 8 2.20 4 0.68 1 0.15 17 2.46 2 0.23 5 0.23 6 0.22 1 0.07 0 Denmark 98 15 23.85 24 8.75 15 4.31 12 3.89 14 5.02 2 0.61 4 0.25 9 0.65 3 0.38 0E&W 901 238 37.56 255 10.06 73 2.14 51 1.49 92 2.85 35 1.12 66 0.42 59 0.48 30 0.36 2Finland 34 5 7.96 6 2.29 3 0.95 0 0.00 5 1.53 5 1.64 3 0.20 7 0.55 0 0.00 0France 259 57 7.75 48 1.61 22 0.58 19 0.49 41 1.03 20 0.53 24 0.14 13 0.09 10 0.11 5Germany 355 29 3.76 107 3.37 25 0.59 30 0.64 73 1.58 22 0.49 25 0.10 26 0.12 9 0.07 9Greece 40 7 6.94 12 2.96 10 1.89 7 1.16 1 0.14 1 0.13 2 0.07 0 0.00 0 0.00 0Iceland 4 1 24.89 1 5.62 0 0.00 1 4.92 1 4.69 0 0.00 0 0.00 0 0.00 0 0.00 0Ireland 84 25 45.45 25 11.58 7 2.67 7 2.42 10 3.07 5 1.49 2 0.18 1 0.12 2 0.47 0Italy 57 6 1.11 17 0.79 4 1.44 5 0.18 7 0.23 5 0.14 7 0.04 4 0.03 2 0.02 0Malta 9 0 0.00 4 18.54 1 3.72 2 6.99 1 3.57 0 0.00 1 0.91 0 0.00 0 0.00 0Netherlands 422 67 32.35 142 17.88 53 5.32 35 3.57 54 5.80 12 1.25 22 0.44 23 0.58 14 0.64 0Norway 37 2 3.38 7 2.90 3 0.97 3 1.02 7 2.63 2 0.73 5 0.38 2 0.19 6 0.88 0Portugal-lab* 53 18 16.9 20 4.45 4 0.74 4 0.62 0 0.00 1 0.12 2 0.07 1 0.04 3 0.00 0Spain-lab** 270 48 12.11 58 3.76 25 1.29 14 0.69 18 0.75 10 0.33 21 0.17 26 0.29 26 0.39 24Total 2895 566 13.98 800 4.87 266 1.25 211 0.96 376 1.66 139 0.57 200 0.18 191 0.21 114 0.19 40 * Portugal’s reference laboratory data only is used here, and includes only a proportion of reporting labs/hospitals

Table 28: Age specific incidence (per 100,000) of culture-confirmed Group C meningococcal disease by country : 2001
<1 yr 1-4yrs 5-9yrs 10-14yrs 15-19yrs 20-24yrs 25-44yrs 45-64yrs 65+yrs NKCountry
Totalcases No Inc No Inc No Inc No Inc No Inc No Inc No Inc No Inc No Inc No
Austria 35 5 5.52 6 1.65 2 0.43 7 1.58 8 1.59 1 0.15 3 0.13 3 0.17 0 0.00 0Belgium 179 15 13.28 40 8.62 29 4.67 3 0.49 36 5.85 11 1.75 26 0.85 8 0.33 10 0.58 1Czech Republic 27 1 1.11 3 0.83 2 0.34 3 0.46 14 2.03 1 0.11 2 0.09 1 0.04 0 0.00 0 Denmark 27 0 0.00 6 2.19 2 0.57 3 0.97 8 2.87 1 0.31 1 0.06 4 0.29 2 0.25 0E&W 197 8 1.26 24 0.95 3 0.09 6 0.18 11 0.34 26 0.83 42 0.26 52 0.42 25 0.30 0Finland 9 0 0.00 0 0.00 1 0.32 1 0.30 0 0.00 0 0.00 4 0.26 3 0.24 0 0.00 0France 163 16 2.17 44 1.48 16 0.42 12 0.31 24 0.60 9 0.24 10 0.06 10 0.07 17 0.18 5Germany 115 6 0.78 43 1.35 9 0.21 14 0.30 20 0.43 4 0.09 9 0.04 7 0.03 3 0.02 0Greece 10 3 2.97 0 0.00 1 0.19 2 0.33 2 0.27 0 0.00 1 0.03 1 0.04 0 0.00 0Iceland 14 2 49.78 11.232 1 4.48 1 4.92 1 4.69 5 23.71 0 0.00 1 1.97 1 3.22 0Ireland 12 2 3.64 3 1.39 0 0.00 1 0.35 1 0.31 1 0.30 1 0.09 2 0.25 1 0.23 0Italy 19 1 0.18 0.092 4 1.44 1 0.04 3 0.10 1 0.03 3 0.02 1 0.01 3 0.03 0Malta 1 0 0.00 4.631 0 0.00 0 0.00 0 0.00 0 0.00 0 0.00 0 0.00 0 0.00 0Netherlands 279 20 9.66 53 6.68 27 2.71 39 3.98 67 7.20 15 1.56 19 0.38 26 0.66 13 0.60 0Norway 14 1 1.69 4 1.65 1 0.32 0 0.00 6 2.26 0 0.00 0 0.00 1 0.10 1 0.15 0Portugal-lab* 50 12 11.28 24 5.34 7 1.29 2 0.31 1 0.13 0 0.00 3 0.11 1 0.04 0 0.00 0Spain-lab** 103 5 1.26 9 0.58 8 0.41 13 0.64 9 0.37 12 0.40 8 0.06 8 0.09 7 0.10 24Total 1254 86 2.12 269 1.64 115 0.54 106 0.48 216 0.96 87 0.36 133 0.12 129 0.14 83 0.14 30 • Portugal’s reference laboratory data only is used here • Spain’s reference laboratory data only is used here

Table 29: Case fatality rate in laboratory confirmed cases of meningococcal disease, by country: 1999-2001
Country Year Total cases
Died CFR Year Total cases
Died CFR Year Total cases
Died CFR
Austria 1999 97 7 7% 2000 83 5 6% 2001 106 7 7%
Belgium 1999 297 16 5% 2000 267 13 5% 2001 380 27 7%
Czech Republic 1999 93 7 8% 2000 61 5 8% 2001 93 10 11%
Denmark 1999 177 14 8% 2000 151 12 8% 2001 161 10 6%
E&W 1999 2784 201 7% 2000 2651 199 8% 2001 2327 189 8%
Finland 1999 57 10 18% 2000 N/A N/A N/A 2001 51 N/A N/A
France 1999 411 35 8% 2000 489 59 12% 2001 559 73 13%
Germany 1999 402 21 5% 2000 452 28 6% 2001 521 34 7%
Greece 1999 108 7 7% 2000 133 9 7% 2001 160 7 4%
Iceland 1999 21 2 10% 2000 18 2 11% 2001 20 2 10%
Ireland 1999 445 17 4% 2000 410 25 6% 2001 301 12 4%
Italy 1999 246 13 5% 2000 217 20 9% 2001 194 14 7%
Malta 1999 18 5 28% 2000 21 3 14% 2001 14 0 0%
Netherlands 1999 583 23 4% 2000 546 30 5% 2001 725 41 6%
Norway 1999 77 9 12% 2000 85 7 8% 2001 77 3 4%
Portugal-lab* 1999 N/A N/A N/A 2000 N/A N/A N/A 2001 100 N/A N/A
Spain-lab* 1999 602 9 1% 2000 692 5 1% 2001 394 1 0%
Total 1999 6418 396 6% 2000 6276 424 7% 2001 6183 430 7%
* Spanish reference laboratory data only is used here * Portugal’s reference laboratory data only is used here, and in 1999 includes a small number of reporting labs/hospitals

Table 30: Case fatality rate in laboratory confirmed cases (minus PCR) of meningococcal disease, by country: 1999-2001
Country Year Total cases
Died CFR Year Total cases
Died CFR Year Total cases
Died CFR
Austria 1999 85 4 5% 2000 68 3 4% 2001 88 7 8%Belgium 1999 297 16 5% 2000 264 13 5% 2001 380 27 7%Czech Republic
1999 92 6 7% 2000 61 4 7% 2001 82 8 10%
Denmark 1999 177 14 8% 2000 151 12 8% 2001 161 10 6%E&W 1999 952 59 6% 2000 912 77 8% 2001 732 79 11%Finland 1999 57 10 18% 2000 N/A N/A N/A 2001 N/A N/A N/AFrance 1999 411 35 8% 2000 489 59 12% 2001 559 73 13%Germany 1999 402 21 5% 2000 452 28 6% 2001 521 34 7%Greece 1999 108 7 7% 2000 133 9 7% 2001 29 1 3%Iceland 1999 21 2 10% 2000 18 2 11% 2001 18 2 11%Ireland 1999 205 10 5% 2000 189 8 4% 2001 129 5 4%Italy 1999 246 13 5% 2000 217 20 9% 2001 194 14 7%Malta 1999 18 5 28% 2000 21 3 14% 2001 14 0 0%Netherlands 1999 583 23 4% 2000 546 30 5% 2001 725 41 6%Norway 1999 73 9 12% 2000 76 5 7% 2001 70 3 4%Portugal-lab* 1999 N/A N/A N/A 2000 N/A N/A N/A 2001 N/A N/A N/ASpain-lab* 1999 602 9 1% 2000 692 5 1% 2001 643 59 9%Total 1999 4329 243 6% 2000 4289 278 6% 2001 4344 363 8%*Spanish reference laboratory data only is used here for 1999 & 2000, and reconciled dataset used for 2001 * Portugal’s reference laboratory data only is used here, and in 1999 includes a small number of reporting labs/hospitals

Table 31: Case Fatality Rate in laboratory confirmed cases of invasive meningococcal disease, by serogroup: 2001
Country A B C W135 Y No Deaths CFR No. Deaths CFR No. Deaths CFR No. Deaths CFR No. Deaths CFRAustria 0 0 0% 55 4 7% 39 2 5% 1 0 0% 2 0 0%Belgium 0 0 0% 172 3 2% 179 22 12% 10 2 20% 0 0 0%Czech Republic 4 0 0% 55 3 5% 28 6 21% 1 0 0% 3 1 33%Denmark 2 0 0% 99 5 5% 27 4 15% 2 0 0% 1 1 100%E&W 2 0 0% 1688 105 6% 319 57 18% 135 21 16% 31 4 13%Finland 0 N/A 34 N/A % 9 N/A 0 N/A 0 N/AFrance 11 2 18% 270 29 11% 172 26 15% 31 6 19% 13 2 15%Germany 1 0 0% 355 16 5% 115 12 10% 17 5 29% 22 4 5%Greece 28 0 0% 72 5 7% 14 2 14% 9 0 0% 2 0 0%Iceland 0 0 0% 4 1 25% 14 1 7% 0 0 0% 0 0 0%Ireland 0 0 0% 249 8 3% 35 3 9% 3 1 33% 1 0 0%Italy 3 0 0% 64 7 11% 21 5 24% 2 0 0% 0 0 0%Malta 0 0 0% 9 0 0% 1 0 0% 0 0 0% 0 0 0%Netherlands 0 0 0% 424 30 7% 279 11 4% 14 0 0% 4 0 0%Norway 0 0 0% 47 1 2% 15 2 13% 8 0 0% 0 0 0%Portugal-lab* 0 N/A 50 N/A 47 N/A 0 N/A 0 N/ASpain-lab* 3 0 0% 270 1 0.4% 103 0 0% 4 0 0% 10 0 0%Spain-notifs 6 0 0% 428 25 6% 147 31 21% Total +57 2 4% +3833 218 6% 1361 153 11% 237 35 15% 89 12 13%* Spanish reference laboratory data only is used here * Portugal’s reference laboratory data only is used here, and in 1999 includes a small number of reporting labs/hospitals + using Spain-lab

Table 32: Case Fatality Rate in laboratory confirmed cases of group B and group C meningococcal disease, by age group: 1999 –2001 (where age group given)
1999 2000 2001
Age group Group B Group C Group B Group C Group B Group C Under 1 Cases 732 191 799 105 777 98
Deaths 43 11 61 10 60 6CFR 5.9% 5.8% 7.6% 9.5% 7.7% 6.1%
1-4yrs Cases 1110 479 1133 409 1206 300Deaths 44 30 48 24 60 22
CFR 4.0% 6.3% 4.2% 5.9% 5.0% 7.3%5-9yrs Cases 419 203 384 178 414 131
Deaths 14 11 9 7 14 5CFR 3.3% 5.4% 2.3% 3.9% 3.4% 3.8%
10-14yrs Cases 285 167 230 139 293 115Deaths 2 14 7 15 14 9
CFR 0.7% 8.4% 3.0% 10.8% 4.8% 7.2%15-19yrs Cases 524 347 483 220 512 256
Deaths 22 44 19 31 25 30CFR 4.2% 12.7% 3.9% 14.1% 4.9% 11.7%
20-24yrs Cases 167 98 196 124 187 116Deaths 16 7 15 18 9 28
CFR 9.6% 7.1% 7.7% 14.5% 4.8% 24.1%25-44yrs Cases 237 123 298 186 283 182
Deaths 12 17 16 25 14 34CFR 5.1% 13.8% 5.4% 13.5% 4.9% 18.7%
45-64 yrs Cases 193 121 276 118 249 163Deaths 19 24 19 17 22 29
CFR 9.8% 19.8% 6.9% 14.4% 8.8% 17.8%65+yrs Cases 178 107 209 114 131 92
Deaths 26 18 25 19 23 19CFR 14.6% 17.3% 12% 16.7% 17.6% 20.7%

Table 33: Case fatality rate amongst culture-confirmed cases of meningococcal disease presenting with meningitis, by country: 1999, 2000 & 2001 (i.e. meningitis plus men/sept combined)
Country 1999 2000 2001 Total
Meningitis cases
Died CFR Total Meningitis
cases
Died CFR Total meningitis
cases
Died CFR
Austria 56 2 3.57% 43 2 4.65% 84 0 0%Belgium 202 13 6.44% 167 10 5.99% 253 19 7.5%Czech Republic
63 2 3.17% 46 3 6.52% 68 6 8.8%
Denmark 112 11 9.82% 88 7 7.959.09% 99 7 7.1%E&W 560 34 6.07 365 27 7.40% 404 24 5.9%Finland 33 4 12.12% 26 N/A N/A N/A N/A N/AFrance 314 22 7.01% 353 31 8.78% N/A N/A N/AGermany 237 8 3.38% 281 7 2.49% 310 11 3.5%Greece 30 0 0%Iceland 14 1 7.14% 10 1 10.00% 10 2 20%Ireland 46 4 8.70% 41 2 4.88% 32 1 3.1%Italy 88 5 5.68 87 4 4.60% 96 6 6.3%Malta 0 0 0% 8 0 0% 10 0 0%Netherlands 341 9 2.64% 332 16 4.82% 381 23 6.0%Norway 42 5 11.90% 46 1 2.17% 35 0 0%Portugal-lab* N/A N/A N/A N/A N/A N/A N/A N/A N/ASpain-lab* 276 5 1.81% 308 2 0.65% 160 0 0%Total 2384 125 5.24 2201 113 5.13 1972 99 5.0%* Spanish reference laboratory data only is used here * Portugal’s reference laboratory data only is used here, and in 1999 includes only a small number of reporting labs/hospitals
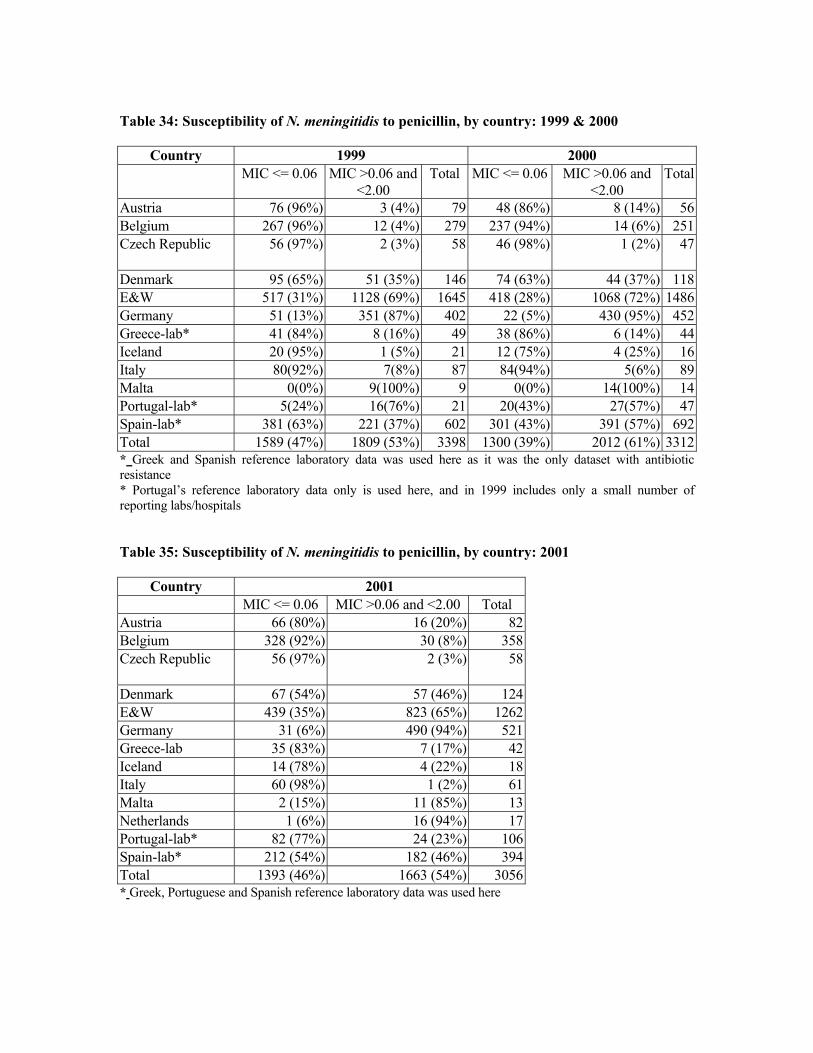
Table 34: Susceptibility of N. meningitidis to penicillin, by country: 1999 & 2000
Country 1999 2000 MIC <= 0.06 MIC >0.06 and
<2.00 Total MIC <= 0.06 MIC >0.06 and
<2.00 Total
Austria 76 (96%) 3 (4%) 79 48 (86%) 8 (14%) 56Belgium 267 (96%) 12 (4%) 279 237 (94%) 14 (6%) 251Czech Republic 56 (97%) 2 (3%) 58 46 (98%) 1 (2%) 47
Denmark 95 (65%) 51 (35%) 146 74 (63%) 44 (37%) 118E&W 517 (31%) 1128 (69%) 1645 418 (28%) 1068 (72%) 1486Germany 51 (13%) 351 (87%) 402 22 (5%) 430 (95%) 452Greece-lab* 41 (84%) 8 (16%) 49 38 (86%) 6 (14%) 44Iceland 20 (95%) 1 (5%) 21 12 (75%) 4 (25%) 16Italy 80(92%) 7(8%) 87 84(94%) 5(6%) 89Malta 0(0%) 9(100%) 9 0(0%) 14(100%) 14Portugal-lab* 5(24%) 21 27(57%)16(76%) 20(43%) 47Spain-lab* 381 (63%) 221 (37%) 602 301 (43%) 391 (57%) 692Total 1589 (47%) 1809 (53%) 3398 1300 (39%) 2012 (61%) 3312* Greek and Spanish reference laboratory data was used here as it was the only dataset with antibiotic resistance * Portugal’s reference laboratory data only is used here, and in 1999 includes only a small number of reporting labs/hospitals Table 35: Susceptibility of N. meningitidis to penicillin, by country: 2001
Country 2001 MIC <= 0.06 MIC >0.06 and <2.00 Total Austria 66 (80%) 16 (20%) 82Belgium 328 (92%) 30 (8%) 358Czech Republic 56 (97%) 2 (3%) 58
Denmark 67 (54%) 57 (46%) 124E&W 439 (35%) 823 (65%) 1262Germany 31 (6%) 490 (94%) 521Greece-lab 35 (83%) 7 (17%) 42Iceland 14 (78%) 4 (22%) 18Italy 60 (98%) 1 (2%) 61Malta 2 (15%) 11 (85%) 13Netherlands 1 (6%) 16 (94%) 17Portugal-lab* 82 (77%) 24 (23%) 106Spain-lab* 212 (54%) 182 (46%) 394Total 1393 (46%) 1663 (54%) 3056* Greek, Portuguese and Spanish reference laboratory data was used here


![Analysis differences betweenNeisseria meningitidis Neisseria … · seria meningitidis (Nm)]withthatofthegonococcus[Neisseria gonorrhoeae (Ng)]. These two human pathogens are very](https://img.dokumen.tips/doc/110x75/5ea11fa2b5452c63b84dc792/analysis-differences-betweenneisseria-meningitidis-neisseria-seria-meningitidis.jpg)