Embed Size (px)
Citation preview

mars 12, 2005
Introduction to the use ofgeophysical datasets forsupport to geologicalmapping

High-Resolution (HR) geophysicaldataset
• HR geophysical data - magnetics and radiometrics - havebeen acquired as part of a long-term programme aimed atobtaining complete coverage of Namibia by the year 2008
• Surveys flown with a 200m line spacing and 2500m ties ata terrain clearance of 80 to 100m provide exceptionaldataset that enable the regional geology and metallogeny tobe reassessed

Input of high-resolution geophysicalairborne surveys
• Complementing field geology, high-resolution geophysicalairborne surveys provide:– An homogeneous and rapid acquisition of physical parameters– A good definition of regional scale structures– An information about the prolongation of structures and geological
units at depth (magnetics)– A complete coverage of the survey area, independently of outcrop
conditions and vegetation– The detection of large hydrothermal alteration zones (pyrrhotite
and magnetite for magnetics, potassium and Uranium forradiometrics)

Constraints for interpreting high-resolution geophysical airborne data
• Existing geological maps, displaying lithologies and structures,can not correspond 100% to geophysics without combinedinterpretation of geological and processing of geophysical data
• There is no fully automatic processing from raw data tointerpreted maps. Interpretation requires:– A fully-equipped sustainable geophysical interpretation unit, linked with
field geologists– A knowledge of the relative physical properties of the main geological units
of the survey area– A reference to the basic principles of structural geology

General methodological framework
• An interpretation project aimed at a better knowledge ofthe geology of one region, requires a permanent referenceto geodynamics
• Interpretation is done in reference to the physical signatureof the main geological systems

Earth dynamics and geophysics
• As Earth is a living planet, its dynamics, like core dynamo orplate tectonics, is responsible of phenomenon like magneticfield or earthquakes
• If Earth was homogeneous, made of continuous concentriclayers with constant thickness and physical properties, therecording of these phenomenon would be isotrope at thesurface
• As Earth is not homogeneous, variation of the measuredparameters provides information about its heterogeneity, i.e.about its structure and composition

Melt andconvection
Plate tectonicsand stress field
Universalgravitation
Emissionspectrum,radioactivedecay
Core dynamo
“Living Earth”
Heat conductivityTemperature, degreeGradients, degree/m
Geothermy(natural)
Acoustic impedance = densityx velocityPropagation wave velocitiesin m/s
Time, msSeismics(natural andprovoked)
Density contrast (d)Gravity accelerationmGal
Gravimetry(natural)
Radioelement contents (% orequivalent ppm)
Gamma Ray emissionImpulse/s
Spectrometry(natural)
Magnetic susceptibility: k inSI or CGS
Magnetic fieldnT
Magnetism(natural)
Physical properties, unitsMeasured parameters,units
Method(source)
Main geophysical methods

Global link between Earth dynamics,physical signature and tectonic context
• Variations of the physical properties displayed at thesurface of the earth’s partly reflects variations in structureand composition of the lithosphere, linked to geodynamicsand tectonics
• Geophysical methods evaluate these variations and enablea modelling of their sources

Physical signature and geodynamiccontext
• Modern concepts for geodynamics and crustal structurerelates fundamentally physical properties of rocks andtectonic evolution
• Some examples– The magnetic anomalies of the oceanic crust– The structure of the lithosphere, rheology and decoupling surfaces– The role of gravitational processes in granite ascent processes

An idealistic mountain belt…
Choukroune, 1995

What geophysical signature for eachstructural element ?
Choukroune, 1995

Rift zone and sheeted dyke complex
Sheeted dyke complex17 km
Total horizontal derivative of the magnetic field

Hot spot and ring complexes
9 km
Etanenovolcano
Total horizontal derivative of the magnetic field

Collision and shear zone
Large wavelength foldsof the foreland basin
Southern DamaraShear zone
Neoproterozoic basin
Paleoproterozoic basement
Neoproterozoic collision belt
Anticline
Total horizontal derivative of the magnetic field
20 km

Introduction to the use of geophysicaldatasets
MAGNETISMThe Earth Magnetic field
• The magnetic susceptibility of rocks• The use of magnetic data and grid
processing for interpretationRADIOMETRY
• The natural gamma ray activity• The gamma-ray signature• Where are radioelements in the
(continental) crust ?

Earth magnetic field• The main magnetic field
– produced in the core of the earth and accounts for thevery large regional variations in field intensity anddirection
• The external magnetic field– produced by electric currents in the Earth’s ionosphere
• The anomalous magnetic field– produced by ferromagnetic minerals in the Earth’s crust

Liquid outer core
Eddy currents
Magnetic field
Earth Magnetic Field

Magnetic Flux Lines
ss
North PoleNorth Pole
South PoleSouth Pole
Magnetic EquatorMagnetic Equator

Principles of magnetic surveys• The physical parameter measured during magnetic
surveys is the Total Magnetic Intensity of the earth(TMI)– The Total Magnetic Field (no vector or tensor
information) is acquired in units of Nano-Tesla [nT](nano = 10-9)
– The strength of the total magnetic field is dependent onthe geographic location and varies with time anddistance from the Earth’s center (elevation)
– The dynamic range within a magnetic survey may reach10000 nT, whilst modern data acquisition andprocessing allows interpretation of anomalies down to0.1 nT

What do we measure in magnetism?• Variations recorded have three sources:
– The Earth dynamo complexity– The external field, including ionosphere currents, diurnal
variations corrected by the recording of the base station– The structure of the crust and magnetic susceptibility of
rocks contributing for less than 10% of the variations

The residual Total Magnetic Intensityof the earth (TMI) measured byairborne geophysical survey
Rehoboth 2316 D map

Introduction to the use of geophysicaldatasets
MAGNETISM• The Earth Magnetic field
The magnetic susceptibility of rocks• The use of magnetic data and grid
processing for interpretationRADIOMETRY
• The natural gamma ray activity• The gamma-ray signature• Where are radioelements in the
(continental) crust ?

The magnetic susceptibility of rocks
• The magnetic susceptibility measures the ability ofa rock or a mineral to be magnetised, i.e. toproduce an induced magnetic field while it isexposed to the magnetic field of the earth– Each mineral behaves as a dipole– The susceptibility of the mineral or of the rock, k, is the
ratio between the induced magnetic field and the Earthmagnetic field (k = I/H)

• Magnetic susceptibility of a rock depends on:– The proportion of magnetic minerals– Their nature, i.e. dia (opposite field) vs ferromagnetic
(same sense)• At the scale of anisotropic materials, the magnetic
susceptibility vary in intensity according to theorientation of the main fabric of ferro andparamagnetic minerals– Anisotropy of magnetic susceptibility is used as a strain
marker, especially in granites, where paramagneticbiotite and amphibole are preferentially orientatedaccording to the finite strain ellipsoid
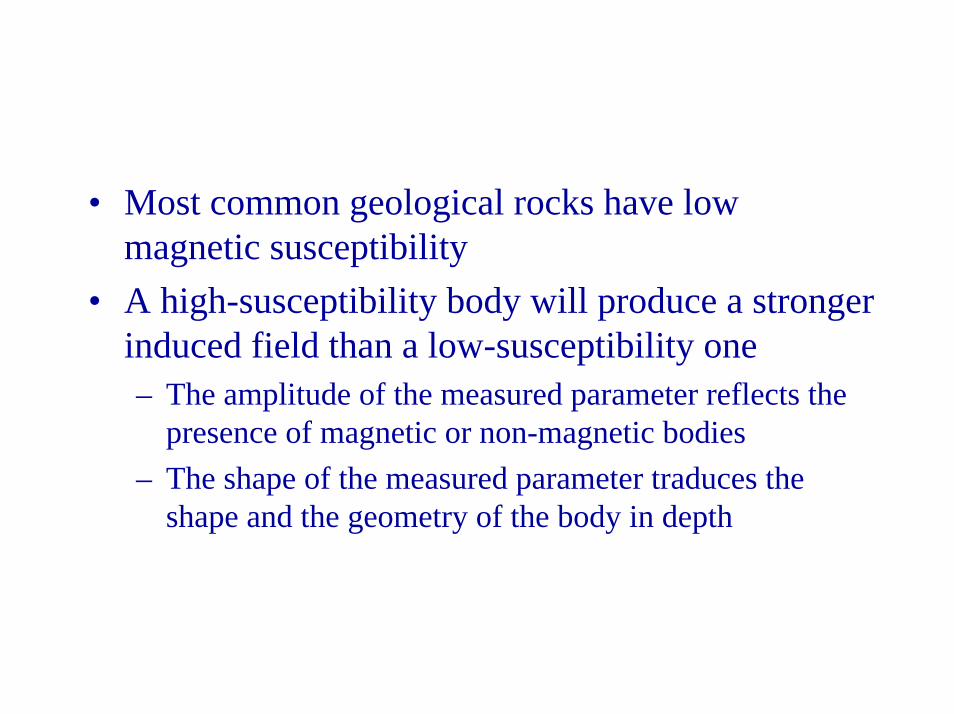
• Most common geological rocks have lowmagnetic susceptibility
• A high-susceptibility body will produce a strongerinduced field than a low-susceptibility one– The amplitude of the measured parameter reflects the
presence of magnetic or non-magnetic bodies– The shape of the measured parameter traduces the
shape and the geometry of the body in depth

M a g n e t i c s u s c e p t i b i l i t y , k x 1 0 - 6 R a n g e A v e r a g e
M i n e r a l s Q u a r tz - 1 0 - - 1 5 F e l d s p a r - 1 2 C a l c i t e - 1 - - 1 0 C l a y s 2 0 0 - 2 5 0 G r a p h i t e 1 0 0 C h a l c o p y r i t e C u F e S 4 0 0 P y r i t e F e 2 S 5 0 - 5 0 0 0 1 5 0 0 L i m o n i t e F e O H 2 5 0 0 A r s e n o p y r i t e F e A s S 3 0 0 0 H a e m a t i t e F e 2 O 3 5 0 0 - 3 5 0 0 0 6 5 0 0 C h r o m i t e 3 0 0 0 – 1 1 0 0 0 0 7 5 0 0 F r a n k l in i t e F e - Z n
s p in e l l e 4 3 0 0 0 0
P y r r h o t i t e F e 7 S 8 1 - 6 0 0 0 0 0 0 1 5 0 0 0 0 0 I l m e n i t e F e T i O 3 3 0 0 0 0 0 – 3 5 0 0 0 0 0 1 8 0 0 0 0 0 M a g n e t i t e F e 3 O 4 1 2 0 0 0 0 0 – 1 9 2 0 0 0 0 0 6 0 0 0 0 0 0
Magnetic susceptibility ofminerals

Magnetic susceptibility, k x 10-6 Range Average
Sedimentary rocks 900 Dolomite 0 - 900 100 Limestone 0 – 3 000 300 Sandstone 0 – 20 000 400 Shale 10 – 15 000 600 Banded Iron Formation
380 000
•The average values are low to very low. With the remarkable exceptionof Banded Iron Formation in Proterozoic terrains•High magnetic susceptibilities in sedimentary basins are mainly relatedto magnetite-rich layers, either from sedimentary source (heavy mineralsin conglomerates and sandstone, iron precipitation), low-temperaturehydrothermal alteration or volcanoclastic origin
Magneticsusceptibility ofsediments

Magnetic susceptibility, k x 10-6 Range Average
Metamorphic 4 200 Quartzite 4 000 Amphibolite 700 Schist 30 – 3 000 1 400 Gneiss 10 – 25 000 Serpentine 3 000 – 17 000 Granulite 100 – 3 000
•Average values are low but varies as metamorphism may be responsible ofcrystallisation or destruction of magnetite and other magnetic species•For example, high magnetic susceptibilities are related to serpentinisationof ultrabasics or contact metamorphism aureole where haematite insediment is transformed to magnetite and pyrite to pyrrhotite•Low-temperature hydrothermal alteration produce reverse reactions
Magneticsusceptibility ofmetamorphic rocks

Magnetic susceptibility, k x 10-6 Range Average
Igneous rocks 0 – 97 000 Granite 0 – 50 000 2 500 Porphyry 300 – 200 000 60 000 Rhyolite 200 – 35 000 Andesite 160 000 Gabbro 1 000 – 90 000 70 000 Basalte/dolerite 200 – 175 000 70 000 Diabase 1000 – 160 000 55 000 Diorite 600 – 120 000 85 000 Pyroxenite 125 000 Peridotite 90 000 – 200 000 150 000 Tables synthesized from Bullock and Isles (1994), Fallon and Backo (1994), Lowrie (1997), World Geosciences
•The values vary very much for each type of rock, depending the typeand age of terrains and processes involved in the generation andcrystallisation of the igneous rocks•A basalt or a granite can be magnetised or not depending of manyfactors
Magneticsusceptibility ofplutonic rocks

Introduction to the use of geophysicaldatasets
MAGNETISM• The Earth Magnetic field• The magnetic susceptibility of rocks
The use of magnetic data and gridprocessing for interpretation
RADIOMETRY• The natural gamma ray activity• The gamma-ray signature• Where are radioelements in the
(continental) crust ?

The interpretation challenge• A scale problem, from the mineral to the
geological unit• The magnetic susceptibility of the geological units
are related to the distribution of magnetic minerals,i.e. to:– the lithology and formation of the rock
• crystallisation in igneous, volcanic and metamorphic rocks• sedimentation in sedimentary rocks
– any alteration related to hydrothermal, metamorphic ordeformation process

The objective of interpretation
• Existing geological maps, displaying lithologiesand structures, can not correspond 100% tomagnetics without combined interpretation ofgeological and processing of geophysical data
• The key to interpretation of a magnetic survey isunderstanding the connection between mappablegeological units and structures and the distributionof magnetics

But…
• There is no fully automatic processing from raw data tointerpreted maps. Interpretation requires:– A fully-equipped sustainable geophysical interpretation unit,
linked with field geologists– A knowledge of the magnetic properties of the main geological
units of the survey area– A reference to the basic principles of structural geology

What information can we extract fromthe analysis of the grid processing ?
• Reduction to pole should eliminate the positive-negative high gradient anomalies– If not, the existence of remanence must be envisaged
• Anomalies in the southern hemisphere aresouthward relocated during reduction to pole– If not, the existence of remanence must be envisaged
Compare the following images from the same area

TotalMagneticIntensity

Reducedto Pole

What information can we extract fromthe analysis of the grid processing ?
• Total Magnetic Intensity and Reduction to poleillustrates the large and short wavelength
• Analytical signal outlines the « negative-positive »part
• 1st Vertical Derivative underlines shortwavelength
Compare the following images from the same areaIdentify and underline large and short wavelength

Total Magnetic Intensity Reduced To Pole

Reduced to pole Analytical Signal

1st Vertical Derivative 2nd Vertical Derivative

Magnetic field reduced to the pole

Analytical signal of the Magnetic field

Foreland evolution and folds
Analytical signal of the magnetic field10km
Syncline
Anticline

1st vertical derivative of the RTP

2nd vertical derivative of the RTP

Total horizontal derivative of the RTP

Introduction to the use of geophysicaldatasets
MAGNETISM• The Earth Magnetic field• The magnetic susceptibility of rocks• The use of magnetic data and grid
processing for interpretationRADIOMETRY
The natural gamma ray activity• The gamma-ray signature• Where are radioelements in the
(continental) crust ?

Principles of radiometric surveys
• The physical parameter measured is the gamma-ray activity ofradio elements
• The measured gamma radiation is function of the geometry andphysical property contrasts of the radioactive sources, onenvironmental and other effects (soil moisture, rainfall, vegetation, nonradioactive overburden, movement of airborne sources of radiation in the Loweratmosphere) and finally size, efficiency and speed of the detector
• Interpolation of recorded value of radioelements enable theproduction of maps and profiles which locate zones of high andlow value and evaluate the amplitude of the signal

What do we measure?
• The physical parameter detected and measured byradiometric surveys is the gamma-ray activity of radioelements
• Unstable isotopes change to more stable nuclei by theemission of energetic ionising radiation (α, β and γ)
• Each radioisotope has a characteristic probability, the so-called “half-life” of the isotope, the time taken for half thenuclei to decay
• The results are best considered in geochemical terms

Nuclear fission, particles and radiation release
Uranium nucleus splitsinto two smaller more stableelements
Iron
Krypton

• The 1st group of natural radioactive source is composed of40K, 238U, 235U, 232Th which have half-lives in the order of5x109 years, i.e., the age of the earth• 238U and 232Th don’t emit γ Ray and we rely on the γ Rayemissions of their radioactive daughter
Gamma-Ray Emitters

The Gamma-ray spectrum

Spectrometer
4 crystals « Down »
1 cristal « Up »
Iodure Sodium crystals

Introduction to the use of geophysicaldatasets
MAGNETISM• The Earth Magnetic field• The magnetic susceptibility of rocks• The use of magnetic data and grid
processing for interpretationRADIOMETRY
• The natural gamma ray activityThe gamma-ray signature
• Where are radioelements in the(continental) crust ?

The gamma-ray signature
• Two factors for the usefulness of airborne gammaray spectrometry– the extent to which distribution of the radioelements
relates to the differences of lithology of common rocksand alteration processes
– the extent to which the radioelement content of bedrockis reflected in the composition of superficial materials

Potassium

Thorium

Uranium

Introduction to the use of geophysicaldatasets
MAGNETISM• The Earth Magnetic field• The magnetic susceptibility of rocks• The use of magnetic data and grid
processing for interpretationRADIOMETRY
• The natural gamma ray activity• The gamma-ray signature
Where are radioelements in the(continental) crust ?

Where are radioelements in the (continental) crust ?
• Potassium is the 8th most abundant element in the Earth’scrust (1.1 to 2.5 %)– most K occurs in potassic feldspars and micas
• Uranium (~2.7 ppm) and Thorium (~8.5 ppm) are traceelements as primary constituents or substituted– U in pechblende (UO2, UO3), uraninite, Th in thorianite (ThO2)– Constituents of accessory minerals (zircon, monazite 20/15% Th, ±
rutile, epidote, ilmenite)– Substituted in micas

What are the sources of radioelements in the(continental) crust ?
• Sources of radioactive elements as K, Th and Uare found in orogenic or in subduction-relatedprocesses:– melting and recycling of continental crust– large ion lithophile elements as Rb, K, Ba, Th, Sr
released and incorporated into rising melts

Radioelements in minerals
0.2 - 33 - 7K-feldspar
1 - 305 - 50Amphibole
1 - 400.5 - 50Biotite
0.01 - 402 - 25Pyroxene
0.5 - 6
0.5 – 0.3
trace
Th in ppmK in %
0.01Olivine
2 - 8Muscovite
0.1 - 5Quartz
0.2 – 0.5Plagioclase
U in ppm

Radioelements in accessory minerals
U in ppmTh in ppmK in %
200 - 40005000 - 20000Orthite
100 - 600050 - 4000In pegmatite
300 - 3000100 - 2500Zircon
500 - 35000TraceXenotime
100 - 700100 - 600Sphene
500 - 300025000 - 200000Monazite
20 - 5050 - 500Epidote
10 - 5050 - 250In pegmatite
5 - 15020 - 150Apatite
7 - 1001000 - 20000In pegmatite
30 - 700500 - 5000Allanite

Radioelements in rocks
29.7133.96.5Alk. interm. extrusive Alk.interm. intrusive
55.8132.64.2
2.48.21.9Alk. Basic extrusiveAlk. Basic intrusive 2.38.41.8
0.8/0.52.2/10.7/0.8Basic extrusiveBasic intrusive 0.8/0.82.3/3.40.8/1
1.12.41.1Intermediate extrusiveIntermediate intrusive
3.2/312.2/9.82.1/2.4
4.1/4.111.9/21.93.1Acid extrusiveAcid intrusive 4.5/425.7/153.4/3.5
1.4/0.08/0.02
Mean Th in ppm
0.3/0.01
Mean K in %
0.3/0.007/0.002Ultrabasic
Mean U in ppm
York and Farquhar (1972), Faure (1986)

Radioelements in rocks
0.3-1.3 (0.7)2.2/10.3-1.3 (0.9)Mafic volcanicsMafic intrusive <1.1 (0.3)2.3/3.40.1-0.8 (0.4)
0.9-5.6 (2.3)1.5-15 (9)1.8-4.1 (2.7)Intermediate extrusiveIntermediate intrusive 0.1-1.2 (0.8)0.8-6.1 (2.4)0.7-5.6 (2.7)
1.4-13 (2.4)13-28 (17)2.0-4.4 (3.7)Felsic extrusiveFelsic intrusive 0.4-7.8 (3.3)2.3-45 (16)0.3-4.5 (2.4)
<4 (1.2)
Th in ppm
0.2-0.9(0.4)
K in %
0.3-0.9 (0.6)Ultramafic volcanics
U in ppm
Dickson and Scott (1997), average value in brackets
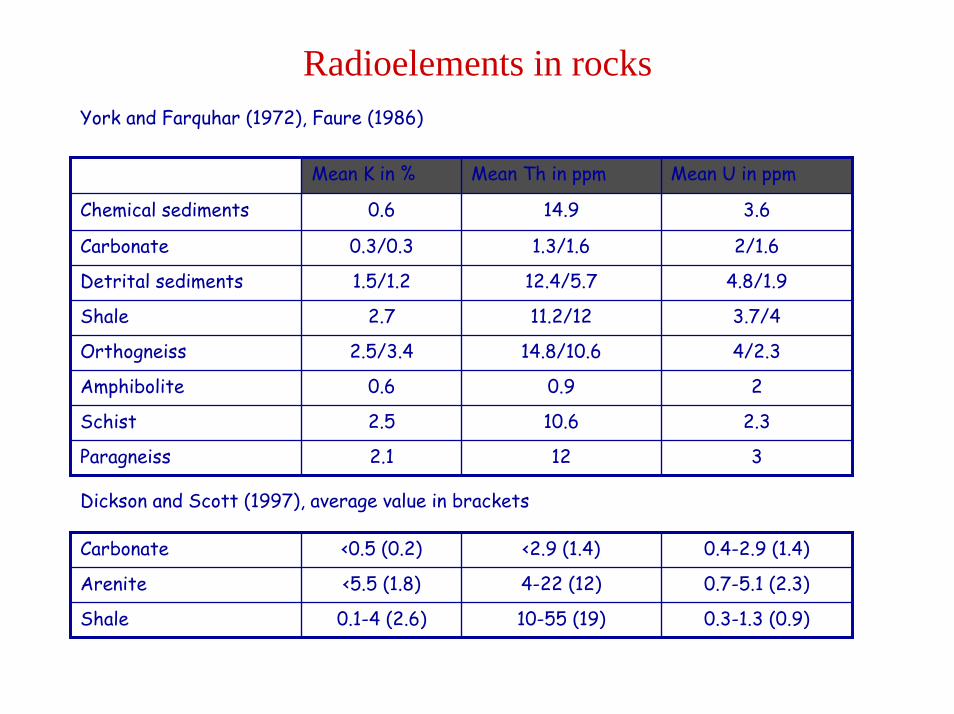
Radioelements in rocks
3.7/411.2/122.7Shale
2.310.62.5Schist
20.90.6Amphibolite
Mean U in ppmMean Th in ppmMean K in %
3122.1Paragneiss
4/2.314.8/10.62.5/3.4Orthogneiss
4.8/1.912.4/5.71.5/1.2Detrital sediments
2/1.61.3/1.60.3/0.3Carbonate
3.614.90.6Chemical sediments
0.3-1.3 (0.9)10-55 (19)0.1-4 (2.6)Shale
0.7-5.1 (2.3)4-22 (12)<5.5 (1.8)Arenite
0.4-2.9 (1.4)<2.9 (1.4)<0.5 (0.2)Carbonate
Dickson and Scott (1997), average value in brackets
York and Farquhar (1972), Faure (1986)

Radioelements in geological provinces
Unmineralized host rock2.400.3
Mineralization4.10.62.30.54.10.8Kalgoorlie Goldfield(Fimiston, Australia)
5
2
2.9
Mean/Modal
U in ppm
16
15
22
Max
13
5
10
Mean/Modal
Th in ppm
30
40
41
Max
0.8
1
2
Mean/Modal
Proterozoic metamorphic rocksintruded by alkaline complexes
4Southern Greenland
Proterozoic greenstone belt4Southern Damaraforeland (Rehoboth)
Max
Equatorial weathering2.4Rwanda
K in %


![Visualization and Analysis of Multi-terabyte Geophysical Datasets …gerlebacher/vlab/ChinaViz... · 2006-08-30 · datasets, the fast and interactive 3D environment of Amira [] works](https://img.dokumen.tips/doc/110x75/5f139dc88594495abc07aed8/visualization-and-analysis-of-multi-terabyte-geophysical-datasets-gerlebachervlabchinaviz.jpg)


