Embed Size (px)
Citation preview

National EnergyTechnology Laboratory
Introduction to Performing aTechno-Economic Analysisfor Power Generation Systems
James C. Fisher II
Office of Program Performance and Benefits
Date: 06/23/2015
Text document coming soon

2
Techno-Economic Analysis (TEA)
• A system performance and cost analysis at commercial scale– NETL’s Bituminous Baseline – Key subset assessing advanced technology
• Cases in a TEA:– Reference case: state-of-the-art power plant should be similar to those found in
the Baseline studies – Advanced case: Novel technology replaces SOA technology in reference plant
• Comparison between cases can provide:– Representation and quantification of the benefits of the novel technology.– Identification and potential quantification of performance and cost goals for the
novel technology.– Identification of critical performance and cost parameters, inform R&D
prioritization decisions.• The common metric derived and compared is Cost of Electricity (COE)
and net power plant efficiency (HHV & LHV)
3
Resources for TEA Development• Baseline studies
– A Series of documents that provide Baseline’s for comparison– http://www.netl.doe.gov/research/energy-analysis/energy-baseline-studies
• Quality Guidelines for Energy System Studies (QGESS) Documents– A series of documents that provide the details to performing TEAs– http://www.netl.doe.gov/research/energy-analysis/quality-guidelines-qgess– Also includes a manuscript titled “A proposed methodology for CO2 capture and storage cost
estimates” that outlines a methodology for costing
http://www.netl.doe.gov/research/energy-analysis
http://www.netl.doe.gov

4
NETL Baseline
Volume Title Description
1Bituminous Coal and Natural Gas to Electricity, aka Bituminous Baseline
Establishes performance and cost data for SOA fossil energy power systems for integrated gasification combined cycle (IGCC), pulverized coal (PC), and natural gas combined cycle (NGCC) plants with and without capture
3Low-Rank Coal and Natural Gas to Electricity, aka Low Rank Baseline
Establishes performance and cost data for SOA fossil energy power systems for IGCC, PC, and NGCC plants using low rank coals
These documents provide:1. A starting point for model design basis2. An outline for TEA reporting format (stream tables, auxiliary
load tables, etc.)

5
NETL Quality Guidelines for Energy System Studies (QGESS)
Title DescriptionDetailed Coal Specifications Provides detailed specifications for seven coals commonly used with detailed production information.
Specifications for SelectedFeedstocks
Provides recommended specifications for natural gas and coal that are commonly found in NETL energy system studies.
Process Modeling Design Parameters
Documents the process modeling assumptions most commonly used in systems analysis studies and the basis for those assumptions. The large number of assumptions required for a systems analysis makes it impractical to document the entire set in each report. This document serves as a comprehensive reference for these assumptions as well as their justification.
CO2 Impurity Design Parameters
Summarizes the impurity limits for CO2 stream components for use in carbon steel pipelines, enhanced oil recovery (EOR), saline formation sequestration, and co-sequestration of CO2 and H2S in saline formations.
Capital Cost Scaling Methodology
Provides a standard basis for scaling capital costs, with specific emphasis on scaling exponents. This document contains a listing of frequently used pieces of equipment and their corresponding scaling exponent for various plant types, along with their ranges of applicability.
Cost Estimation Methodology
Summarizes the cost estimation methodology employed by NETL in its assessment of power plant performance.
Estimating Carbon Dioxide Transport and Storage Costs
Addresses the cost of CO2 transport and storage (T&S) in a deep saline formation with respect to plant location and region-specific aquifers.
Fuel Prices for Selected Feedstocks
Provides an estimate of the market price delivered to specific end-use areas of four coals that are commonly used as feedstocks in the energy system studies sponsored by NETL. Also includes the estimated market price for natural gas delivered to three different regions.
6
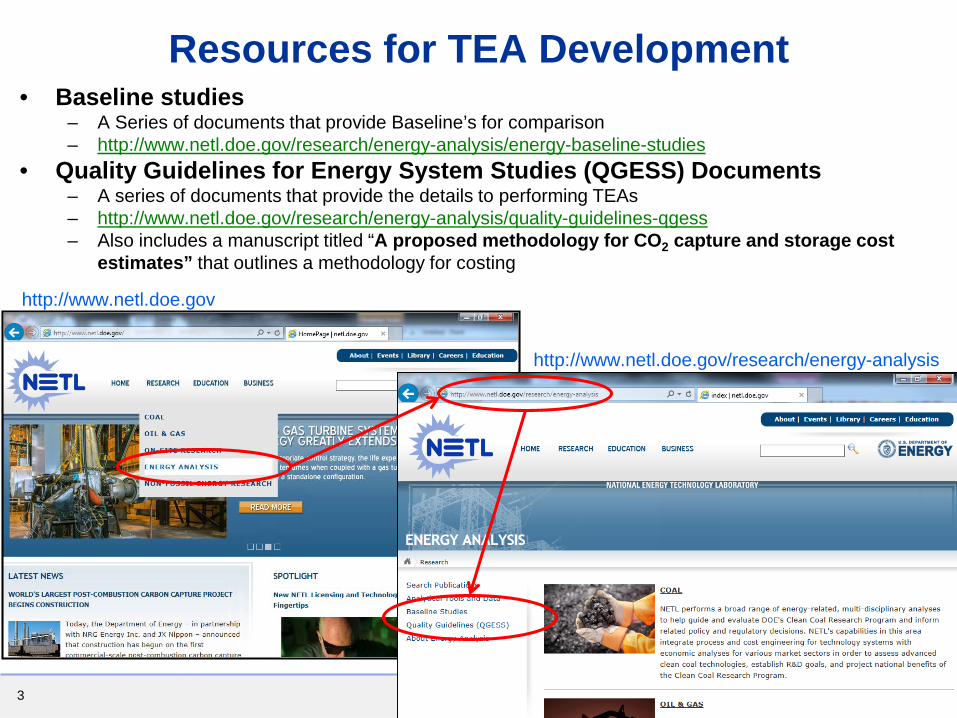
Techno-Economic Analysis Tools
Initial AnalysisPost-Combustion Tool
• Required a detailed model of capture plant
• Scales and costs balance of a PC plant (solvent-based system)
• Need detailed information: steam usage, pressure drop, auxiliary loads, etc.
Full Plant Aspen Model
• Mature projects that require detailed integration
• Highest level of detail for performance and cost
• Methodology tool can estimate non-ASPEN model parts and extract into suggested format.
7
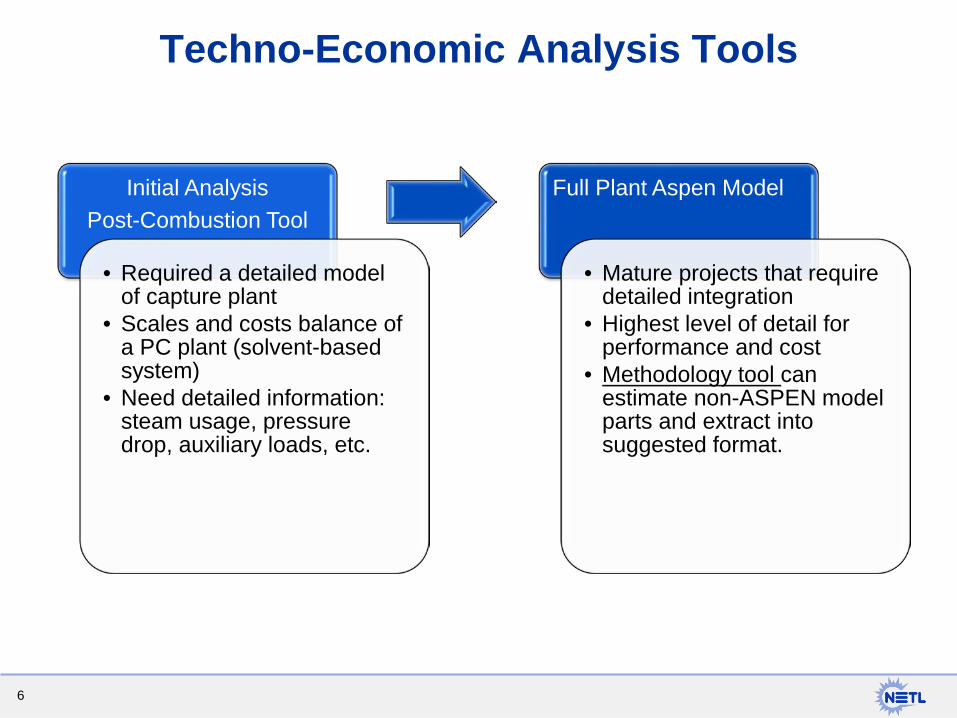
Steps to performing a TEA:1. Form a Technology Analysis Plan2. Create a Performance Model3. Cost Estimating – COE4. Reporting Requirements
TEA
TAP
Design Basis
8
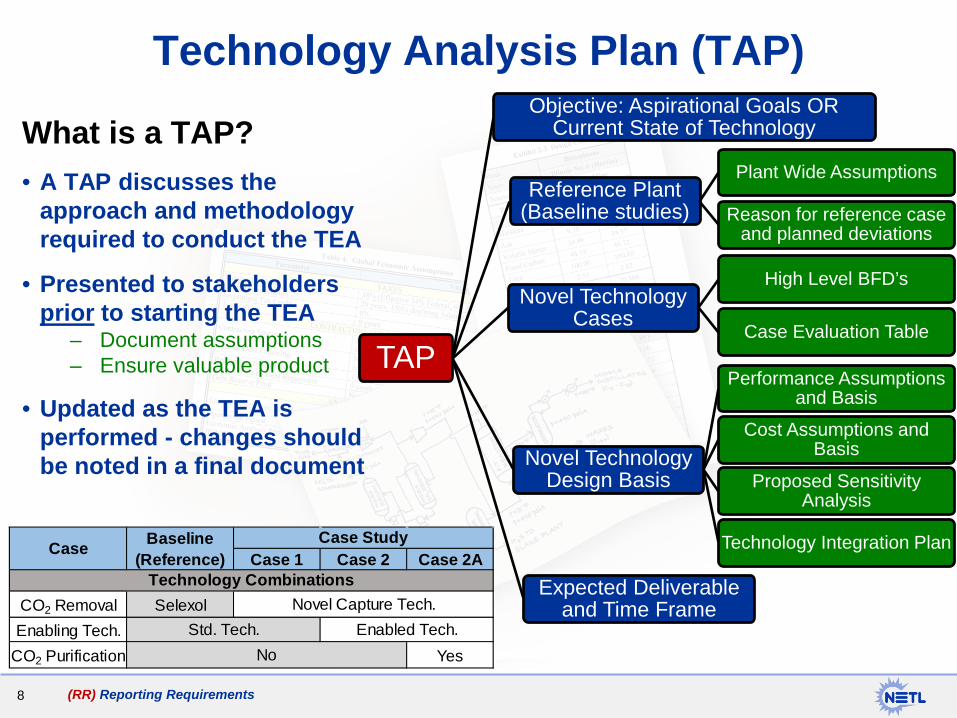
Technology Analysis Plan (TAP)
What is a TAP?• A TAP discusses the
approach and methodology required to conduct the TEA
• Presented to stakeholders prior to starting the TEA
– Document assumptions– Ensure valuable product
• Updated as the TEA is performed - changes should be noted in a final document
(RR) Reporting Requirements
TAP
Objective: Aspirational Goals OR Current State of Technology
Reference Plant (Baseline studies)
Plant Wide Assumptions
Reason for reference case and planned deviations
Novel Technology Cases
High Level BFD’s
Case Evaluation Table
Novel Technology Design Basis
Performance Assumptions and Basis
Cost Assumptions and Basis
Technology Integration Plan
Proposed Sensitivity Analysis
Expected Deliverable and Time Frame
Case 1 Case 2 Case 2A
CO2 Removal SelexolEnabling Tech.
CO2 Purification YesNo
Novel Capture Tech.Enabled Tech.
Case Baseline (Reference)
Case Study
Technology Combinations
Std. Tech.
9
Steps to performing a TEA:1. Form a Technology Analysis Plan2. Create a Performance Model3. Cost Estimating – COE4. Reporting Requirements

10
Performance Model Results for Reporting
• Build a performance model– Frequently completed in ASPEN, ChemCAD, Thermoflow, etc.– When applying novel technology:
• Hold constant:– PC: net power output constant– IGCC: hold combustion turbine power output constant
• Balance of plant equipment NOT affected by research area will be scaled (RR)
• Changes in operating parameters that are different than those in the Baseline Studies must be justified in the TEA document (RR)
• Detailed Process Flow Diagram (RR)
11
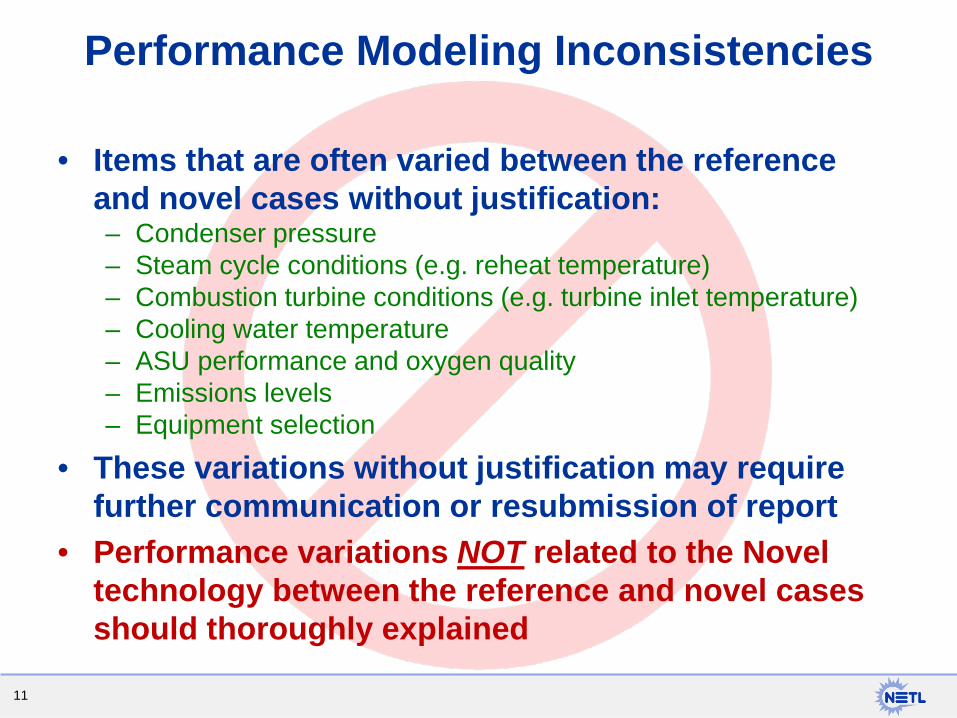
Performance Modeling Inconsistencies
• Items that are often varied between the reference and novel cases without justification:– Condenser pressure– Steam cycle conditions (e.g. reheat temperature)– Combustion turbine conditions (e.g. turbine inlet temperature)– Cooling water temperature– ASU performance and oxygen quality– Emissions levels– Equipment selection
• These variations without justification may require further communication or resubmission of report
• Performance variations NOT related to the Novel technology between the reference and novel cases should thoroughly explained
12
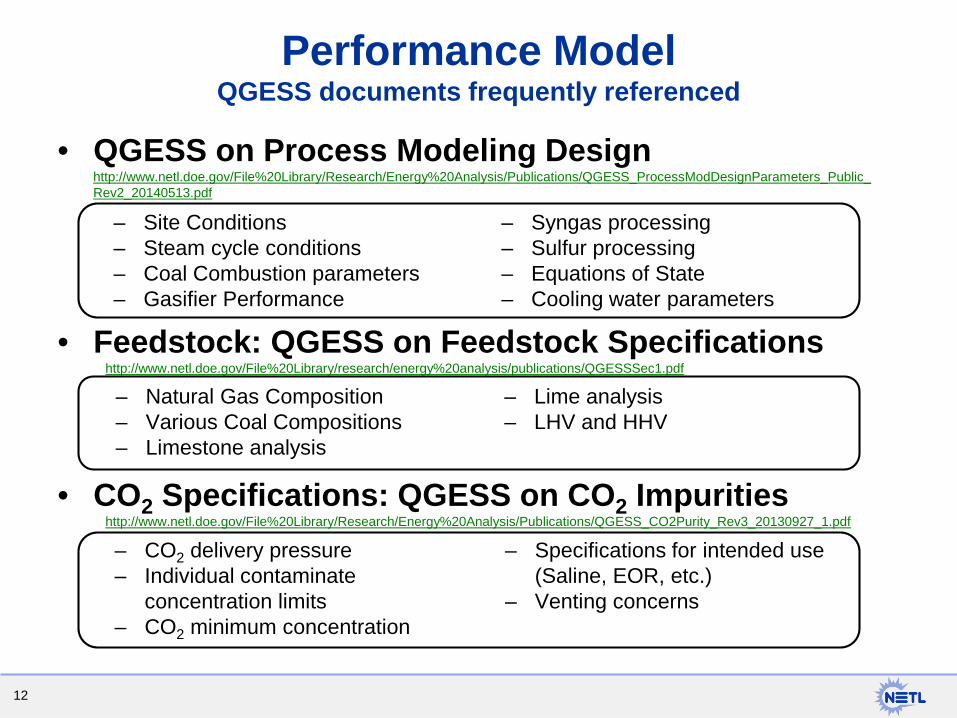
– CO2 delivery pressure– Individual contaminate
concentration limits– CO2 minimum concentration
– Specifications for intended use (Saline, EOR, etc.)
– Venting concerns
– Natural Gas Composition– Various Coal Compositions– Limestone analysis
– Lime analysis– LHV and HHV
• QGESS on Process Modeling Designhttp://www.netl.doe.gov/File%20Library/Research/Energy%20Analysis/Publications/QGESS_ProcessModDesignParameters_Public_Rev2_20140513.pdf
• Feedstock: QGESS on Feedstock Specificationshttp://www.netl.doe.gov/File%20Library/research/energy%20analysis/publications/QGESSSec1.pdf
• CO2 Specifications: QGESS on CO2 Impuritieshttp://www.netl.doe.gov/File%20Library/Research/Energy%20Analysis/Publications/QGESS_CO2Purity_Rev3_20130927_1.pdf
– Site Conditions– Steam cycle conditions– Coal Combustion parameters– Gasifier Performance
– Syngas processing– Sulfur processing– Equations of State– Cooling water parameters
Performance ModelQGESS documents frequently referenced
13
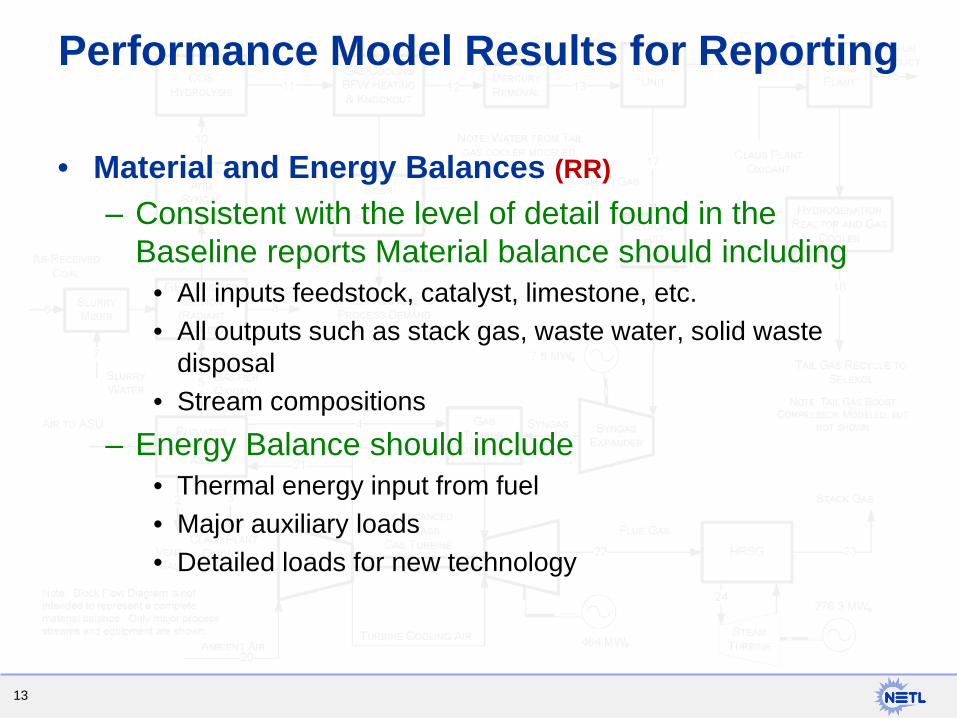
Performance Model Results for Reporting
• Material and Energy Balances (RR)– Consistent with the level of detail found in the
Baseline reports Material balance should including • All inputs feedstock, catalyst, limestone, etc.• All outputs such as stack gas, waste water, solid waste
disposal• Stream compositions
– Energy Balance should include• Thermal energy input from fuel• Major auxiliary loads• Detailed loads for new technology
14
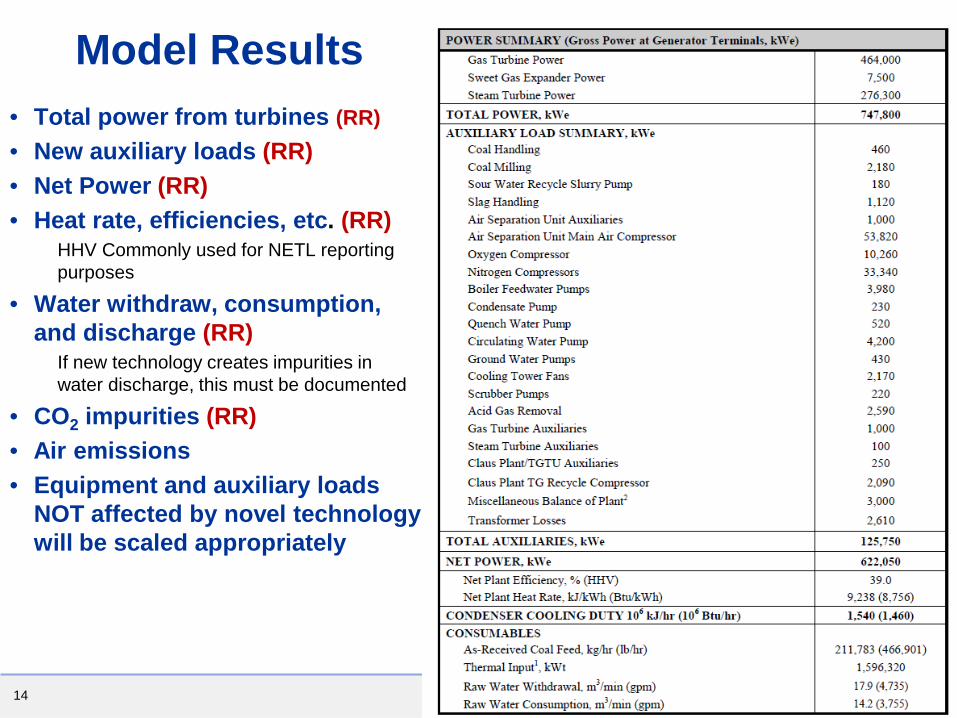
Model Results• Total power from turbines (RR)• New auxiliary loads (RR)• Net Power (RR)• Heat rate, efficiencies, etc. (RR)
HHV Commonly used for NETL reporting purposes
• Water withdraw, consumption, and discharge (RR)
If new technology creates impurities in water discharge, this must be documented
• CO2 impurities (RR)• Air emissions• Equipment and auxiliary loads
NOT affected by novel technology will be scaled appropriately
15
Reporting Novel Equipment
• Novel equipment should be reported at a greater level of detail than found in the Baseline study
• Items to include (RR):– Design equations (if developed)– Scaling methodology and equations– Design basis (kinetics, volumetric throughput, etc.)– How was the data for the above collected (TGA, lab
scale bubbling bed, etc.)

16
Steps to performing a TEA:1. Form a Technology Analysis Plan2. Create a Performance Model3. Cost Estimating – COE4. Reporting Requirements
17
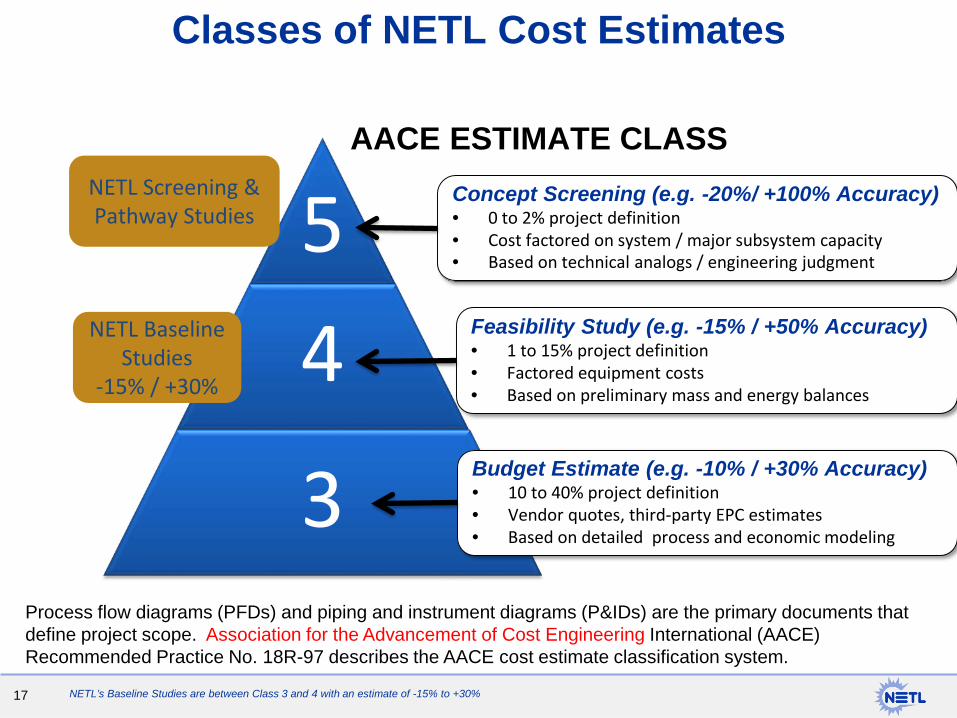
Classes of NETL Cost Estimates
54
3
AACE ESTIMATE CLASSConcept Screening (e.g. -20%/ +100% Accuracy)• 0 to 2% project definition• Cost factored on system / major subsystem capacity • Based on technical analogs / engineering judgment
Feasibility Study (e.g. -15% / +50% Accuracy)• 1 to 15% project definition• Factored equipment costs• Based on preliminary mass and energy balances
Budget Estimate (e.g. -10% / +30% Accuracy)• 10 to 40% project definition• Vendor quotes, third-party EPC estimates• Based on detailed process and economic modeling
NETL Baseline Studies
-15% / +30%
NETL Screening & Pathway Studies
Process flow diagrams (PFDs) and piping and instrument diagrams (P&IDs) are the primary documents that define project scope. Association for the Advancement of Cost Engineering International (AACE) Recommended Practice No. 18R-97 describes the AACE cost estimate classification system.
NETL’s Baseline Studies are between Class 3 and 4 with an estimate of -15% to +30%
18
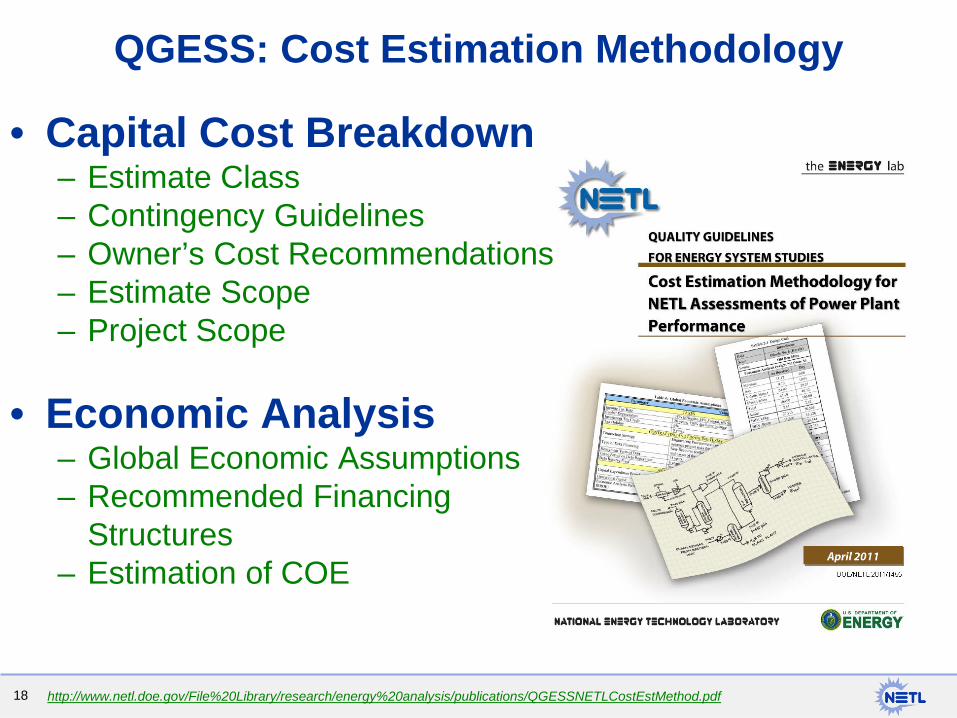
QGESS: Cost Estimation Methodology
• Capital Cost Breakdown– Estimate Class– Contingency Guidelines– Owner’s Cost Recommendations– Estimate Scope– Project Scope
• Economic Analysis– Global Economic Assumptions– Recommended Financing
Structures– Estimation of COE
http://www.netl.doe.gov/File%20Library/research/energy%20analysis/publications/QGESSNETLCostEstMethod.pdf
19
𝐂𝐂𝐂𝐂𝐂𝐂 =
𝑭𝑭𝒊𝒊𝒊𝒊𝒊𝒊𝒊𝒊 𝒚𝒚𝒚𝒚𝒚𝒚𝒊𝒊𝒄𝒄𝒚𝒚𝒄𝒄𝒊𝒊𝒊𝒊𝒚𝒚𝒄𝒄 𝒄𝒄𝒄𝒄𝒚𝒚𝒊𝒊𝒄𝒄𝒚𝒚 +
𝒇𝒇𝒊𝒊𝒊𝒊𝒊𝒊𝒊𝒊 𝒚𝒚𝒚𝒚𝒚𝒚𝒊𝒊𝒇𝒇𝒊𝒊𝒇𝒇𝒚𝒚𝒇𝒇 𝒐𝒐𝒄𝒄𝒚𝒚𝒊𝒊𝒚𝒚𝒊𝒊𝒊𝒊𝒐𝒐𝒄𝒄
𝒄𝒄𝒐𝒐𝒊𝒊𝒊𝒊𝒊𝒊+
𝒇𝒇𝒊𝒊𝒊𝒊𝒊𝒊𝒊𝒊 𝒚𝒚𝒚𝒚𝒚𝒚𝒊𝒊𝒗𝒗𝒚𝒚𝒊𝒊𝒊𝒊𝒚𝒚𝒗𝒗𝒄𝒄𝒚𝒚 𝒐𝒐𝒄𝒄𝒚𝒚𝒊𝒊𝒚𝒚𝒊𝒊𝒊𝒊𝒐𝒐𝒄𝒄
𝒄𝒄𝒐𝒐𝒊𝒊𝒊𝒊𝒊𝒊𝒚𝒚𝒐𝒐𝒐𝒐𝒏𝒏𝒚𝒚𝒄𝒄 𝒐𝒐𝒚𝒚𝒊𝒊 𝒎𝒎𝒚𝒚𝒄𝒄𝒚𝒚𝒎𝒎𝒚𝒚𝒊𝒊𝒊𝒊 𝒄𝒄𝒐𝒐𝒏𝒏𝒊𝒊𝒊𝒊
𝒐𝒐𝒇𝒇 𝒄𝒄𝒐𝒐𝒎𝒎𝒚𝒚𝒊𝒊 𝒄𝒄𝒚𝒚𝒐𝒐𝒚𝒚𝒊𝒊𝒚𝒚𝒊𝒊𝒊𝒊𝒐𝒐𝒐𝒐
𝐂𝐂𝐂𝐂𝐂𝐂 =𝐂𝐂𝐂𝐂𝐂𝐂 � 𝐓𝐓𝐂𝐂𝐂𝐂 + 𝐂𝐂𝐂𝐂𝐂𝐂𝐅𝐅𝐅𝐅 + 𝐂𝐂𝐂𝐂 � 𝐂𝐂𝐂𝐂𝐕𝐕𝐕𝐕𝐕𝐕
𝐂𝐂𝐂𝐂 � 𝐌𝐌𝐌𝐌𝐌𝐌
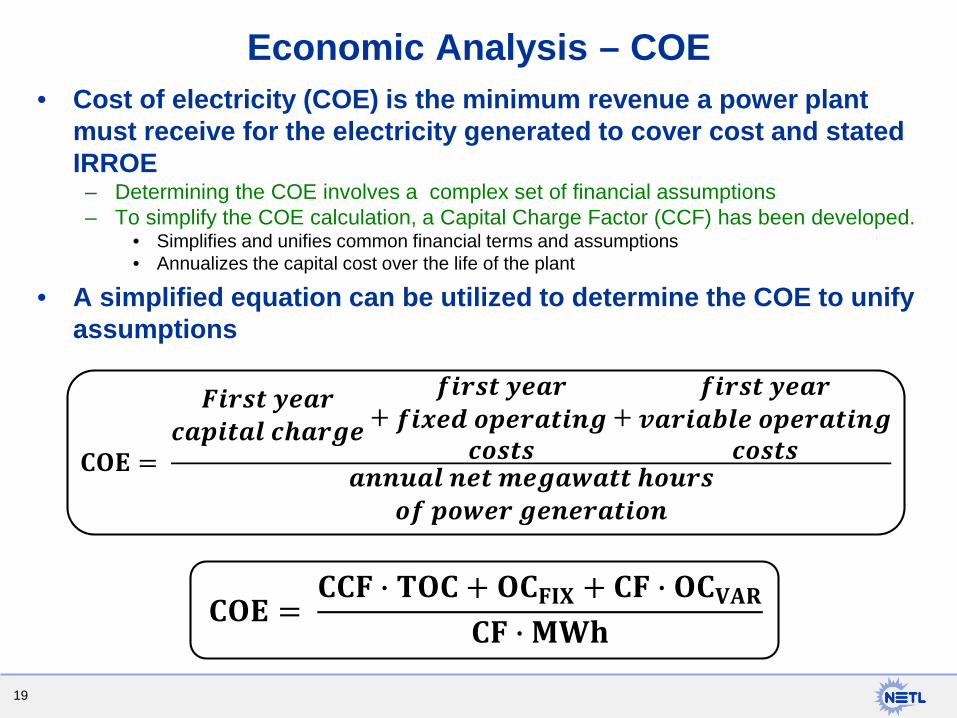
Economic Analysis – COE• Cost of electricity (COE) is the minimum revenue a power plant
must receive for the electricity generated to cover cost and stated IRROE
– Determining the COE involves a complex set of financial assumptions – To simplify the COE calculation, a Capital Charge Factor (CCF) has been developed.
• Simplifies and unifies common financial terms and assumptions• Annualizes the capital cost over the life of the plant
• A simplified equation can be utilized to determine the COE to unify assumptions

20
Economic Analysis – COE
COE =𝐂𝐂𝐂𝐂𝐂𝐂 � TOC + OCFIX + 𝐂𝐂𝐂𝐂 � OCVAR
𝐂𝐂𝐂𝐂 � 𝐌𝐌𝐌𝐌𝐌𝐌
• The CCF takes into account the financial aspects of the plant and represents them in a single factor that can then be used to annualize the capital over the life of the plant. Greater detail can be found in the QGESS documents.
• The MWh parameter is the net power generated (at 100% CF) by the plant.• The CF parameter Capacity Factor, which is assumed to be equal to the
availability
Plant Type CCF w/ CC CFPC 0.124 0.85
IGCC 0.124 0.80NGCC 0.111 0.85
21
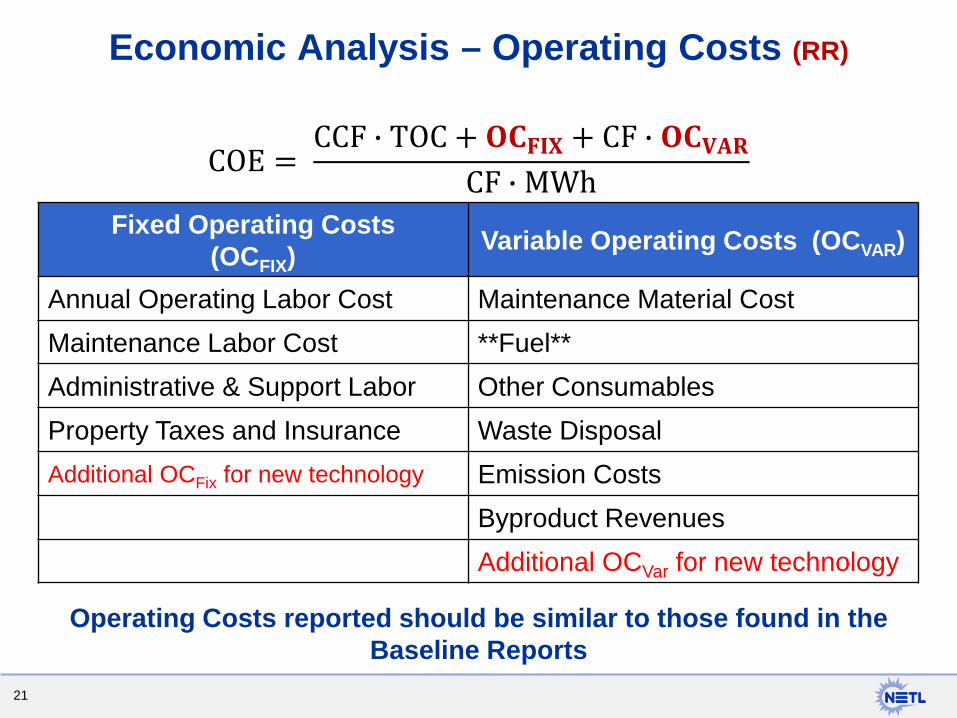
Economic Analysis – Operating Costs (RR)
COE =CCF � TOC + 𝐂𝐂𝐂𝐂𝐂𝐂𝐅𝐅𝐅𝐅 + CF � 𝐂𝐂𝐂𝐂𝐕𝐕𝐕𝐕𝐕𝐕
CF � MWh
Operating Costs reported should be similar to those found in the Baseline Reports
Fixed Operating Costs (OCFIX) Variable Operating Costs (OCVAR)
Annual Operating Labor Cost Maintenance Material CostMaintenance Labor Cost **Fuel**Administrative & Support Labor Other ConsumablesProperty Taxes and Insurance Waste DisposalAdditional OCFix for new technology Emission Costs
Byproduct RevenuesAdditional OCVar for new technology

22
process equipmentsupporting facilities
direct and indirect labor
BECEPCC
TPC
TOCTASC / TCR
EPC contractor services
process contingencyproject contingency
pre-production costsinventory capital
financing costsother owner’s costs
escalation during capital expenditure periodinterest on debt during capital expenditure period
Bare Erected CostEngineering, Procurement
and Construction CostTotal Plant Cost
Total Overnight CostTotal As-Spent Cost
BEC, EPCC, TPC, TOC and TCR are all “overnight” costs
expressed in base-year dollars.
TASC is expressed in mixed-year current dollars, spread over the capital expenditure
period.
Economic Analysis – Capital Costs (RR)
COE =CCF � 𝐓𝐓𝐂𝐂𝐂𝐂 + OCFIX + CF � OCVAR
CF � MWh
23
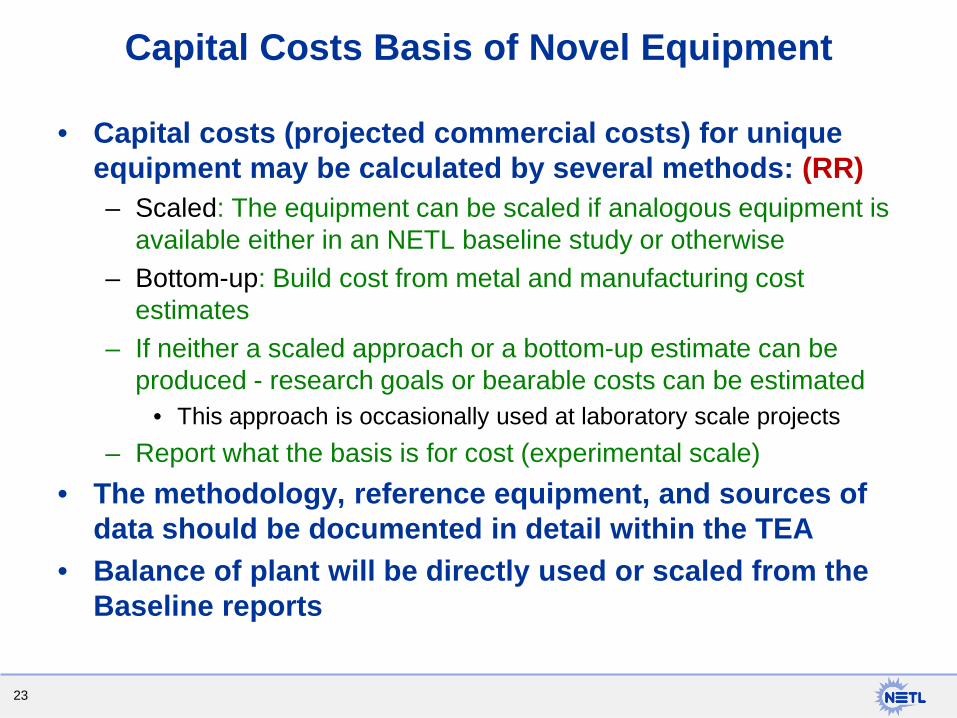
Capital Costs Basis of Novel Equipment
• Capital costs (projected commercial costs) for unique equipment may be calculated by several methods: (RR)– Scaled: The equipment can be scaled if analogous equipment is
available either in an NETL baseline study or otherwise– Bottom-up: Build cost from metal and manufacturing cost
estimates– If neither a scaled approach or a bottom-up estimate can be
produced - research goals or bearable costs can be estimated • This approach is occasionally used at laboratory scale projects
– Report what the basis is for cost (experimental scale)• The methodology, reference equipment, and sources of
data should be documented in detail within the TEA• Balance of plant will be directly used or scaled from the
Baseline reports
24
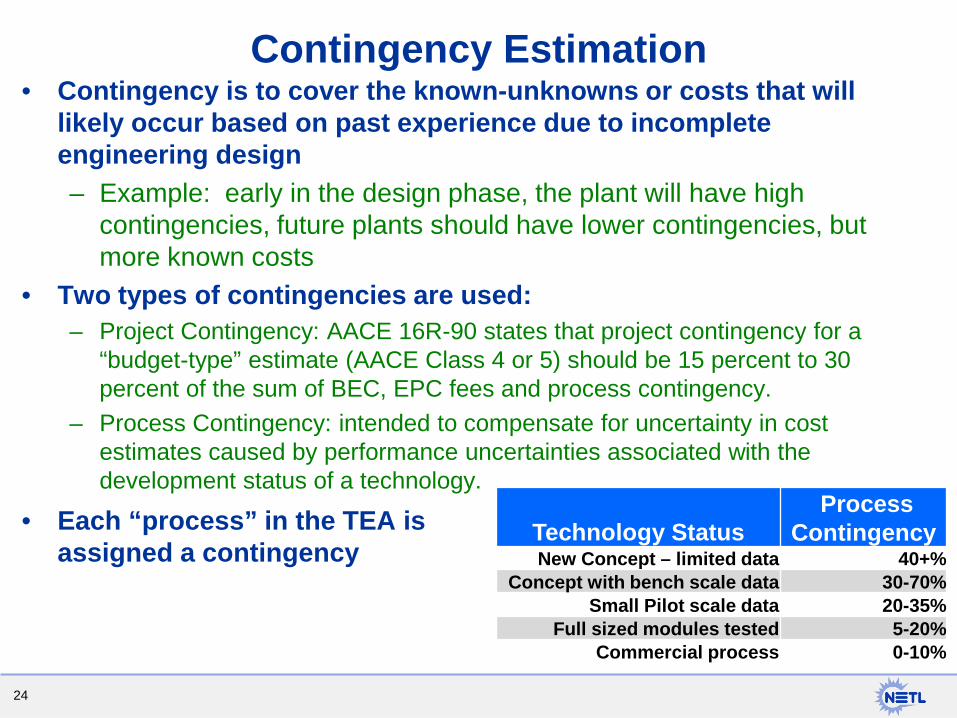
Contingency Estimation• Contingency is to cover the known-unknowns or costs that will
likely occur based on past experience due to incomplete engineering design– Example: early in the design phase, the plant will have high
contingencies, future plants should have lower contingencies, but more known costs
• Two types of contingencies are used:– Project Contingency: AACE 16R-90 states that project contingency for a
“budget-type” estimate (AACE Class 4 or 5) should be 15 percent to 30 percent of the sum of BEC, EPC fees and process contingency.
– Process Contingency: intended to compensate for uncertainty in cost estimates caused by performance uncertainties associated with the development status of a technology.
Technology StatusProcess
ContingencyNew Concept – limited data 40+%
Concept with bench scale data 30-70%Small Pilot scale data 20-35%
Full sized modules tested 5-20%Commercial process 0-10%
• Each “process” in the TEA is assigned a contingency
25
Contingency Estimation
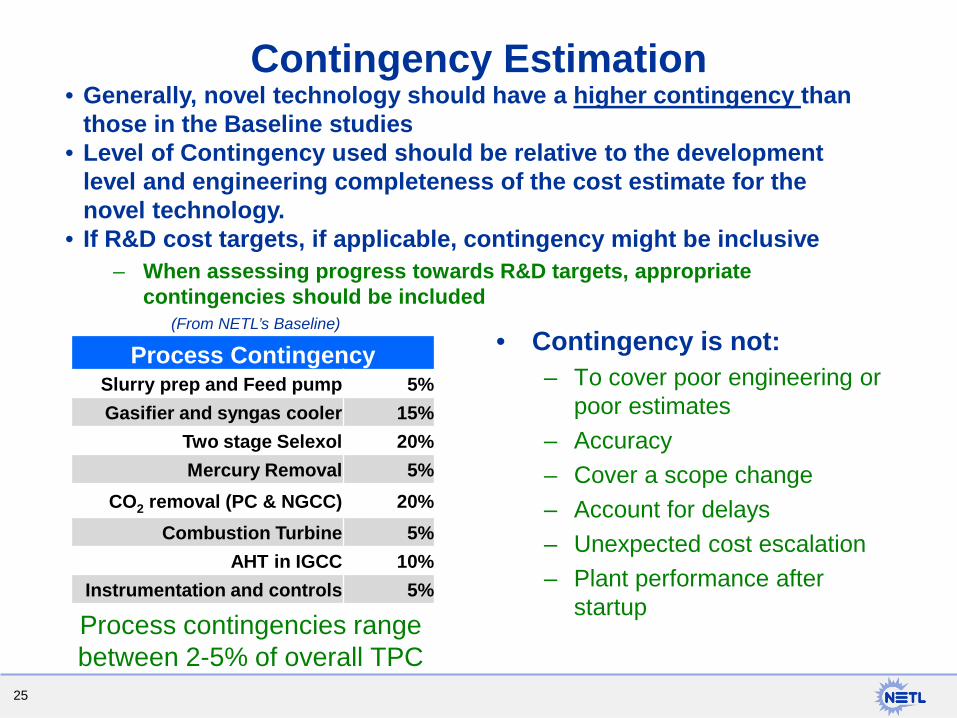
Process contingencies range between 2-5% of overall TPC
Process ContingencySlurry prep and Feed pump 5%Gasifier and syngas cooler 15%
Two stage Selexol 20%Mercury Removal 5%
CO2 removal (PC & NGCC) 20%Combustion Turbine 5%
AHT in IGCC 10%Instrumentation and controls 5%
• Generally, novel technology should have a higher contingency than those in the Baseline studies
• Level of Contingency used should be relative to the development level and engineering completeness of the cost estimate for the novel technology.
• If R&D cost targets, if applicable, contingency might be inclusive– When assessing progress towards R&D targets, appropriate
contingencies should be included
• Contingency is not:– To cover poor engineering or
poor estimates– Accuracy– Cover a scope change– Account for delays– Unexpected cost escalation– Plant performance after
startup
(From NETL’s Baseline)
26
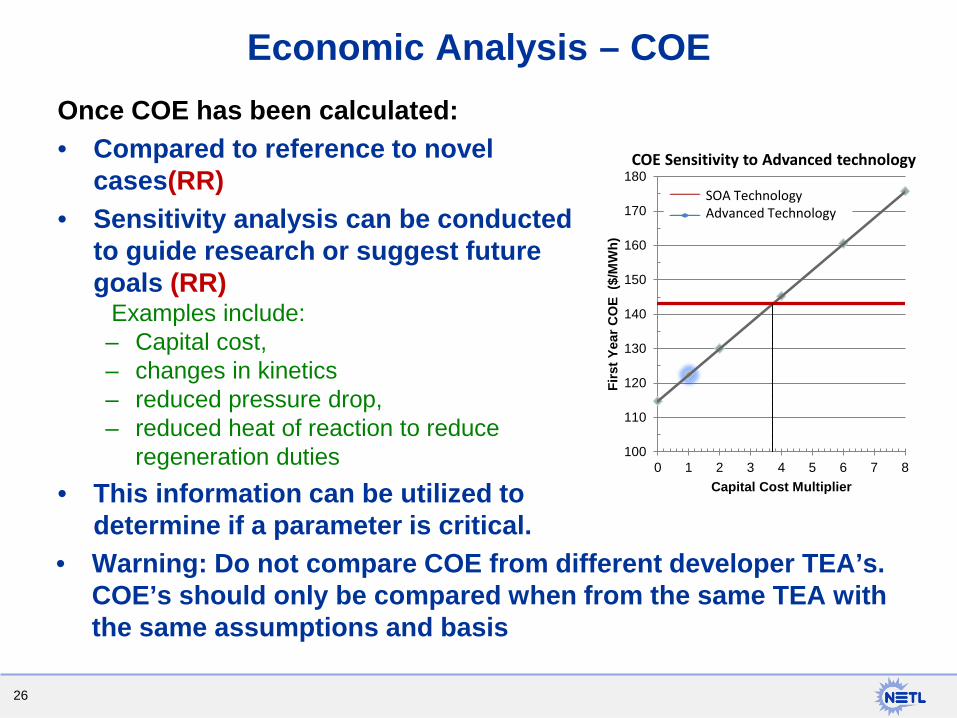
Economic Analysis – COEOnce COE has been calculated:• Compared to reference to novel
cases(RR)• Sensitivity analysis can be conducted
to guide research or suggest future goals (RR)
Examples include:– Capital cost, – changes in kinetics – reduced pressure drop, – reduced heat of reaction to reduce
regeneration duties• This information can be utilized to
determine if a parameter is critical.
100
110
120
130
140
150
160
170
180
0 1 2 3 4 5 6 7 8
Firs
t Yea
r CO
E ($
/MW
h)
Capital Cost Multiplier
COE Sensitivity to Advanced technology
SOA TechnologyAdvanced Technology
• Warning: Do not compare COE from different developer TEA’s. COE’s should only be compared when from the same TEA with the same assumptions and basis
27
Steps to performing a TEA:1. Form a Technology Analysis Plan2. Create a Performance Model3. Cost Estimating – COE4. Reporting Requirements
28
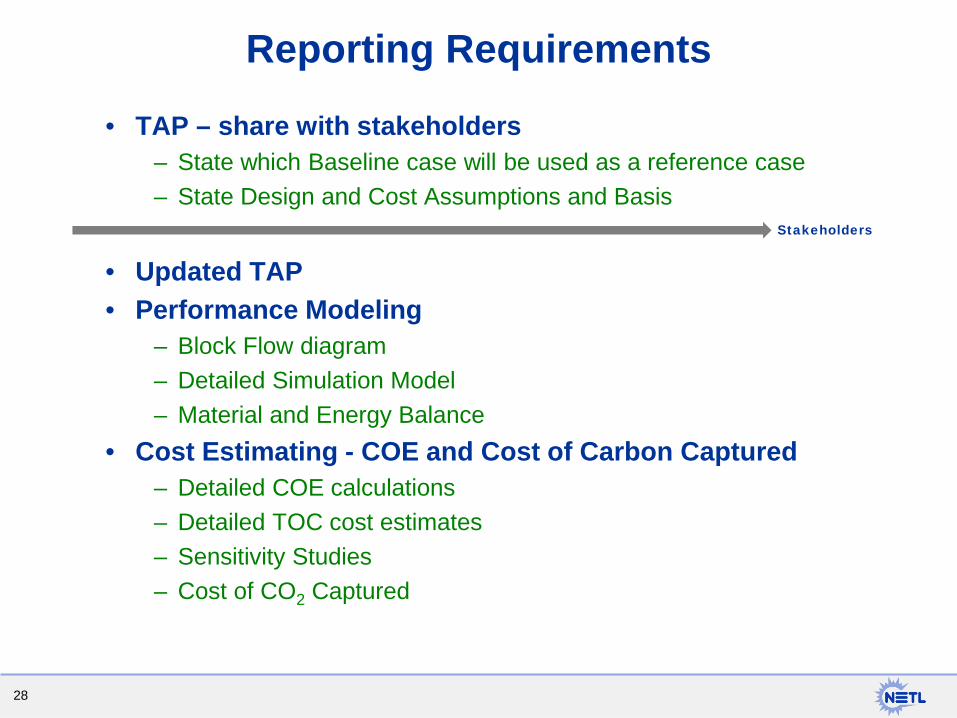
Reporting Requirements
• TAP – share with stakeholders– State which Baseline case will be used as a reference case– State Design and Cost Assumptions and Basis
• Updated TAP• Performance Modeling
– Block Flow diagram– Detailed Simulation Model– Material and Energy Balance
• Cost Estimating - COE and Cost of Carbon Captured– Detailed COE calculations – Detailed TOC cost estimates– Sensitivity Studies– Cost of CO2 Captured
Stakeholders
29
Reporting Requirements
• The TEA report should:– Provide reasoning for new equipment design basis –
experimental data is preferred– Have a level a detail equal or greater than that outlined in the
Bituminous Baseline (particularly for novel equipment)– Provide a basis for both design and costing of novel equipment
• Remember to:– Choose a Baseline study that can easily use the new technology– Justify any variations from the Baseline outside of the new
technology– Provide enough detail to reproduce stated number– Once complete, use the information to guide research

30
QUESTIONS?
QGESS text document coming soon.

31
CONTACT INFORMATION
James C. Fisher [email protected]
National Energy Technology LaboratoryOffice of Program Performance and Benefits3610 Collins Ferry Rd. Morgantown WV 26507

32
ADDITIONAL INFORMATION

33
Economic Analysis – COE
• Where (all items below are to reported (RR)):– COE = Revenue received by the generator during the power
plant’s first year of operation– CCF = Capital charge factor– TOC = Total overnight capital– OCFIX = Sum of all fixed annual operating costs– OCVAR = Sum of all variable annual operating costs at 100
percent capacity– CF = Plant capacity factor– MWh = Annual net megawatt-hours
𝐂𝐂𝐂𝐂𝐂𝐂 =𝐂𝐂𝐂𝐂𝐂𝐂 � 𝐓𝐓𝐂𝐂𝐂𝐂 + 𝐂𝐂𝐂𝐂𝐂𝐂𝐅𝐅𝐅𝐅 + 𝐂𝐂𝐂𝐂 � 𝐂𝐂𝐂𝐂𝐕𝐕𝐕𝐕𝐕𝐕
𝐂𝐂𝐂𝐂 � 𝐌𝐌𝐌𝐌𝐌𝐌

34
Case: B4B– E-Gas IGCC w/ CO₂ Estimate Type: ConceptualPlant Size (MW,net): 514 Cost Base ($x1,000): Jun 2011
Item Description Equipment Material Labor Bare Erected Eng'g CM Contingencies Total Plant CostNo. Cost Cost Direct Indirect Cost H.O.& Fee Process Project $ $/kW
1 Coal & Sorbent Handling1.1 Coal Receive & Unload $4,536 $0 $2,186 $0 $6,722 $672 $0 $1,479 $8,873 $171.2 Coal Stackout & Reclaim $5,862 $0 $1,402 $0 $7,263 $726 $0 $1,598 $9,587 $191.3 Coal Conveyors & Yd Crush $5,450 $0 $1,387 $0 $6,836 $684 $0 $1,504 $9,024 $181.4 Other Coal Handling $1,426 $0 $321 $0 $1,747 $175 $0 $384 $2,306 $41.9Coal & Sorbent Hnd. Foundations $0 $3,029 $7,916 $0 $10,945 $1,095 $0 $2,408 $14,447 $28
Subtotal $17,273 $3,029 $13,211 $0 $33,513 $3,351 $0 $7,373 $44,238 $864 Gasifier & Accessories
4.1 Syngas Cooler Gasifier System $137,262 $0 $76,506 $0 $213,769 $21,377 $29,564 $40,623 $305,333 $5944.2 Syngas Cooler w/4.1 $0 w/ 4.1 $0 $0 $0 $0 $0 $0 $04.3 ASU & Oxidant Compression $222,841 $0 w/equip. $0 $222,841 $22,284 $0 $24,513 $269,638 $5254.4 LT Heat Recovery & FG
Saturation$28,817 $0 $10,949 $0 $39,766 $3,977 $0 $8,749 $52,492 $102
4.5 Misc. Gasification Equipment w/4.1&4.2 $0 w/4.1&4.2 $0 $0 $0 $0 $0 $0 $04.6 Flare Stack System $0 $1,981 $801 $0 $2,782 $278 $0 $612 $3,672 $74.8 Major Component Rigging w/4.1&4.2 $0 w/4.1&4.2 $0 $0 $0 $0 $0 $0 $04.9 Gasification Foundations $0 $9,765 $5,824 $0 $15,589 $1,559 $0 $4,287 $21,434 $42
Subtotal $388,921 $11,746 $94,080 $0 $494,747 $49,475 $29,564 $78,784 $652,569 $1,2715A Gas Cleanup & Piping
5A.1 Double Stage Selexol $162,818 $0 w/equip. $0 $162,818 $16,282 $32,564 $42,333 $253,996 $4955A.2 Elemental Sulfur Plant $12,406 $2,418 $15,897 $0 $30,721 $3,072 $0 $6,759 $40,552 $795A.3 Mercury Removal $1,867 $0 $1,411 $0 $3,278 $328 $164 $754 $4,524 $95A.4 Shift Reactors $8,605 $0 $3,440 $0 $12,044 $1,204 $0 $2,650 $15,898 $315A.5 Particulate Removal w/4.1 $0 w/4.1 $0 $0 $0 $0 $0 $0 $05A.6 Blowback Gas Systems $657 $369 $206 $0 $1,232 $123 $0 $271 $1,626 $35A.7 Fuel Gas Piping $0 $926 $606 $0 $1,532 $153 $0 $337 $2,022 $45A.9 HGCU Foundations $0 $838 $565 $0 $1,403 $140 $0 $463 $2,007 $4
Subtotal $186,353 $4,551 $22,125 $0 $213,029 $21,303 $32,727 $53,566 $320,626 $624
Contingency EstimationFrom the Bituminous Baseline Study - GEE IGCC with Capture

35
Economic Analysis – Cost of CO2 Captured
𝐶𝐶𝐶𝐶𝐶𝐶𝐶𝐶 𝐶𝐶𝑜𝑜 𝐶𝐶𝐶𝐶2 𝐶𝐶𝐶𝐶𝐶𝐶𝐶𝐶𝐶𝐶𝐶𝐶𝐶𝐶𝐶𝐶 =𝐶𝐶𝐶𝐶𝐶𝐶𝑾𝑾𝒊𝒊𝒊𝒊𝒄𝒄 𝑪𝑪𝑪𝑪 − 𝐶𝐶𝐶𝐶𝐶𝐶𝑾𝑾𝒊𝒊𝒊𝒊𝒄𝒄𝒐𝒐𝒏𝒏𝒊𝒊 𝑪𝑪𝑪𝑪
𝐶𝐶𝐶𝐶2 𝐶𝐶𝐶𝐶𝐶𝐶𝐶𝐶𝐶𝐶𝐶𝐶𝐶𝐶𝐶𝐶
• Where:– COEWith CC: The plant modeled with novel technology– COEWithout CC: Reference non-capture plant
• Generally Case 11 in the Bituminous Baseline Rev. 2
– CO2 captured equals the rate of CO2 captured, tonne/MWh
– it does NOT include the cost to transport and store (T&S) CO2
36
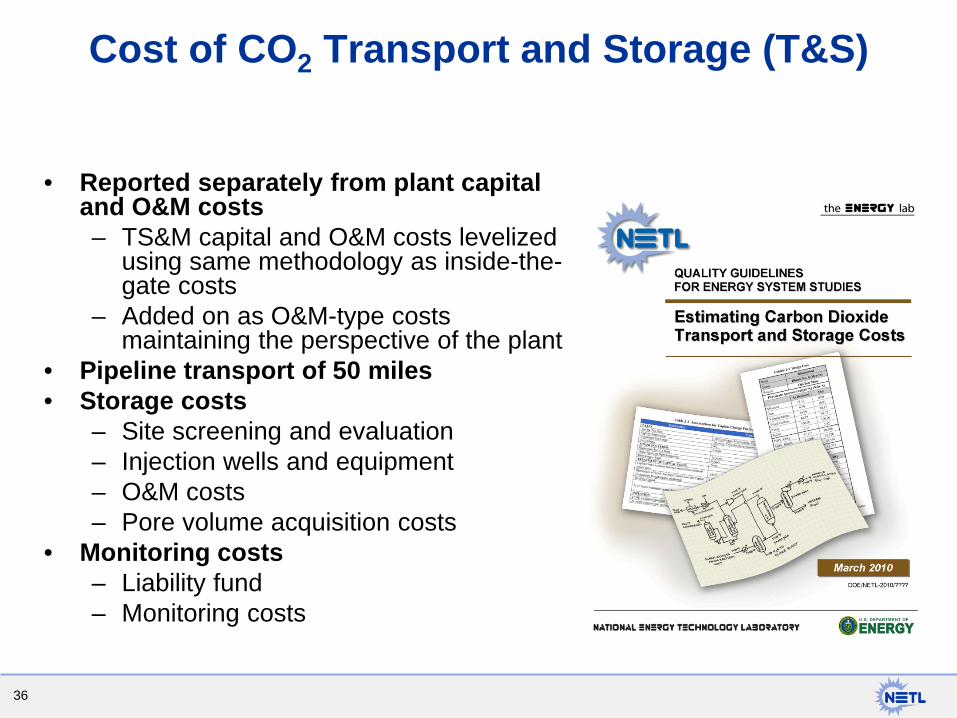
Cost of CO2 Transport and Storage (T&S)
• Reported separately from plant capital and O&M costs– TS&M capital and O&M costs levelized
using same methodology as inside-the-gate costs
– Added on as O&M-type costs maintaining the perspective of the plant
• Pipeline transport of 50 miles• Storage costs
– Site screening and evaluation– Injection wells and equipment– O&M costs– Pore volume acquisition costs
• Monitoring costs– Liability fund– Monitoring costs
37
Capital Costs – Research Goals and Bearable Costs
• Research goals – Intended targets for the costs of technology under development– Detailed descriptions as to the reason for the selection of the
targets should be provided– Available data that supports the goal selection should be
provided • Bearable costs – The costs at which the technology
meets a specific goal– If a goal has been provided (e.g. < 30 percent increase in COE),
the bearable cost to meet the goal can be calculated