Embed Size (px)
Citation preview

Introduction to NeuroimagingJanaina Mourao-Miranda
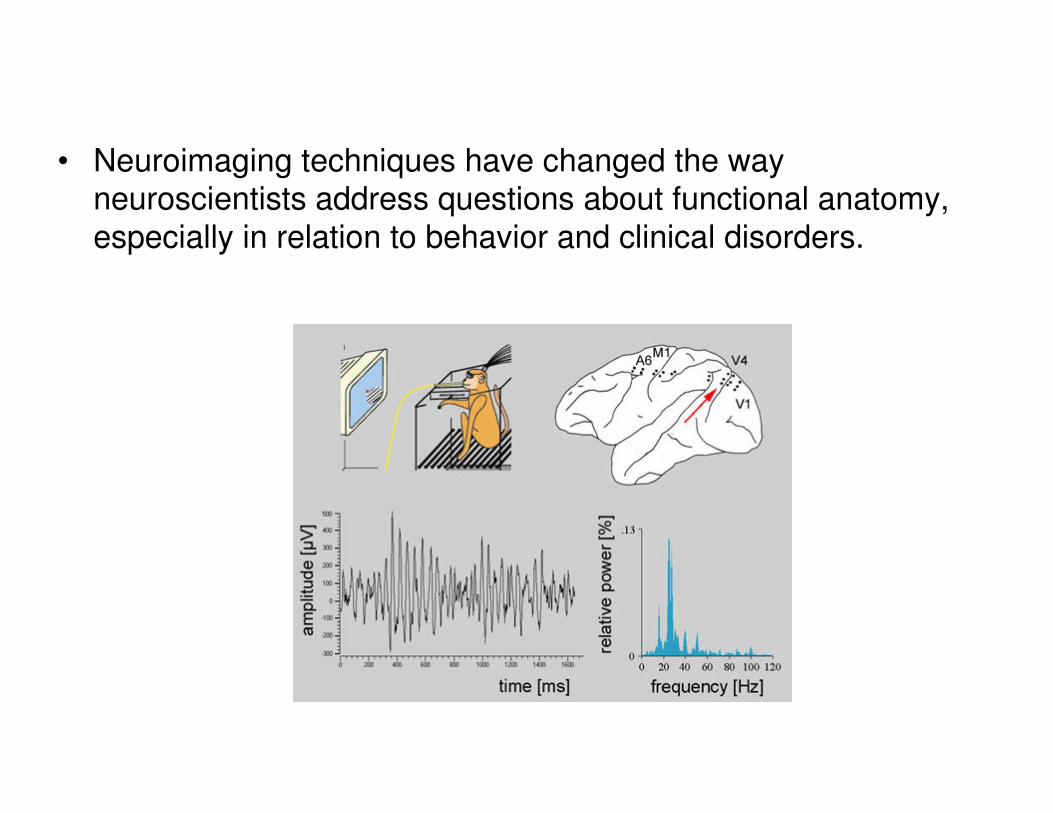
• Neuroimaging techniques have changed the way neuroscientists address questions about functional anatomy,
especially in relation to behavior and clinical disorders.

• Neuroimaging includes the use of various techniques to either directly or indirectly image the structure or function of the brain.
• Structural neuroimaging deals with the structure of the brain (e.g. shows contrast between different tissues: cerebrospinal fluid, grey matter, white matter).
• Functional neuroimaging is used to indirectly measure brain functions (e.g. neural activity)

• Example of Neuroimaging techniques:
– Computed Tomography (CT),
– Positron Emission Tomography (PET),
– Single Photon Emission Computed Tomography(SPECT),
– Magnetic Resonance Imaging (MRI),
– Functional Magnetic Resonance Imaging (fMRI).
• Among other imaging modalities MRI/fMRI became largely used due to its low invasiveness, lack of radiation exposure, and relatively wide availability.

• Magnetic Resonance Imaging (MRI) was developed by researchers including Peter Mansfield and Paul Lauterbur, who were awarded the Nobel Prize for Physiology or Medicine in 2003.
• MRI uses magnetic fields and radio waves to produce high quality 2D or 3D images of brain structures/functions without use of ionizing radiation (X-rays) or radioactive tracers.
• By selecting specific MRI sequence parameters different MR signal can be obtained from different tissue types (structural MRI) or from metabolic changes (functional MRI).

MRI/fMRI scanner

MRI studies brain anatomy.Functional MRI (fMRI) studies brain function.
MRI vs. fMRI
Source: Jody Culham’s fMRI for Dummies web site

Examples of brain scansMRI
one image
high resolution(1 mm)
fMRI
many images (e.g., every 2 sec for 5 mins)
low resolution(~3 mm but can be better)

3D examplefMRIStructural MRI

fMRI: What it measures?

BOLD signal
Source: fMRIB Brief Introduction to fMRI
↑neural activity � ↑ blood flow � ↑ oxyhemoglobin � ↑ T2* � ↑ MR signal
Source: Jorge Jovicich
REST
ACTIVITY

• fMRI measures changes in the Blood Oxygen Level Dependent (BOLD)signal due to changing in neural activity.
• When neurons fire in response to sensory or cognitive process a sequence of events happens resulting in an increase in local cerebral metabolism.
• An increase in neural activity (and metabolism) causes an increased demand for oxygen. To compensate for this demand the vascular system increases the amount of oxygenated haemoglobin relative to the deoxygenated haemoglobin.
• Because the deoxygenated haemoglobin attenuates the MR signal anincrease in the relation between oxygenated haemoglobin and deoxygenated haemoglobin leads to an increase of the BOLD signal
Source: Arthurs & Boniface, 2002, Trends in Neurosciences
Physiology of the BOLD signal

Temporal behaviour of the BOLD signal:Hemodynamic response
(i) Hemodynamic delay: ~2s
(ii) Time-to-peak of the response: ~13s
(iii) Width of the response
(iv) Amount of time to return to base line: ~20s
Time course of fMRI signal change in visual cortex in response to a visual stimuli

fMRI: How does it work?

fMRI Setup

fMRI: relative measure
t1
Brain scans
acquired during
task 1
tn
Brain scans
acquired during
task 2
Brain scans
acquired during
task 1
Brain scans
acquired during
task 2
time
… … … …
…
During a standard fMRI experiment, hundreds of volumes or scans comprising brain activations at thousands of locations (voxels) are acquired.
Brain scan 3D matrix of voxels

Example of an fMRI experiment
Question: Which regions in the brain are involved in the representation and perception
of objects?

A Simple Experiment
Intact
Objects
Scrambled
Objects
Blank
Screen
TIME
One volume (12 slices) every 2 seconds for 272
seconds (4 minutes, 32 seconds)
Condition changes every 16 seconds (8 volumes)Source: Jody Culham’s fMRI for Dummies web site
Lateral Occipital Complex• responds when subject views objects

Standard Analysis
The most popular method is the General Linear Model –GLM (Friston et al.,1995) , in which a linear regression is
performed on the signal value at a voxel in order to determine whether the voxel’s activity is related to one stimulus or tasks.
Typical question: Which areas are related with one stimulus
or task?
Programs: SPM (FIL-UCL), AFNI (NIH), XBAN (IOP-KCL),
FSL (FMRIB-Oxford)…

Temporal series
fMRI
Voxel Time courseBOLD signal
time

General Framework SPM (FIL-UCL)
RealignmentRealignment SmoothingSmoothing
NormalisationNormalisation
General linear modelGeneral linear model
Statistical parametric map (SPM)Statistical parametric map (SPM)Image timeImage time--seriesseries
Parameter estimatesParameter estimates
Design matrixDesign matrix
TemplateTemplate
KernelKernel
Gaussian Gaussian
field theoryfield theory
p <0.05p <0.05
StatisticalStatistical
inferenceinference
Source: www.fil.ion.ucl.ac.uk

TimeTimeTimeTime
BOLD signalBOLD signalBOLD signalBOLD signal
Time
Time
Time
Time
single voxeltime series
single voxeltime series
Voxel-wise time series analysis
modelspecification
modelspecification
parameterestimationparameterestimation
hypothesishypothesis
statisticstatistic
SPMSPMSource: www.fil.ion.ucl.ac.uk

BOLD signal
Time
Time
Time
Time ==== β β β β1111 ββββ2222++++ ++++ erro
r
xxxx1111 xxxx2222 eeee
Single voxel regression model
exxy ++= 2211 ββSource: www.fil.ion.ucl.ac.uk

Parameter estimation: Ordinary least squares
eXy += β==== ++++
e
2
1
β
β
OLS parameter estimateOLS parameter estimateOLS parameter estimateOLS parameter estimate(assuming iid error)
OLS parameter estimateOLS parameter estimateOLS parameter estimateOLS parameter estimate(assuming iid error)
yXXXTT 1)(ˆ −=β
Ordinary least Ordinary least Ordinary least Ordinary least squares (OLS):squares (OLS):squares (OLS):squares (OLS):
Estimate parameters such that
∑=
N
t
te1
2 minimal
y X
Source: www.fil.ion.ucl.ac.uk

Convolve stimulus function with a canonical hemodynamic response function (HRF):
⊗ ⊗ ⊗ ⊗ HRFHRFHRFHRF
∫ −=⊗t
dtgftgf0
)()()( τττ
Problem 1: Shape of BOLD responseSolution: Convolution model
Source: www.fil.ion.ucl.ac.uk

Problem 2: Low-frequency noise Solution: High pass filtering
blue = data
black = mean + low-frequency drift
green = predicted response, taking into account
low-frequency drift
red = predicted response (with low-frequency
drift explained away) Source: www.fil.ion.ucl.ac.uk

Discrete cosine transform basis functions
Source: www.fil.ion.ucl.ac.uk

Model: Design Matrix
discrete cosine transform (DCT) set
discrete cosine transform (DCT) set
Source: www.fil.ion.ucl.ac.uk

Contrasts &Statistical Parametric Maps
Is there activation during listening ?
Is there activation during listening ?
c = c = c = c = 1 0 0 0 0 0 0 0 0 0 01 0 0 0 0 0 0 0 0 0 01 0 0 0 0 0 0 0 0 0 01 0 0 0 0 0 0 0 0 0 0
Null hypothesis:Null hypothesis: 01 =β
)ˆ(
ˆ
ββT
T
cStd
ct =
contrast — linear combination of parameters: cTββββ
Question: Is there an effect of interest after other modelled effects have been taken into
account?
Source: www.fil.ion.ucl.ac.uk
p-value<0.05
In rejecting the null hypothesis at p-value<0.05, we accept 5%
probability of type I error (false positives).

Correction for multiple
comparisons• Mass-univariate approach:
We apply the GLM to each of a huge number of voxels (usually > 100,000).
• Threshold of p<0.05 → more than 5000 voxels significant by chance!
• Massive problem with multiple comparisons!
• Solutions:
– Bonferroni Correction (too conservative, voxels are not independent)
– False Discovery Rate
– Random Field Theory
– Permutation Test

New approaches to analyze fMRI
data
• Given that most brain functions are distributed processes, involving a network of brain regions, it would seem sensible to use the spatially distributed information contained in the fMRI data to aid our understanding of brain functions.
• Recently, multivariate pattern recognition methods have been applied to fMRI data.
• In these applications the fMRI scans are treated as spatial patterns and machine learning methods are used to identify statistical properties of the data that discriminate between brain states (e.g. task 1 vs. task 2) or group of subjects (e.g. patients vs. controls).