Embed Size (px)
Citation preview

Introduction to Hydrology for Engineers, Part 1
Notes, Handouts, TR-55 Manual

1. Pumps, Turbines and Pipe networks– Moment of Momentum Revisited– Types of pumps and turbines and uses– Pump-pipe systems, networks
2. Open Channel Flow– Specific Energy and Rapid Transitions– Hydraulic Jumps– Slowly varying flow– Open channel control structures
3. Introduction to Surface Water Hydrology– Hydrologic Cycle– Rainfall, Runoff and Design Events
4. Hydraulic Structures – Dams, weirs, spillways– Culverts– Safety and Effects of Hydraulic Structures
Course Topics

Notre Dame as an Example, 2016

Notre Dame as Example, Yesterday

Outline of Hydrology Section
1. Introduction, Surface water processes, and Watersheds
2. Overview of TR-55 Hydrology Manual3. Curve Numbers and Runoff4. Site Characteristics and Time of Concentration5. Design Rainfall6. Introduction to Hydrographs7. TR-55 Tabular Hydrograph Method8. TR-55 Graphical Peak Discharge Method9. Rational Method

What is Hydrology?• Science dealing with the quantities, movement, properties (e.g.
contaminants) and use of earth’s fresh water, and its effect on natural and human systems– Surface water– Ground water– Frozen (snow and ice)
Examples:– Severity and frequency of droughts– Groundwater quality in agricultural areas– Rainfall variability– Soil and vegetation effects on hydrologic cycle– Pollution transport
• Falls under the broad heading of water resources• Here, we will concentrate on determining the input flows for our hydraulic
systems– Very closely linked to rainfall and runoff– Small regions studied here (easier)
We will focus on this
Not these

The Hydrologic Cycle

Hydrology vs Hydraulics• Much of hydrology is based on observations that are
generalized to practice– What is the expected maximum rainfall over a 24 hour
period?• For what return period? 1 year, 10 year, 100 year?
– What will be the streamflow resulting from a given storm?• Peak value, time variation, relationship to total amount of rainfall
• Hydraulics tends to start from basic physical principles, then make approximations for practice– What will be the flow depth in a given channel for a given
discharge?– Hydraulics tends to work with manmade systems
• Often, surface water hydrology provides inputs (max flow rate) for hydraulics (oversimplified explanation)

Important Processes for Surface Water Hydrology
• Rainfall– Geographic Location– Amount/Time/Intensity– Return Period
• Site Conditions– Size/Length– Gradient– Soil/Vegetation Type/Development/Moisture
Content

Watersheds• Areas of interest are often watersheds
– Region that drains surface water to a given point– Small end: parking lot for drain design– Large end: Entire Mississippi basin for river at New
Orleans• Need to delineate watersheds for hydrologic
analysis1. Identify upstream points dividing watersheds (peaks,
ridges)2. Connect points to form watershed area
• Example

What is the watershed that drains to this location?

What is the watershed that drains to this location?
These streams are part of the watershed
These streams are not

Identify dividing lines between watersheds (peaks, ridges, saddle points)

Connect dividing lines to delineate watershed.Lines are perpendicular to contours going up valleys and run along the tops of ridges.

Outline of Hydrology Section
1. Introduction, Surface water processes, and Watersheds
2. Overview of TR-55 Hydrology Manual3. Curve Numbers and Runoff4. Site Characteristics and Time of Concentration5. Design Rainfall6. Introduction to Hydrographs7. TR-55 Tabular Hydrograph Method8. TR-55 Graphical Peak Discharge Method9. Rational Method

TR-55 Manual
• Gives widely used engineering methods to compute both time variation of runoff and maximum runoff from small watersheds
• For unconfined flow in open channels, not sewers• Two main methods
1. Graphical Peak Discharge Method2. Tabular Hydrograph Method
• Fairly long, but do not need to print entire manual, particularly not Appendix A (soil groups)
• Very useful worksheets for computations

Do Not Use TR-55 Manual if
• Sewer flow is important for the watershed• Complete time records of stream flow are
required• Runoff from snowmelt or rain on frozen
ground are important• Complex storage routing is in place• The 24 hour storm is not applicable to the
watershed of interest

Overall Procedure for All Surface Water Hydrology Here
1. Rainfall (inches, cm)– May or may not need to include time varying
aspects2. Runoff (inches, cm)
– Less than Rainfall– Strongly dependent on watershed properties
3. Streamflow or Discharge (ft3/s, m3/s)– Design Flows– Function of runoff, watershed size, slope, …

Beware of Frankenstein Units!• Many formulas in hydrology will only work in one
specific set of (often strange) units. For example:– Time in days– Area in Acres, or Square Miles– Distance in feet, or inches– Volumes in acre-feet– Rainfall rates in inches/hour
• If equations are computed in the wrong set of units, they will not make sense
• Write down on your formula sheets, the proper units for each equation, where applicable.

Outline of Hydrology Section
1. Introduction, Surface water processes, and Watersheds
2. Overview of TR-55 Hydrology Manual3. Curve Numbers and Runoff4. Site Characteristics and Time of Concentration5. Design Rainfall6. Introduction to Hydrographs7. TR-55 Tabular Hydrograph Method8. TR-55 Graphical Peak Discharge Method9. Rational Method

Runoff• Divided into surface runoff (fast), groundwater runoff
(slow) (also interflow – usually small)• Here, we will look largely at surface runoff to
streams, channels, and rivers• Amount and time variation of surface runoff-produced
streamflow is often the design input for hydraulics– Surface runoff reduced by interception, depression
storage, soil-moisture replenishment, groundwater infiltration
• Surface runoff collects in streams, other channels– Often develop stage (water level) –discharge curves to
obtain records of stream flow• e.g. Sharp crested weir has strong elevation-discharge relationship

Relationships between Rainfall and Runoff
• Need a method to estimate runoff for ungauged sites (most) – amount and time variation– SCS (Soil Conservation Service, now Natural Resources
Conservation Service) methods– Dependent on
• Land Use, • Antecedent Soil Moisture, • Soil Type, ABCD – sand/gravel (A) through clay (D)• Rainfall Amount
1. Gives Curve Number: Runoff is simple function of Precipitation and Curve Number
2. Combine with Synthetic Unit Hydrograph to get predicted hydrograph from given storm
• Useful for sites where basin response time scale is similar to or larger than storm time scales– If basin response time is very small, use different methods

Runoff Magnitudes
• SCS Procedures use data-driven methods to find amount of runoff compared to amount of rainfall
• Need to know:– Catchment properties: Uses, soil types,
antecedent moisture– Storm Characteristics: rainfall amounts in given
time periods– Runoff can be quite nonlinear compared to rainfall

Antecedent Moisture Conditions and Soil Groups
•Often use AMC II (average moisture for general design)•Runoff less for low soil moisture, greater for higher soil moisture
•Runoff higher for low infiltration rate (C-D), runoff lower for easy infiltration to groundwater (A-B)

Some SCS Runoff Curve Numbers for AMC II
Curve NumbersCN

Curve Numbers and Runoff• Curve Number (0-100) gives a measure of the tendency toward
runoff (higher gives more runoff)• Find Soil-moisture deficit S (inches) at beginning of runoff• If Cumulative Rainfall P (inches) large enough, runoff occurs• Procedure to estimate CN from Figs. 2-2, 2-3, 2-4, Table 2, TR-55
( )2
1000 10*
If 0.2
0.20.8
Otherwise0
CNSCN
P S
P SR
P S
R
−=
>
−=
+
=

Simple Runoff Examples
1. If we have a storm that provides 1 inch of rain for a meadow with Soil Group A and AMC II, what runoff will it produce?
2. Do the same thing for a residential area with 1/8 acre lots and soil group D

Example 1• For a meadow with soil group A and AMC II, the
curve number is CN=30 (quite low)• Gives S = 23.3 inches (very high)• P= 1 inch• 0.2*S = 4.6 inches• Since P<0.2*S, Runoff R=0 • No direct runoff from this storm, but after some
time, the groundwater base flow will increase

Example 2• For a residential area with 1/8 acre lots, AMC
II, and soil group D, CN=92 (high runoff)• Gives S = 0.86 inches (low)• P = 1 inch• 0.2*S = 0.174 inches• Since P>0.2*SRunoff R = 0.41 inches• If we double precipitation to 2 inches, we find
R=1.24 inches• So runoff is very nonlinear

Why is Runoff Nonlinear?
• When rain first starts, it is very easy for water to infiltrate into the ground, get trapped on leaves, and just make things wet– Initial rainfall does not lead to runoff
• After some time, it is harder for rainfall to make its way into groundwater, etc., and runoff begins– Some rainfall still makes it to GW etc
• After a long time, saturated conditions mean that all additional rainfall leads to runoff
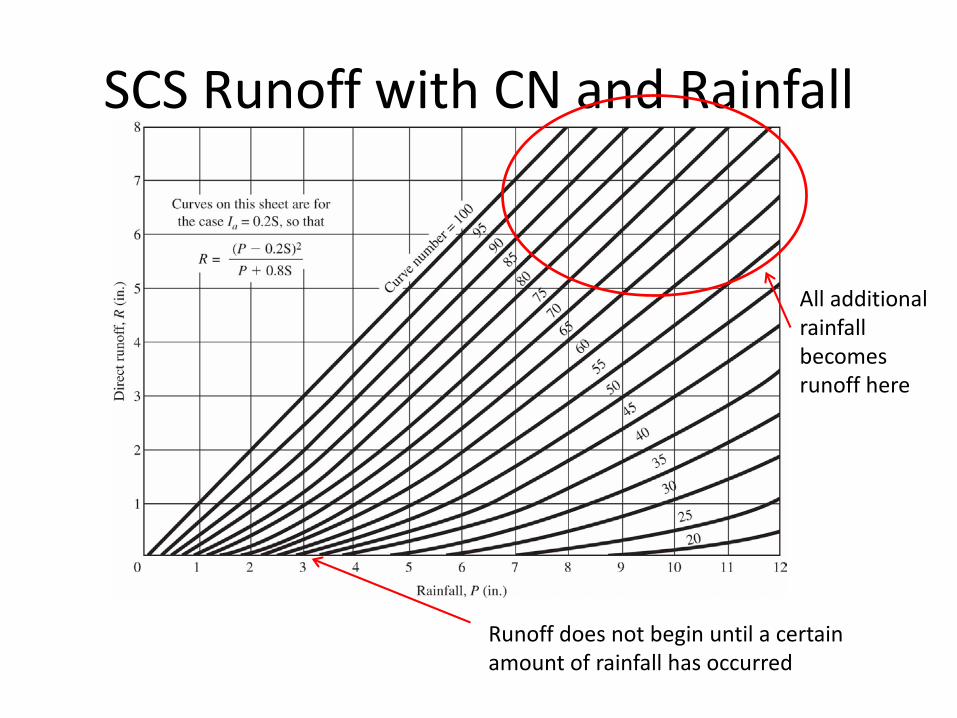
SCS Runoff with CN and Rainfall
Runoff does not begin until a certain amount of rainfall has occurred
All additional rainfall becomes runoff here

Curve Numbers When Table 2-2 Assumptions do not Apply
• When assumptions do not apply (e.g. different % impervious), can make modified CN
• Follow Fig 2-2 flow chart• Ex: Type B Soil, ½ acre lots, 35% connected
impervious, good condition, 5 inches rainfall –does not fit assumptions of Table 2-2– Find CN for open space, type B– Use Fig 2-3 to find CN for 35% impervious– Equations in Appendix F
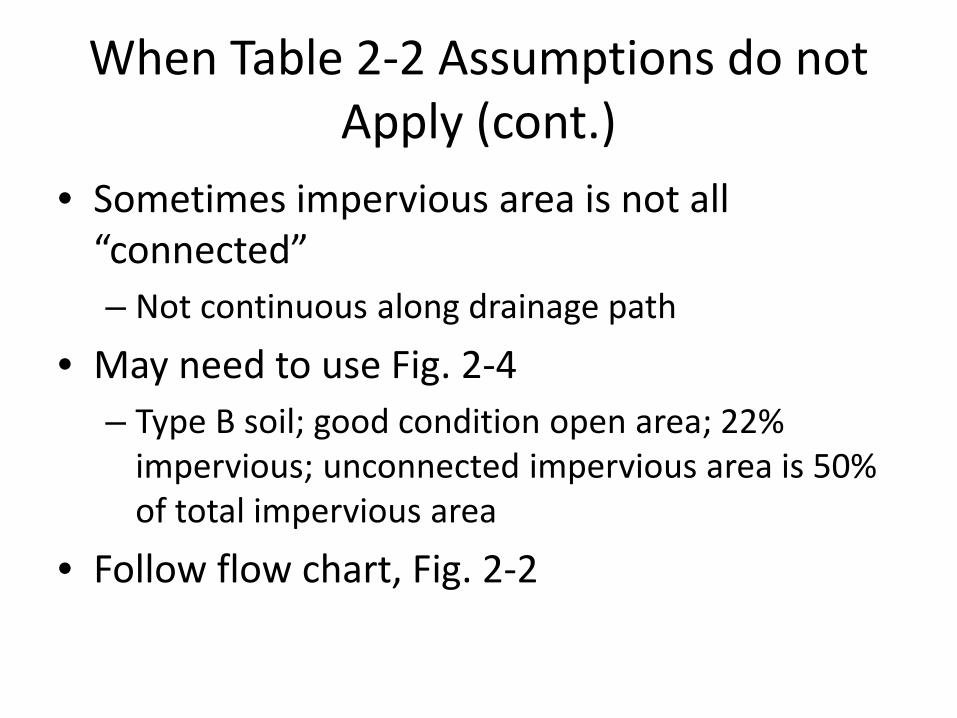
When Table 2-2 Assumptions do not Apply (cont.)
• Sometimes impervious area is not all “connected”– Not continuous along drainage path
• May need to use Fig. 2-4– Type B soil; good condition open area; 22%
impervious; unconnected impervious area is 50% of total impervious area
• Follow flow chart, Fig. 2-2

Overall Runoff from Composite Watersheds
• For regions with more than one type of land cover/land use, make Overall CN from individual CN
• Area Weighted– Can use Worksheet 2, TR-55
• Example: A catchment has 10 acres of previous example, and 10 acres Soil type C, residential ¼ acre lots, 38% impervious
• For some purposes (Tabular Hydrograph Method), you will have to divide overall watershed into subareas, and compute composite CN for each

How to Find the Amount of Runoff Generated During Various Portions of a Storm
• Say we have a storm hyetograph, site conditions
• We can now find the total runoff produced
• To use unit hydrographs, need the time variation of runoff produced
• How?
Runo
ff (In
ches
) We need this time variation of runoff
To produce this

Runoff Time Variation
• Simple solution to problem of runoff time variation
1. At each time tj, find cumulative runoff from cumulative precipitation up to that time, Rj
2. Runoff generated during that time interval of tj-1 to tj is the difference between runoffsdRj=Rj-Rj-1
3. These dRj values are inputs into the unit hydrograph for that watershed
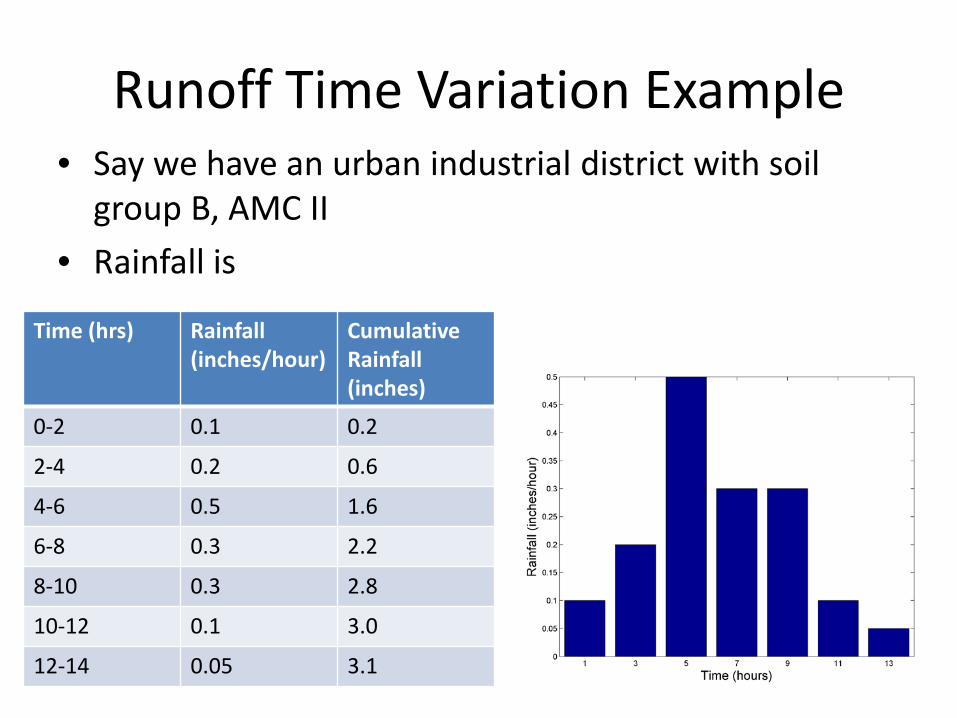
Runoff Time Variation Example• Say we have an urban industrial district with soil
group B, AMC II• Rainfall is
Time (hrs) Rainfall (inches/hour)
Cumulative Rainfall(inches)
0-2 0.1 0.2
2-4 0.2 0.6
4-6 0.5 1.6
6-8 0.3 2.2
8-10 0.3 2.8
10-12 0.1 3.0
12-14 0.05 3.1

Cumulative Runoff
• From Chart, CN = 88• S = 1.36 inches• From cumulative
rainfall, find cumulative runoff from
( )2
If 0.2
0.20.8
Otherwise0
P S
P SR
P S
R
>
−=
+
=
No runoff from first rainfall interval

Incremental Runoff
• Incremental Runoff found from difference in runoffs produced between two successive time intervals
• These are the inputs for a unit hydrograph
• These are not the time variation of actual discharge in a stream

Outline of Hydrology Section
1. Introduction, Surface water processes, and Watersheds
2. Overview of TR-55 Hydrology Manual3. Curve Numbers and Runoff4. Site Characteristics and Time of Concentration5. Design Rainfall6. Introduction to Hydrographs7. TR-55 Tabular Hydrograph Method8. TR-55 Graphical Peak Discharge Method9. Rational Method

Time of Concentration• One of the most important factors of synthetic
unit hydrographs is the Time of Concentration, Tc– Time for runoff to reach design point from most
distant location in watershed– Three phases: add together to get total time
1. Sheet flow (very shallow over planar surface)2. Shallow concentrated flow (gutter)3. Open-channel flow (stream)
– Or, single empirical equation based on flow length, watershed slope, and land use/soil type
– All have Frankenstein combinations of units: be extremely careful

Sheet Flow• Very shallow depths only (<~0.1 ft)
– Flow across parking lot, grass, etc.– Usually confined to first 100 feet or so
( ) ( )1
1
0.8 0.5 0.42 0
2
0
0.007 /
time in hours
Manning's sheet flow roughness Flow length in feet 2-year, 24-hr rainfall (inches) Dimensionless slope (.01 etc)
t
t
T nL P S
T
nLPS
=

Shallow Concentrated Flow• When sheet flow converges to a more
consolidated flow in lower areas– Gutters, etc.
2
2
2 2
0.500.50
0
2
16.1345 Unpaved
20.3282 Paved Flow velocity in ft/s Dimensionless slope
/
distance in feet
in seconds if L in feet
t t
t
t t
V S
V SVST L V
L
T
=
=
=
You will be given lengths, slopes, etc., for any problems

Channel Flow• Exactly as before – use units of feet for
bankfull depth• Need to specify some general flow depth –
does not change with flow rate
3 3
3
3
2/3 1/20
0
1.49
in ft/s in ft dimensionless slope
T /
in ft
T in seconds
h
h
t t
t
t
V R Sn
VRS
L V
L
=
=

Overall Time of Concentration
• Total time of ConcentrationTc= Tt1 + Tt2 + Tt3
• Make sure that units are the same when adding
• Worksheet 3

Alternate Time of Concentration
• For small watersheds (<2,000 acres)• Based on regression of data
( ) ( )0.70.8 0.50
0
1 / 1140*(100 )
in hours Length in ft from most distant
point in watershed Soil moisture deficit calculated from
Curve Number CN (NOT SLOPE!!)S Average slope
c
c
T L S S
TL
S
= +