Embed Size (px)
Citation preview
Introduction to Econometrics
James H. Stock HARVARD UNIVERSITY
Mark W. Watson PRINCETON UNIVERSITY
... ~
Boston San Francisco New York
London Toronco Sydney ToJ..:yo Singapore Madrid
Mexico City Munich Paris Cape Town Hong Kong Montreal
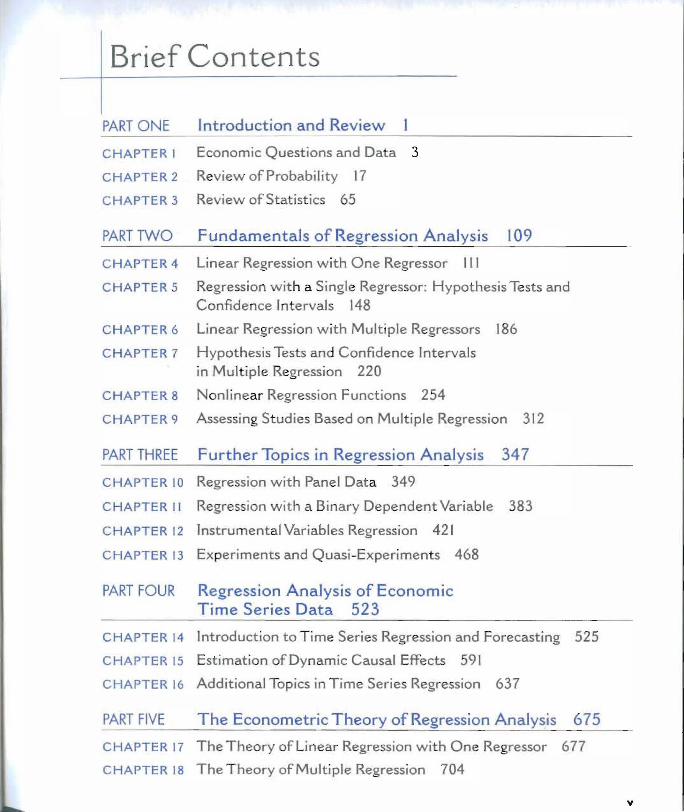
Brief Contents
PART ONE Introduction and Review
CHAPTE R I Economic Questions and Data 3
CHAPTER 2 ReviewofProbability 17
CHAPTER 3 Review of Statistics 65
PART TWO Fundamentals of Regression Analysis 109
CHAPTER 4 Linear Regression with One Regressor 1II
CHAPTER 5 Regression with a Single Regressor: Hypothesis Tests and Confidence In tervals 148
CHAPTER 6 Linear Regression with Multiple Regressors 186
CHAPTER 7 Hypothesis Tests and Confidence Intervals in Mult iple Regression 220
CHAPTER 8 Nonlinear Regression Functions 254
CHAPTER 9 Assessing Studies Based on Multiple Regression 312
PART THREE Further Topics in Regression Analysis 347
CHAPTER 10 Regression with Panel Data 349
CHAPTER II Regression with a Binary Dependent Variable 383
CHAPTE R 12 Instrumenta l Variables Regression 421
CHAPTER 13 Experiments and Quasi -Experiments 468
PART FOUR Regression Analysis of Economic Time Series Data 523
CHAPTER 14 Introduction to T ime Series Regression and Forecasting 525
CHAPTER 15 Estimation of Dynamic Causal Effects 591
C HAPTER 16 Additional Topics in Time Series Regression 637
PART FIVE The Econometric Theory of Regression Analysis 675
CHAPTER 17 The Theory of Linear Regression wit h One Regressor 677
CHAPTER 18 The T heory of Multiple Regression 704
v
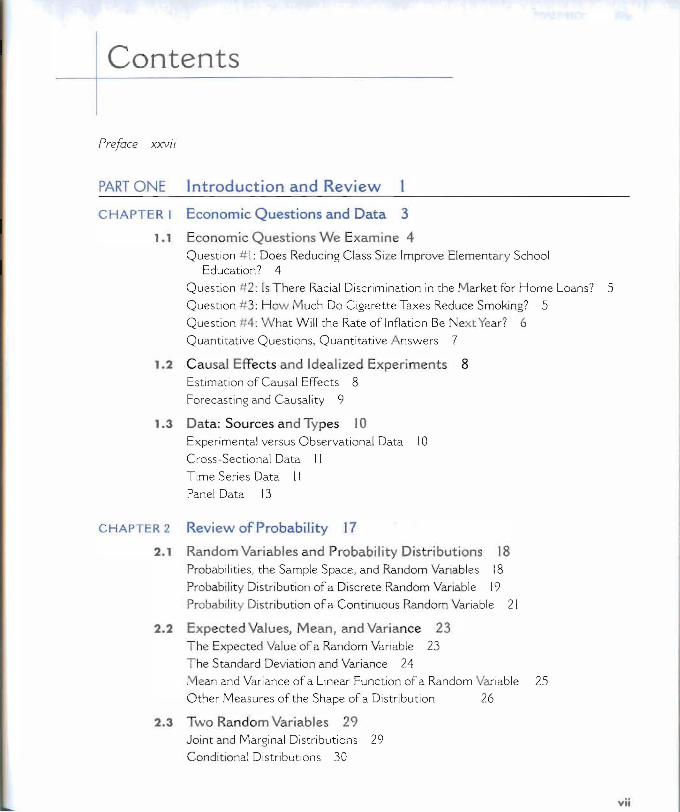
Contents
Preface XXVIl
PART ONE Introduction and Review
CHAPTER I Economic Questions and Data 3
1.1 Economic Questions We Examine 4 Question # 1: Does Reducing Class Size Improve Elementary School
Education? 4
Question # 2: Is There Racial Discrimination in the Market for Home Loans? 5
Question # 3: How Much Do Cigarette Taxes Reduce Smoking? 5
Question #4: W hat Will the Rate of Inflation Be Next Year? 6
Quantitative Questions, Quantitative Answers 7
1.2 Causal Effects and Idealized Experime nts 8 Estimation of Causal Effects 8
Forecasting and Causality 9
1.3 Data: Sources and Types 10 Experimental versus Observational Data 10
Cross-Sectional Data [ I
Time Series Data II
Panel Data 13
CHAPTER 2 Review of Probability 17
2.1 Random Variables and Probability Distributions 18 Probabilities, the Sample Space, and Random Variables 18
Probability Distribution of a Discrete Random Variable 19
Probabili ty Distribution ofa Continuous Random Variable 21
2.2 Expected Values, Mean, and Variance 23 The Expected Value of a Random Variable 23
The Standard Deviation and Variance 24
Mean and Variance of a Linear Function of a Random Var iable 25
Other Measures of the Shape of a Distribution 26
2.3 Two Random Variables 29 Joint and Marginal Distributions 29
Conditional Distributions 30
vii
viii CONTENTS
2.4
2.5
2.6
CHAPTER 3
3.1
3.2
3.3
3.4
3.5
Independence 34
Covariance and Correlation 34
The Mean and Variance of Sums of Random Variables 35
The Normal, Chi-Squared,Student t, and F Distributions 39 The Normal Distribution 39
The Chi-Squared Distribution 43
The Student t Distribution 44
The F Distribution 44
Random Sampling and the Distribution of the Sample Average 45 Random Sampling 45
The Sampling Distribution of the Sample Average 46
Large-Sample Approximations to Sampling Distributions 48 The Law of Large Numbers and Consistency 49
The Central Li mit Theorem 52
APPENDIX 2.1 Derivation of Results in Key Concept 2.3 63
Review ofStatistics 65
Estimation of the Population Mean 66 Estimators and Their Properties 67
Properties of Y 68 The Importance of Random Sampling 70
Hypothesis Tests Concerning the Population Mean 71 Null and Alternative Hypotheses 72
The p-Value 72
Calculating thep-Value When O' y Is Known 74
The Sample Variance, Sample Standard Deviation , and Standard Error 75
Calculating thep-Value When O'y Is Unknown 76
The t-Statistic 77
Hypothesis Testing with a Prespecifled Significance Level 78 One-Sided Alternatives 80
Confidence Interva ls for the Population Mean 81
Comparing Means from Different Populations 83 Hypothesis Tests for the Difference Between Two Means 83
Confidence Intervals for the Difference Between Two Population Means 84
Differences-of-Means Estimat ion ofCausa l Effects Using Experimental Data 85 The Causal Effect as a Difference of Conditional Expectations 85
Estimation of the Causal Effec t Using Differences of Means 87
ix CONTENTS
3.6 Using the t-Stat istic W hen the Sample Size Is Small 88 T he t-Statistic and the Student t Distribution 88 Use of the Student t Distribution in Practice 92
3.7 Scatterplot, the Sample Covariance, and the Sample Correlation 92 Scatterp[ots 93
APPENDIX 3. 1 The U.S. Current Population Survey [05
APPENDIX 3.2 Two Proofs That Y [s the Least Squares Estimator of J.Ly [06
APPENDIX 3.3 A ProofThat the Sample Variance Is Consistent [07
Sample Covariance and Correlation 94
PART TWO Fundamentals of Regression Analysis 109
CHAPTER 4 linear Regression w ith One Regressor III
4. 1 The Linear Regression Model 112
4.2 Estimating the Coefficients of the Linear Regression Model 116 T he Ordinary Least Squares Estimator [18
OLS Estimates of the Re[ationsh ip Between Test Scores and the Student-Teacher Ratio 120
Why Use the OLS Estimator? 121
4.3 Measures of Fit 123 The R2 [23 The Standard Error of the Regression 124
Application to the Test Score Data 125
4.4 T he Least Squares Assumptions 126 Assumption #1: The Conditional Distribution ofu, Given X, Has a Mean
of Zero [26
Assumption #2: (X,. Y,). i = [ .. . . . n Are Independent[y and Identically Distributed [28
Assumption #3: Large Outliers Are Unlike[y [29
Use of the Least Squares Assumptions 130
4.5 The Sampling Distribution of the OLS Estimators 131 132T he Sampling Distribution of the OLS Estimators
4.6 Conclusion 135
AP P ENDI X 4 . 1 The California Test Score Data Set [43
A PPEND IX 4. 2 Derivation of the OLS Estimators 143
A PPEN DIX 4 . 3 Sampling Di stribution of the O LS Estimator 144
x CO NTENTS
CHAPTER 5 Regression with a Single Regressor: Hypothesis Tests and Confidence Intervals 148
5.1 Testing Hypotheses About One of the Regression Coefficients 149 Two-Sided Hypotheses Concerning f31 149
O ne-Sided Hypotheses Concerning f31 153
Testing Hypotheses About the Intercept f30 155II
5.2 Confidence Intervals for a Regression Coefficient ISS
5.3 Regression W hen X Is a BinaryVariable 158 I. Inte rpretation of the Regression Coefficients 158
5.4 Heteroskedasticity and Homoskedasticity 160I W hat Are Heteroskedasticity and Homoskedasticity? 160
Mathematical Implications of Homoskedasticity 163
W hat Does This Mean in Practice? 164
5.5 The Theoretical Foundations ofOrdinary Least Squares 166 Linear Cond itionally Unbiased Estimators and the Gauss-Markov -r heorem 167 Regression Estimators Other Than OLS 168
5.6 Using the t-Statistic in Regression When the Sample Siz~
Is Small 169 The t-Statistic and the Student t Distribution 170
Use of the Student t Distribution in Practice 170
5.7 Conclusion 171
APPE NDI X 5 .1 Formulas for OLS Standard Errors 180
APPEND IX 5.2 The Gauss-Markov Conditions and a Proof of the Gauss-Markov Theorem 182
CHAPTER 6 Linear Regression with Multiple Regressors 186
6.1 Omitted Variable Bias 186 Definition ofOmitted Variable Bias 187
A Formula for Omitted Va riable Bias 189
Addressing Omitted Variable Bias by Dividing the Data into Groub s 191
6.2 The Multiple Regression Mode l 193 The Population Regression Line 193
The Population Multiple Regre ssion Model 194
6.3 The OLS Estimator in Multiple Regression 196 The OLS Esti ma tor 197 Appl ication to Test Scores and the Student-Teacher Ratio 198
xi CONT ENTS
6.4 Measures of Fit in Multiple Regression 200 T he Standard Error of the Regression (SER) 200 The R2 200 The 'I\djusred R2" 20 I
Applicat ion to Test Scores 202
6.5 The Least Squares Assumptions in Multiple Regression 202 Ass umption # 1: The Conditional Distribution ofu,Given XI, ' X2i , . .. ,Xk, Has a
Mean of Zero 203
Assumption # 2: (XI, ' X2" . . . ,Xiu ' Y,) i =I, ... ,n Are i.i.d. 203 Assum ption # 3: Large Outliers Are Unlikely 203
Assumption #4: No Perfect Mul ticollinearity 203
6.6 The Distribution ofthe OLS Estimators in Multiple Regression 205
6.7 Mul t icollinearity 206 Examples of Perfect Multicollineari ty 206
Imperfect Multicollinearity 209
6.8 Conclusion 210
APPENDIX 6 .1 Derivation of Equation (6 .1) 218
APPEN DIX 6 .2 Distribution of the OLS Estimators W hen There Are Two Regressors and Homoskedastic Errors 218
CHAPTER 7 Hypothesis Tests and Confidence Intervals in Multiple Regression 220
7.1 Hypothesis Tests and Confidence Intervals fo r a Single Coeffic ient 221 Standard Errors for the OLS Estimators 22 1
Hypothesis Tests for a Single Coeffi cient 22 1 Confidence Intervals for a Single Coefficient 223
Application to Test Scores and the Student- Teacher Ratio 22 3
7.2 Tests ofJoint Hypotheses 225 Testing Hypotheses on Two or More Coefficients 225
T he F-Statistic 227 Application to Test Scores and the Student- Teacher Ratio 229
T he Homoskedastici ry-Only F-Statistic 230
7.3 Testing Single Restrictions Involving Multiple Coefficients 232
7.4 Confidence Sets for Multiple Coefficients 234
xii CONTE NTS
7.S
7.6
7.7
CHAPTER 8
8.1
8 .2
8 .3
8.4
8.5
CHAPTER 9
9.1
9.2
Model Specification for Multipl e Regression 235 Omitted Variable Bias in Multiple Regression 236
Model Specification in Theory and in Practice 236 Interpreting the R2 and the Adjusted R2 in Practice 237
Analysis of the Test Score Data Set 239
Conclusion 244
APPE ND IX 7. 1 The Bonferroni Test ofa Joint Hypotheses 251
Nonlinear Regression Functions 254
A General Strategy for Modeling Nonlinear Regression Functions 256 Test Scores and District Income 256
The Effect on Yof a Change in X in Nonlinear Specifications 260
A General Approach to Modeling Nonlinearities Using Multiple Regression 264
Non linear Functions of a Single Independent Variable 264 Polynomials 265
Logarithms 267
Polynomial and Logarithmic Models of Test Scores and District Income 275
Interactions Between Independent Variables 277 Interactions Between Two Binary Variables 277
Interactions Between a Continuous and a Binary Variable 280
Interactions Between Two Continuous Variables 286
Nonlinear Effects on Test Scores of the Student-Teacher Ratio 290 Discussion of Regression Results 291
Summary of Findings 295
Conclusion 296
APPENDI X 8.1 Regression Functions That Are Nonlinear in the Parameters 307
Assessing Studies Based on Multiple Regression 312
Internal and Exte rna l Validity 31 3 Threats to Internal Validity 313
Threats to External Validity 314
Threats to Internal Validity of Multiple Regression Analysis 316 Omitted Variable Bias 316
Misspecification of the Functional Form of the Regression Function 319 Errors-in-Variables 319 Sample Se lection 322
CONTE NTS xiii
Simultaneous Causa li ty 324 Sources of Inconsistency of OLS Standard Errors 325
9.3 Internal and External Validity When the Regression Is Used for Forecast ing 327 Using Regression Models for Forecasting 327
Assessing the Validity of Regress ion Models for Forecasting 328
9.4 Example: Test Scores and Class Size 329 External Validity 329
Internal Validity 336
Discuss ion and Implications 337
9.S Conclusion 338
APPEND IX 9.1 The Massachusetts Elementary School Testing Data 344
PART THREE Further Topics in Regression Analysis 347
CHAPTER 10 Regression with Panel Data 349
10. 1 Panel Data 350 Example: Traffic Deaths and Alcohol Taxes 351
10.2 Panel Data with Two Time Periods: "Before and After" Comparisons 353
10.3 Fixed Effects Regression 356 The Fixed Effects Regression Model 356
Estimation and Inference 359
Application to Traffic Deaths 360
10.4 Regression with Time Fixed Effects 361 Time Effects Only 36 1
Both En tity and Time Fixed Effects 362
10.S The Fixed Effects Regression Assumptions and Standard Errors for Fixed Effects Regression 364 The Fixed Effects Regression Assumptions 364
Standard Errors for Fi xed Effects Regression 366
10.6 Drunk Driving Laws and Traffic Deaths 367
10.7 Conclusion 371
APPENDIX 10 . 1 The State Traffic Fatality Data Set 378
APPENDIX 10 .2 Standard Errors for Fixed Effects Regression with Serially Correlated Errors 379
xiv CONTENTS
CHAPTER II
11.1
11.2
11 .3
11.4
11.5
CHAPTER 12
12.1
12.2
12.3
12.4
Regression with a Binary DependentVariable 383
Binary Dependent Variables and the Linear Probability Model 384 Binary Dependent Variables 385
The Linear Probability Model 387
Probit and Logit Regression 389 Probit Regression 389
Logit Regression 394
Comparing the Linear Probability, Probit, and Logit Models 396
Estimation and Inference in the Logit and Probit Models 396 Nonlinear Least Squares Estimation 397
Maximum Likelihood Estimation 398 Measures of Fit 399
Application to the Boston HMDA Data 400
Summary 407
APPENDIX 11 . 1 The Boston HMDA Data Set 415
APPENDIX 11 . 2 Maximum Likelihood Estimati on 415
APPEND IX 11. 3 Other Limited Dependent Variable Models 418
Instrumental Variables Regression 421
The IV Estimator w ith a Single Regressor and a Single Instrument 422 The IV Model and Assumptions 422
The Two Stage Least Squares Estimator 423
Why Does IV Regression Work? 424
The Sampling Distribution of the TSLS Estimator 428
Application to the Demand for Cigarettes 430
The General IV Regression Model 432 TSLS in the General IV Model 433
Instrument Relevance and Exogeneity in the General IV Model 434
The IV Regression Assumptions and Sampling Distribution of the TSLS Estimator 434
Inference Using the TSLS Estimator 437
Appl ication to the Demand for Cigarettes 437
Checking Instrument Validity 439 Assumption # 1: Instrument Relevance 439 Assumption # 2: Ins trument Exogeneity 443
Application to the Demand for Cigarettes 445