Embed Size (px)
Citation preview

Technology Transition Workshop
Introduction to Biological Mass Spectrometry(Mass Spectrometry 101)
Steven A. Hofstadler, Ph.D.Ibis Biosciences, Inc.

Technology Transition Workshop
Disclaimer• This presentation covers the basic concepts of
mass spectrometry
• The material is not specifically required to operate the Ibis T5000™
• Users are not expected to tune and/or optimize the mass spectrometer
• The goal of this presentation is to give the user a basic understanding of where/how mass spectrometry fits into the Ibis workflow

Technology Transition Workshop
Overview• Introduction – what is Mass Spectrometry?
– Mass Spectrometry (MS) and Ibis T5000™
• Brief History• General Components• The “Mass” Spectrum
– Definitions and Nomenclature• Ionization Sources
– Matrix Assisted Laser Desorption Ionization (MALDI)– Electrospray Ionization (ESI)– Others
• Time-of-Flight (TOF) Mass Analyzers• ESI-TOF of nucleic acids

Technology Transition WorkshopMass Spectrometry and Ibis platform
Profile 1
Profile 2
Profile 3
Forensic profile compared with existing database entries, or used to populate database
IMAGE COURTESY OF IBIS BIOSCIENCES, INC.

Technology Transition WorkshopMass Spectrometry of Nucleic Acids?
• Information content– From precise mass measurements unambiguous base
compositions are derived [A10 G23 C32 T17] = [10 23 32 17]
• Speed– < 1 minute/sample
• Applicability to mixtures– Dynamic range is around 100:1– MS succeeds where sequencing fails (e.g. mixtures)
• Automation– End-to-end process is highly automated (including spectral
processing/interpretation)
• Sensitivity– Single copy detection demonstrated with PCR front-end

Technology Transition WorkshopWhat is a Mass Spectrometer?
• An instrument which measures the mass-to-charge ratio (m/z) of ionized analyte based on its response to applied electric and/or magnetic fields– atoms, molecules, clusters, and macromolecular
complexes• The m/z measurement is converted to a mass measurement
– m is in atomic mass units or Daltons (Da)• 1 Da = 1/12 the mass of a single atom of 12C• 1 Da = 1.66 x 10⁻²⁴ grams
– z is an integer multiplier of the fundamental unit of charge (q)
• q = 1.602 x 10⁻¹⁹ Coulombs– Mass = m/z X z
• A mass spectrometer is essentially a “molecular (or atomic) scale” that “weighs” analytes of interest

Technology Transition WorkshopBrief History
• 1897 J.J. Thompson announced the presence of electrons or “corpuscles” based on the deflection of cathode rays by electric and magnetic fields
• He later used this “beam-deflection device” to measure the mass of the electron (1906 Nobel Prize)
•
+ -
IMAGE COURTESY OF:http://www.manep.ch/img/photo/challenges/nanotubes/thompson.jpg
IMAGES COURTESY OF STEVEN A. HOFSTADLER, PH.D.

Technology Transition WorkshopBrief History (cont.)
• 1919 F. W. Aston used Thompson’s mass spectrometer to measure the atomic masses of 30 gaseous elements and prove the existence of multiple isotopes. Relative abundance measurements were made by recording isotope lines on film. “Mass spectroscopy” Nature 1919; 104; 393. (1922 Nobel Prize)– Design principles are the basis of modern electric and magnetic
sector instruments
Aston’s original “Positive-Ray Mass Spectrograph”IMAGE COURTESY OF SCIENCE MUSEUM/SCIENCE & SOCIETY PICTURE LIBRARY: http://www.ingenious.org.uk/site.asp?s=S2&DCID=1927-1085

Technology Transition WorkshopBasic Components
Inlet Systemsample introduction
Ion Sourceionizes sample
Ion Analyzersort ions by m/z
Ion Detector“counts” ions
Data Systemsignal processor
Mass Spectrum
Vacuum chamber
Instrument Control Computercontrols timing and voltages
ionoptics
ionoptics
IMAGE COURTESY OF STEVEN A. HOFSTADLER, PH.D.

Technology Transition Workshop
The “Mass” Spectrum
300 400 500 600m/z
Rel
ativ
e Ab
unda
nce
Arbi
trar
y In
tens
ityD
etec
tor R
espo
nse
100
50
0
25
75
IMAGE COURTESY OF STEVEN A. HOFSTADLER, PH.D.

Technology Transition Workshop
The “Mass” Spectrum
/disk2/data/12_4/628_23426/11/pdata/1 xspec Mon Dec 7 19:16:47 1998
200 300 400 500 600m/z
397.13 397.18
C15H16F6N4O2397.1104
C19H22N6O4 397.1628
(M-H)-
M/∆M > 75,000
IMAGES COURTESY OF STEVEN A. HOFSTADLER, PH.D.

Technology Transition Workshop
The Isotopic Envelope• Most elements have more than 1 isotope
• For a given atom type, different isotopes have different numbers of neutrons– e.g. an atom of 12C has 6 neutrons, 6 protons, and 6
electrons– an atom of 13C has 7 neutrons, 6 protons, and 6
electrons
• The mass of a neutron is 1.00867 Da
• Each element has different numbers and relative abundances of other isotopes:– 12C = 98.90% 13C = 1.10%– 35Cl = 75.77% 37Cl = 24.23%– 19F = 100%
Technology Transition Workshop
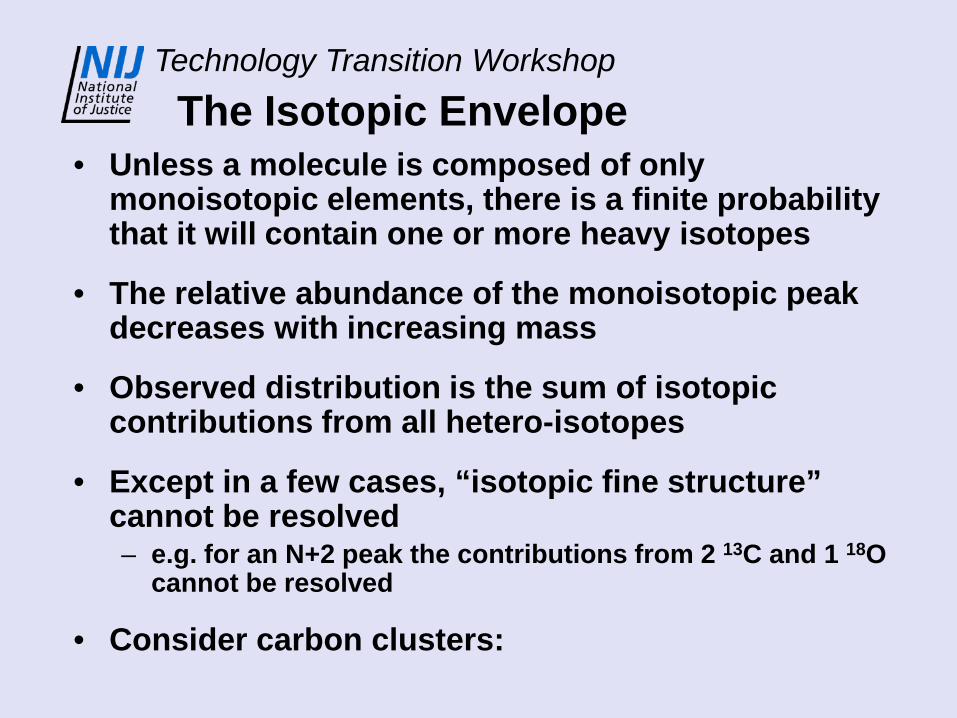
The Isotopic Envelope• Unless a molecule is composed of only
monoisotopic elements, there is a finite probability that it will contain one or more heavy isotopes
• The relative abundance of the monoisotopic peak decreases with increasing mass
• Observed distribution is the sum of isotopic contributions from all hetero-isotopes
• Except in a few cases, “isotopic fine structure” cannot be resolved– e.g. for an N+2 peak the contributions from 2 13C and 1 18O
cannot be resolved
• Consider carbon clusters:
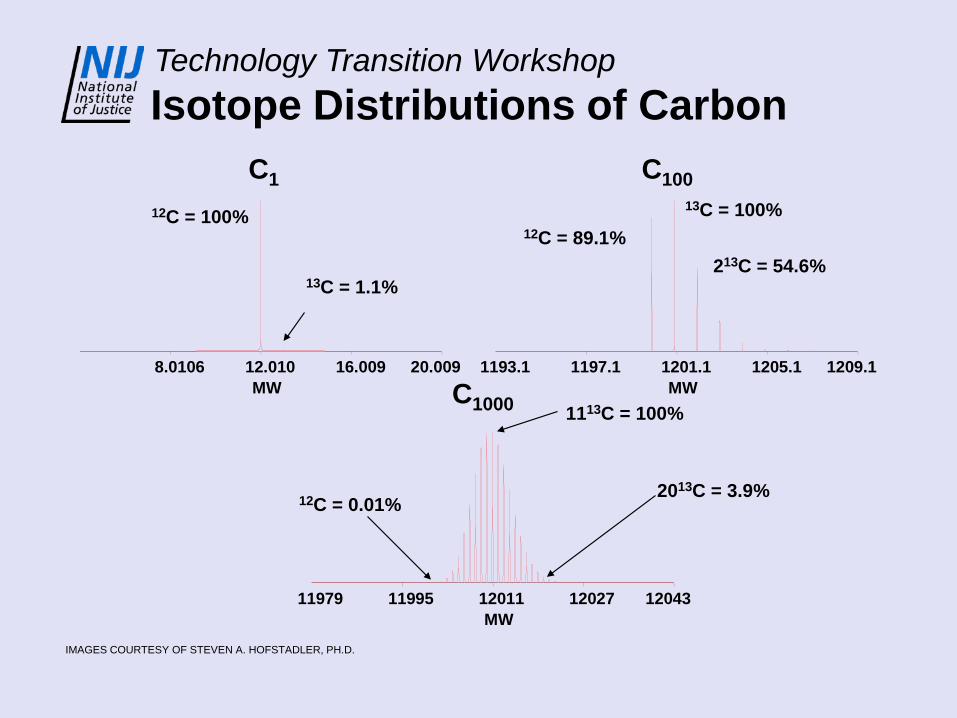
Technology Transition WorkshopIsotope Distributions of Carbon
8.0106 12.010 16.009 20.009
C1
MW1193.1 1197.1 1201.1 1205.1 1209.1
C100
MW
11979 11995 12011 12027 12043
C1000
MW
12C = 100%
13C = 1.1%
12C = 89.1%
13C = 100%
213C = 54.6%
12C = 0.01%
1113C = 100%
2013C = 3.9%
IMAGES COURTESY OF STEVEN A. HOFSTADLER, PH.D.
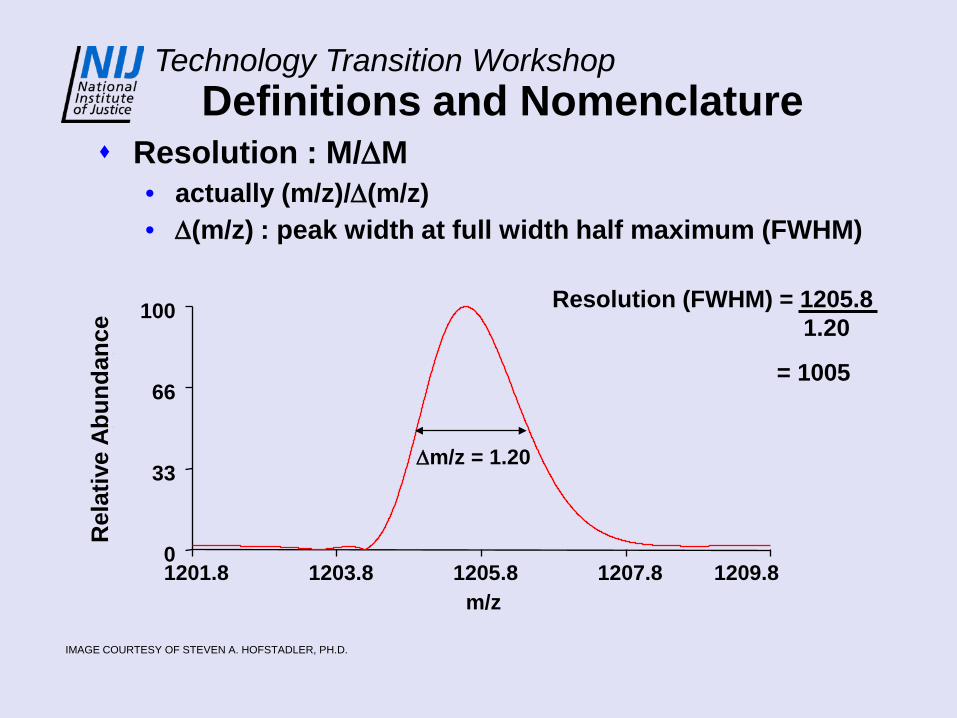
Technology Transition WorkshopDefinitions and Nomenclature
Resolution : M/∆M• actually (m/z)/∆(m/z)• ∆(m/z) : peak width at full width half maximum (FWHM)
0
33
66
100
1201.8 1203.8 1205.8 1207.8 1209.8m/z
r
t
∆m/z = 1.20
Rel
ativ
e Ab
unda
nce
Resolution (FWHM) = 1205.81.20
= 1005
IMAGE COURTESY OF STEVEN A. HOFSTADLER, PH.D.

Technology Transition Workshop
Definitions and Nomenclature Resolution (cont.)
• can be limited by the inherent width of the isotope envelope• step function to isotopic resolution
• need M/∆M > molecular weight for isotopic resolution
0
33
66
100
1201.8 1203.8 1205.8 1207.8 1209.8m/z
r
t
∆m/z = 0.12
Rel
ativ
e A
bund
ance
Resolution (FWHM) = 1205.240.12
= 10044
IMAGE COURTESY OF STEVEN A. HOFSTADLER, PH.D.

Technology Transition WorkshopDefinitions and Nomenclature:Mass Measurements3 ways to specify molecular weight
• Monoisotopic Molecular Weight– All 12C, 14N, 16O, etc.– most accurate method for low
MW species– monoisotopic peak is base peak
(i.e. most abundant peak) up toabout 2 kDa
• Average Molecular Weight– most commonly used– few MS platforms can resolve
isotopes for analytes > 5 kDa• ∆ between monoisotopic and
average increases with increasing MW
MWmi
MWave
IMAGES COURTESY OF STEVEN A. HOFSTADLER, PH.D.

Technology Transition WorkshopDefinitions and Nomenclature:Mass Measurements (cont.)3 ways to specify molecular weight
• Most Abundant Isotope Molecular Weight– not widely used– convenient for high MW, isotopically resolved
species
24622 24638 24654 24670 24686
C780 H981 N300 O478 P79
mass
MWmost abundant isotope
IMAGE COURTESY OF STEVEN A. HOFSTADLER, PH.D.

Technology Transition WorkshopDefinitions and Nomenclature
• Mass Measurement Accuracy|(m/z)theory - (m/z)measured|
(m/z)theory= Mass Measurement Error (ppm)
cmpd Mcalc Mmeas ∆m ppmC15H16F6N4O2 397.1105 397.1104 0.0001 0.25 C19H22N6O4 397.1630 397.1628 0.0002 0.50
397.13 397.18
C15H16F6N4O2397.1104
C19H22N6O4 397.1628
(M-H)-
M/∆M > 75,000
IMAGE COURTESY OF STEVEN A. HOFSTADLER, PH.D.

Technology Transition Workshop
Mass Spectrometry Nuts and Bolts
• Ionization Sources
• Mass Analyzers

Technology Transition Workshop
Ionization Sources• Ionization is the process by which analytes are
“charged”– Adding or removing electrons (e-) (MW = 0.0006 Da)– Adding or removing protons (H+) (MW = 1.0078 Da)
• Several very effective methods for ionizing low molecular weight and/or volatile compounds. Limited MS to analytes with molecular weights under ~1 kDa
• In the 1980’s, two ionization methods developed for ionizing high molecular weight analytes – MALDI & ESI
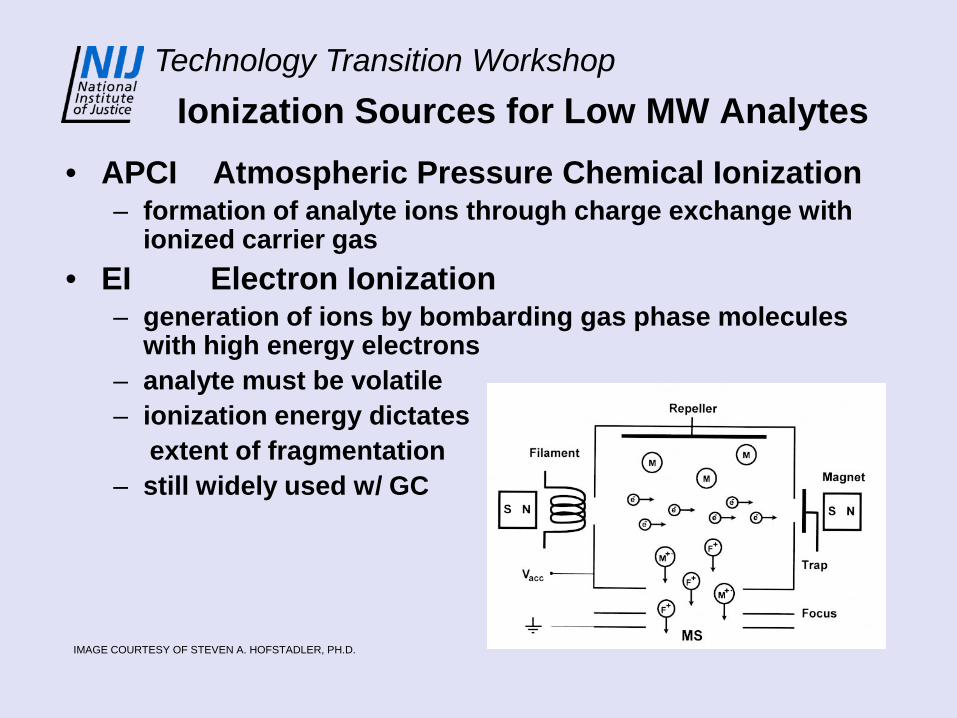
Technology Transition WorkshopIonization Sources for Low MW Analytes
• APCI Atmospheric Pressure Chemical Ionization– formation of analyte ions through charge exchange with
ionized carrier gas • EI Electron Ionization
– generation of ions by bombarding gas phase molecules with high energy electrons
– analyte must be volatile– ionization energy dictates
extent of fragmentation– still widely used w/ GC
IMAGE COURTESY OF STEVEN A. HOFSTADLER, PH.D.

Technology Transition Workshop
laser
Ionization Sources - MALDI• Matrix Assisted Laser Desorption Ionization
– Sample is co-crystallized with a matrix which absorbs photons and creates a desorption plume that ionizes the sample
– Gentle ionization technique (harsher than ESI)– A pulsed ion source– Produces singly charge ions– Relatively salt tolerant– Effective for wide range of MW’s– Fast and automatable
IMAGES COURTESY OF STEVEN A. HOFSTADLER, PH.D.

Technology Transition WorkshopIonization Sources - ESI
• Electrospray Ionization– Ions are desolvated/desorbed from highly charged liquid droplets – Generates multiple charge states of large analytes
• results in “folded-over” spectra which can be recorded over narrower m/zrange
– Very soft ionization technique• applicable to labile molecules and noncovalent complexes
– Low tolerance for nonvolatile salts, buffer additives, and detergents• rigorous sample clean-up required for some applications
– High sensitivity• applicable to analyte concentrations < 100 nM
IMAGE COURTESY OF STEVEN A. HOFSTADLER, PH.D.

Technology Transition WorkshopA Negative Ionization Mode ESI Mass Spectrumof a Low MW Analyte: Singly Charged Spectrum
Well A03Q:\roboticsdata\archive\completed\P00005666\3\acqus
477.07 587.09 708.52 841.36 985.6 1141.25 1308.3 1486.76 1676.63 1877.9 2090.58
m/z
0.00
4648
9296
13944
18592
m/z = 1347.10
MW = 1347.10 + MWproton= 1348.11 Da
IMAGE COURTESY OF STEVEN A. HOFSTADLER, PH.D.
(M-H+)1-
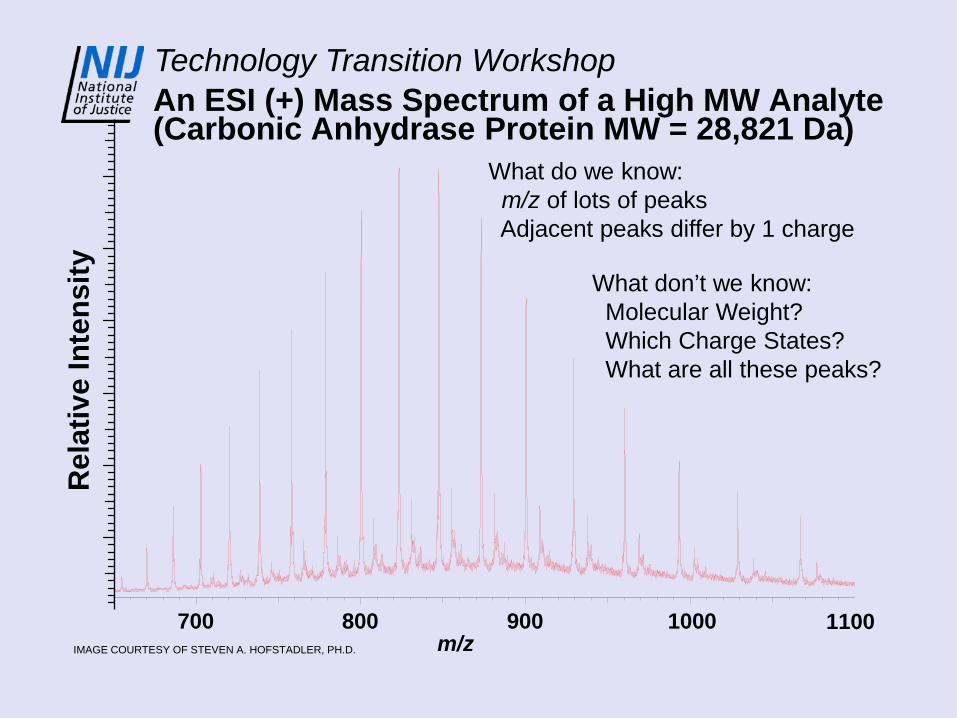
Technology Transition WorkshopAn ESI (+) Mass Spectrum of a High MW Analyte(Carbonic Anhydrase Protein MW = 28,821 Da)
What don’t we know:Molecular Weight?Which Charge States?What are all these peaks?
What do we know:m/z of lots of peaksAdjacent peaks differ by 1 charge
700 800 900 1000m/z
1100
Rel
ativ
e In
tens
ity
IMAGE COURTESY OF STEVEN A. HOFSTADLER, PH.D.

Technology Transition WorkshopConventional “Deconvolution” of ESI-MS Spectrum
700 800 900 1000m/z 1100
Rel
ativ
e In
tens
ity•From m/z of peaks and ∆z, calculate z of one peak.
961.7 = m/z1
994.8 = m/z2
m/z1 – m/z2
m/z2 = z1
33.1
994.8= z1= 30
IMAGE COURTESY OF STEVEN A. HOFSTADLER, PH.D.

Technology Transition Workshop
700 800 900 1000m/z
1100
Rel
ativ
e In
tens
ity
961.7 (M+30H+)30+
MW = (961.7 x 30) – (30 x 1.0078)= 28,821 Da
accuracy improved by averaging across multiple (all) charge states
Conventional “Deconvolution” of ESI-MS Spectrum•Use z and m/z to calculate mass
IMAGE COURTESY OF STEVEN A. HOFSTADLER, PH.D.

Technology Transition Workshop
ESI-MS of DNA• Phosphodiester backbone is
easily deprotonated at high pH• ESI most effective in negative
mode (in positive ionization mode basic groups on bases are protonated)
• Both backbone and nucleobase linkages to sugar are relatively labile
• We have optimized solution and interface conditions for DNA analysis by mass spectrometry over the past 10 years
HO
N
NN
N
NH2
O
HO
HH
HH
PO
O
O-
N
NH2
ON
O
HO
HH
HH
PO
O
O-
NH
N
N
O
NH2N
O
H
HH
HHO
PO
O-
O-
IMAGE COURTESY OF STEVEN A. HOFSTADLER, PH.D.

Technology Transition WorkshopThen and Now…
•Then (1981)• Pre-contributions of Fenn, Tanaka, Hillenkamp/Karas
• 20-mer DNA• Cf252 desorption - TOF• M/∆M ~ 25• MW = 6301 + 5 (~ 800 ppm)
•Now• Additional contributions from Marshall, McLafferty, McLuckey, Smith and others
• 120-mer DNA acquired in fully automated modality
• ESI-FTICR• M/∆M = 150,000• MW = 37,091.18 + 0.04
•~ 1 ppm
1001.0 1002.0 1003.0 1004.0
(M-37H+)37-
900 1000 1100m/z
1200
*
43-
41-
39- 37-35-
33-
31-
IMAGES COURTESY OF STEVEN A. HOFSTADLER, PH.D.

Technology Transition WorkshopAn ESI Mass Spectrum of a PCR Productdoublet peaks at each charge state correspond to forward and reverse strands of amplicon
800 900 1000 1100 1200 1300m/z
33- 31-
29-
27-
25-
35-
37-
39-
41-
800 900 1000 1100 1200 1300m/z
33- 31-
29-
27-
25-
35-
37-
39-
41-
IMAGE COURTESY OF STEVEN A. HOFSTADLER, PH.D.

Technology Transition Workshop“Raw” ESI-MS spectrum from 3-plex PCR mix
Internal mass
calibrant
Internal mass
calibrant
Internal mass calibrants bracket the spectrum for accurate
calibration of the measurements before deconvolution
IMAGE COURTESY OF STEVEN A. HOFSTADLER, PH.D.

Technology Transition WorkshopDeconvolved ESI-MS spectrum from 3-plex PCR
30,000 32,000 34,000 36,000 38,000 40,000 42,000 44,000
0
1000
2000
3000
4000
5000
6000
Mass (Da)
Sign
al in
tens
ity
3285
5.1
3414
3.8
3705
8.2
3725
4.2
4216
2.1
4271
0.3
IMAGE COURTESY OF STEVEN A. HOFSTADLER, PH.D.

Technology Transition WorkshopMasses to Base Composition
Requires 25 ppm mass measurement error
Math takes into accountWatson-Crick base pairing
IMAGE COURTESY OF STEVEN A. HOFSTADLER, PH.D.
© Microsoft Media Elements
© Microsoft Media Elements© Microsoft Media Elements
Technology Transition WorkshopMasses to Base Composition
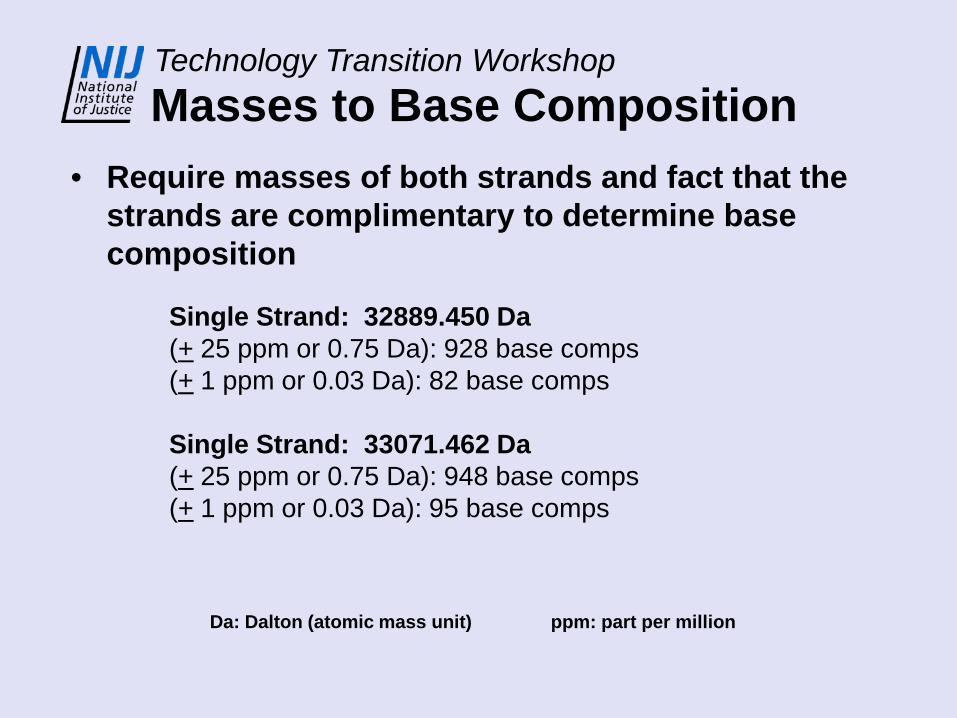
• Require masses of both strands and fact that the strands are complimentary to determine base composition
Single Strand: 32889.450 Da(+ 25 ppm or 0.75 Da): 928 base comps(+ 1 ppm or 0.03 Da): 82 base comps
Single Strand: 33071.462 Da(+ 25 ppm or 0.75 Da): 948 base comps(+ 1 ppm or 0.03 Da): 95 base comps
ppm: part per millionDa: Dalton (atomic mass unit)

Technology Transition WorkshopExact Mass Measurements of Both Strands Facilitates Unambiguous Base Composition Determination
ppm0-2550100250500
# comp pairs1
1366378
1447
AwGxCyTz
AzGyCxTwIMAGE COURTESY OF IBIS BIOSCIENCES, INC.

Technology Transition WorkshopMass Measurement and the “Canadian Nickel”
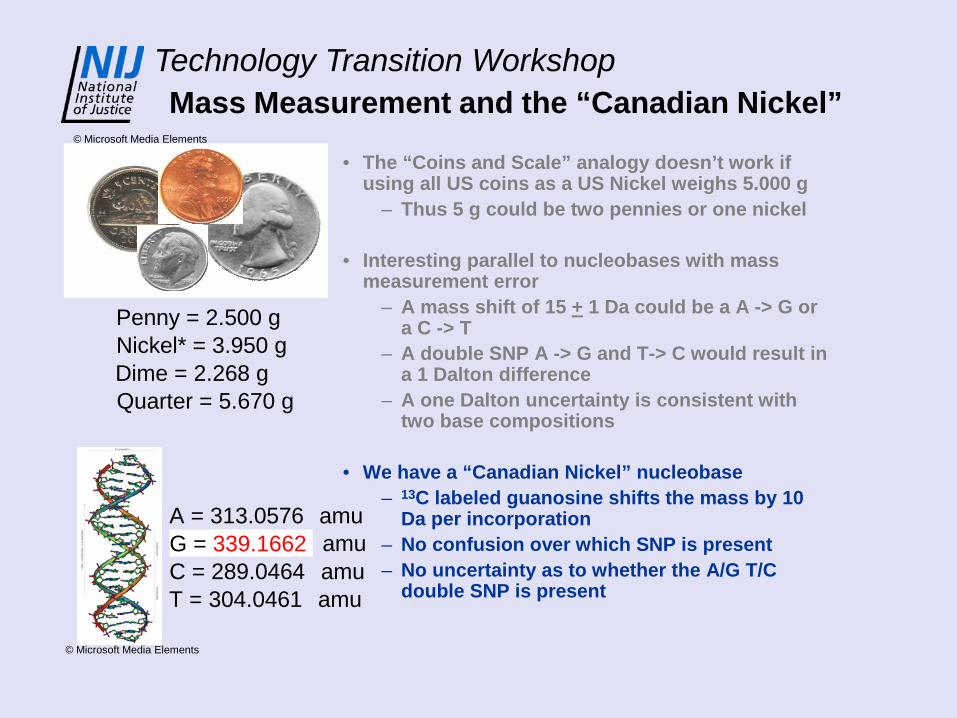
Penny = 2.500 gNickel* = 3.950 gDime = 2.268 gQuarter = 5.670 g
A = 313.0576 amuG = 329.0526 amuC = 289.0464 amuT = 304.0461 amu
• The “Coins and Scale” analogy doesn’t work if using all US coins as a US Nickel weighs 5.000 g
– Thus 5 g could be two pennies or one nickel
• Interesting parallel to nucleobases with mass measurement error
– A mass shift of 15 + 1 Da could be a A -> G or a C -> T
– A double SNP A -> G and T-> C would result in a 1 Dalton difference
– A one Dalton uncertainty is consistent with two base compositions
© Microsoft Media Elements
© Microsoft Media Elements
Technology Transition WorkshopMass Measurement and the “Canadian Nickel”
Penny = 2.500 gNickel* = 3.950 gDime = 2.268 gQuarter = 5.670 g
A = 313.0576 amuG = 329.0526 amuC = 289.0464 amuT = 304.0461 amu
• The “Coins and Scale” analogy doesn’t work if using all US coins as a US Nickel weighs 5.000 g
– Thus 5 g could be two pennies or one nickel
• Interesting parallel to nucleobases with mass measurement error
– A mass shift of 15 + 1 Da could be a A -> G or a C -> T
– A double SNP A -> G and T-> C would result in a 1 Dalton difference
– A one Dalton uncertainty is consistent with two base compositions
• We have a “Canadian Nickel” nucleobase– 13C labeled guanosine shifts the mass by 10
Da per incorporation– No confusion over which SNP is present– No uncertainty as to whether the A/G T/C
double SNP is present
G = 339.1662
© Microsoft Media Elements
© Microsoft Media Elements

Technology Transition Workshop
881.5 883.14 884.79 886.43 888.08 889.73 891.38 893.03 894.69 896.34 898m/z
A48 G18 C31 T40
A47 G19 C32 T39
42030.19 Da42478.39 Da
42031.18 Da42479.38 Da
Without mass tag:Product strands differ by 1 Da for two products that differ by a GA and CT SNP at the same time.
Some double SNPs cause small mass differences
High mass precision and mass tag combine to provide unambiguous base compositions in routine operation
© Microsoft Media Elements
IMAGE COURTESY OF STEVEN A. HOFSTADLER, PH.D.

Technology Transition Workshop
With mass tag:With 13C-dGTP, the mass separation increases to ~10 Da for each strand
Corresponding untagged peaks=
881.5 883.14 884.79 886.43 888.08 889.73 891.38 893.03 894.69 896.34 898m/z
A48 G18 C31 T40
A47 G19 C32 T39
42187.02 Da42694.04 Da
42197.81 Da42704.83 Da
Mass tag increases mass separation for these SNPs
IMAGE COURTESY OF STEVEN A. HOFSTADLER, PH.D.
© Microsoft Media Elements
Technology Transition Workshop
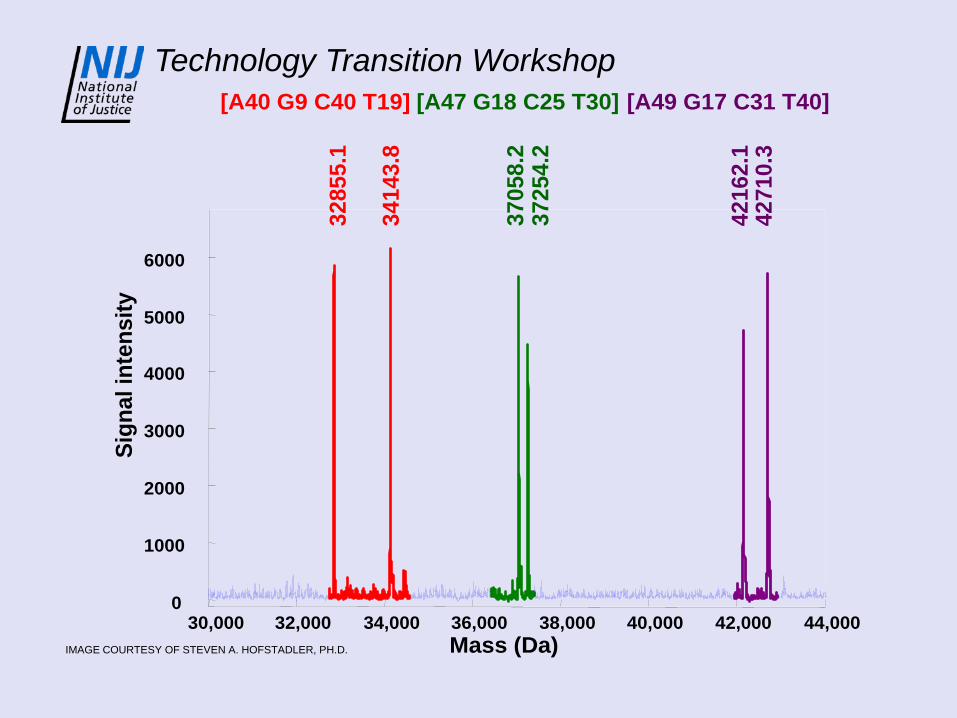
30,000 32,000 34,000 36,000 38,000 40,000 42,000 44,0000
1000
2000
3000
4000
5000
6000
Mass (Da)
Sign
al in
tens
ity
3285
5.1
3414
3.8
[A40 G9 C40 T19]
3705
8.2
3725
4.2
[A47 G18 C25 T30]
4216
2.1
4271
0.3
[A49 G17 C31 T40]
IMAGE COURTESY OF STEVEN A. HOFSTADLER, PH.D.
Technology Transition Workshop
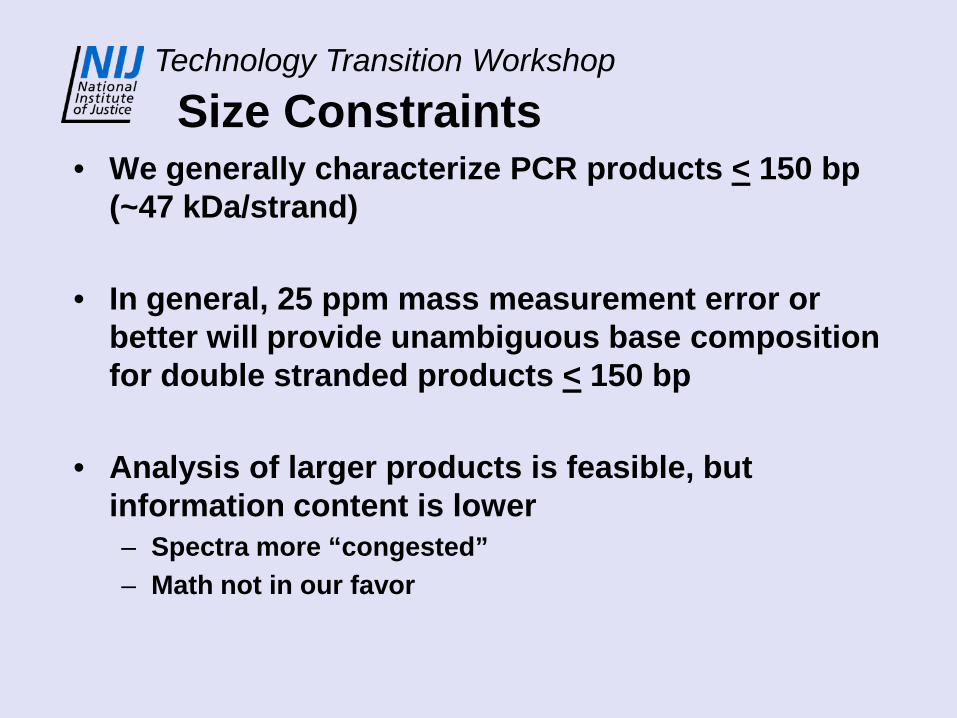
Size Constraints• We generally characterize PCR products < 150 bp
(~47 kDa/strand)
• In general, 25 ppm mass measurement error or better will provide unambiguous base composition for double stranded products < 150 bp
• Analysis of larger products is feasible, but information content is lower– Spectra more “congested”– Math not in our favor

Technology Transition Workshop299 bp PCR product on ESI-TOF (well 9/24)
700 900 1100 1300 1500 1700 1900 m/z
2000
4000
6000
8000
10000
12000
a.i.
91000 92000 93000 94000 mass
Meas. MWave = 91009.4Theo. MWave = 91008.7ppm error = 7.7 Meas. MWave = 93601.9
Theo. MWave = 93601.0ppm error = 9.6
(M-100H+)100-
IMAGE COURTESY OF STEVEN A. HOFSTADLER, PH.D.
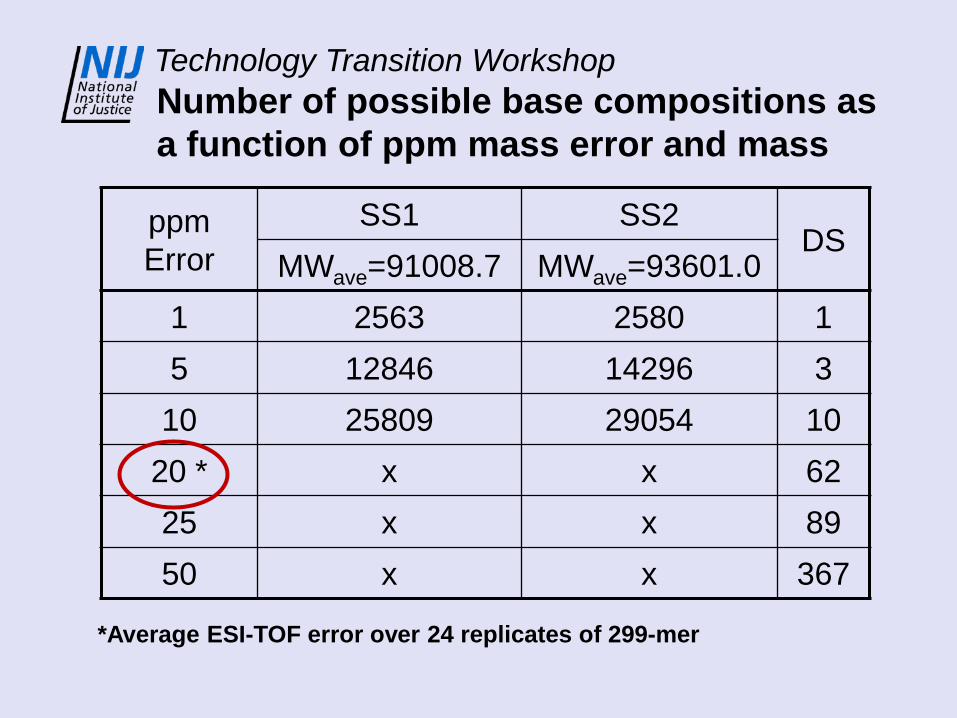
Technology Transition WorkshopNumber of possible base compositions as a function of ppm mass error and mass
ppm Error
SS1 SS2DS
MWave=91008.7 MWave=93601.01 2563 2580 15 12846 14296 310 25809 29054 10
20 * x x 6225 x x 8950 x x 367
*Average ESI-TOF error over 24 replicates of 299-mer
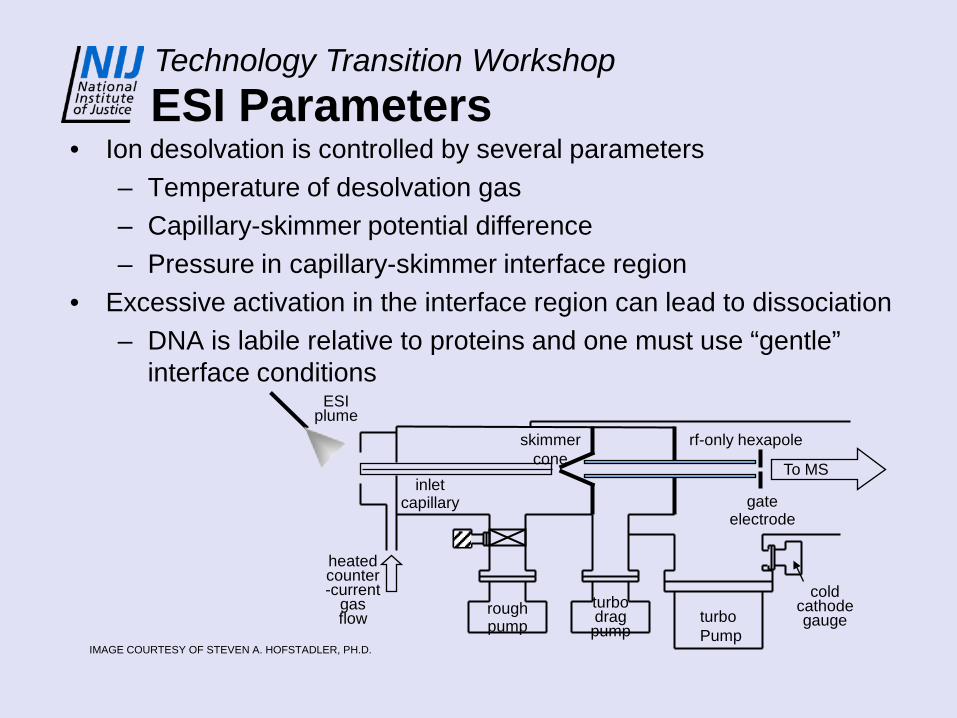
Technology Transition WorkshopESI Parameters
• Ion desolvation is controlled by several parameters– Temperature of desolvation gas– Capillary-skimmer potential difference– Pressure in capillary-skimmer interface region
• Excessive activation in the interface region can lead to dissociation– DNA is labile relative to proteins and one must use “gentle”
interface conditions
skimmercone
rf-only hexapole
gateelectrode
inletcapillary
turboPump
ESIplume
roughpump
turbodragpump
coldcathodegauge
heatedcounter-current
gas flow
To MS
IMAGE COURTESY OF STEVEN A. HOFSTADLER, PH.D.

Technology Transition WorkshopSolution/Desolvation Conditions(same sample analyzed under different source conditions)
ESI-TOFPCR product from E. Colidetected as single strands
ESI-TOFPCR product from E. Colidetected as intact duplex
IMAGES COURTESY OF STEVEN A. HOFSTADLER, PH.D.

Technology Transition WorkshopEffect of Capillary-Skimmer Potential Difference20-mer phosphorothioate oligonucleotide
(M-6H+)6-
(M-4H+)4-(M-8H+)8-
(M-6H+)6-
(M-4H+)4-(M-8H+)8-
500 700 900 1100 1300 1500m/z
1700500 700 900 1100 1300 1500m/z
1700
w3(1-)
a4-base(1-)
a4(1-)
w3-A-H2O(1-)
a3-base(1-)
Vcap = -54 V
Vcap = -128 V
IMAGES COURTESY OF STEVEN A. HOFSTADLER, PH.D.

Technology Transition WorkshopSalt is a Killer…
• Nonvolatile counterions (e.g. Na+, K+, Mg2+, etc) are not removed during desolvation– High concentrations can preclude the generation of a
stable ESI plume
• Oligonucleotides are more vulnerable to contamination than proteins– Phosphodiester backbone is highly anionic– Larger oligonucleotides more salt intolerant than smaller
ones
• Effects of salt can be partially mitigated by choice of buffers– See Griffey et al. RCMS 1995; 9; 97-102.
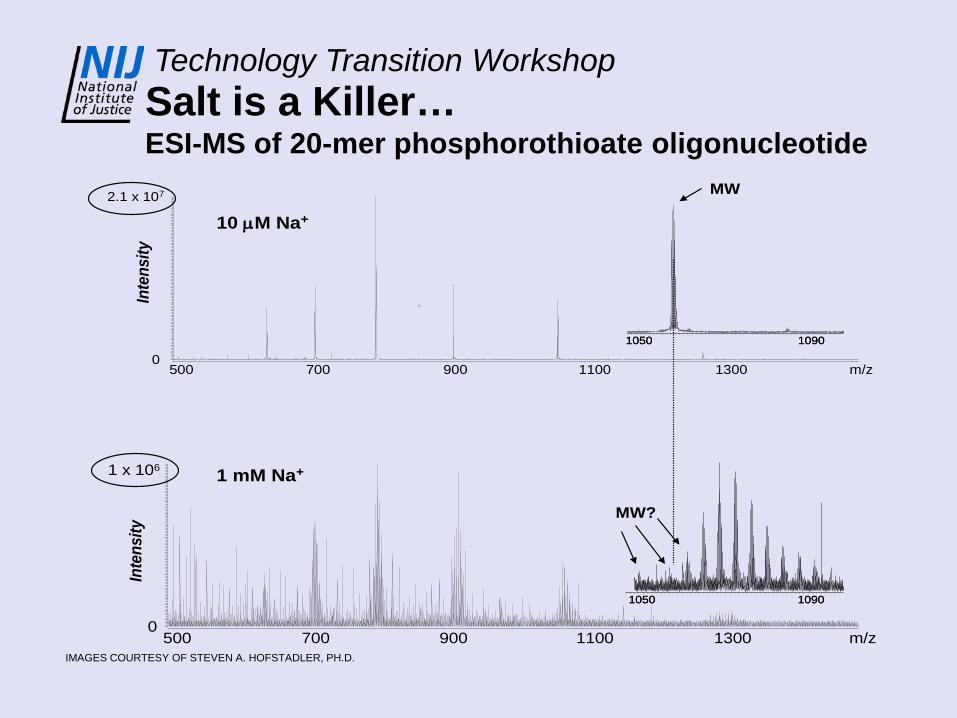
Technology Transition WorkshopSalt is a Killer…ESI-MS of 20-mer phosphorothioate oligonucleotide
500 700 900 1100 1300 m/z0
1 x 10⁶
500 700 900 1100 1300 m/z0
2.1 x 10⁷
Inte
nsity
Inte
nsity
1 mM Na+
10 µM Na+
1050 10901050 1090
1050 10901050 1090
MW?
MW
IMAGES COURTESY OF STEVEN A. HOFSTADLER, PH.D.

Technology Transition WorkshopComparison of raw data for adducted vs.
non-adducted mass spectrum
Well F01Q:\roboticsdata\archive\completed\P00005563\61\acqus
865 870.52 876.06 881.62 887.19 892.78 898.39 904.02 909.66 915.32 921
m/z0.00
16545.5
33091
49636.5
66182
Well F12Q:\roboticsdata\archive\completed\P00005563\72\acqus
865 870.52 876.06 881.62 887.19 892.78 898.39 904.02 909.66 915.32 921
m/z
9635.5
19271
28906.5
38542
48177.5
57813
67448.5
77084
Adducted
Not adducted
IMAGES COURTESY OF STEVEN A. HOFSTADLER, PH.D.
Technology Transition Workshop
Mass Analyzers• All work by measuring the response of charged
particles to electric and/or magnetic fields
• All work at reduced pressure to reduce ion-neutral collisions– Want to minimize scatter and/or neutralization– Typical operating pressures
• Linear quadrupoles ~ 5 x 10⁻⁵ torr• FTICR < 10-9 torr• TOF 10-5 – 10-7 torr

Technology Transition WorkshopHighlights of TOF-MS
• Advantages:– Simple and rugged benchtop construction– Theoretically unlimited mass range– Adaptable to many ionization sources– Fast acquisition - signal averaging to improve S/N– Mass accuracy rivals that of FTICR
• Disadvantages:– Limited resolution
• Theoretically limited to detection electronics• Practically limited by energy and spatial spreads in ions
– TOF is inherently pulsed• Must wait for longest flight time ions before sending next packet of
ions (Hz to kHz typical repetition rates)• Cannot simultaneously measure all m/z values
– This is mitigated by external ion accumulation

Technology Transition WorkshopTime-of-flight (TOF) Mass Analyzers
• Ions are accelerated by electric field (V/d)• Ions then drift at their final velocity for a fixed distance• Ions impact a detector and their flight time is recorded
– flight time is • proportional to velocity• proportional to the square root of m/z
dVvzmmvEK /
21
21..
22 =
⇒=
t = L/ν = L m/2zV
t: sec L: meters ν: velocity m: kg z: Coulombs V: voltslower m/z ions reach higher velocity than higher m/z ions
where ν is velocity, V/d is field strength
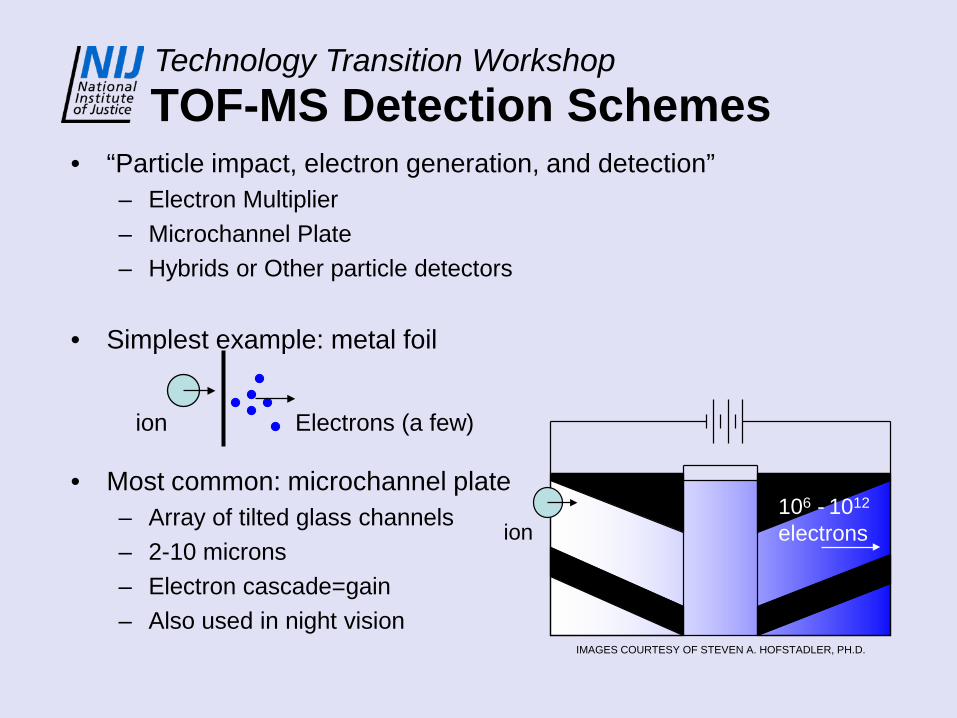
Technology Transition WorkshopTOF-MS Detection Schemes
• “Particle impact, electron generation, and detection”– Electron Multiplier– Microchannel Plate– Hybrids or Other particle detectors
• Simplest example: metal foil
• Most common: microchannel plate– Array of tilted glass channels – 2-10 microns– Electron cascade=gain– Also used in night vision
ion Electrons (a few)
ion106 - 1012
electrons
IMAGES COURTESY OF STEVEN A. HOFSTADLER, PH.D.
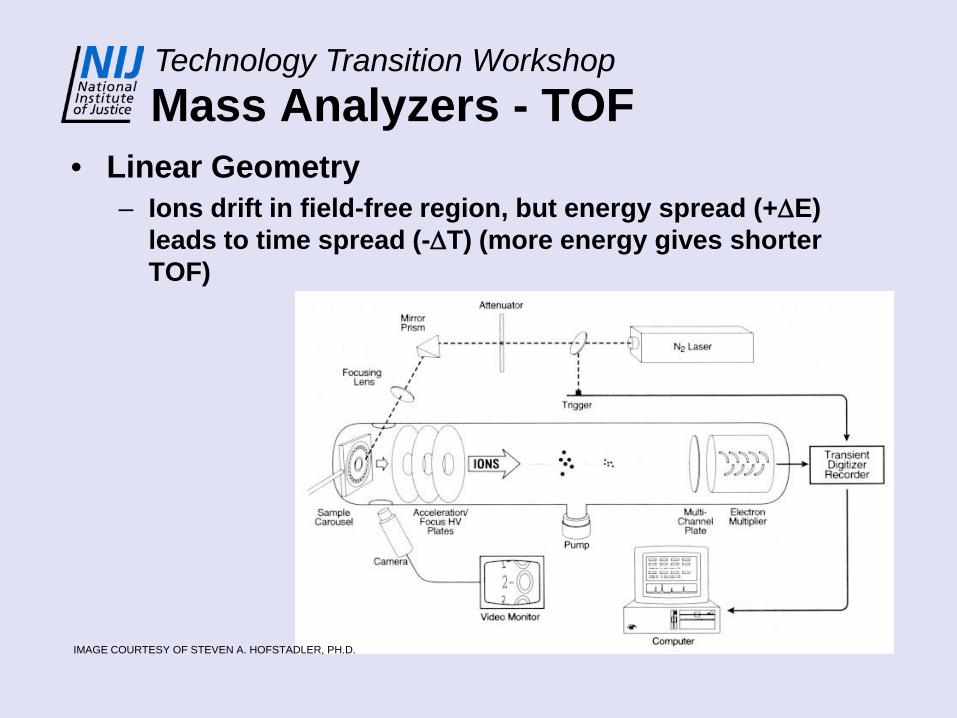
Technology Transition WorkshopMass Analyzers - TOF
• Linear Geometry– Ions drift in field-free region, but energy spread (+∆E)
leads to time spread (-∆T) (more energy gives shorter TOF)
IMAGE COURTESY OF STEVEN A. HOFSTADLER, PH.D.

Technology Transition WorkshopMass Analyzers - TOF
• Reflectron– Ions drift, but at ion mirror they turn around– +∆E (energy spread) leads to deeper penetration in ion
mirror– Linear config: +∆E leads to -∆T– Reflectron config: +∆E leads to -∆T+∆T (=0; energy spread
eliminated at detector)
Diagram for single m/z ion withenergy difference
E+∆E
IMAGE COURTESY OF STEVEN A. HOFSTADLER, PH.D.

Technology Transition WorkshopESI with an External Ion Reservoir
• ESI is a continuous ionization source while most MS platforms are most effectively coupled to pulsed sources
• Couple external ion reservoir with ESI to make a pulsed ionization source
• Nearly 100% ionization duty cycle– Ions are externally accumulated while others are being mass
analyzed
skimmercone
rf-only hexapole
gateelectrode
inletcapillary
turboPump
ESIplume
roughpump
turbodragpump
coldcathodegauge
heatedcounter-currentgas flow
To MS
skimmercone
rf-only hexapole
gateelectrode
inletcapillary
turboPump
ESIplume
roughpumproughpump
turbodragpump
coldcathodegauge
heatedcounter-currentgas flow
To MS
IMAGE COURTESY OF STEVEN A. HOFSTADLER, PH.D.

Technology Transition WorkshopMass Spectrometry and T5000
Profile 1
Profile 2
Profile 3
Forensic profile compared with existing database entries, or used to populate database
IMAGE COURTESY OF STEVEN A. HOFSTADLER, PH.D.

Technology Transition WorkshopConclusions
• In general, mass spectrometry is used to “weigh” molecular analytes of interest
• Electrospray ionization is employed as it can promote large, intact oligonucleotides into the gas phase
• Time-of-Flight mass spectrometry is used as it provides accurate molecular weight measurements in a robust, benchtop, instrument format
• As part of the Ibis process, amplified DNA is “weighed” with enough accuracy to unambiguously determine base composition [AGCT]
• Base composition profiles can be compared to other profiles and/or databases

Technology Transition Workshop
Abbreviations and JargonAPCI atmospheric pressure chemical ionization
bp base pair(s)
CAD collisionally activated dissociation
Da Dalton = atomic mass unit
DNA deoxyribonucleic acid
Ds double stranded (DNA)
EI electron impact (ionization)
ESI electrospray ionization
FAB fast atom bombardment
FD field desorption (ionization)
FI field ionization
FTICR Fourier transform ion cyclotron resonance
FTMS Fourier transform mass spectrometry
FWHM full width half maximum (used to specify resolution)
GC gas chromatography
Hz Hertz (cycles/second)
IRMPD infrared multiphoton dissociation
kDa kilo Dalton(s)
m/∆m mass divided by peak width (mass resolution)
m/z mass to charge ratio
MALDI matrix assisted laser desorption ionization
MSAD multipole storage assisted dissociation
mtDNA mitochondrial deoxyribonucleic acid
MW molecular weight
PCR polymerase chain reaction
PD plasma desorption
ppm parts per million
QIT quadrupole ion trap
Q-TOF quadrupole-time-of-flight
rf radio frequency
SIMS secondary ion mass spectrometry
ss single stranded (DNA)
TOF time-of-flight
TSP thermospray (ionization)
Technology Transition Workshop
Contact Information:
Steven A. Hofstadler, Ph.D.Ibis Biosciences, Inc.Email: [email protected]


![Biological Mass Spectrometry [Methods in Enzymology 402] - A. Burlingame (AP, 2005) WW](https://img.dokumen.tips/doc/110x75/613cacbba3339922f86ec552/biological-mass-spectrometry-methods-in-enzymology-402-a-burlingame-ap-2005.jpg)