Embed Size (px)
Citation preview
1
_________________________________________________Applied Business Improvement
All Rights Reserved , ABI Associates, 2005
Introduction to ABI and
Statgraphics Centurion
2
_________________________________________________Applied Business Improvement
All Rights Reserved , ABI Associates, 2005
Statgr
aphic
s
Centu
rion
Enabled Teams
$
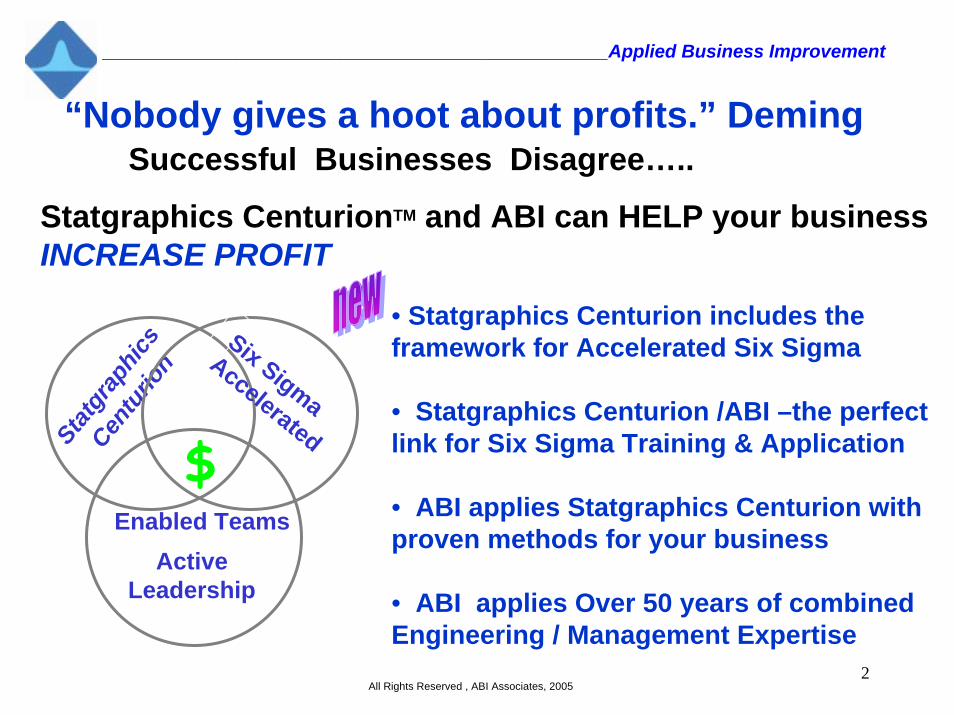
• Statgraphics Centurion includes the framework for Accelerated Six Sigma
• Statgraphics Centurion /ABI –the perfect link for Six Sigma Training & Application
• ABI applies Statgraphics Centurion with proven methods for your business
• ABI applies Over 50 years of combined Engineering / Management Expertise
“Nobody gives a hoot about profits.” DemingSuccessful Businesses Disagree…..
Statgraphics CenturionTM and ABI can HELP your business INCREASE PROFIT
Six Sigma
Accelerated
ActiveLeadership
3
_________________________________________________Applied Business Improvement
All Rights Reserved , ABI Associates, 2005
What is Six Sigma?
4
_________________________________________________Applied Business Improvement
All Rights Reserved , ABI Associates, 2005
What is Six Sigma?
• Sigma represents a unit of measurement that designates the distribution or spread about the average of a process to represent how well a process is performing.
• The higher the sigma value, the less variation and fewer defects will reach the customer
• When a company has achieved a six sigma rate of improvement, it has limited defects to 3.4 per million opportunities – virtual defect-free performance.
• The DMAIC Six Sigma Process of Problem Solutionis a natural fit for Statgraphics Centurion
5
_________________________________________________Applied Business Improvement
All Rights Reserved , ABI Associates, 2005
Six Sigma is ….
….an Improvement System Focusedon Driving Business Success
• Customer focused business strategy
• A disciplined data-driven approach for eliminating defects
• A statistical measurement - 3.4 DPMO
• A dedication to meeting customer requirements
• A philosophy, culture change for greater customer
satisfaction
6
_________________________________________________Applied Business Improvement
All Rights Reserved , ABI Associates, 2005
How does Six Sigma work?
An approach and set of tools for the Team to follow when improving/designing a processor product based on Statistical Data from theVoice of the Customer
Key to successful Implementation: Statgraphics Centurion
7
_________________________________________________Applied Business Improvement
All Rights Reserved , ABI Associates, 2005
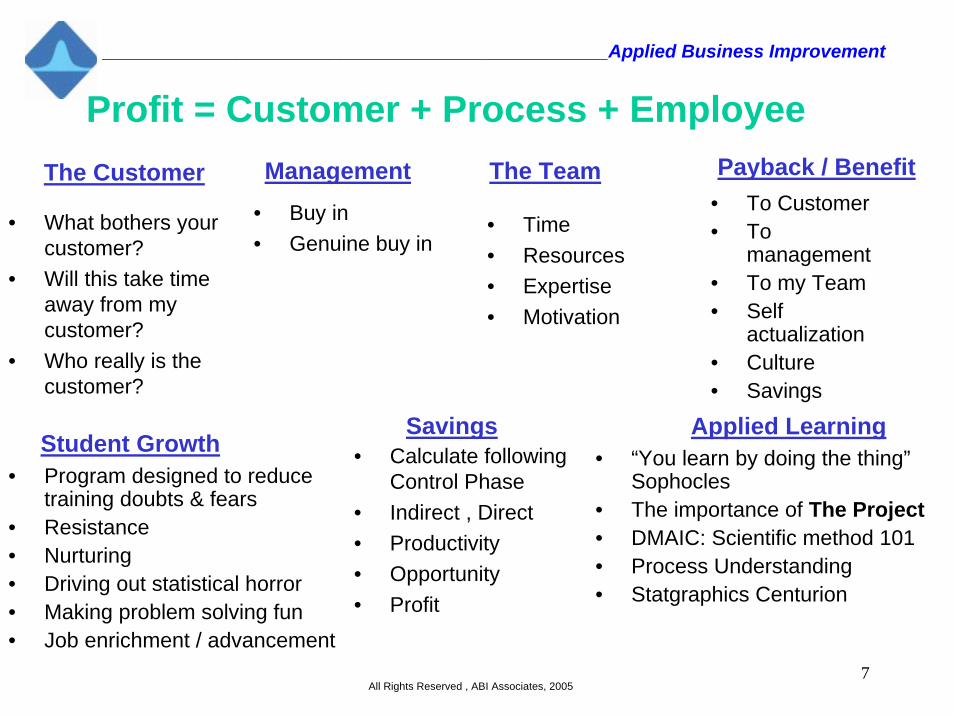
The Customer
• What bothers your customer?
• Will this take time away from my customer?
• Who really is the customer?
The Team
• Time• Resources • Expertise• Motivation
Management• Buy in• Genuine buy in
Payback / Benefit• To Customer• To
management• To my Team• Self
actualization• Culture • Savings
Student Growth• Program designed to reduce
training doubts & fears• Resistance• Nurturing • Driving out statistical horror• Making problem solving fun• Job enrichment / advancement
Savings• Calculate following
Control Phase• Indirect , Direct• Productivity• Opportunity• Profit
Applied Learning• “You learn by doing the thing”
Sophocles• The importance of The Project• DMAIC: Scientific method 101 • Process Understanding• Statgraphics Centurion
Profit = Customer + Process + Employee
8
_________________________________________________Applied Business Improvement
All Rights Reserved , ABI Associates, 2005
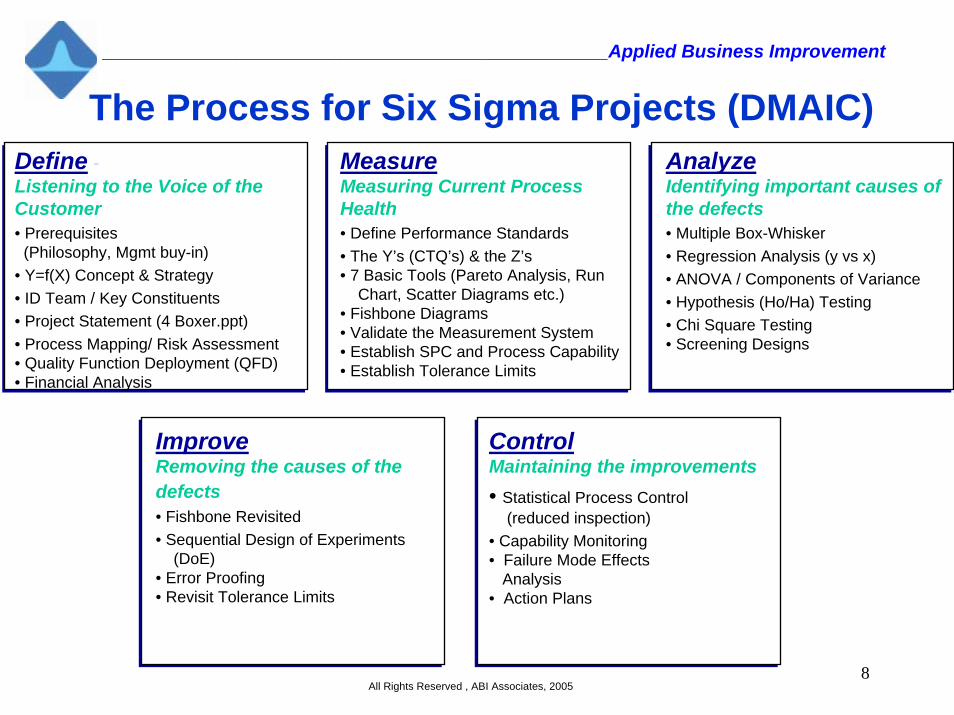
The Process for Six Sigma Projects (DMAIC)Define -Listening to the Voice of the Customer• Prerequisites
(Philosophy, Mgmt buy-in)• Y=f(X) Concept & Strategy• ID Team / Key Constituents • Project Statement (4 Boxer.ppt)• Process Mapping/ Risk Assessment• Quality Function Deployment (QFD)• Financial Analysis
MeasureMeasuring Current Process Health• Define Performance Standards• The Y’s (CTQ’s) & the Z’s• 7 Basic Tools (Pareto Analysis, Run
Chart, Scatter Diagrams etc.)• Fishbone Diagrams• Validate the Measurement System • Establish SPC and Process Capability• Establish Tolerance Limits
AnalyzeIdentifying important causes of the defects• Multiple Box-Whisker• Regression Analysis (y vs x)• ANOVA / Components of Variance• Hypothesis (Ho/Ha) Testing• Chi Square Testing• Screening Designs
ImproveRemoving the causes of the defects• Fishbone Revisited• Sequential Design of Experiments
(DoE)• Error Proofing• Revisit Tolerance Limits
ControlMaintaining the improvements• Statistical Process Control
(reduced inspection)• Capability Monitoring• Failure Mode Effects
Analysis• Action Plans
9
_________________________________________________Applied Business Improvement
All Rights Reserved , ABI Associates, 2005
Let’s look at a sampling of Six Sigma tools found in Statgraphics Centurion
10
_________________________________________________Applied Business Improvement
All Rights Reserved , ABI Associates, 2005
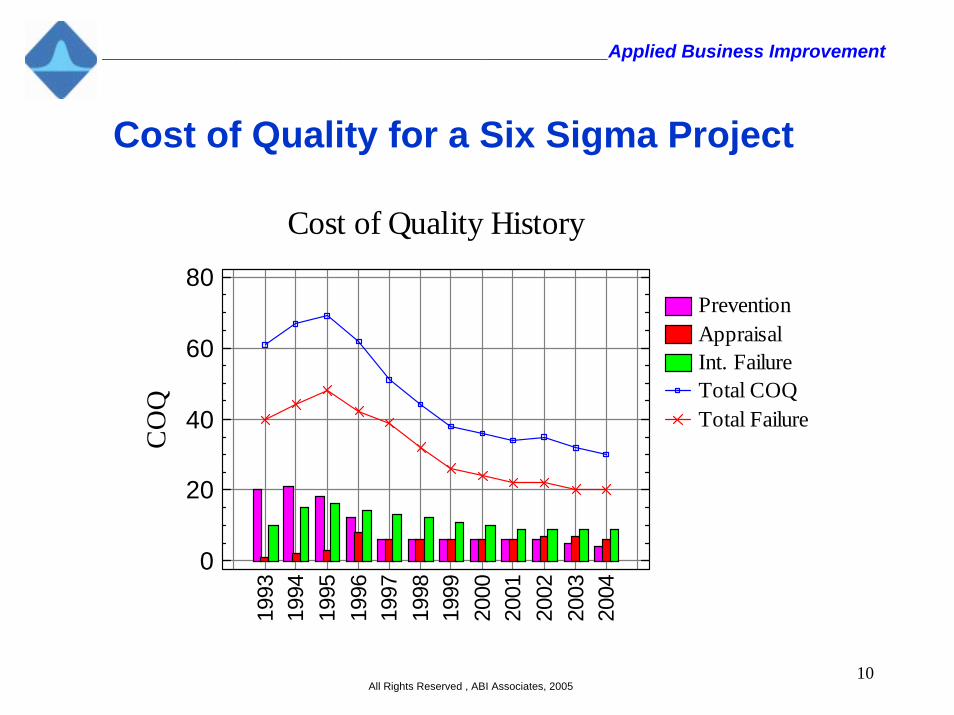
Cost of Quality for a Six Sigma Project
Cost of Quality History
CO
Q
PreventionAppraisalInt. FailureTotal COQTotal Failure
1993
1994
1995
1996
1997
1998
1999
2000
2001
2002
2003
2004
0
20
40
60
80
11
_________________________________________________Applied Business Improvement
All Rights Reserved , ABI Associates, 2005
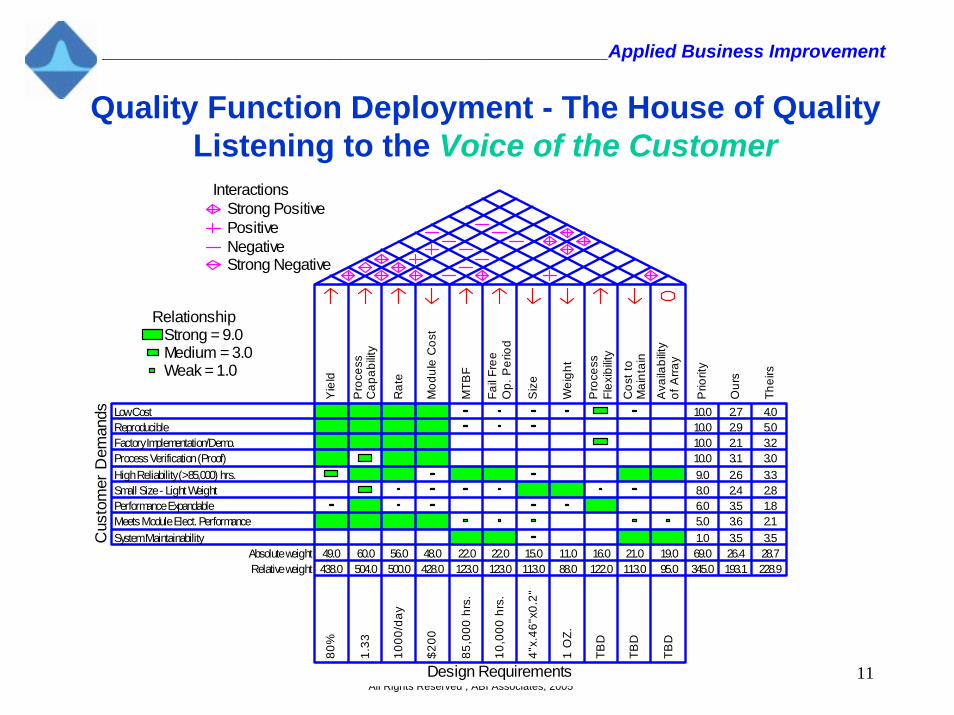
Quality Function Deployment - The House of QualityListening to the Voice of the Customer
Low Cost Reproducible Factory Implementation/Demo. Process Verification (Proof) High Reliability (>85,000) hrs. Small Size - Light Weight Performance Expandable Meets Module Elect. Performance System Maintainability
Yie
ld
49.0438.0
Pro
cess
Cap
abilit
y
60.0504.0
Rat
e
56.0500.0
Mod
ule
Cos
t
48.0428.0
MTB
F
22.0123.0
Fai
l Fre
e O
p. P
erio
d
22.0123.0
Siz
e
15.0113.0
Wei
ght
11.088.0
Pro
cess
Fle
xibi
lity
16.0122.0
Cos
t to
Mai
ntai
n
21.0113.0
Ava
ilabi
lity
of A
rray
19.095.0
Prio
rity
10.010.010.010.09.08.06.05.01.069.0345.0
Our
s
2.72.92.13.12.62.43.53.63.526.4193.1
The
irs
4.05.03.23.03.32.81.82.13.528.7228.9
80%
1.3
3
100
0/da
y
$20
0
85,
000
hrs.
10,
000
hrs.
4"x
.46"
x0.2
"
1 O
Z.
TB
D
TB
D
TB
D
Absolute weight Relative weight
InteractionsStrong PositivePositiveNegativeStrong Negative
Cus
tom
er D
eman
ds
Design Requirements
RelationshipStrong = 9.0Medium = 3.0Weak = 1.0
12
_________________________________________________Applied Business Improvement
All Rights Reserved , ABI Associates, 2005
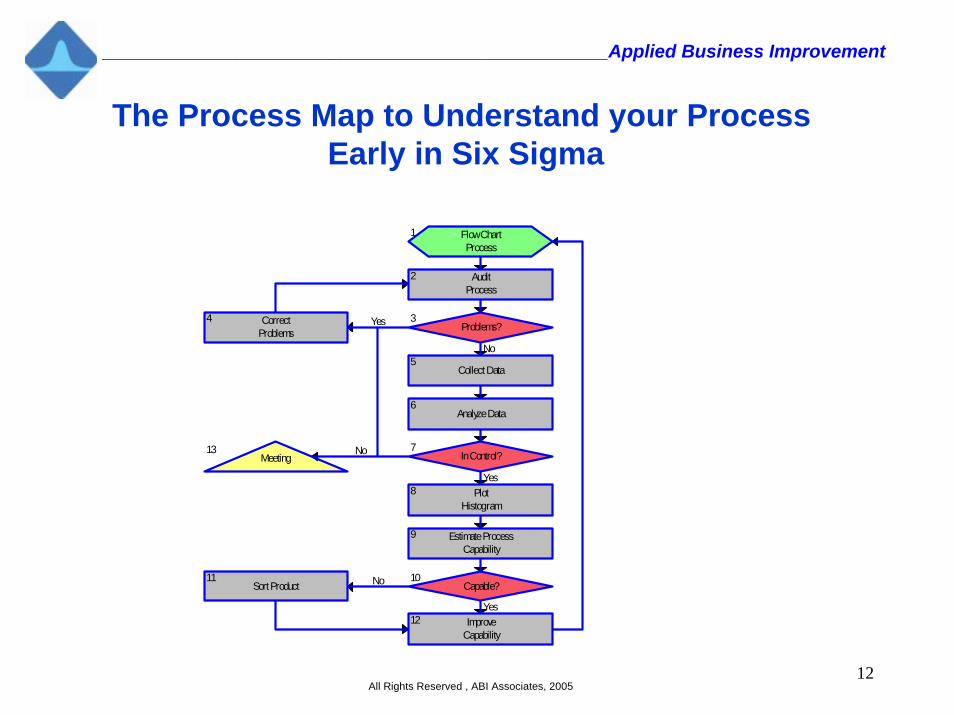
The Process Map to Understand your ProcessEarly in Six Sigma
Flow ChartProcess
1
AuditProcess
2
Problems? 3Correct
Problems 4
Collect Data 5
Analyze Data 6
In Control? 7
PlotHistogram
8
Estimate ProcessCapability
9
Capable? 10
Sort Product 11
ImproveCapability
12
Meeting 13
No
Yes
Yes
Yes
No
No
13
_________________________________________________Applied Business Improvement
All Rights Reserved , ABI Associates, 2005
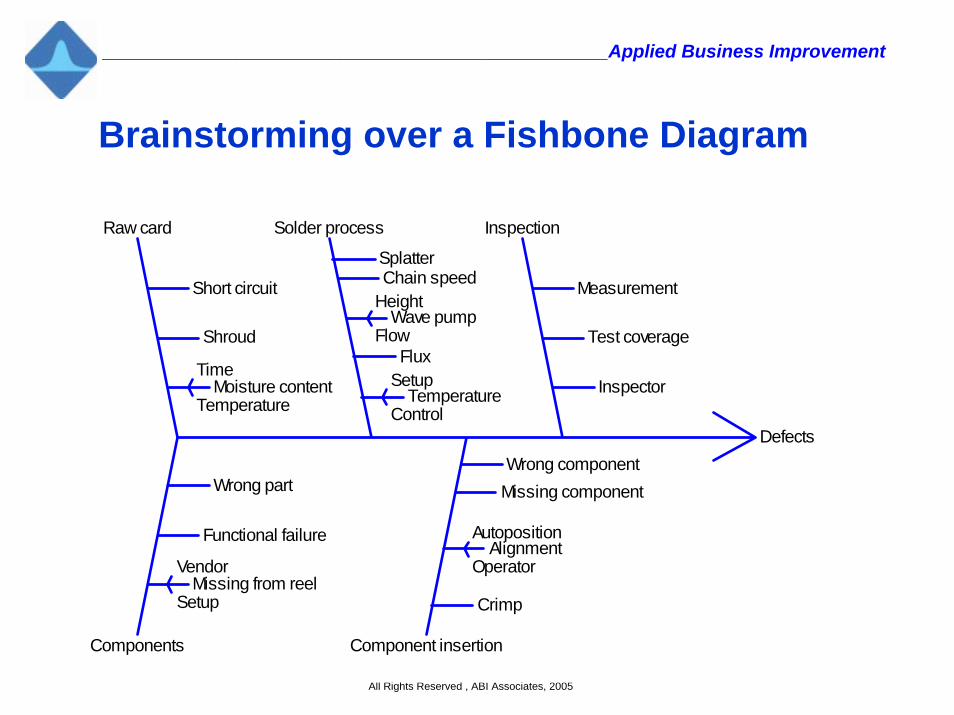
Brainstorming over a Fishbone Diagram
Defects
Raw card
Short circuit
Shroud
Moisture contentTime
Temperature
Solder process
SplatterChain speed
Wave pumpHeight
FlowFlux
TemperatureSetup
Control
Inspection
Measurement
Test coverage
Inspector
Components
Wrong part
Functional failure
Missing from reelVendor
Setup
Component insertion
Wrong componentMissing component
AlignmentAutoposition
Operator
Crimp
14
_________________________________________________Applied Business Improvement
All Rights Reserved , ABI Associates, 2005
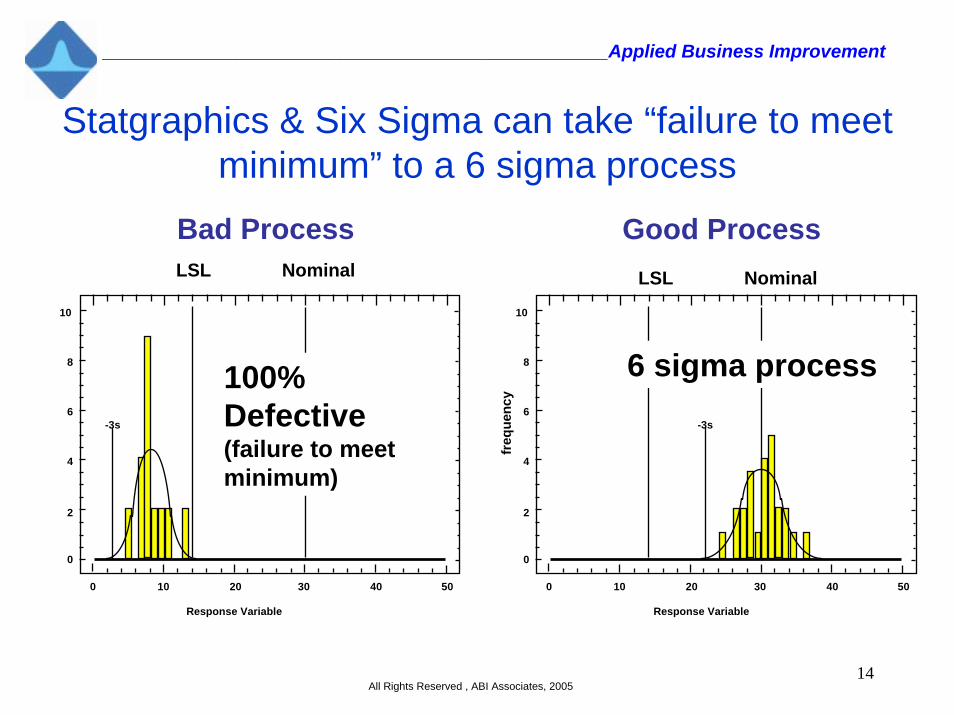
Statgraphics & Six Sigma can take “failure to meet minimum” to a 6 sigma process
Bad Process Good ProcessLSL Nominal
0 10 20 30 40 50
0
2
6
8
4
10
0 10 20 30 40 50
0
2
6
8
4
10
LSL Nominal
freq
uenc
y
Response Variable
6 sigma process-3s
100% Defective(failure to meet minimum)
-3s
Response Variable
15
_________________________________________________Applied Business Improvement
All Rights Reserved , ABI Associates, 2005
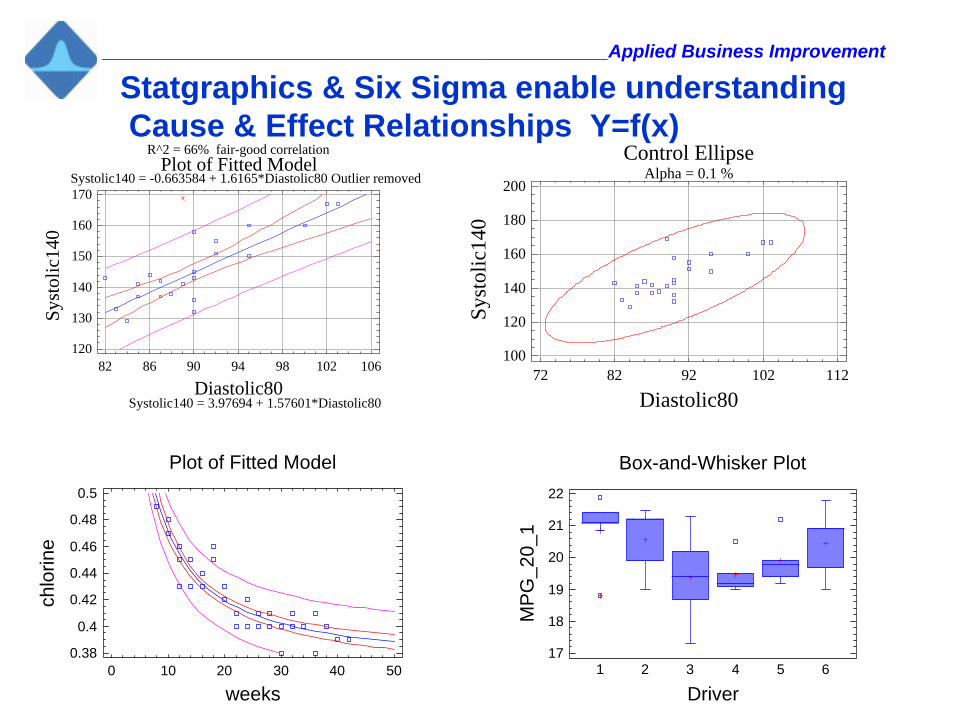
Plot of Fitted Model
Diastolic80
Syst
olic
140
Systolic140 = 3.97694 + 1.57601*Diastolic80
R^2 = 66% fair-good correlation
Systolic140 = -0.663584 + 1.6165*Diastolic80 Outlier removed
82 86 90 94 98 102 106120
130
140
150
160
170
Control Ellipse
Diastolic80
Syst
olic
140
72 82 92 102 112100
120
140
160
180
200Alpha = 0.1 %
Statgraphics & Six Sigma enable understanding Cause & Effect Relationships Y=f(x)
1 2 3 4 5 6
Box-and-Whisker Plot
17
18
19
20
21
22
MP
G_2
0_1
Driver
Plot of Fitted Model
weeks
chlo
rine
0 10 20 30 40 500.38
0.4
0.42
0.44
0.46
0.48
0.5
16
_________________________________________________Applied Business Improvement
All Rights Reserved , ABI Associates, 2005
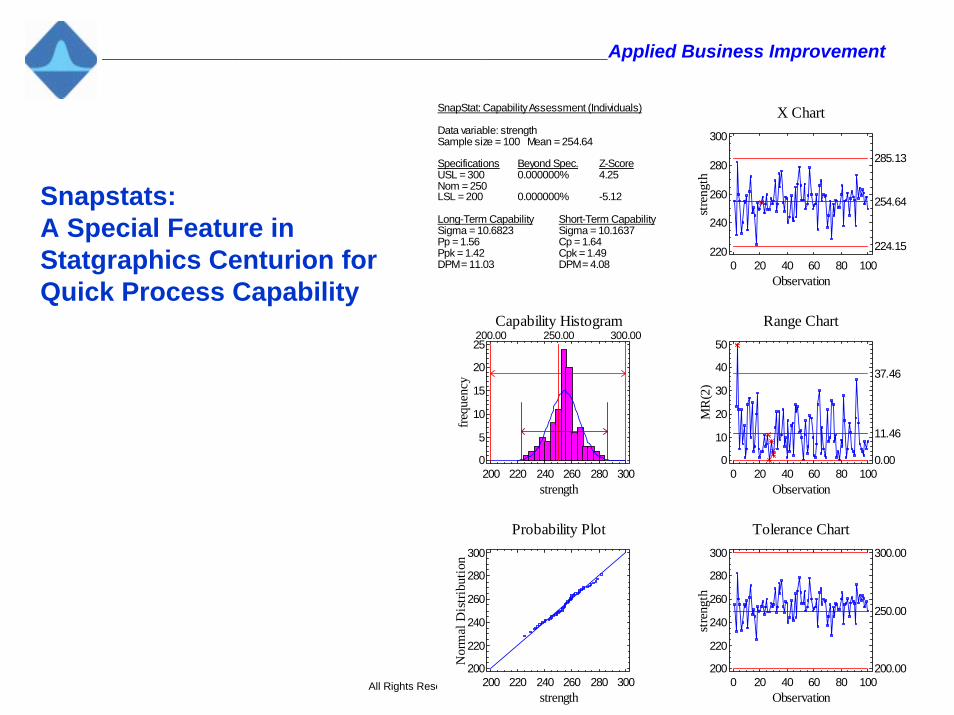
SnapStat: Capability Assessment (Individuals)
Data variable: strengthSample size = 100 Mean = 254.64
Specifications Beyond Spec. Z-ScoreUSL = 300 0.000000% 4.25Nom = 250LSL = 200 0.000000% -5.12
Long-Term Capability Short-Term CapabilitySigma = 10.6823 Sigma = 10.1637Pp = 1.56 Cp = 1.64Ppk = 1.42 Cpk = 1.49DPM = 11.03 DPM = 4.08
X Chart
Observation
stre
ngth
0 20 40 60 80 100220
240
260
280
300
254.64
285.13
224.15
Capability Histogram
strength
frequ
ency
200.00 250.00 300.00
200 220 240 260 280 3000
5
10
15
20
25
Range Chart
Observation
MR
(2)
0 20 40 60 80 1000
10
20
30
40
50
11.46
37.46
0.00
Probability Plot
strength
Nor
mal
Dis
tribu
tion
200 220 240 260 280 300200
220
240
260
280
300
Tolerance Chart
Observationst
reng
th0 20 40 60 80 100
200
220
240
260
280
300
250.00
300.00
200.00
Snapstats: A Special Feature inStatgraphics Centurion forQuick Process Capability
17
_________________________________________________Applied Business Improvement
All Rights Reserved , ABI Associates, 2005
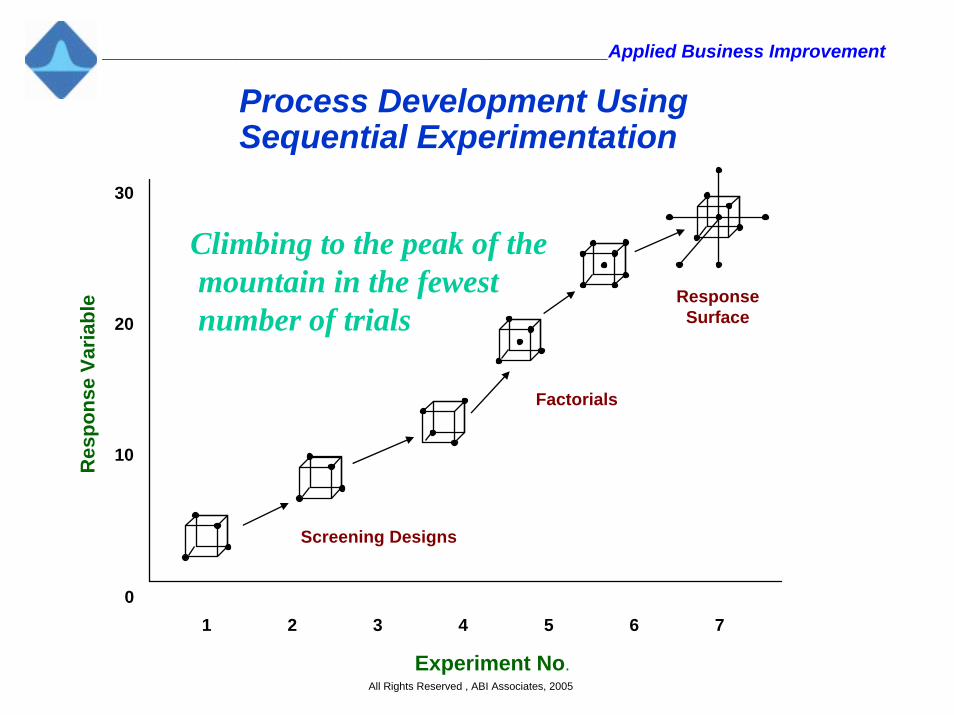
Process Development Using Sequential Experimentation
0
10
20
30
1 2 3 4 5 6 7
Experiment No.
Res
pons
e Va
riabl
e ResponseSurface
Factorials
Screening Designs
Climbing to the peak of themountain in the fewestnumber of trials
18
_________________________________________________Applied Business Improvement
All Rights Reserved , ABI Associates, 2005
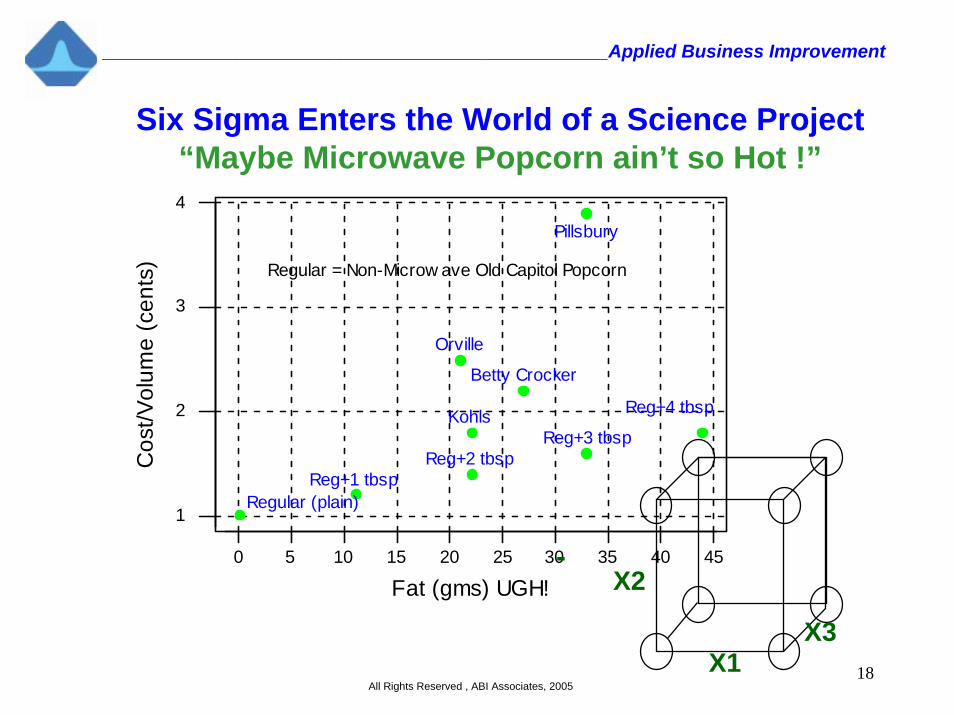
0 5 10 15 20 25 30 35 40 45
1
2
3
4
Fat (gms) UGH!
Cos
t/Vol
ume
(cen
ts)
Orville
Pillsbury
Betty Crocker
Kohls
Regular (plain)Reg+1 tbsp
Reg+2 tbspReg+3 tbsp
Reg+4 tbsp
Regular = Non-Microw ave Old Capitol Popcorn
Six Sigma Enters the World of a Science Project“Maybe Microwave Popcorn ain’t so Hot !”
X2-
X1X3
19
_________________________________________________Applied Business Improvement
All Rights Reserved , ABI Associates, 2005
Class ExerciseTo Demo DoE
Class ExerciseTo Demo DoE
20
_________________________________________________Applied Business Improvement
All Rights Reserved , ABI Associates, 2005
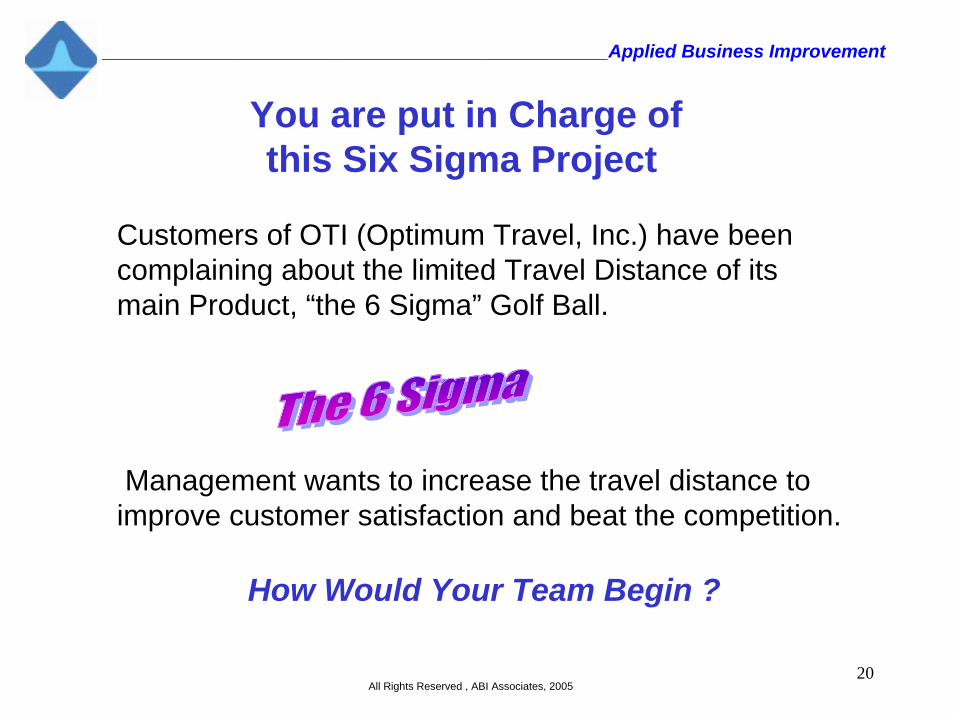
You are put in Charge of this Six Sigma Project
Customers of OTI (Optimum Travel, Inc.) have been complaining about the limited Travel Distance of its main Product, “the 6 Sigma” Golf Ball.
Management wants to increase the travel distance to improve customer satisfaction and beat the competition.
How Would Your Team Begin ?
21
_________________________________________________Applied Business Improvement
All Rights Reserved , ABI Associates, 2005
Course Offerings
22
_________________________________________________Applied Business Improvement
All Rights Reserved , ABI Associates, 2005
ABI Six Sigma Company Offeringsusing Statgraphics CenturionTM
• Executive Overview (1/2 Day)• Six Sigma Overview (1 Day or 2 Day) • Six Sigma Accelerated (6 Day)(2 Day and 3 Day Sessions with Project/ Mentoring)
• Six Sigma Green Belt (10 Day)(Four 2 Day Sessions with Project/ Mentoring)
• Six Sigma Black Belt (14 Day)(Five 2-3 Day Sessions with Project/ Mentoring)
ABI Six Sigma Overview.ppt
_________________________________________Applied Business Improvement
All Rights Reserved , ABI Associates, 2003
Six Sigma Executive OverviewOutline
• What is Six Sigma?- Definition and Organization Infrastructure
• How Does Six Sigma Improve Business Performance?• Who is Using Six Sigma?• What have been the Benefits?• Where can Six Sigma be Used? (In My Business?)• Six Sigma Methods and Tools using Statgraphics• How do I Implement Six Sigma?
24
_________________________________________________Applied Business Improvement
All Rights Reserved , ABI Associates, 2005
Six Sigma OverviewDefine / Measure / Analyze (Day 1)
• What is Six Sigma?• DMAIC Model • Project Selection • Project Charter• Team Roles and Responsibilities• Voice of the Customer• Concept Engineering• Quality Function Deployment• Using SIPOC for Process Identification • Process Mapping• Measurement System Analysis• Data Collection Methods• Understanding Variation• Fundamentals of Statistical Process Control (SPC) • Defining Process Capability• Calculating Sigma Levels /DPMO
25
_________________________________________________Applied Business Improvement
All Rights Reserved , ABI Associates, 2005
Six Sigma OverviewAnalyze / Improve / Control (Day 2)
• Seven Basic Quality Tools for Analyzing Data• Basic Regression• Design of Experiments (DoE)• Analysis of Variance (ANOVA)• Failure Mode & Effects Analysis (FMEA)• Error Proofing• SPC for Process Control• Piloting and Implementing a Solution• Process Control Plan• Reporting Project Benefits / Financial Impact • Leveraging “Best Practices”• Summary and Lessons Learned
Statgraphics Centurion
26
_________________________________________________Applied Business Improvement
All Rights Reserved , ABI Associates, 2005
A new Approach to Six Sigma ImplementationSix Sigma Accelerated
Six Sigma Accelerated plus Statgraphics Centurion and You If you’re a company that wants to either improve its quality levels or develop its employees, then Six Sigma Accelerated is for you. Featuring Statgraphics Centurion, Six Sigma Accelerated places the emphasis on problem-solving strategy while providing statistical software and support in the background.
As a result, Six Sigma Accelerated training gives you the real-world tools and techniques you need to implement improvement strategies. These improvement strategies allow you to increase performance and decrease process variation, resulting in defect reduction while improving product quality, your net income and employee morale. Simply put, Six Sigma Accelerated provides you with a hands-on formula for business improvement.
Six Sigma Accelerated training follows the traditional Six Sigma Model: Define – Measure – Analyze – Improve – Control (DMAIC). While doing so, Statgraphics Centurion provides the synergy of the statistical methods with the DMAIC model.
This, in turn, allows you to address your most difficult problems (those requiring a data driven approach and the use of statistical tools and techniques). Furthermore, Six Sigma Accelerated gives you the ability to analyze your company’s weakness orientation while offering you additional tools for business improvement.
Since most users may not be trained statisticians, the StatAdvisor tool adds a short narrative paragraph to all tabular and graphical output explaining in user-friendly language the significance of the results. The explanation is context sensitive, picking up the actual numerical results and integrating them into the explanation. To further simplify the team’s Project Presentation, StatAdvisor output can be plugged into the STATGRAPHICS StatReporter tool, which will generate a report of the data analysis for Team Project Reporting and Presentation.
How long is Accelerated Six Sigma training?Applied Business Improvement (ABI) and Statgraphics offer the Six Sigma Accelerated course in a six-day format. Individuals who complete Six Sigma Accelerated course will be familiar with the Green Belt Six Sigma basic skills and core statistics tools. Upon completion of this course, ABI offers an additional five-day Six Sigma course for those subsequently seeking to upgrade to Six Sigma Black Belt status.
Who should attend? Class requirements.This course is designed for those seeking Six Sigma Green Belt level. A basic knowledge of Statistics is helpful but not critical. Completion of a Six Sigma project and class access to a laptop computer are required.
27
_________________________________________________Applied Business Improvement
All Rights Reserved , ABI Associates, 2005
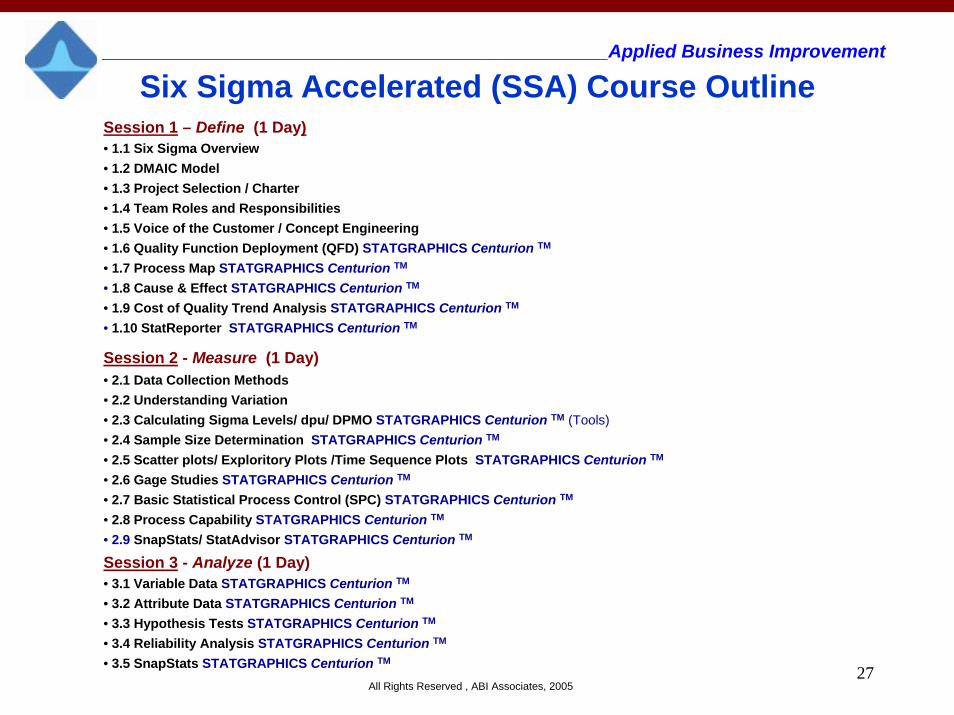
Session 1 – Define (1 Day)• 1.1 Six Sigma Overview• 1.2 DMAIC Model• 1.3 Project Selection / Charter• 1.4 Team Roles and Responsibilities• 1.5 Voice of the Customer / Concept Engineering• 1.6 Quality Function Deployment (QFD) STATGRAPHICS Centurion TM
• 1.7 Process Map STATGRAPHICS Centurion TM
• 1.8 Cause & Effect STATGRAPHICS Centurion TM
• 1.9 Cost of Quality Trend Analysis STATGRAPHICS Centurion TM
• 1.10 StatReporter STATGRAPHICS Centurion TM
Session 2 - Measure (1 Day)• 2.1 Data Collection Methods• 2.2 Understanding Variation• 2.3 Calculating Sigma Levels/ dpu/ DPMO STATGRAPHICS Centurion TM (Tools)• 2.4 Sample Size Determination STATGRAPHICS Centurion TM
• 2.5 Scatter plots/ Exploritory Plots /Time Sequence Plots STATGRAPHICS Centurion TM
• 2.6 Gage Studies STATGRAPHICS Centurion TM
• 2.7 Basic Statistical Process Control (SPC) STATGRAPHICS Centurion TM
• 2.8 Process Capability STATGRAPHICS Centurion TM
• 2.9 SnapStats/ StatAdvisor STATGRAPHICS Centurion TM
Session 3 - Analyze (1 Day)• 3.1 Variable Data STATGRAPHICS Centurion TM
• 3.2 Attribute Data STATGRAPHICS Centurion TM
• 3.3 Hypothesis Tests STATGRAPHICS Centurion TM
• 3.4 Reliability Analysis STATGRAPHICS Centurion TM
• 3.5 SnapStats STATGRAPHICS Centurion TM
Six Sigma Accelerated (SSA) Course Outline
28
_________________________________________________Applied Business Improvement
All Rights Reserved , ABI Associates, 2005
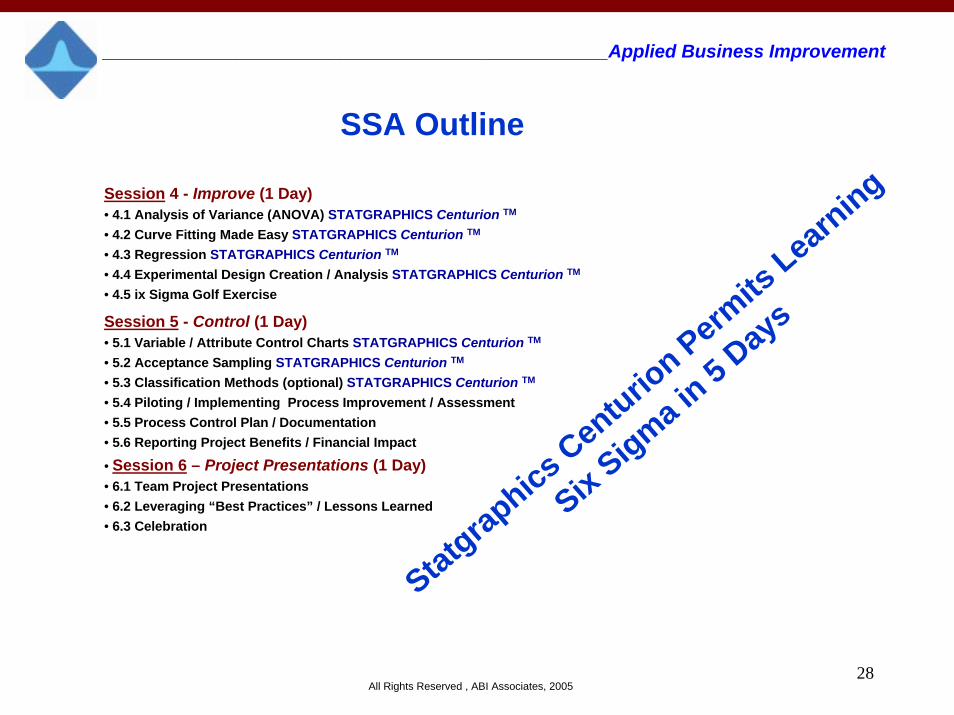
Session 4 - Improve (1 Day)• 4.1 Analysis of Variance (ANOVA) STATGRAPHICS Centurion TM
• 4.2 Curve Fitting Made Easy STATGRAPHICS Centurion TM
• 4.3 Regression STATGRAPHICS Centurion TM
• 4.4 Experimental Design Creation / Analysis STATGRAPHICS Centurion TM
• 4.5 ix Sigma Golf Exercise
Session 5 - Control (1 Day)• 5.1 Variable / Attribute Control Charts STATGRAPHICS Centurion TM
• 5.2 Acceptance Sampling STATGRAPHICS Centurion TM
• 5.3 Classification Methods (optional) STATGRAPHICS Centurion TM
• 5.4 Piloting / Implementing Process Improvement / Assessment• 5.5 Process Control Plan / Documentation• 5.6 Reporting Project Benefits / Financial Impact
• Session 6 – Project Presentations (1 Day)• 6.1 Team Project Presentations • 6.2 Leveraging “Best Practices” / Lessons Learned• 6.3 Celebration
SSA Outline
Statgraphics Centurion Perm
its Learning
Six Sigma in 5 Days
29
_________________________________________________Applied Business Improvement
All Rights Reserved , ABI Associates, 2005
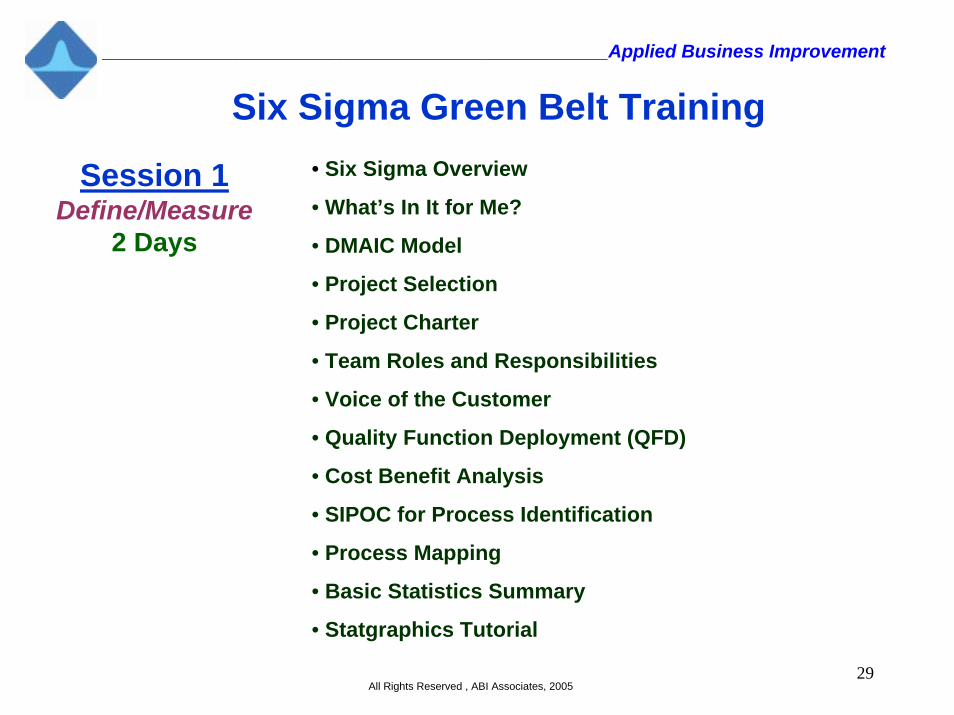
Six Sigma Green Belt Training
Session 1Define/Measure
2 Days
• Six Sigma Overview
• What’s In It for Me?
• DMAIC Model
• Project Selection
• Project Charter
• Team Roles and Responsibilities
• Voice of the Customer
• Quality Function Deployment (QFD)
• Cost Benefit Analysis
• SIPOC for Process Identification
• Process Mapping
• Basic Statistics Summary
• Statgraphics Tutorial
30
_________________________________________________Applied Business Improvement
All Rights Reserved , ABI Associates, 2005
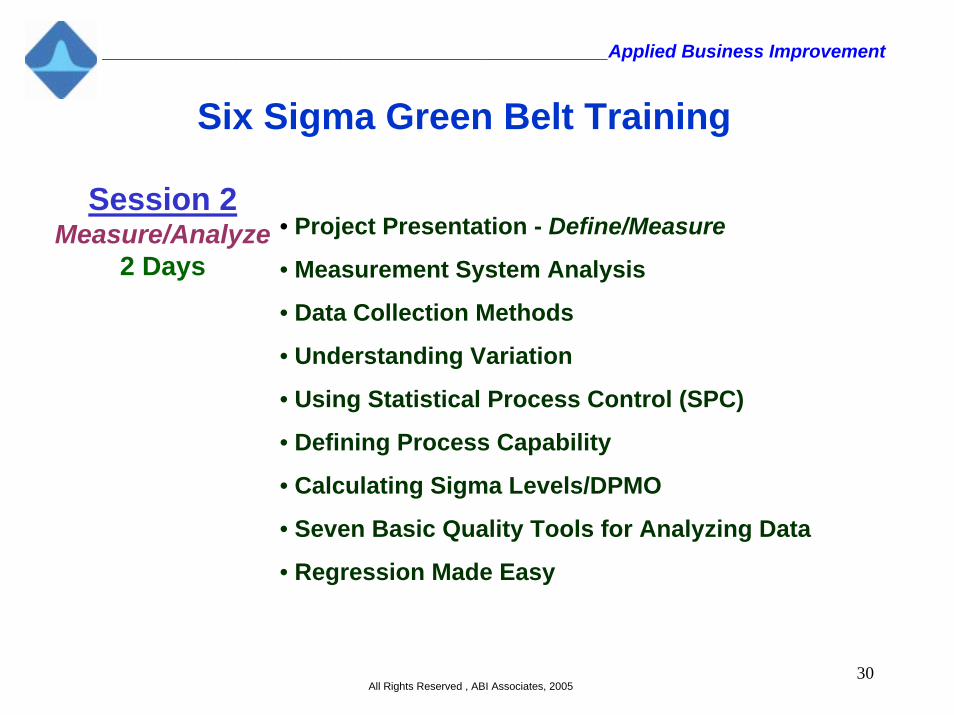
Six Sigma Green Belt Training
Session 2Measure/Analyze
2 Days• Project Presentation - Define/Measure
• Measurement System Analysis
• Data Collection Methods
• Understanding Variation
• Using Statistical Process Control (SPC)
• Defining Process Capability
• Calculating Sigma Levels/DPMO
• Seven Basic Quality Tools for Analyzing Data
• Regression Made Easy
31
_________________________________________________Applied Business Improvement
All Rights Reserved , ABI Associates, 2005
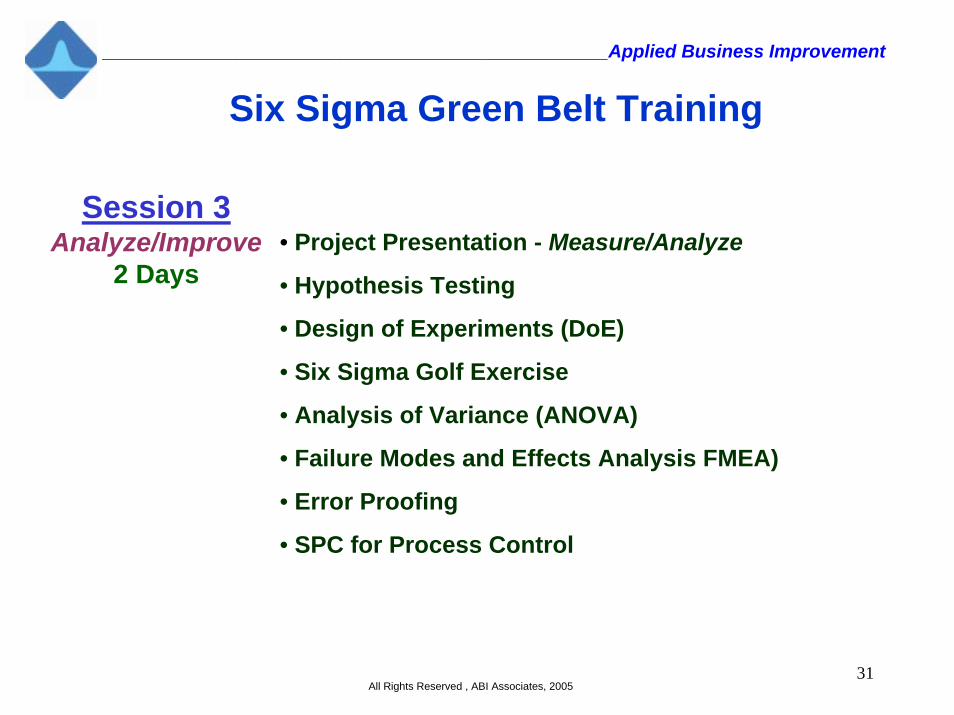
Six Sigma Green Belt Training
Session 3Analyze/Improve
2 Days• Project Presentation - Measure/Analyze
• Hypothesis Testing
• Design of Experiments (DoE)
• Six Sigma Golf Exercise
• Analysis of Variance (ANOVA)
• Failure Modes and Effects Analysis FMEA)
• Error Proofing
• SPC for Process Control
32
_________________________________________________Applied Business Improvement
All Rights Reserved , ABI Associates, 2005
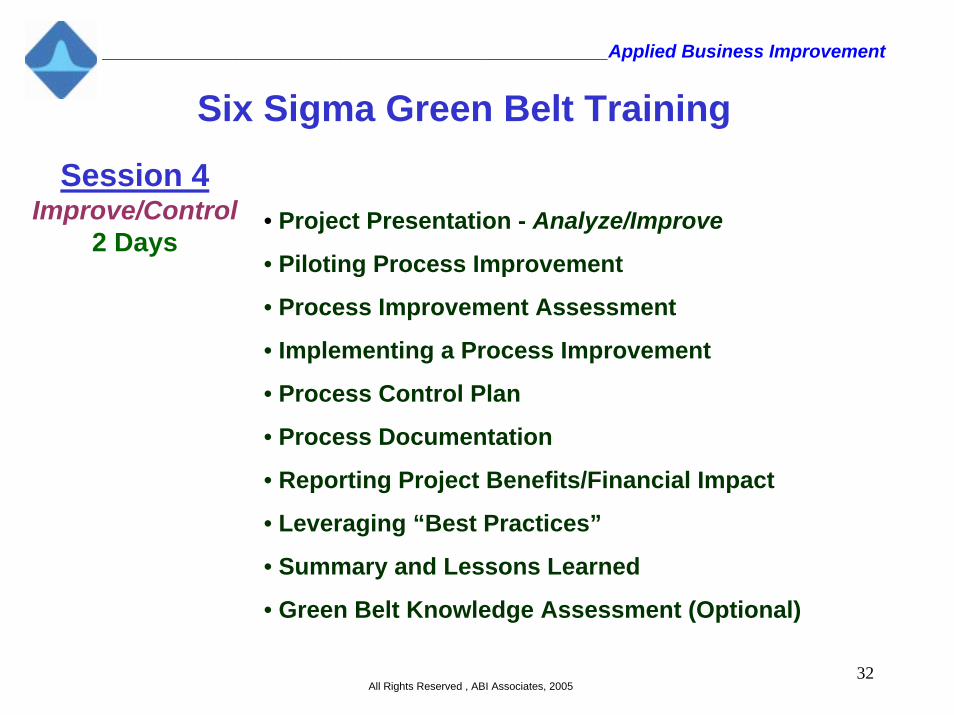
Six Sigma Green Belt Training
Session 4Improve/Control
2 Days• Project Presentation - Analyze/Improve
• Piloting Process Improvement
• Process Improvement Assessment
• Implementing a Process Improvement
• Process Control Plan
• Process Documentation
• Reporting Project Benefits/Financial Impact
• Leveraging “Best Practices”
• Summary and Lessons Learned
• Green Belt Knowledge Assessment (Optional)
33
_________________________________________________Applied Business Improvement
All Rights Reserved , ABI Associates, 2005
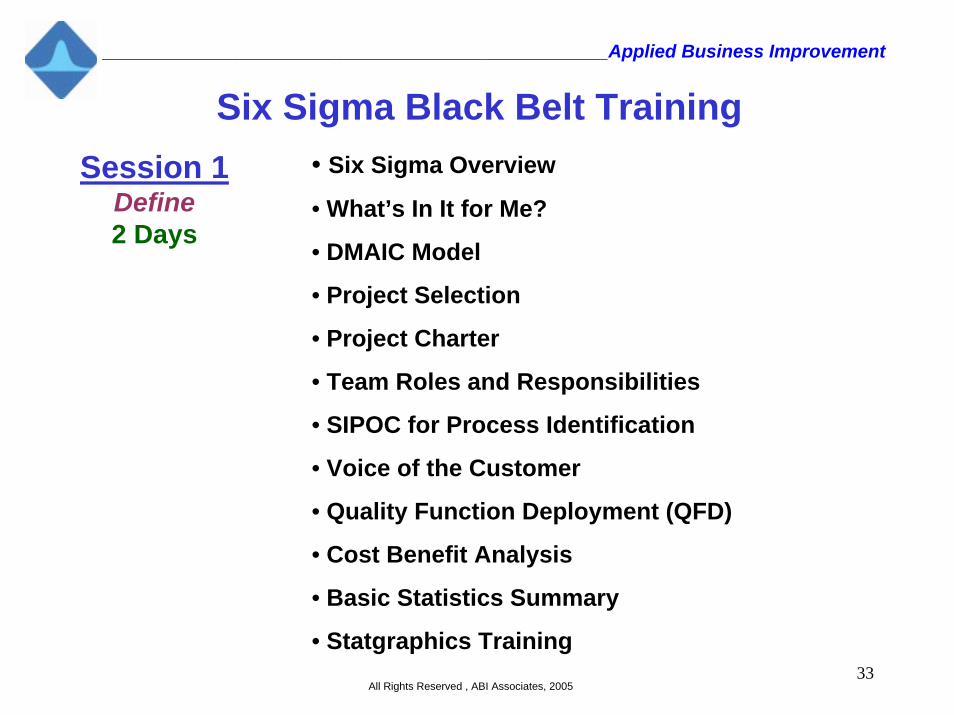
Six Sigma Black Belt TrainingSession 1
Define2 Days
• Six Sigma Overview
• What’s In It for Me?
• DMAIC Model
• Project Selection
• Project Charter
• Team Roles and Responsibilities
• SIPOC for Process Identification
• Voice of the Customer
• Quality Function Deployment (QFD)
• Cost Benefit Analysis
• Basic Statistics Summary
• Statgraphics Training
34
_________________________________________________Applied Business Improvement
All Rights Reserved , ABI Associates, 2005
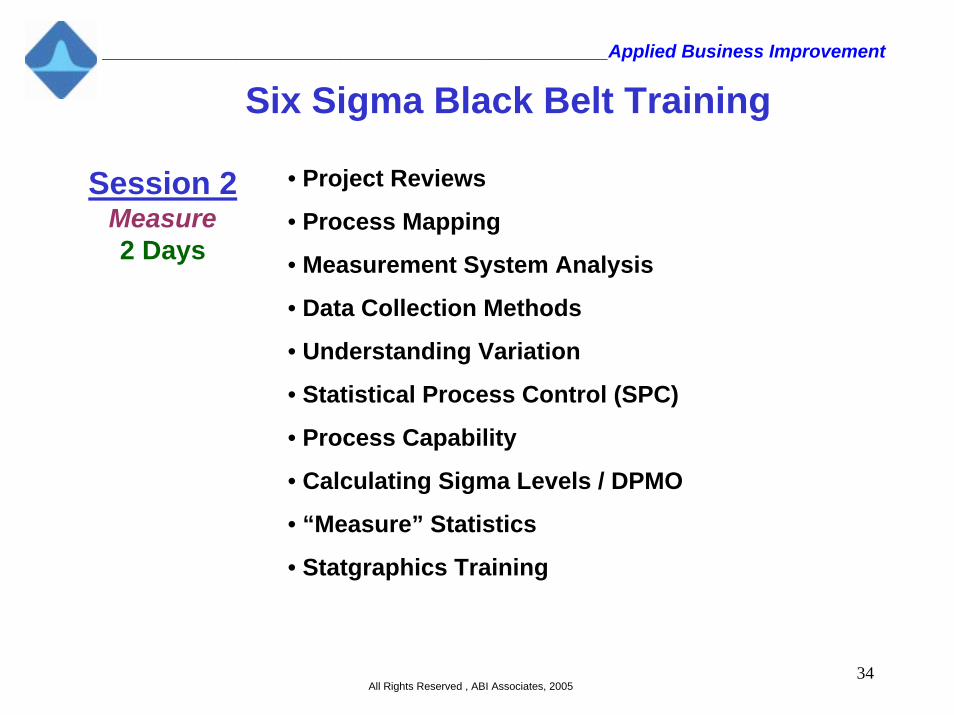
Six Sigma Black Belt Training
Session 2Measure2 Days
• Project Reviews
• Process Mapping
• Measurement System Analysis
• Data Collection Methods
• Understanding Variation
• Statistical Process Control (SPC)
• Process Capability
• Calculating Sigma Levels / DPMO
• “Measure” Statistics
• Statgraphics Training
35
_________________________________________________Applied Business Improvement
All Rights Reserved , ABI Associates, 2005
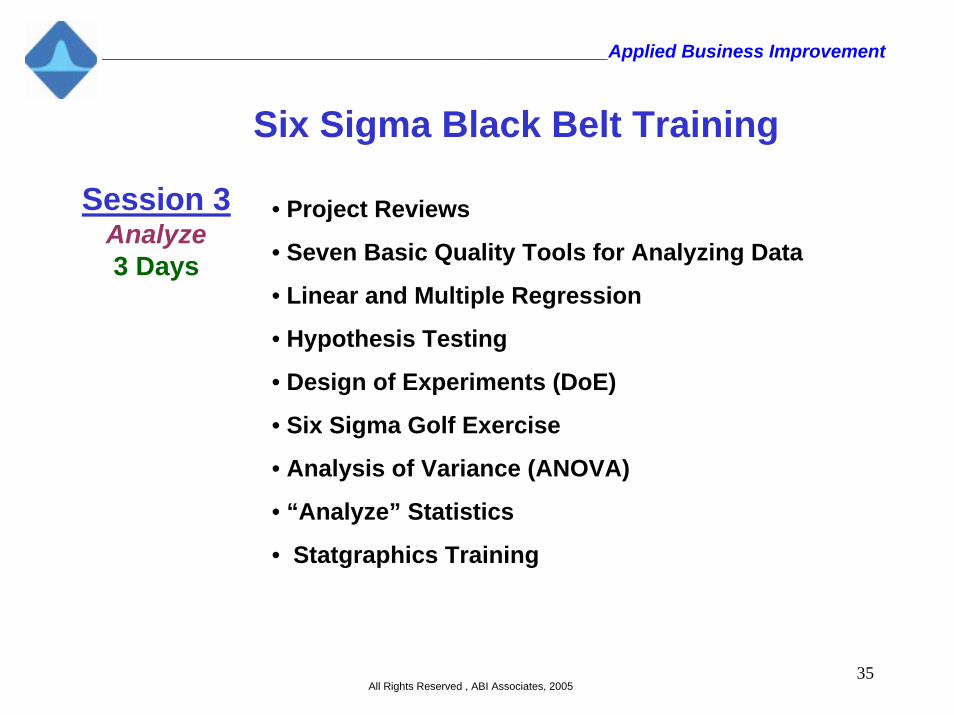
Six Sigma Black Belt Training
Session 3Analyze3 Days
• Project Reviews
• Seven Basic Quality Tools for Analyzing Data
• Linear and Multiple Regression
• Hypothesis Testing
• Design of Experiments (DoE)
• Six Sigma Golf Exercise
• Analysis of Variance (ANOVA)
• “Analyze” Statistics
• Statgraphics Training
36
_________________________________________________Applied Business Improvement
All Rights Reserved , ABI Associates, 2005
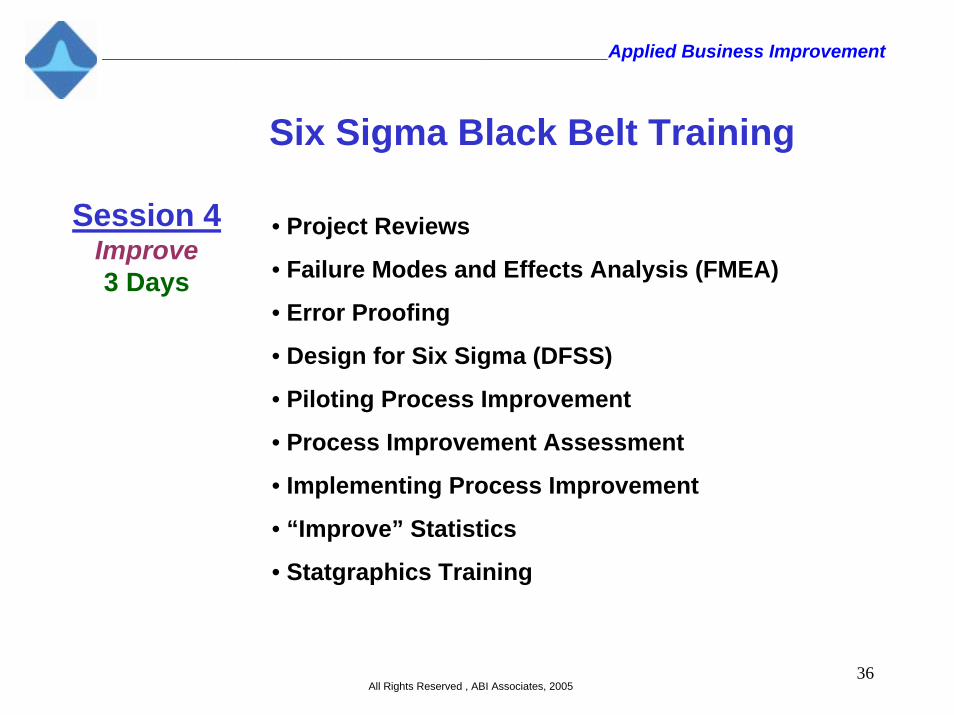
Six Sigma Black Belt Training
Session 4Improve3 Days
• Project Reviews
• Failure Modes and Effects Analysis (FMEA)
• Error Proofing
• Design for Six Sigma (DFSS)
• Piloting Process Improvement
• Process Improvement Assessment
• Implementing Process Improvement
• “Improve” Statistics
• Statgraphics Training
37
_________________________________________________Applied Business Improvement
All Rights Reserved , ABI Associates, 2005
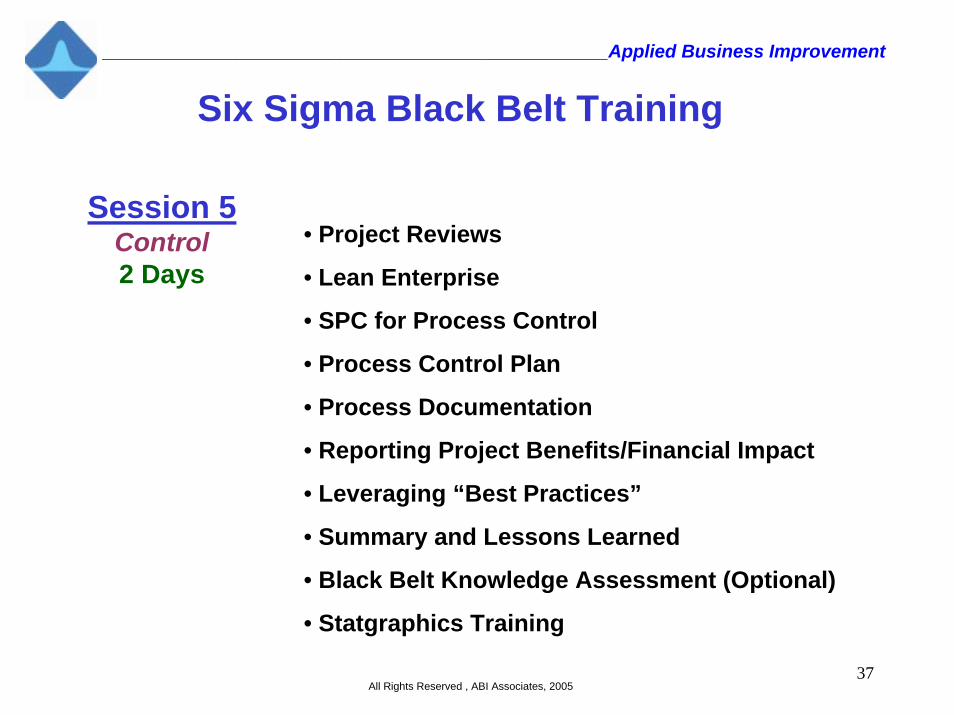
Six Sigma Black Belt Training
Session 5Control2 Days
• Project Reviews
• Lean Enterprise
• SPC for Process Control
• Process Control Plan
• Process Documentation
• Reporting Project Benefits/Financial Impact
• Leveraging “Best Practices”
• Summary and Lessons Learned
• Black Belt Knowledge Assessment (Optional)
• Statgraphics Training
38
_________________________________________________Applied Business Improvement
All Rights Reserved , ABI Associates, 2005
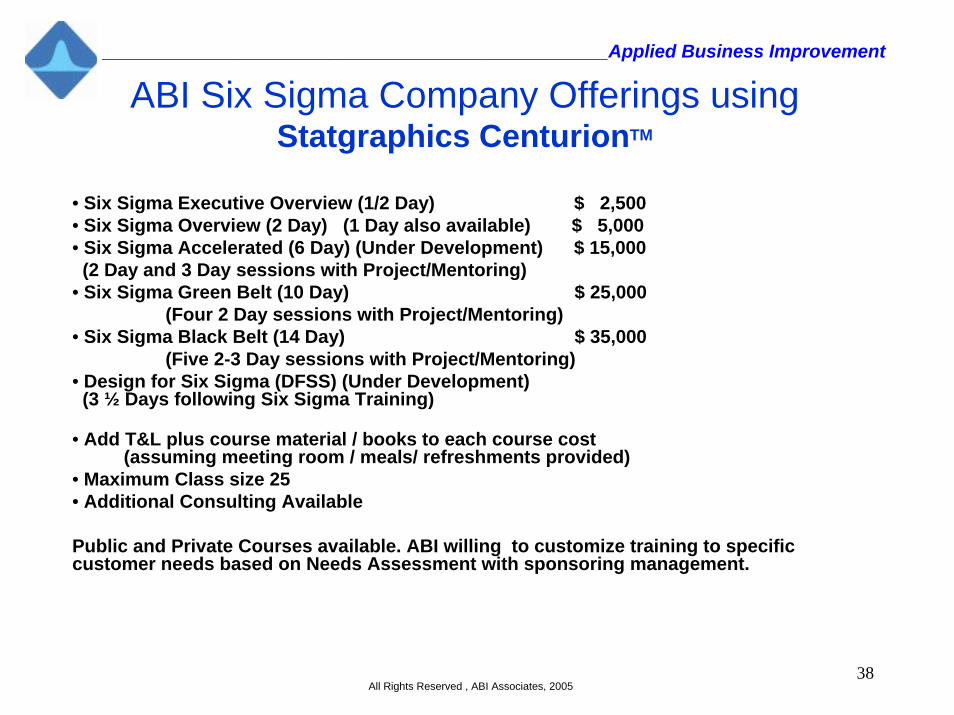
ABI Six Sigma Company Offerings using Statgraphics CenturionTM
• Six Sigma Executive Overview (1/2 Day) $ 2,500• Six Sigma Overview (2 Day) (1 Day also available) $ 5,000• Six Sigma Accelerated (6 Day) (Under Development) $ 15,000(2 Day and 3 Day sessions with Project/Mentoring)
• Six Sigma Green Belt (10 Day) $ 25,000(Four 2 Day sessions with Project/Mentoring)
• Six Sigma Black Belt (14 Day) $ 35,000(Five 2-3 Day sessions with Project/Mentoring)
• Design for Six Sigma (DFSS) (Under Development)(3 ½ Days following Six Sigma Training)
• Add T&L plus course material / books to each course cost(assuming meeting room / meals/ refreshments provided)
• Maximum Class size 25• Additional Consulting Available
Public and Private Courses available. ABI willing to customize training to specific customer needs based on Needs Assessment with sponsoring management.
39
_________________________________________________Applied Business Improvement
All Rights Reserved , ABI Associates, 2005
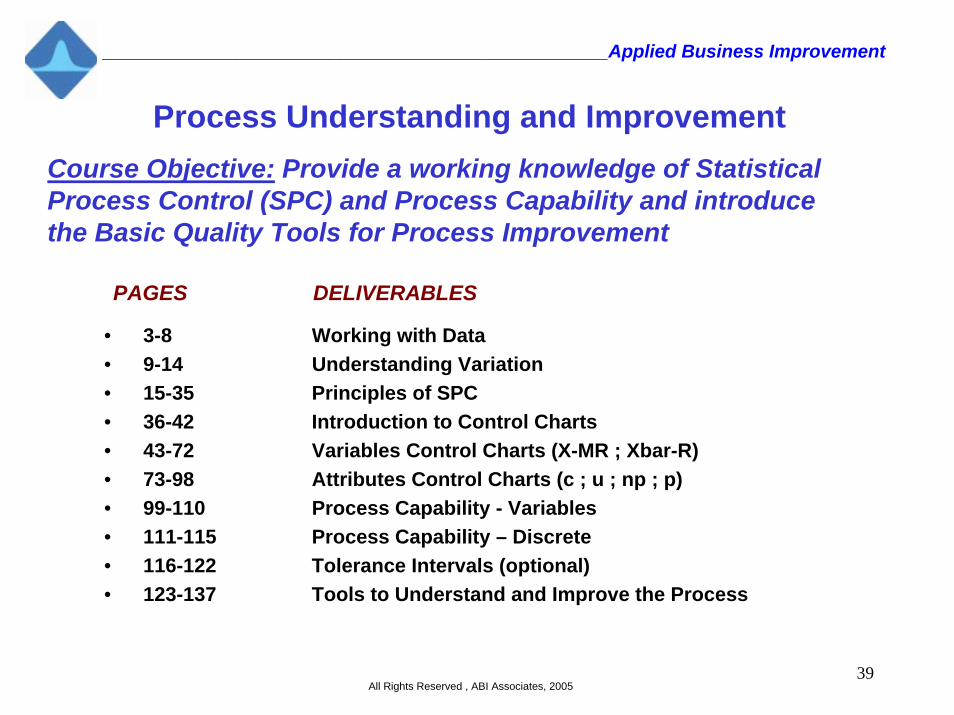
Process Understanding and ImprovementCourse Objective: Provide a working knowledge of Statistical Process Control (SPC) and Process Capability and introduce the Basic Quality Tools for Process Improvement
PAGES DELIVERABLES
• 3-8 Working with Data• 9-14 Understanding Variation• 15-35 Principles of SPC• 36-42 Introduction to Control Charts• 43-72 Variables Control Charts (X-MR ; Xbar-R)• 73-98 Attributes Control Charts (c ; u ; np ; p)• 99-110 Process Capability - Variables • 111-115 Process Capability – Discrete• 116-122 Tolerance Intervals (optional)• 123-137 Tools to Understand and Improve the Process
40
_________________________________________________Applied Business Improvement
All Rights Reserved , ABI Associates, 2005
Introduction to Design of Experiments
Session Topics
• Common Approaches to Experimentation• What is Design of Experiments (DoE)?• Factorial Designs• The Process of Experimentation• Demo: Catapult Experiment Using Statgraphics- Analysis of Variance (ANOVA)
• Detectable Effects• Fractional Factorial Designs• Confounding• Screening Designs• Response Surface Optimization• Taguchi Methods
41
_________________________________________________Applied Business Improvement
All Rights Reserved , ABI Associates, 2005
Introduction to Design of ExperimentsProcess of Experimentation• Define Project
- Identify Response Variables• Understand Current Situation• Perform Designed Experiment
- Identify Factors- Choose Factor Levels- Select Design (Replication)- Randomize Experiment Runs- Collect Data- Analyze Data- Form Conclusions- Verify Results
• Define and Implement Solutions• Record Results• Standardize Results• Determine Future Plans
42
_________________________________________________Applied Business Improvement
All Rights Reserved , ABI Associates, 2005
ABI Introductory Company Offerings using Statgraphics CenturionTM
• Process Understanding and Improvement (1/2 Day) $ 2,500 (1 Day also available)
• Design of Experiment – Executive Overview (1/2 Day) $ 2,500(1 Day also available)
• Design of Experiments – Introduction (1 Day) $ 2,500
Add Travel & Living Expense plus course material / books to each course cost(assuming meeting room / meals/ refreshments provided)
Maximum Class size 25Additional Consulting Available
Public and Private Courses available. ABI willing to customize training to specific customer needs based on Needs Assessment with sponsoring management.
43
_________________________________________________Applied Business Improvement
All Rights Reserved , ABI Associates, 2005
ABI Associates
George Dyson and Terry Russell have been actively involved in both teaching and mentoring Six Sigma and Design for Six Sigma directly with local area businesses or the University of Cincinnati, Belcan Corp. or the Center for Quality of Management. In 2005, both Terry and George were invited to participate in current training with General Electric, followed by co-teaching Six Sigma and Design for Six Sigma at GE.
George H. Dyson III
George Dyson is the area Six Sigma representative for StatPoint, Inc., the developer of the STATGRAPHICS Centurion TM
software package. He is responsible for its support and application of its release. George is a partner in ABI Associates, a business improvement consulting practice devoted to optimizing Six Sigma training/Implementation to improve business performance.
Prior to his current position, George accumulated 33 years of professional experience with United Technologies and General Electric Aircraft Engines. During his career at GE, he provided statistical support, managed teams, and developed new courses and patent applications to solve a wide variety of engineering and manufacturing problems, including new process development, Reliability/Quality and Six Sigma training and project support. His individual Six Sigma and Design for Six Sigma projects saved GE $1.5 Million.
George Dyson holds an Associate in Applied Science, a Bachelor’s Degree in Mechanical Engineering and a MS Degree in Engineering Management. He has taught undergraduate courses in Engineering Statistics and holds instructor certifications from GE and Motorola (Six Sigma). He has an Honorable Discharge from the U.S. Air Force Reserves 440th Troop Carrier Wing, Staff Sergeant.
Terry Russell
Terry Russell is a partner in ABI Associates, a business improvement consulting practice working with domestic and internationalcompanies to improve business performance through management system and process improvement and through Six Sigma training and implementation. Clients have included companies in both product manufacturing and service sectors.
Prior to his current position, Terry accumulated 36 years of professional experience with the National Aeronautical and Space Administration and General Electric Aircraft Engines. With GE, Terry was recognized for his leadership in the development and implementation of international TQM based business improvement programs.
Terry Russell holds a Bachelor’s Degree in Mechanical Engineering and Master’s Degrees in Mechanical Engineering and Business Administration. He holds instructor certifications from GE, Motorola (Six Sigma) and Ford (TOPS8D), and has been Leader of the Day for several Center for Quality of Management courses. He is a registered Professional Engineer in the State ofOhio and serves as Chair of the Industrial Advisory Board for the Ohio University Department of Mechanical Engineering.