Embed Size (px)
Citation preview

Introduction of new technologies in the FAMV
diagnostic internshipAn example of good practice or innovation?
Wesly Jeune1 ; Absalon pierre1 ; Béatrice Antoine Felix2
1AREA Project ; 2FAMV
May, 2018

INTRODUCTION
• A geographicinformation system(GIS) is an organizedaccumulation of dataand procedures thathelp people makedecisions.
• Un systèmed’informationgéographique (SIG) estun système de stockagede données et unensemble deprocédures d’aide à ladécisions.
INTRODUCTION
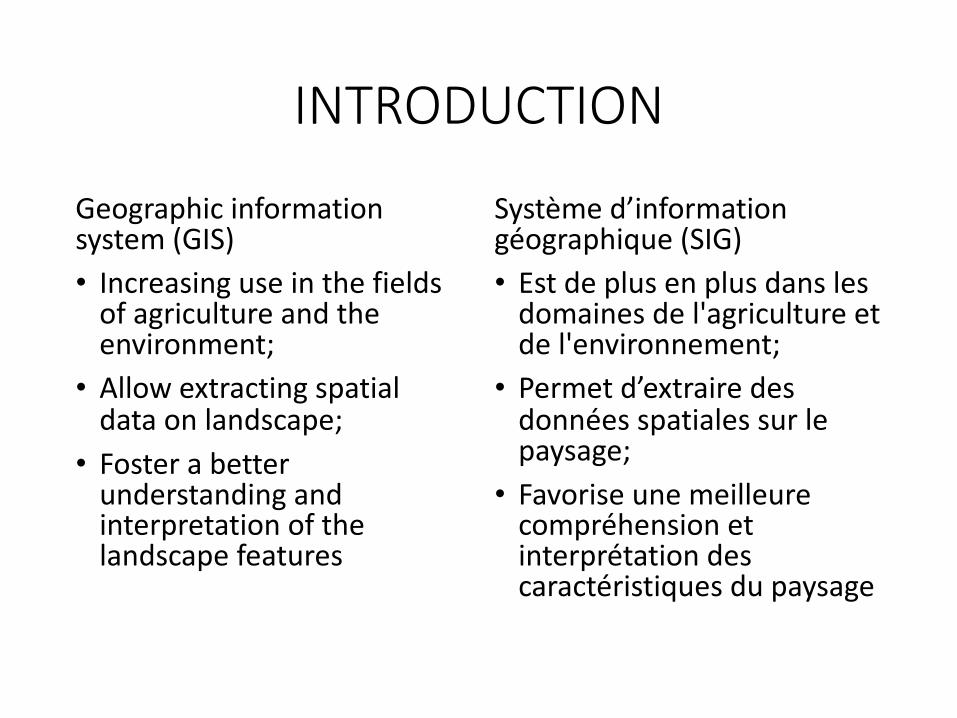
Geographic information system (GIS)• Increasing use in the fields
of agriculture and theenvironment;
• Allow extracting spatialdata on landscape;
• Foster a betterunderstanding andinterpretation of thelandscape features
Système d’informationgéographique (SIG)• Est de plus en plus dans les
domaines de l'agriculture etde l'environnement;
• Permet d’extraire desdonnées spatiales sur lepaysage;
• Favorise une meilleurecompréhension etinterprétation descaractéristiques du paysage
INTRODUCTION
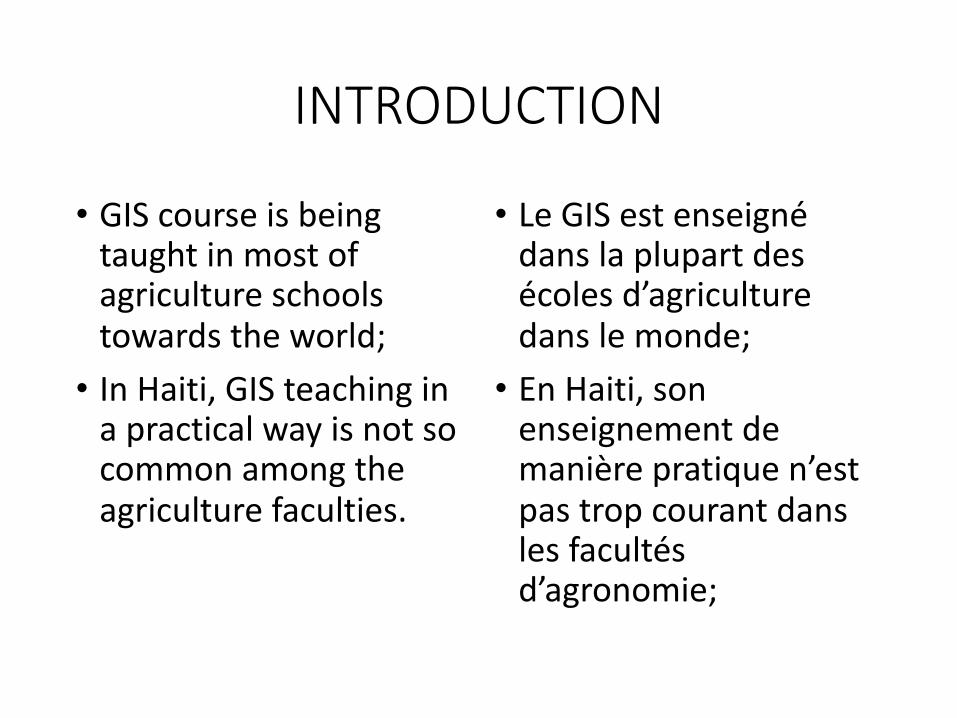
• GIS course is beingtaught in most ofagriculture schoolstowards the world;
• In Haiti, GIS teaching ina practical way is not socommon among theagriculture faculties.
• Le GIS est enseignédans la plupart desécoles d’agriculturedans le monde;
• En Haiti, sonenseignement demanière pratique n’estpas trop courant dansles facultésd’agronomie;

OBJECTIVE/OBJECTIF
• To promote theintegration of GIS intothe analysis andunderstanding oflandscape-relatedprocesses as anelement of curriculumchange
• Promouvoirl’intégration du SIGdans l’analyse et lacompréhension deprocessus en lien aupaysage commeélément dechangementcurriculaire

HOW TO APPLY THIS TECH?/COMMENT APPLIQUER CETTE
TECH?
Use of Digital Elevation Model (DEM), as a specialized database that represents the relief of a surface.• Shuttle Radar Topography
Mission (SRTM, 30 et 90 m);• Advanced Spaceborne
Thermal Emission andReflection Radiometer(ASTER, 15, 30 et 90 m);
• Light Detection AndRanging (LIDAR, 10, 1 m);
• Etc….
Utilisation du model numérique de terrain (MNT), une representation matricielle de la superficieterrestre:• SRTM ( 30 et 90 m);• ASTER GDEM (15, 30 et 90
m);• LIDAR (10, 1 m);• Etc….

• IKONOS;• World view;• Quickbird, etc.;Can be used also:• Remotely sensed data
(bands of Landsat 8OLI)
• IKONOS;• Worldview;• Quickbird, etc.;Peuvent être utiliséesaussi:• Les données de
télédétection(bandes ofLandsat 8 OLI)
HOW TO APPLY THIS TECH?/COMMENT APPLIQUER CETTE
TECH?

COMMONLY USED TOOLS AND SOFTWARE
• Some tools for processingDEM to derive topographicattributes and producethematic maps:
- ArcGIS;- SAGAGIS;- QGIS;- R-Cran (RSAGA..)Tools for visualization and pre-processing: Google Earth;
• Outils plus communémentutilisés dans le traitementdu DEM afin de dériver desattributs topographiques etproduire des cartesthématiques:
- ArcGIS;- SAGAGIS;- QGIS;- R-Cran (RSAGA..)- Outil pour la visualization et
le pré-traitement: GoogleEarth

Experience at the 2018 Diagnostic Internship
• First-time use of GPSunits during field visits
• Backgroundinformation onlandscape
• Utilisation du GPS pourla première fois dans cestage Durant lesactivités de terrain;
• Cela permet decollecter des donnéesde base sur le paysage
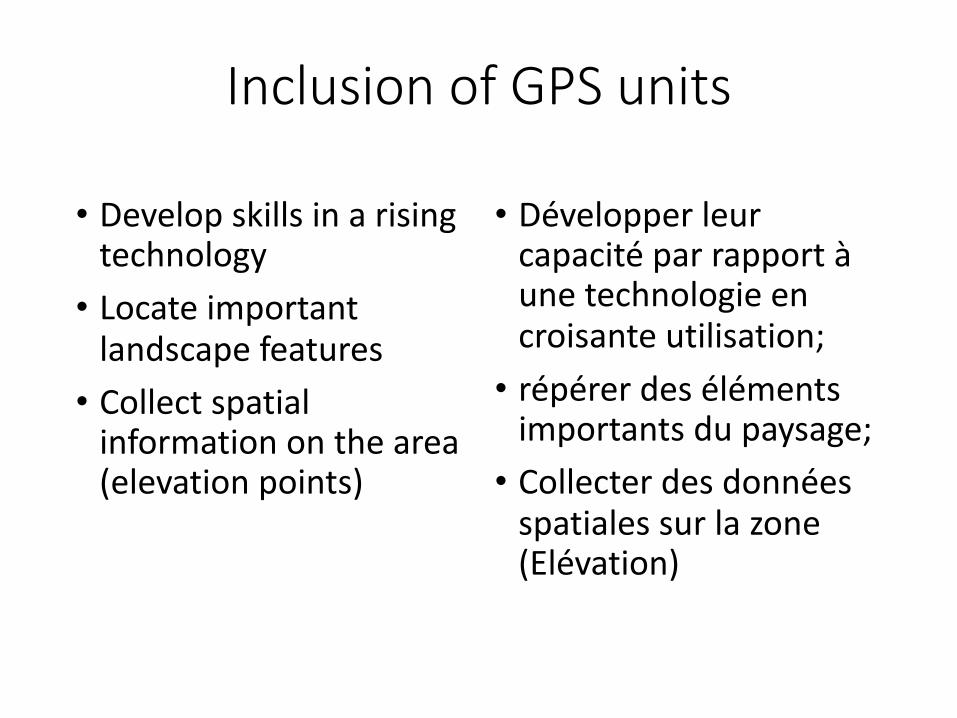
Inclusion of GPS units
• Develop skills in a risingtechnology
• Locate importantlandscape features
• Collect spatialinformation on the area(elevation points)
• Développer leurcapacité par rapport àune technologie encroisante utilisation;
• répérer des élémentsimportants du paysage;
• Collecter des donnéesspatiales sur la zone(Elévation)


DIGITAL ELEVATION MODEL (DEM)/SOURCES
INCLUSION OF DEM

SAGA
File Geoprocessing Map Window
�liill�H!l�Ol�I t [���� �I "@il� � I lo� IE]) Manager X
I� Tools l e Data i I@ Maps] liil 01. demfill
87800 787640 787880 787gzl) 87S60
� Tree �g Thumbnails
e Data EJ-� Grids 047.00 104S.OO 05 .00 052.00 05,.00 052.00 048.00
El 30; 889x 505y; 767219.990889x 2016880.379149y 0 0
01. demfill i 042.00 104,.00 1043.00 104 .00 036.00 Oltl.00 1003.00
; 'OOd.00 iOOA.00 0.1.00 028,00 1025.00 1023.00 1021.00
�
0 1022.00 1020.00 018.00 o i.oo 011.00 1008.00 j006.00
I 006.00 1 005.00 93;.0) 93-).00 3r,8.00 387.00 '187.00
ij
Data Sources X ! SS..00 983,00 375.0) 3 i.00 "67.00 .::66.00 970.00
� File System (ci ODBC I PostgreSQL I
c. Acer((:) 0
;;e,i;_oo 362.00 558.0) S57.0J 956.00 3�0.00 ."60.00
� 0 0 348.00 S43.00 S40.00 840.00 S4i.OO 843.00 ;;51.00
� 0 20 40 60 80 100 120 140 m.oo '124.00 924.00 m.oo S 8.00 .322.00 m.oo
1snro 181800 187840 787880 787gzl) 781560
Messages 0 General I,) Execution j O ErrorsJ i2018-02-08/18:34:05j Load librarjl: tools\climate_tools.dll . . cikay
I Recognised Files [2018-02-08/18:35:34) E•ecuting tool: Import ESRI Arc/Info Grid [2018-02-08/18:35:34) Tool execution succeeded
ready X 788119.948170 Y 2024391.012433
788000 7880-40
041.0!l Ol-4.00 028.00
028.00 1023.00 10 1 5.00
1016.00 10,00 0)4.00
1005.00 1002.00 338.00
351 .00 S"2.00 3S2.0il
978.00 3.2.00 366.00
.968.00 S76.00 '184.00
"34.00 378.00 587.00
;;,1.00 ;,10.00 387.00
188000 788040
Z 1019
�00� 788080
N o,
022.00 1018.00
0 0
00,.0) 010.00 i
00 .00 i007.00 6 �
1000.00 006.00
I ,;,;;.oo 1004.00
ij
390.00 1000.00
0
3&9.00 �98.00
� 9'5.00 1006.00
0 0
� SSS.00 1012.00
788080
�
"
Properties: 01. demfin a Settings I
a History 1a Legend
demfill
1800
1600
1400
1200
1000
800
600
400
200
0
- 1:11
X
0 Description
I J!IIAttributes

Legende
lilhologie
Alllwions, mateiriaux debitiq1.1es � Calcaires du:rs
� Ma:mes ,et cal'caires mmnel.lX
- Roches volamo-sedimentaires
(] 2.5 5
j
I 1 1
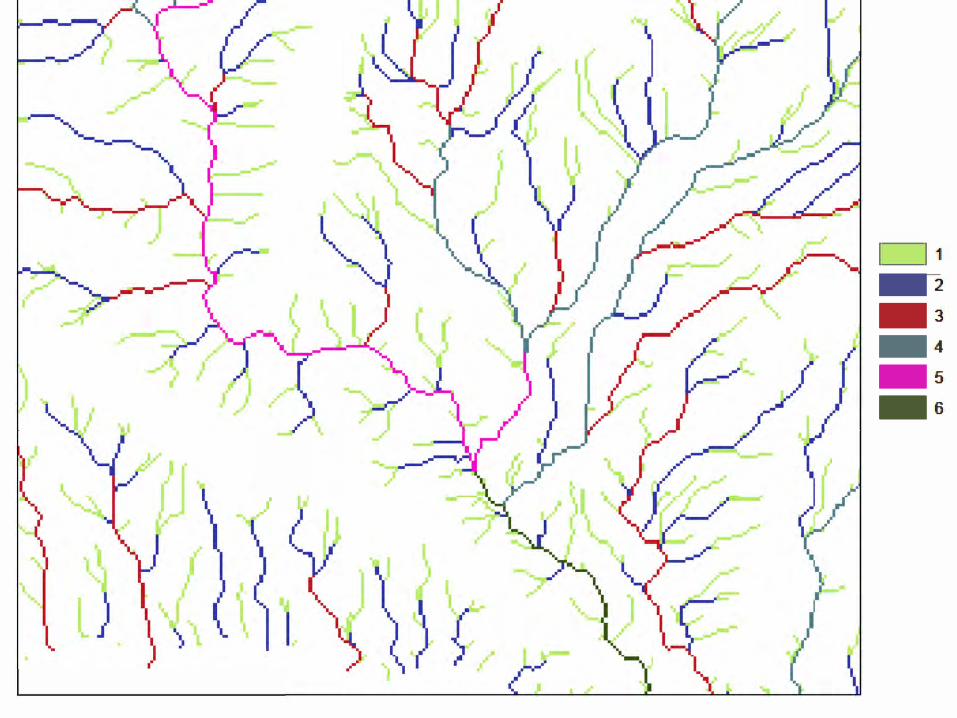
-2
-J-4
-5-6

DEM/MNT

c::, c::, c::,
M c::,
c::,
c::, c::, c::,
c::,
c::, c::, c::,
c::,

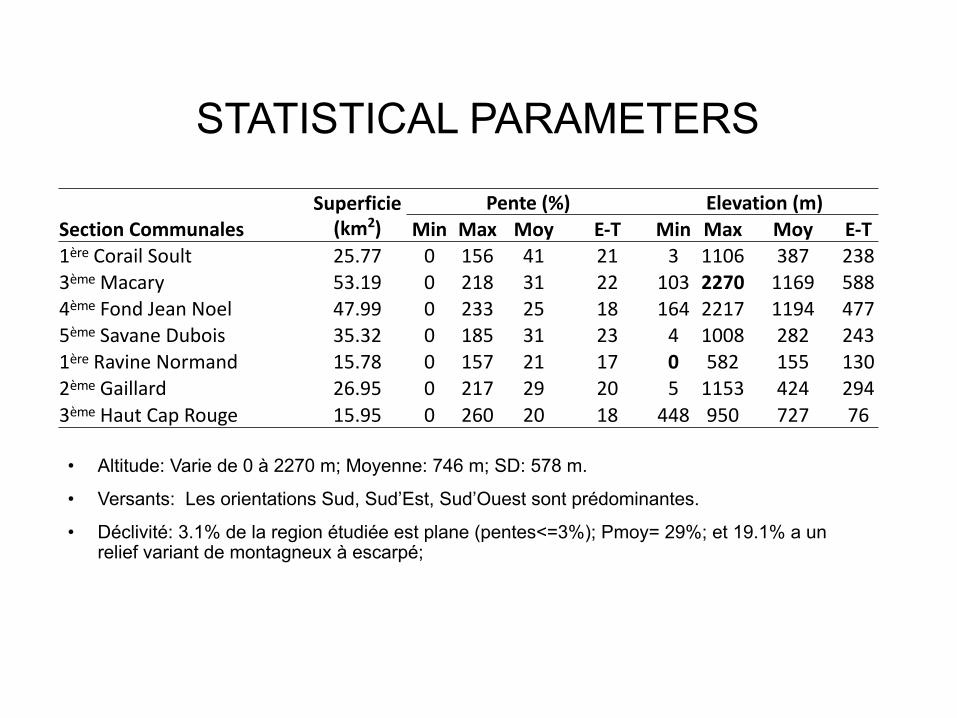
STATISTICAL PARAMETERS
• Altitude: Varie de 0 à 2270 m; Moyenne: 746 m; SD: 578 m.
• Versants: Les orientations Sud, Sud’Est, Sud’Ouest sont prédominantes.
• Déclivité: 3.1% de la region étudiée est plane (pentes<=3%); Pmoy= 29%; et 19.1% a unrelief variant de montagneux à escarpé;
Superficie(km2)
Pente (%) Elevation (m)Section Communales Min Max Moy E-T Min Max Moy E-T1ère Corail Soult 25.77 0 156 41 21 3 1106 387 2383ème Macary 53.19 0 218 31 22 103 2270 1169 5884ème Fond Jean Noel 47.99 0 233 25 18 164 2217 1194 4775ème Savane Dubois 35.32 0 185 31 23 4 1008 282 2431ère Ravine Normand 15.78 0 157 21 17 0 582 155 1302ème Gaillard 26.95 0 217 29 20 5 1153 424 2943ème Haut Cap Rouge 15.95 0 260 20 18 448 950 727 76

IMPACT OF SUCH WORK
• Increased awareness andinterest amongundergraduate students
• Basic landscapecharacteristics availablein advance
• Inform internshipcommittee of thelandscape heterogeneity.
• Prise de conscience etintérêt grandissant chezles étudiants;
• Prédéfinition desCaractéristiques dupaysage;
• Production d’informationpour la commission desstages en termesd’hétérogéneité dupaysage

CONCLUSION
• The use of GIS in diagnosticinternship was fundnecessary for thecharacterization and theunderstanding of processesoccurring in the landscape;
• Incorporation of GIS in theresearch for undergraduatethesis in order to generateuseful information foraddressing environmentalissues in Haiti.
• L’utilisation du SIG dans lestage diagnostic s’est révélénécessaire pour lacaractérisation et lacompréhension du paysage;
• L’incorporation du SIG dansles travaux de recherchedes étudiants de manière àproduire des informationsutiles pour juguler certainsproblèmesenvironnementaux du pays;