Embed Size (px)
Citation preview
PARTNERS FOR ADVANCED TRANSPORTATION TECHNOLOGYINSTITUTE OF TRANSPORTATION STUDIESUNIVERSITY OF CALIFORNIA, BERKELEY
Connected Corridors: I-210 Pilot Integrated Corridor Management System
Core System High-Level Design
November 29, 2017DRAFT
Partners for Advanced Transportation Technology works with researchers, practitioners, and industry to implement transportation research and innovation, including products and services that improve the efficiency, safety, and security of the transportation system.

I-210 Pilot: Core System High-Level Design
ii
This page left blank intentionally
I-210 Pilot: Core System High-Level Design
Table of Contents
1. Introduction...................................................................................................................................1
1.1. Purpose of Document.............................................................................................................1
1.2. Relation to Systems Engineering Process................................................................................1
1.3. Intended Audience.................................................................................................................2
1.4. Document Organization..........................................................................................................2
2. System Primary Objectives and Purpose.........................................................................................4
2.1. Project Goals and Objectives..................................................................................................5
2.2. Technical Capabilities Sought.................................................................................................7
3. High Level Design Objectives, Constraints, and Principles...............................................................8
4. Core System High Level Design.....................................................................................................10
4.1. Major Components...............................................................................................................10
4.2. Field Elements......................................................................................................................10
4.3. Data Hub...............................................................................................................................12
4.4. Decision Support...................................................................................................................13
4.5. Corridor Management..........................................................................................................14
4.6. Primary process flow............................................................................................................17
5. Data Hub Design...........................................................................................................................18
5.1. Data Sources.........................................................................................................................21
5.2. Data Pipelines.......................................................................................................................23
5.2.1. Sensing Data Pipeline..........................................................................................235.2.2. Caltrans Freeway Traffic Data Pipeline................................................................245.2.3. Heterogeneous Data Pipeline.............................................................................255.2.4. Homogenous Data Pipeline.................................................................................275.2.5. Pipeline Control...................................................................................................275.2.6. Pipeline Status and Logging................................................................................295.2.7. Corridor Management System-Decision Support System (CMS-DSS) Pipeline....305.2.8. CMS Command Status Pipeline...........................................................................34
5.3. External Interface/Data Gateway.........................................................................................35
5.3.1. Subscription endpoints.......................................................................................375.3.2. Request/Response endpoints.............................................................................37
5.4. Data Hub Command Gateway..............................................................................................37
5.4.1. Conductor...........................................................................................................38
iii

I-210 Pilot: Core System High-Level Design
5.4.2. Camel..................................................................................................................395.4.3. ActiveMQ Workflow Status Topic.......................................................................395.4.4. ActiveMQ Workflow Task Topic..........................................................................395.4.5. Monitor...............................................................................................................39
6. Decision Support System Design...................................................................................................39
6.1. DSS high level design............................................................................................................40
6.2. Response Plan Management................................................................................................41
6.3. Rules Engine..........................................................................................................................43
6.4. Modeling...............................................................................................................................43
6.4.1. Modeling techniques..........................................................................................43
iv
I-210 Pilot: Core System High-Level Design
1. INTRODUCTION
This Connected Corridors High Level Design document provides the high level system architecture for the system to be deployed on the I-210 corridor. The system architecture described here is a direct result of the Connected Corridors System Requirements document and the work done at UC Berkeley in traffic modeling and control. This document provides the system architecture, high level design of the primary subsystems, the decisions, assumptions, constraints, and reasoning behind that architecture, and critical functions each subsystem provides for the system.
The system, to be piloted along a section of the I-210 corridor in the San Gabriel Valley area of Los Angeles County, aims to improve overall corridor performance during incidents, unscheduled events, and planned events. This is to be achieved by more efficiently managing existing systems and infrastructures, promoting cross-jurisdictional operations, and using multi-modal traffic and demand management strategies that consider all relevant modes of transportation.
1.1. PURPOSE OF DOCUMENT
This document provides the high level design, serving as the identification of the primary subsystems and major components as well as the basis for the selection, development, and integration of these into a system that satisfies the system requirements as defined in the Systems Requirements Document. This high level design will govern the technology platform and direction of the I-210 Pilot ICM System and serve as the basis for other Caltrans-led ICM efforts statewide.
1.2. RELATION TO SYSTEMS ENGINEERING PROCESS
The development of high level design is part of the systems engineering process that the Federal Highway Administration (FHWA) requires be followed for developing Intelligent Transportation System (ITS) projects when federal funds are involved. While not required for projects only using state or local funds, use of the systems engineering process is still encouraged in such cases.
The overall systems engineering process is illustrated in Figure 1-1. Developing high level design represents the next step of the System Definition and Design phase of a project (Phase 2 in the figure) following the completion of the System Requirements. High Level Design is typically derived from the requirements. The resulting design elements are in turn used to inform and guide the more detailed design of the various system and subsystem components.
1

I-210 Pilot: Core System High-Level Design
System Validation / Strategy Plan
System Verification Plan(System Acceptance)
Sub-system Verification Plan
(Subsystem Acceptance)
Unit/Device Test Plan
Systems Requirements
Document
Design Documents
Concept of Operations Document
Figure 1-1 – System Requirements Specification within Systems Engineering Process
1.3. INTENDED AUDIENCE
The primary audience for the System High Level Design document includes personnel responsible for designing and implementing the ICM system. The audience also includes individuals from Caltrans District 7, Caltrans Headquarters, and the University of California, Berkeley, tasked with project management duties.
1.4. DOCUMENT ORGANIZATION
The remainder of this document is organized as follows:
Section 2 summarizes the primary system objectives identified within the System Requirements that shape the system design.
Section 3 presents the primary guiding design principles and base assumptions that shape the system design.
Section 4 presents the key system design components and primary data flows.
Section 5 presents the key system components of the Data Hub including data sources, interfaces/gateways and pipelines.
2

I-210 Pilot: Core System High-Level Design
Section 6 presents the key system components of the Decision Support System (DSS) including the rules engine, modeling interfaces, and response plan generation.
Section 7 presents key security design issues and implementation plans.
Section 8 provides design information for the messaging systems and describes how information is passed between subsystems.
Section 9 describes the system interfaces.
In addition, other supporting documents are available in the Document Library of the I-210 Pilot website at http://ccdocs.berkeley.edu/content/document-library:
3
I-210 Pilot: Core System High-Level Design
2. SYSTEM PRIMARY OBJECTIVES AND PURPOSE
The overriding purpose of the I-210 Pilot is to reduce congestion and improve mobility along a section of the I-210 corridor in Los Angeles County through the coordinated management of its major networks: the I-210 freeway, key surrounding arterials, and local and regional transit services. The goal is to enable all corridor “actors”—transportation system managers and operators, control systems, vehicles, and travelers—to work together in an efficient and coordinated way.
These improvements will be achieved by developing and deploying the ICM system described in this high level design document. At the heart of the proposed system will be a Decision Support System (DSS) designed to help corridor system operators manage incidents, unscheduled events, and planned events more effectively. This system will use information gathered from monitoring systems and provided by predictive analytical tools to estimate current and near-future operational performance. The information will be used to develop recommended courses of action to address problems caused by identified incidents and events. More specifically, this system is expected to:
Improve real-time monitoring of travel conditions within the corridor Enable operators to better characterize travel patterns within the corridor and across systems Provide predictive traffic and system performance capabilities Be able to evaluate alternative system management strategies and recommend desired courses
of action in response to planned events, unscheduled events, and incidents Improve decision-making by transportation system managers Improve collaboration among agencies operating transportation systems in the corridor Improve the utilization of existing infrastructure and systems More efficiently use spare capacity to address non-recurring congestion Reduce delays and travel times along freeways and arterials Improve travel time reliability Help reduce the number of accidents occurring along the corridor Reduce the period during which the congestion resulting from an incident or event affects
corridor operations Reduce greenhouse gas emissions Generate higher traveler satisfaction rates Increase the overall livability of communities in and around the I-210 corridor
While development of the proposed system is under the financial sponsorship of Caltrans Headquarters, the system will be developed primarily by the local transportation agencies that have agreed to participate in its operation, in coordination with PATH. Project activities will include the design, development, installation, testing, and operation of various components of the ICM system, as well as the development of interfaces with existing monitoring and control systems. For example, the ICM Core System will be interfaced with traffic management systems owned by Caltrans, such as the Advanced Traffic Management System (ATMS).
4

I-210 Pilot: Core System High-Level Design
2.1. PROJECT GOALS AND OBJECTIVES
The primary goal of the I-210 Pilot ICM project is to improve overall corridor performance along a section of the I-210 corridor. This translates into the following specific goals:
1. Improve operational situational awareness2. Promote collaboration among corridor stakeholders3. Improve response to incidents and events4. Improve travel reliability5. Improve overall corridor mobility6. Empower travelers to make informed travel decisions7. Facilitate multi-modal movements across the region8. Promote transportation sustainability by reducing impacts on the environment9. Improve corridor safety
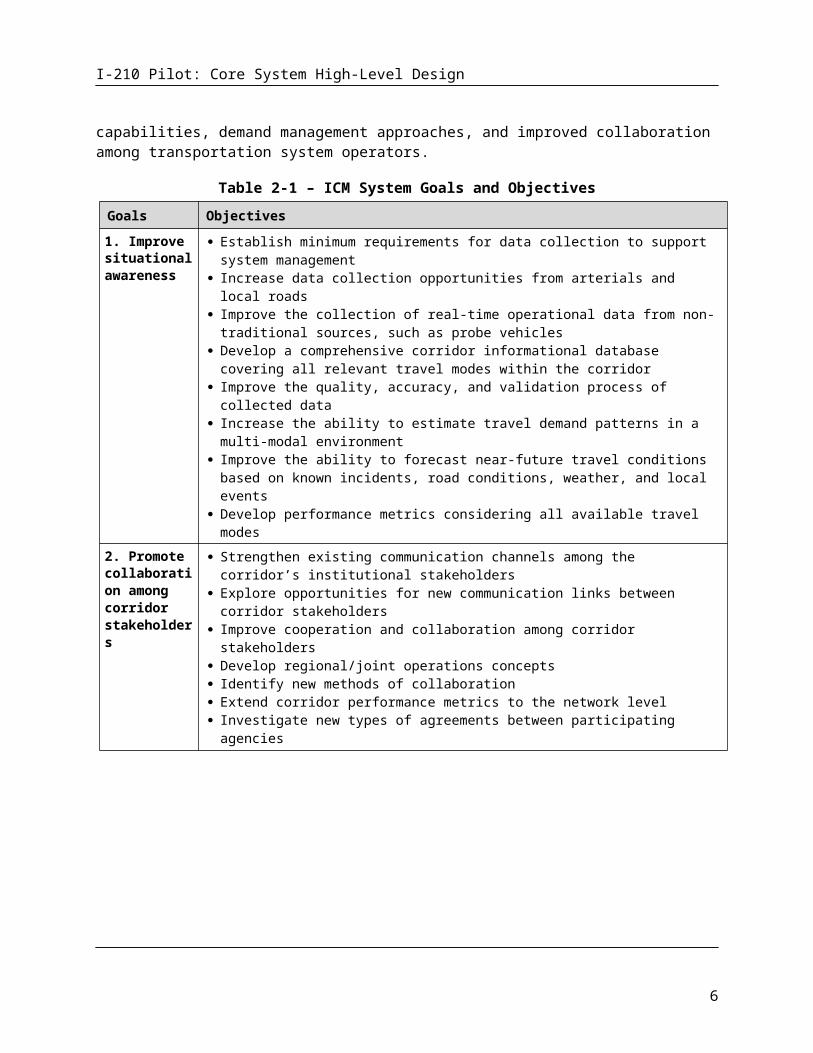
For each of these goals, Table 2-1 further identifies the main operational objectives. Many of the objectives are similar to those of traditional transportation improvement projects. Many, however, also focus on implementing more comprehensive travel and system status monitoring systems, improved operational forecasting, improved information dissemination to travelers, enhanced data-sharing capabilities, demand management approaches, and improved collaboration among transportation system operators.
Table 2-1 – ICM System Goals and Objectives
Goals Objectives
1. Improve situational awareness
Establish minimum requirements for data collection to support system management Increase data collection opportunities from arterials and local roads Improve the collection of real-time operational data from non-traditional sources, such as
probe vehicles Develop a comprehensive corridor informational database covering all relevant travel modes
within the corridor Improve the quality, accuracy, and validation process of collected data Increase the ability to estimate travel demand patterns in a multi-modal environment Improve the ability to forecast near-future travel conditions based on known incidents, road
conditions, weather, and local events Develop performance metrics considering all available travel modes
2. Promote collaboration among corridor stakeholders
Strengthen existing communication channels among the corridor’s institutional stakeholders Explore opportunities for new communication links between corridor stakeholders Improve cooperation and collaboration among corridor stakeholders Develop regional/joint operations concepts Identify new methods of collaboration Extend corridor performance metrics to the network level Investigate new types of agreements between participating agencies
5
I-210 Pilot: Core System High-Level Design
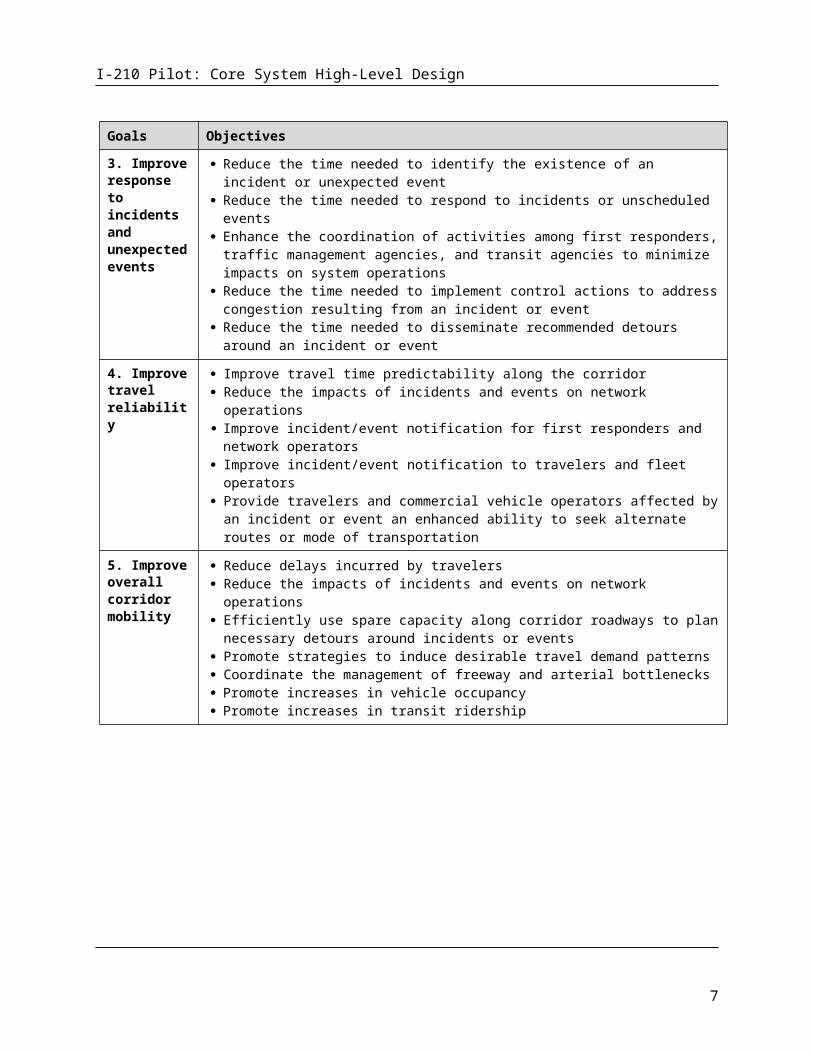
Goals Objectives
3. Improve response to incidents and unexpected events
Reduce the time needed to identify the existence of an incident or unexpected event Reduce the time needed to respond to incidents or unscheduled events Enhance the coordination of activities among first responders, traffic management
agencies, and transit agencies to minimize impacts on system operations Reduce the time needed to implement control actions to address congestion resulting from
an incident or event Reduce the time needed to disseminate recommended detours around an incident or event
4. Improve travel reliability
Improve travel time predictability along the corridor Reduce the impacts of incidents and events on network operations Improve incident/event notification for first responders and network operators Improve incident/event notification to travelers and fleet operators Provide travelers and commercial vehicle operators affected by an incident or event an
enhanced ability to seek alternate routes or mode of transportation
5. Improve overall corridor mobility
Reduce delays incurred by travelers Reduce the impacts of incidents and events on network operations Efficiently use spare capacity along corridor roadways to plan necessary detours around
incidents or events Promote strategies to induce desirable travel demand patterns Coordinate the management of freeway and arterial bottlenecks Promote increases in vehicle occupancy Promote increases in transit ridership
6. Empower system users to make informed travel decisions
Improve the dissemination of real-time, multi-modal travel information Enhance the use of infrastructure-based informational devices (freeway CMS, arterial
trailblazer signs, kiosks, etc.) to provide en-route information to travelers Enable individuals to receive travel information on connected mobile devices Make archived historical data available to 511 services and information service providers Support the dissemination of travel information by 511 services and third-party providers
7. Facilitate regional multi-modal movements
Promote the integration of commuter rail and bus services with corridor operations Facilitate transfers across modes during incidents and events Provide relevant regional travel information to travelers Direct travelers to park-and-ride facilities with available spaces
8. Promote transportation sustainability
Reduce fuel consumption Reduce vehicle emissions Identify financially sustainable solutions for long-term system operations and maintenance Encourage the use of transit, walking, and bicycling where appropriate Support locally preferred alternatives compatible with corridor objectives Develop and implement performance metrics reflecting environmental goals
9. Improve corridor safety
Reduce collision rates Reduce the severity of collisions Reduce the number of fatalities Reduce the impacts of primary and secondary incidents on network operations through
improved incident management Improve safety for bicycles, pedestrians, and transit
6
I-210 Pilot: Core System High-Level Design
2.2. TECHNICAL CAPABILITIES SOUGHT
To help manage travel activities within the corridor during incidents, unscheduled events, and planned events, the project is seeking the following technical capabilities to support the goals and objectives identified in Section 2.1:
Gather and archive information characterizing traffic operations, transit operations, and the operational status of relevant control devices within the I-210 corridor.
Identify unusual travel conditions on the I-210 freeway or nearby arterials based on monitoring data provided by various traffic, transit, and travel monitoring systems.
Identify situations in which an incident on roadways or transit facilities significantly affects travel conditions within the corridor.
Provide corridor-wide operational evaluations to traffic managers, transit dispatchers, and other relevant system managers, including projected assessments of near-future system operations under current and alternate control scenarios.
Identify recommended detours around incidents or routes leading to the site of an event, considering observed travel conditions within the corridor. Depending on the need, and final system capabilities, specific detours may be recommended for motorists and transit vehicles.
Identify recommended signal timing plans to use at signalized intersections to improve and/or accommodate traffic flow influx during incidents and events and improve overall corridor mobility.
Identify recommended ramp metering rates to use on individual I-210 freeway on-ramps and connectors to maintain overall corridor mobility.
Identify messages to post on available freeway and arterial CMSs to inform motorists of incidents and events.
Provide guidance to motorists on the I-210 freeway and surrounding arterials using available freeway CMSs, arterial CMSs, and arterial dynamic trailblazer signs regarding which detour to take to go around an incident or which route to follow to reach the site of an event.
Provide information to motorists about the availability of parking and transit services to help travelers make alternate mode-choice decisions.
Provide uniform traffic management strategies across jurisdictional boundaries during incidents and events.
Provide information to motorists through third-party outlets, such as 511 services, navigation application providers, etc.
7

I-210 Pilot: Core System High-Level Design
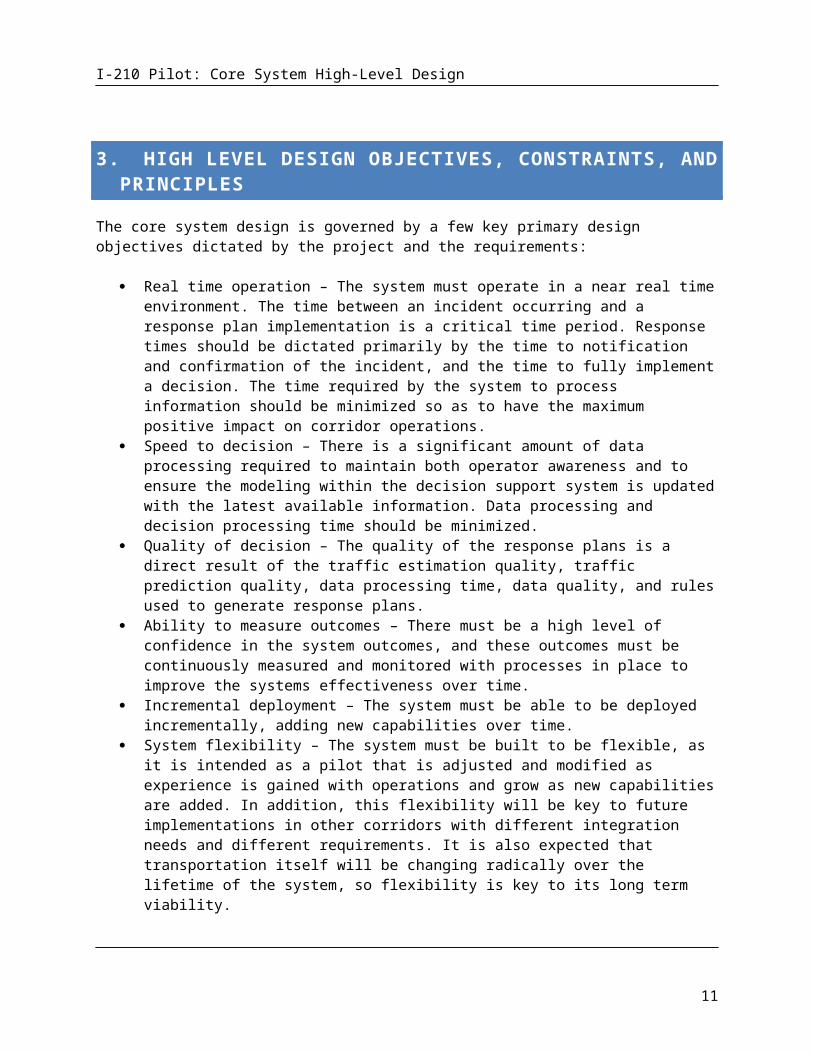
3. HIGH LEVEL DESIGN OBJECTIVES, CONSTRAINTS, AND PRINCIPLES
The core system design is governed by a few key primary design objectives dictated by the project and the requirements:
Real time operation – The system must operate in a near real time environment. The time between an incident occurring and a response plan implementation is a critical time period. Response times should be dictated primarily by the time to notification and confirmation of the incident, and the time to fully implement a decision. The time required by the system to process information should be minimized so as to have the maximum positive impact on corridor operations.
Speed to decision – There is a significant amount of data processing required to maintain both operator awareness and to ensure the modeling within the decision support system is updated with the latest available information. Data processing and decision processing time should be minimized.
Quality of decision – The quality of the response plans is a direct result of the traffic estimation quality, traffic prediction quality, data processing time, data quality, and rules used to generate response plans.
Ability to measure outcomes – There must be a high level of confidence in the system outcomes, and these outcomes must be continuously measured and monitored with processes in place to improve the systems effectiveness over time.
Incremental deployment – The system must be able to be deployed incrementally, adding new capabilities over time.
System flexibility – The system must be built to be flexible, as it is intended as a pilot that is adjusted and modified as experience is gained with operations and grow as new capabilities are added. In addition, this flexibility will be key to future implementations in other corridors with different integration needs and different requirements. It is also expected that transportation itself will be changing radically over the lifetime of the system, so flexibility is key to its long term viability.
Secure operations – As the system has the capability to request changes to traffic controls across a large, complex urban corridor, security of the system is critical to its success.
Core system design is limited by the following constraints:
Ability to be operated and maintained by Caltrans without significant licensing costs – The system must be designed with open source components as much as possible. It is not desired to have significant licensing costs required for subsequent deployments for future corridors or over long periods of time. It is intended that Caltrans will be capable of deploying, maintaining, and operating this and future deployments.
Limited time to deploy – The deployment schedule is aggressive, creating the need to ensure significant reusability within the design so that multiple data sources can be incorporated into the system without designing new data pipelines for each one.
8

I-210 Pilot: Core System High-Level Design
Constrained development resources – Caltrans provided a fixed amount of funding so the system design must not exceed our resources with complexity and additional features.
These core design objectives and constraints are implemented with the following design principles:
Cloud development, deployment, and operations – In order to achieve maximum flexibility in both system development and future configurations, minimize resource utilization in development and deployment, and minimize deployment time, the core system is designed for 100% cloud operations within an Amazon AWS cloud environment.
The system is a pilot system and it expected that as we learn from the deployment of the system changes will be needed and recommended.
The system shall be capable of being supported by Caltrans internal resources. Decisions produced in the form of response plans shall be based on current corridor information
with limited delays in information processing. Data maintained within the core system will be limited to the data required for system
operation. Long term data storage shall be a function of PeMS. The system will be designed for future growth, incremental improvements, future
transportation system changes, changes in transportation itself, geographic changes, and new and updated information sources and needs.
Ease of deployment Ease of maintenance Portability of the system design and components to other corridors Highly decoupled design for flexibility, scalability, redundancy, and reliability Use available data standards whenever possible Standardized external interfaces for ease of portability and inclusion of new subsystems Maintenance of a separation of concerns between data management, decision support, and
control functions. Design with state, regional, and local layers for future scalability and standardized deployment
across the state.
9

I-210 Pilot: Core System High-Level Design
4. CORE SYSTEM HIGH LEVEL DESIGN
The core system high level design is illustrated in Figure 4-2. This high level design provides clear separation between external systems providing data and receiving control requests (green), the data hub receiving and processing information from those external systems (red), decision support providing response plans for incidents (blue), and the corridor management system providing user interface, response plan selection and approval, and sending of control requests to external systems (purple).
Figure 4-2 Core System High Level Design
4.1. MAJOR COMPONENTS
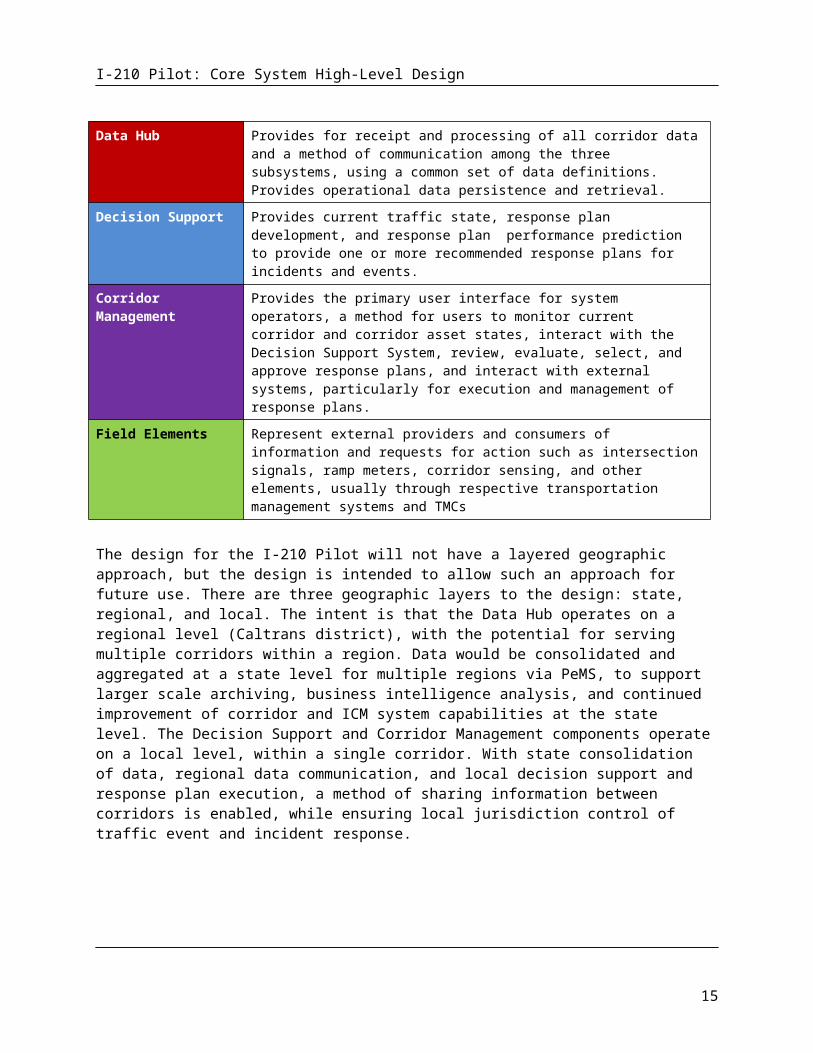
As shown in Figure 4-2, the ICM Core System is composed of three major subsystems: the Data Hub, the Decision Support System, and the Corridor Management subsystem. These subsystems, plus the external field elements the Core System interacts with, are summarized in the following table (color-coded to match Figure 4-2) and described in detail in the following pages.
Component Description
Data Hub Provides for receipt and processing of all corridor data and a method of communication among the three subsystems, using a common set of data definitions. Provides operational data persistence and retrieval.
Decision Support Provides current traffic state, response plan development, and response plan performance prediction to provide one or more recommended response plans for incidents and events.
Corridor Management Provides the primary user interface for system operators, a method for users to monitor current corridor and corridor asset states, interact with the Decision
10
I-210 Pilot: Core System High-Level Design
Support System, review, evaluate, select, and approve response plans, and interact with external systems, particularly for execution and management of response plans.
Field Elements Represent external providers and consumers of information and requests for action such as intersection signals, ramp meters, corridor sensing, and other elements, usually through respective transportation management systems and TMCs
The design for the I-210 Pilot will not have a layered geographic approach, but the design is intended to allow such an approach for future use. There are three geographic layers to the design: state, regional, and local. The intent is that the Data Hub operates on a regional level (Caltrans district), with the potential for serving multiple corridors within a region. Data would be consolidated and aggregated at a state level for multiple regions via PeMS, to support larger scale archiving, business intelligence analysis, and continued improvement of corridor and ICM system capabilities at the state level. The Decision Support and Corridor Management components operate on a local level, within a single corridor. With state consolidation of data, regional data communication, and local decision support and response plan execution, a method of sharing information between corridors is enabled, while ensuring local jurisdiction control of traffic event and incident response.
4.2. FIELD ELEMENTS
Green elements in Figure 4-2 represent the various corridor field data sources and field element controls, including various state, regional, and local transportation systems, regional transportation data networks, and private information providers.
On the left side of the diagram, these elements represent the various data sources for information consumed and processed by the ICM system.
On the right side, these represent the various control interfaces to execute response plan elements selected by operators of the ICM system.
The systems that will be providing the data within the I-210 corridor include:
Table 4-2 – FIELD SYSTEMS
Source Information TypePasadena TMC* Pasadena intersection signalsArcadia TMC* Arcadia intersection signalsCounty TMC* LA County intersection signals
Duarte intersection signalsMonrovia intersection signals
Caltrans ATMS** Freeway loop sensing (traffic)Ramp metersDynamic message systemIncident information
11

I-210 Pilot: Core System High-Level Design
Caltrans LCS* Lane closuresCaltrans TSMSS* Intersection signalTrailblazer System* Dynamic message system for reroutingRIITS Local video
Caltrans videoCalPoly ODS Environmental sensing
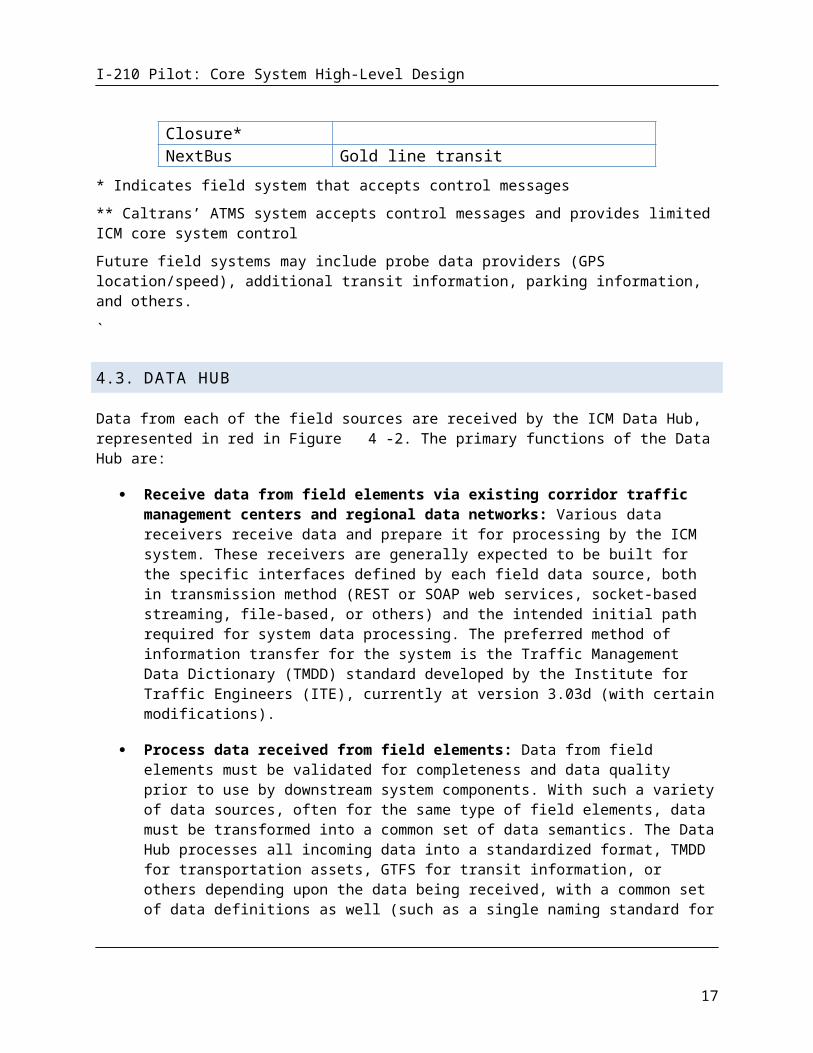
TransitHSR Lane Closure* City lane closuresNextBus Gold line transit
* Indicates field system that accepts control messages
** Caltrans’ ATMS system accepts control messages and provides limited ICM core system control
Future field systems may include probe data providers (GPS location/speed), additional transit information, parking information, and others.
`
4.3. DATA HUB
Data from each of the field sources are received by the ICM Data Hub, represented in red in Figure 4-2. The primary functions of the Data Hub are:
Receive data from field elements via existing corridor traffic management centers and regional data networks: Various data receivers receive data and prepare it for processing by the ICM system. These receivers are generally expected to be built for the specific interfaces defined by each field data source, both in transmission method (REST or SOAP web services, socket-based streaming, file-based, or others) and the intended initial path required for system data processing. The preferred method of information transfer for the system is the Traffic Management Data Dictionary (TMDD) standard developed by the Institute for Traffic Engineers (ITE), currently at version 3.03d (with certain modifications).
Process data received from field elements: Data from field elements must be validated for completeness and data quality prior to use by downstream system components. With such a variety of data sources, often for the same type of field elements, data must be transformed into a common set of data semantics. The Data Hub processes all incoming data into a standardized format, TMDD for transportation assets, GTFS for transit information, or others depending upon the data being received, with a common set of data definitions as well (such as a single naming standard for all streets within the corridor). However, it is critical to note that this transformation into a standardized format for processing within the data hub, while it maintains the data structures within TMDD, does not generally maintain an XML data format and internal communications within the data hub (and the DSS) do not use SOAP protocols. The data hub and DSS use JMS protocols, either within an ActiveMQ or Kafka messaging system.
12

I-210 Pilot: Core System High-Level Design
Additional processing is also completed within the data hub, either for specific metrics, calculated parameters, or predictive analytics.
Data messaging and communications: Data provided to downstream systems, as well as internal system command, control, and status data—indeed, all data within the ICM system—is made available via an internal data bus. The method of data transport is via data messaging technologies, namely ActiveMQ JMS messaging or Kafka data messaging systems. The specific message technology is based on the type, size, frequency, and message persistence requirements of the data, data producer, and data consumers. Exceptions to these methods within the data hub are limited, and are generally used for large block bulk data archiving/data transport between persistence stores. In order to accommodate multiple CMS vendors, and to provide communication between the data hub’s Kafka messaging system and the DSS ActiveMQ messaging system, an Apache Camel based interface between the data hub and the DSS and CMS systems is included within the data hub. This interface provides the ability to provide SOAP and REST based interfaces as necessary, and translation between messaging systems.
Data persistence: The Data Hub also provides data persistence capabilities, allowing for persistence of raw and processed data, system command/control/status, and other system information in a central repository. This data persistence is broken into different time layers, including live real-time data, young data (0-90 days), aggregated data, and archived data. It includes leveraging state EDW and BI resources as a component of the data persistence capabilities, specifically as the single data store for non-operational data (data older than 90 days). Since data persistence within the data hub is limited to operational uses, and the architecture is based on a pattern of core services connected by messaging, multiple data persistence technologies are utilized specific to the needs of the system and the data being stored. Large time series collections of data, such as sensor data, is maintained in a Cassandra database; large relational structures with smaller update frequencies are maintained within a Postgres database, and MongoDB is used within data translation pipelines when multiple sources provide the same type of information in differing formats and implementations. NOTE: MongoDB may be used in development and early versions of the system instead of Postgres for some of the relational data stores.
4.4. DECISION SUPPORT
The Decision Support System, portrayed in blue in Figure 4-2, provides the following capabilities:
Corridor traffic state determination: The Decision Support System provides corridor traffic state estimation, providing both geospatial traffic state information and traffic state metrics. Separate arterial and freeway traffic models are used and merged to provide full corridor traffic state at all times.
Corridor traffic state prediction: The Decision Support System provides corridor traffic state predictions for use by corridor operators and for prediction of incident and event response plan performance. A commercial simulation engine (TSS Aimsun) is used to provide traffic
13

I-210 Pilot: Core System High-Level Design
predictions. Traffic predictions are generated using the traffic estimated state as an initial traffic state, and current corridor asset state from the data hub.
Response plan development and evaluation: The Decision Support System, upon notification of a confirmed incident, will use a rules-based approach along with traffic state estimation and prediction capabilities to develop, evaluate, and rank response plans for use by corridor operators.
4.5. CORRIDOR MANAGEMENT
The Corridor Management subsystem, portrayed in purple in Figure 4-2, shall provide the following primary capabilities:
Presentation of corridor state: Display of corridor state, including corridor assets (signals, ramps, cameras, dynamic messaging, transit, etc.), traffic estimated state, traffic visualization (camera output), human assets, physical assets (vehicles, response crews). Asset state includes current operational capabilities, current operating state, current functional state (operating, failed, degraded states), time availability, controllability, etc.
Control of corridor assets: The Corridor Management subsystem provides the capability to control corridor assets, taking response plans approved for execution and executing each of the individual response plan elements by sending commands to the appropriate state, regional, and local systems and entities. The Corridor Management subsystem does not directly control corridor assets, but only sends commands to the state, regional, or local systems that directly command corridor assets.
Presentation of response plans: The Corridor Management subsystem presents each response plan developed by the Decision Support System, displaying in meaningful ways the various response plan elements, how they will change from the current corridor state, how they change during response plan execution, what the predicted outcomes are for each response plan, what the actual outcomes are for a response plan, as well as the various metrics on how the response plans are evaluated and their effectiveness measured. This presentation is expected to be in multiple domains, including geospatial, tabular, comparative, graphical, and other solution-specific methods.
Response plan lifecycle management: Each response plan developed by the system has a specific lifecycle that includes:
1. Initiation2. Development3. Evaluation4. Selection5. Approval
6. Execution7. Monitoring8. Close9. Post-incident/event analysis
14
I-210 Pilot: Core System High-Level Design
The Corridor Management subsystem provides a management interface for this lifecycle:
Initiation The Corridor Management subsystem presents incident and event information received from the Data Hub for review, edit, and confirmation by the corridor operators.
Development The Corridor Management system provides display of status information received from the Decision Support System (DSS) regarding its decision to develop a set of response plans to an incident or event, as well as the development of those response plans. In addition, it can send commands to the Decision Support System to initiate specific DSS functions, such as mock incident evaluation, manual response plan development or evaluation, or other functions required for the ICM system.
Evaluation The Corridor Management subsystem receives the results of response plan evaluation and traffic state prediction and displays those results, along with the response plans, to the corridor user. Display shall include individual plan analysis, as well as ranking and comparative analysis of response plans.
Selection The Corridor Management subsystem provides the user the capability to select a specific response plan for subsequent approval and implementation.
Modification The Corridor Management subsystem shall provide users the ability to make minor modifications to response plans. NOTE: Initial versions of the software will not have this capability.
Approval The Corridor Management subsystem provides a selected response plan to the corridor stakeholders at the state, regional, and local levels for review and approval. These approvals shall include minor modifications to the response plan and may include reevaluation and resubmittal for approval.
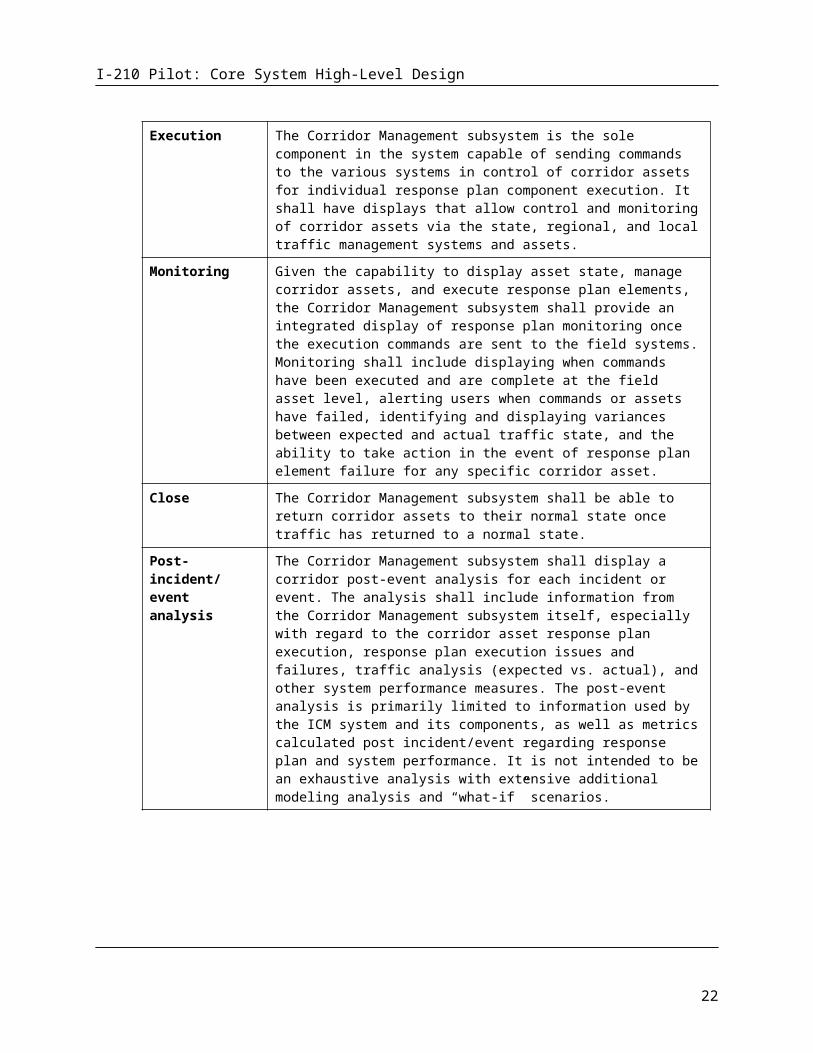
Execution The Corridor Management subsystem is the sole component in the system capable of sending commands to the various systems in control of corridor assets for individual response plan component execution. It shall have displays that allow control and monitoring of corridor assets via the state, regional, and local traffic management systems and assets.
Monitoring Given the capability to display asset state, manage corridor assets, and execute response plan elements, the Corridor Management subsystem shall provide an integrated display of response plan monitoring once the execution commands are sent to the field systems. Monitoring shall include displaying when commands have been executed and are complete at the field asset level, alerting users when commands or assets have failed, identifying and displaying variances between expected and actual traffic state, and the ability to take action in the event of response plan element failure for any specific corridor asset.
Close The Corridor Management subsystem shall be able to return corridor assets to their normal state once traffic has returned to a normal state.
Post-incident/event analysis
The Corridor Management subsystem shall display a corridor post-event analysis for each incident or event. The analysis shall include information from the Corridor Management subsystem itself, especially with regard to the corridor asset response plan execution, response plan execution issues and
15

I-210 Pilot: Core System High-Level Design
failures, traffic analysis (expected vs. actual), and other system performance measures. The post-event analysis is primarily limited to information used by the ICM system and its components, as well as metrics calculated post incident/event regarding response plan and system performance. It is not intended to be an exhaustive analysis with extensive additional modeling analysis and “what-if” scenarios.
ICM System management: The Corridor Management subsystem provides management capabilities for the ICM system, including:
Rules management The Corridor Management subsystem provides a user interface for the management of the rules used within the rules engine. This will include the ability to create basic rules and rule sets, edit rules and rule sets, archive rules and rule sets, provide configuration management for rules and rule sets, make rules active, execute rules and rule sets, and import rules and rule sets. Generally, rules that can be edited will be simpler rules and rules sets, as more complex rules are likely to require professional development effort and integration. NOTE: The initial implementation of the system will not include this capability.
Response plan management
The Corridor Management subsystem provides users the ability to update the available response plans and response plan elements. This includes adding, archiving, updating, and activation or deactivation of response plans or response plan elements for use within the corridor.
System monitoring The Corridor Management subsystem provides users the ability to monitor the ICM system and components. Systems logs, alerts, status information, control and execution of system functions shall be accomplished by the Corridor Management subsystem.
Security The Corridor Management subsystem provides user authentication and authorization for the Corridor Management subsystem and all functions available within the Corridor Management subsystem that affect other ICM system functions, including Decision Support and the Data Hub. This does not include user authentication and authorization of individual components such as Cassandra, Postgres, or messaging; rather, it provides these services for the functions that use those components.
Configuration The Corridor Management subsystem provides methods and interface for allowing users to change any and all configuration elements within the ICM system. As with security, this does not include configuration of individual system components such as Cassandra and Postgres, but rather for the functions that use these components. NOTE: The initial implementation of the system will have minimal capabilities for this function.
16
I-210 Pilot: Core System High-Level Design
4.6. PRIMARY PROCESS FLOW
Figure 4-3 provides the primary system workflow illustrating the basic integration between each of the subsystems. While this illustration is not intended to capture all of the details of the interactions between systems, and the process lifetimes are not intended to be accurate within this sequence diagram, it does provide the basic sequence of events and primary communication channels for the primary workflow within the system, a response to an incident on the corridor. Secondary actions such as persistence, logging, communication dialogs, and others are not depicted in this diagram. Also note that, as described in Figure 4-2, all communication between the DSS and CMS is via the Data Hub’s data bus, although the specifics of the communication channel are not illustrated in Figure 4-3.
Figure 4-3 Primary System Incident Flow (Subsystem)
The basic workflow described in this diagram is as follows:
An incident occurs within the corridor. The diagram shows the incident information being processed through the data hub.
The incident is confirmed by an operator within the CMS or Caltran’s ATMS. The initial pilot system will always use an operator to confirm an incident.
17

I-210 Pilot: Core System High-Level Design
The incident information is passed to the DSS’s response plan development component. The response plan development component requests a prediction of the impact of the incident
on the corridor. The prediction engine uses the current estimated traffic state and corridor traffic state to
initialize and run a prediction with no response plan execution (“do nothing” prediction). The response plan development component uses the “do nothing” prediction and the rules
engine to determine if a response plan should be developed. If the result is no response plan should be developed, execution of the workflow would end with notification to the CMS of that result.
If the result is that a response plan should be developed, the response plan development component again uses the rules engine, results of the “do-nothing” prediction, current corridor state, and a set of fixed response plan components to develop a limited number of response plans for evaluation. It submits those response plans to the prediction engine.
The prediction engine runs a prediction for each response plan, along with another “do nothing” prediction” based on current corridor conditions. It provides the results of those predictions to the response plan development component.
The response plan development component uses the results of each prediction, current corridor state, and the rules engine to evaluate, rank, and select a recommended response plan.
The results of response plan predictions and evaluation is provided to the CMS for operator selection.
The CMS provides the results to an operator, who selects the response plan to be implemented and obtains approval for the response plan implementation.
If the response plan is approved, the CMS executes the response plan by submitting C2C commands to the TMCs and other systems required to execute commands to individual corridor assets.
The individual TMCs and other systems executing the response plan commands report the success or failure to execute the desired response plan elements, and continue to report corridor asset state.
Upon completion of this primary workflow, further processes involved in response plan lifecycle management will occur, such as response plan evaluation, response plan generation to adjust to current conditions, response plan cancellation, and response plan closeout.
5. DATA HUB DESIGN
The data hub has five primary roles within the system:
1. Receive information from external providers of corridor state2. Process information received from providers of corridor state, evaluating the data for quality,
providing common metrics and analysis of the data received, conducting predictive analytics to support estimation and prediction within the DSS, and standardizing the format and content for downstream consumption by the DSS and CMS systems.
3. Persist information received, results of processing, and overall system state and command information. Persist operationally required information locally and send to archive older
18

I-210 Pilot: Core System High-Level Design
information for longer term storage. Retrieve information stored upon demand (operational data for immediate retrieval, archived data for later, scheduled retrieval).
4. Secure information received, processed and stored.5. Provide data communications between the primary systems of the ICM core system.
In order to fulfill these roles, the data hub provides a series of data pipelines to receive information, process the information, persist the information, and secure the information. The pipelines use Kafka and ActiveMQ messaging systems to transmit information that can be tapped by persistence workers to persist information to the various data stores within the data hub, and retrieve the information and place the information back on the messaging systems for downstream consumption. External interfaces, using Apache Camel, provide information and communication between the data hub, the DSS, and CMS systems.
Figure 5-4 Data Hub High Level Design
This design consists of individual services connected via messaging. It is a highly decoupled design based on a group of independent services connected by two messaging platforms. Figure 5-4 provides a generalized diagram that illustrates three basic types of data pipelines. Sensor data is generally a high frequency, larger data volume pipeline that handles a larger number of smaller messages. The heterogeneous data pipeline type handles larger sized messages at lower message processing frequencies. Heterogeneous data is characterized by multiple sources providing the same type of data in varying degrees of format and content differences. The homogeneous data pipelines are similar to the heterogeneous data pipelines, but generally are built for a single data source that provides all of a
19

I-210 Pilot: Core System High-Level Design
specific type of data. Note that the heterogeneous and homogenous data pipelines provide some data into the sensor data pipeline when sensor data is part of the data received within these pipelines.
A description of the different types of components is provided below:
Reader – Readers are the beginning of the data pipeline. Their role is simple – to connect and gather the data from a data source using the protocol and format native to that data source, and to place the information within a data messaging channel for downstream processing. In general, it does little or no processing of the data, with any processing limited to simple parsing of large batches into individual messages.
Spark – Spark is an Apache Spark instance that provides high speed, high volume, real time data processing for sensor data. Its role is to provide data transformation, data quality, data processing, and predictive analytics for sensor data. It receives data from readers, processes that data, and places the data into Kafka message topics for use by downstream processes.
Cassandra – Cassandra is an Apache Cassandra instance that provides storage for time series data, primarily sensing data. Cassandra provides high speed, high volume, clustered storage for sensing data. This data is limited to operational data storage and is not intended as a long-term data store.
Postgres – Postgres is an open source relational database instance that provides storage for relational and geospatial data, such as intersection signal plans, ramp meter plans, road networks, asset inventories, organizational information. It is an operational data store and not intended as a long term data store.
Persistence workers – Persistence workers provide both storage and retrieval services for both Postgres and Cassandra data stores. Persistence workers listen to assigned message topics and queues, both Kafka and ActiveMQ, and store the information on the appropriate data store. Requests can be sent to a persistence worker via a command message channel to retrieve data and place that data on a specified message topic or queue.
Processors – Processors are used in the homogeneous and heterogeneous data pipelines to process data received from the various data sources. Processors provide data transformation, quality, and data processing services for data received from these sources.
Mongo – Mongo is an instance of a MongoDB database and is used within the process to transform data received on a heterogeneous data pipeline. Readers store the data received from a source into MongoDB. Processors than query Mongo for the information required for processing and downstream processes including decision support and corridor management systems. MongoDB provides an ideal platform for storing information retrieved in a native format and fast querying of this information with minimal maintenance required when source formatting is changed.
Data hub logger (DH logger) – The data hub logger is an instance of Greylog that collects and indexes all logging for each individual component within the data hub, and listens to messaging to capture control and process logging messages. Its role is to capture system state and error messages for system status and troubleshooting needs.
20

I-210 Pilot: Core System High-Level Design
Data hub control gateway (DH control gateway) – The data hub control gateway is an API gateway that provides routing and management of control and status messages for the data hub. Its role is to receive messages routed from the interfaces for the DSS and CMS, as well as internal data hub control channels, and route those to the appropriate channels for the receiving process. This provides encapsulation of individual services and ensures that new services, service changes, and message system modifications can be accomplished without impacting other systems, and is key to the decoupling of the system services for the entire ICM system. This gateway uses an implementation of Apache Camel.
External interface/Data gateway – The external interface/data gateway encapsulates the functions of the data hub, providing a sort of switchboard for use by the CMS and DSS systems. CMS and DSS systems are not required to know the internals of the data hub messaging, but instead rely on the external interface/data gateway to provide protocol specific communication ports that are appropriate for the CMS and DSS and then to route messages to and from the data hub for them. This external interface/data gateway uses Apache camel to provide both routing and translation services. Internal data hub messages (Kafka or ActiveMQ) are translated into the protocols used by the CMS and DSS (ActiveMQ, REST services, or SOAP services). Common TMDD and GTFS message formats are used in most communications, so no translation of data formats is required by the gateway.
PeMS – PeMS is a state system that currently provides state transportation data services. PeMS will provide long term storage for all system data, archiving services, and reporting services for non-real time data and reporting needs.
Business Intelligence – BI services will be provided by the Caltrans’ OBIEE implementation.
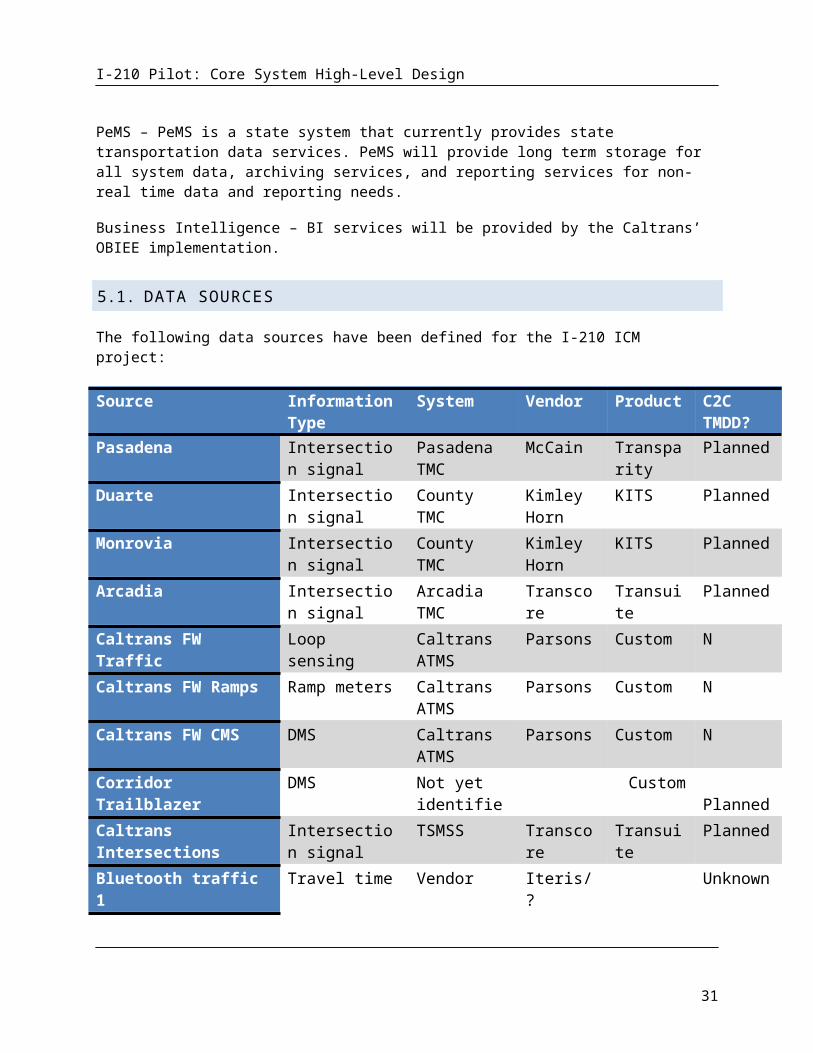
5.1. DATA SOURCES
The following data sources have been defined for the I-210 ICM project:
Source Information Type
System Vendor Product C2C TMDD?
Pasadena Intersection signal
Pasadena TMC
McCain Transparity Planned
Duarte Intersection signal
County TMC Kimley Horn
KITS Planned
Monrovia Intersection signal
County TMC Kimley Horn
KITS Planned
Arcadia Intersection signal
Arcadia TMC Transcore Transuite Planned
Caltrans FW Traffic Loop sensing Caltrans ATMS Parsons Custom N
21
I-210 Pilot: Core System High-Level Design
Caltrans FW Ramps Ramp meters Caltrans ATMS Parsons Custom N
Caltrans FW CMS DMS Caltrans ATMS Parsons Custom N
Corridor Trailblazer DMS Not yet identified
Custom Planned
Caltrans Intersections Intersection signal
TSMSS Transcore Transuite Planned
Bluetooth traffic 1 Travel time Vendor Iteris/? Unknown
Bluetooth traffic 2 Travel time County TMC ? Unknown
Environmental sensing Environmental ? Cal Poly ODS ?
RIITS Transit Transit ? Cal Poly ODS ?
RIITS Video* Video RIITS
Caltrans Video* Video via RIITS
Caltrans FW Lane closure Lane status LCS
City Lane closure Lane status State HSR system
State of CA Custom N
LA County Intersection signal
County TMC Kimley Horn
KITS Planned
CHP CAD Incident CAD manual input by operator
Caltrans incident Incident Caltrans ATMS Parsons Custom Planned
Gold line transit Transit NextBus NextBus
22

I-210 Pilot: Core System High-Level Design
* Video is not passed through or stored within the data hub.
5.2. DATA PIPELINES
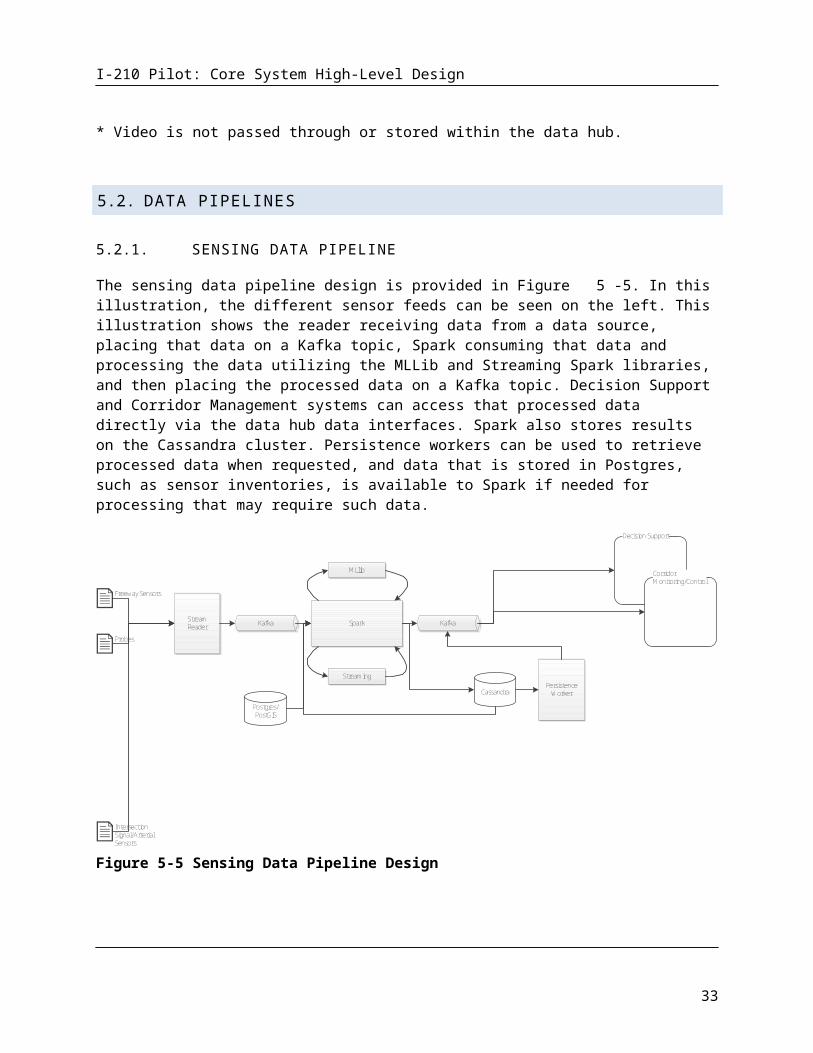
5.2.1. SENSING DATA PIPELINE
The sensing data pipeline design is provided in Figure 5-5. In this illustration, the different sensor feeds can be seen on the left. This illustration shows the reader receiving data from a data source, placing that data on a Kafka topic, Spark consuming that data and processing the data utilizing the MLLib and Streaming Spark libraries, and then placing the processed data on a Kafka topic. Decision Support and Corridor Management systems can access that processed data directly via the data hub data interfaces. Spark also stores results on the Cassandra cluster. Persistence workers can be used to retrieve processed data when requested, and data that is stored in Postgres, such as sensor inventories, is available to Spark if needed for processing that may require such data.
Stream Reader
Freeway Sensors
Probes
Kafka Spark
MLlib
Streaming
Kafka
Cassandra
Decision Support
Corridor Monitoring/Control
Intersection Signal/ArterialSensors
Persistence Worker
Postgres/PostGIS
Figure 5-5 Sensing Data Pipeline Design
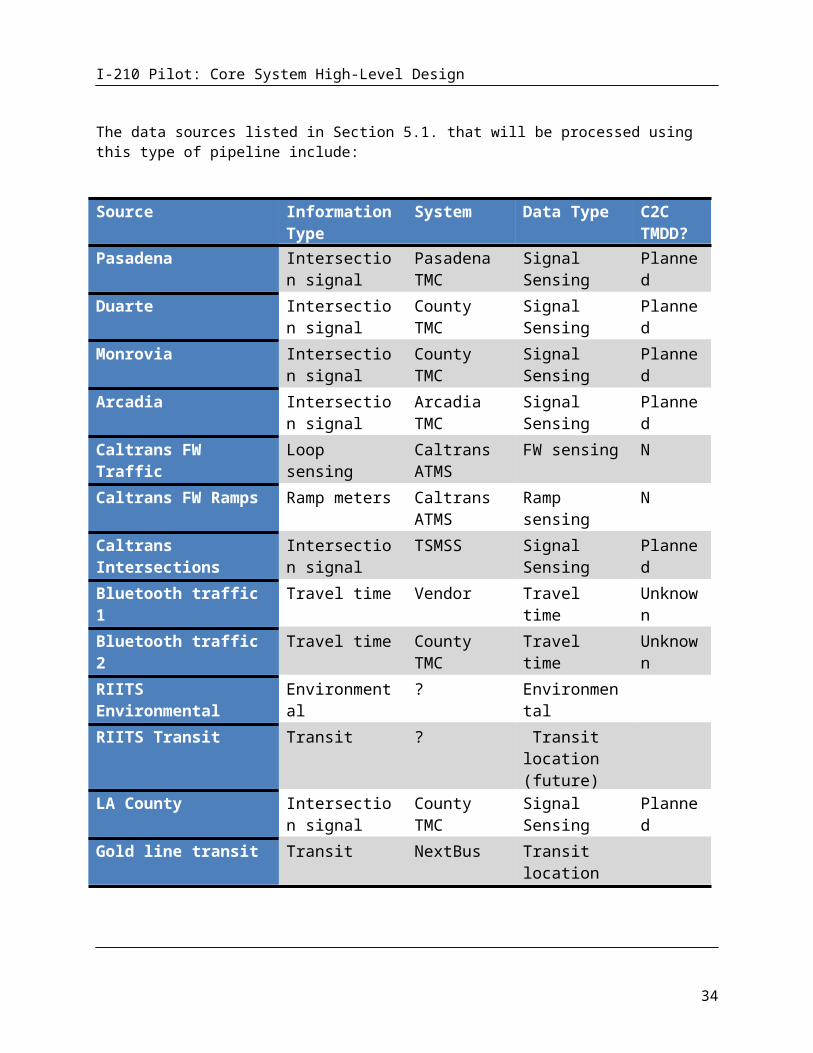
The data sources listed in Section 5.1 that will be processed using this type of pipeline include:
Source Information Type
System Data Type C2C TMDD?
Pasadena Intersection signal
Pasadena TMC
Signal Sensing Planned
23

I-210 Pilot: Core System High-Level Design
Duarte Intersection signal
County TMC Signal Sensing Planned
Monrovia Intersection signal
County TMC Signal Sensing Planned
Arcadia Intersection signal
Arcadia TMC Signal Sensing Planned
Caltrans FW Traffic Loop sensing Caltrans ATMS
FW sensing N
Caltrans FW Ramps Ramp meters Caltrans ATMS
Ramp sensing N
Caltrans Intersections Intersection signal
TSMSS Signal Sensing Planned
Bluetooth traffic 1 Travel time Vendor Travel time Unknown
Bluetooth traffic 2 Travel time County TMC Travel time Unknown
RIITS Environmental sensing
Environmental ? Environmental Sensing
RIITS Transit Transit ? Transit location (future)
LA County Intersection signal
County TMC Signal Sensing Planned
Gold line transit Transit NextBus Transit location (future)
5.2.2. CALTRANS FREEWAY TRAFFIC DATA PIPELINE
The Caltrans Freeway traffic data pipeline is a sensing data pipeline. It consists of all of the standard sensing pipeline components:
Kafka topics for data transmission Reader for retrieving data Spark for data transformation, quality checks, machine learning Cassandra for persistence
24

I-210 Pilot: Core System High-Level Design
Figure 5-6 illustrates this data pipeline.
Figure 5-6 Freeway Sensing Data Pipeline (PeMS)
25
I-210 Pilot: Core System High-Level Design
PeMS 30 second files are a flat format data file. Data is retrieved by the reader via FTP. The reader utilizes a configurable scheduler that will poll for data files. When one or more data files is available, the reader processes the files in time order, with the oldest file first. Each row within the file contains the information for a single sensor at a single time step. All sensors for a single time step are contained within the file. The time of each reading is located in the file name. The reader parses each row of the file and creates a single Kafka message for each sensor and timestep, appending the timestep to the information passed within the message. Upon completion of the file processing, a status message for the file, including the time step and the Kafka position of each message is sent to a status topic.
Upon receiving the status message, Spark processes the messages, completing the following steps:
1. The messages are transformed into a TMDD data structure (Note: this is not a TMDD format, and Kafka messages are JSON, not XML, and it is not passed via a SOAP protocol. However, the data structure is identical to a TMDD structure.)
2. An inventory check is completed for each time step.3. A flow balance check is completed for all sensors on 4 and 6 hour rolling time windows and a 24
hour static time window.4. A demand prediction is completed for the next hour for each freeway ramp.
Spark stores the result of its processing in Cassandra and passes the sensing information to the DH_pems_processed topic.
5.2.3. HETEROGENEOUS DATA PIPELINE
The heterogeneous data pipeline design is provided in Figure 5-7. In this illustration, the different intersection signal feeds can be seen on the left.
This illustration shows the reader receiving data from a data source and inserting that data in a raw message format into MongoDB. The reader retrieves data from the data source using the data source’s native protocols and formats. It is desired that the format be TMDD format, and the protocol is a standard SOAP protocol, either a request receive or subscription method as specified in the TMDD specification. The reader transforms the message from a SOAP/XML format to a JSON format prior to inserting into Mongo.
A message is sent from the reader to the processor to inform the processor of the availability of new data.
The processor then queries Mongo to obtain a desired document with the specific attributes required to make a TMDD message containing a standardized set of information required for downstream processing. The processor also utilizes a standard dictionary of data values so that data from different sources that may be different in specific definition, but represent the same value are standardized for downstream consumption. For example, if one source abbreviates boulevard as Blvd, and a second does not abbreviate the word, the processor will standardize to a single definition that can be understood by the downstream processes. The processor also conducts data quality checks and any other processing required.
26

I-210 Pilot: Core System High-Level Design
Once the TMDD transformation, quality checks, and any processing is completed, the processor constructs the final TMDD structured JSON message and places it on the outgoing topic. Persistence workers listening to the topic persist the information for later analysis or replay, and the CMS and DSS systems may consume the message directly from the processed data topic.
For intersections that provide intersection sensing, the processor will retrieve the sensing information and send it via a separate topic for further processing within the sensing/Spark stream.
ActiveMQ/Kafka
ActiveMQ/Kafka
Intersection Signal Reader
Intersection Signal Inventory/State
Postgres/PostGIS
Decision Support
Corridor Monitoring/Control
Mongo
Intersection Signal
Processor
Persistence Worker
Persistence Worker
Figure 5-7 Heterogeneous Data Pipeline
27

I-210 Pilot: Core System High-Level Design
5.2.4. HOMOGENOUS DATA PIPELINE
The homogenous data pipeline design is provided in Figure 5-8. In this illustration, a ramp meter inventory and state source is used as the example feed on the left. The homogenous data pipeline is identical to the heterogeneous data pipeline with only one difference. Homogenous data pipelines are used when there is only a single data source for the type of information being processed. When this occurs, there is no need to store the documents received in a “schema-less” database, since there are not multiple data standards and implementations to accommodate. Because of this, the homogenous data source removes the MongoDB installation from the pipeline, and the reader and processor directly communicate for any data transformation, quality checks, or processing required.
ActiveMQ/Kafka
ActiveMQ/Kafka
Ramp Meter ReaderRamp Meter Inventory/State
Postgres/PostGIS
Decision Support
Corridor Monitoring/Control
Ramp Meter Processor
Persistence Worker
Persistence Worker
Figure 5-8 Homogenous Data Pipeline
5.2.5. PIPELINE CONTROL
All pipelines, regardless of pipeline type, are provided with the same base control set. The controls available for each pipeline include:
1. Start pipeline processing2. Stop pipeline processing3. Pipeline status4. Replay data
All pipeline control requests are handled by the data hub control gateway. Requests received by the gateway are routed to an appropriate endpoint.
Start pipeline processing – the start pipeline processing will be routed via the data hub control gateway to the appropriate reader within a pipeline. The request will result in these possible outcomes:
28

I-210 Pilot: Core System High-Level Design
1. If the pipeline is currently not started, the reader will begin processing data and inserting it into the pipeline. The data processed will be based on the configuration of the specific reader.
2. If the pipeline is already started, an error will be returned from the reader indicating the process is already started.
3. If the pipeline cannot be started for any reason, an error will be returned, from the reader if possible, or from the data hub control gateway if no message is received from the reader or if no reader instance exists.
4. Another error, such as pipeline does not exist or that the request is not properly formatted.
Stop pipeline processing – the stop pipeline processing will be routed via the data hub control gateway to the appropriate reader within a pipeline. The request will result in these possible outcomes:
1. If the pipeline is currently running, the reader will stop processing data and will complete insertion of any currently processing data into the pipeline.
2. If the pipeline is not currently running, an error will be returned from the reader indicating the process is already stopped.
3. If the pipeline cannot be stopped for any reason, an error will be returned, from the reader if possible, or from the data hub control gateway if no message is received from the reader.
4. Another error, such as pipeline does not exist or that the request is not properly formatted.
Pipeline status – the pipeline status request is a request for a subscription to pipeline status messages that are produced at all times by each processing point within a pipeline, including readers, spark, processors, messaging systems, and workers. This includes times for which the pipeline is not currently running, but the components are running (for instance when the pipeline is currently stopped, but available for processing). All pipeline components provide at a minimum a heartbeat indicating they are currently up and running, even if no data is being processed.
For each pipeline status request, the data hub control gateway will provide a channel for a subscription to a kafka topic containing all status messages for a specific pipeline. Pipeline status requests shall always include within the response the topic identifier, and most recent kafka message offset. Requesters may then connect to the kafka channel provided by the data hub control gateway and set up a consumer for status messages.
The following responses are possible when requesting a pipeline status:
1. A response with a kafka topic identifier and address, along with the current kafka message offset and current time.
2. If the status messages are not currently available, an error will be returned.3. Another error, such as pipeline does not exist or that the request is not properly formatted.
29

I-210 Pilot: Core System High-Level Design
Stream Reader
Freeway Sensors
Probes
Kafka Spark
MLlib
Streaming
Kafka
Cassandra
Decision Support
Corridor Monitoring/Control
Persistence Worker
Postgres/PostGIS
Replay Request
Control Request
Figure 5-9 Streaming Primary Control Layer
5.2.6. PIPELINE STATUS AND LOGGING
All pipeline components provide logging and status information, regardless of pipeline type or component. Logging includes the logging at the EC2 or application level that is provided to the EC2 logs at the OS level and is published to the Graylog instance within the data hub. Status includes status messages published to status Kafka topics, again collected by the data hub Graylog instance.
Logging shall be configurable and set on component start and shall include at a minimum the following logging levels:
1. All2. Debug3. Fatal4. Error5. Warn6. Info
Logging level will be set upon component initialization when it is started. In general, during normal operation, the following levels shall report – Error, Fatal, Warn, and Info. The information generated by logging shall only be available through either inspection of the EC2 instance where they were generated and via the data hub Graylog instance.
Status information is produced by the components and published to a pipeline status Kafka topic. This information is available to external consumers via the data hub control gateway (using a data hub status request) or the data hub Graylog instance. Data pipeline status messages shall be provided for the following at a minimum:
30
I-210 Pilot: Core System High-Level Design
1. Pipeline component heartbeat – a status message indicating the component is running sent at a regular interval.
2. Pipeline error message – a status message sent indicating that an error has occurred. Generally, this will include Fatal or Error log messages.
3. Pipeline warning message – a status message sent providing a warning indicating potential issues in operation. Generally, this will include all Warn logging messages.
4. Pipeline processing message – this includes messages indicating processing of a set of data, often at a time step or file level. For instance, in a TMDD subscription, a processing message would be set from each pipeline component indicating when the information from a message resulting from the subscription has been processed. It is not guaranteed that different pipeline processes will process information at the same granularity, however, each status message will provide the corridor entity identifiers and the original message identifier from the originating system that started the data processing.
Pipeline components may include other status messages as needed.
Stream Reader
Freeway Sensors
Probes
Kafka Spark
MLlib
Streaming
Kafka
Cassandra
Decision Support
Corridor Monitoring/Control
Persistence Worker
Postgres/PostGIS
Graylog Status/LoggingStatus/Logging
Figure 5-10 Status/Logging Layer
5.2.7. CORRIDOR MANAGEMENT SYSTEM-DECISION SUPPORT SYSTEM (CMS-DSS) PIPELINE
The Corridor Management System – Decision Support System (CMS-DSS) Pipeline provides the communication between the Decision Support System, Data Hub and to the Corridor Management System:
Traffic estimation results, including geospatial information and traffic metrics Traffic prediction, including geospatial information and traffic metrics Response plans and response plan evaluations DSS Status CMS Status
31

I-210 Pilot: Core System High-Level Design
DSS Control Traffic estimation and prediction scenario information
In addition, the pipeline provides persistence within the data hub of all DSS – CMS communications. The pipeline does not include any communications from the Corridor Management System that do not involve the Decision Support System.
All CMS-DSS pipelines support TMDD compliant SOAP dialogs in accordance with the Connected Corridors Data Communication Specification. SOAP endpoints are present at the CMS Data Hub Gateway to support these conversations and are exposed to the CMS. The data for these SOAP interfaces are communicated to the DSS via the Data Hub and its Kafka and ActiveMQ messaging system. All command requests and responses are also provided to the Data Hub Control gateway for any data hub control actions required. While only to be provided as necessary to support the different CMS vendors, REST, ActiveMQ messaging, and Kafka messaging may also be provided as interfaces to the CMS instead of SOAP interfaces.
All CMS-DSS pipelines are always on pipelines. For future use, data hubs will support multiple CMS and DSS instances, so all individual pipelines are created for each CMS/DSS pair. All messages between CMS and DSS instances shall be communicated through only pipelines designated for that specific CMS-DSS pair and shall include within the messages the source and target system identifiers.
Figure 5-11 provides an illustration of the CMS – DSS pipeline, and its associated primary data topics, including:
Incidents Response Plans Decision Results Status Request Status Response Estimation Request Estimation Metrics Estimation Results Estimation Network Estimation Scenario Prediction Request Prediction Result Prediction Metrics Prediction Network Prediction Scenario
32
I-210 Pilot: Core System High-Level Design
Figure 5-11 Corridor Management - Decision Support System Pipeline
5.2.7.1. Incident
The incident pipeline provides confirmed incident information from the CMS to the DSS. This pipeline may start as a REST request, Kafka message, ActiveMQ message, or SOAP incident. Also note that this pipeline represents a TMDD event class dialog set with both requests, responses, and subscriptions. Subscriptions are the preferred method of communication. The incident pipeline includes an incident subscription request to the CMS, as well as the corresponding subscription responses. Incident requests are originated from the CMS Data Gateway. The responses are provided to the DSS via the data hub as ActiveMQ messages.
5.2.7.2. Response Plan
The response plan pipeline provides response plans to the CMS. As there is no TMDD dialog for response plans, this is a Connected Corridors custom communication. Response plans are provided as an
33
I-210 Pilot: Core System High-Level Design
ActiveMQ message via the CMS Data Gateway. Response plans are provided in accordance with the Connected Corridors Data Specification, and include the response plan elements, event/incident index identifier, and associated performance indicators and metrics.
5.2.7.3. Decision Result
The decision result pipeline provides the results from the DSS, providing the index of the selected decision, and the key value pairs for each response plan indicator and score elements. The decision result is not a TMDD dialog, and is available via ActiveMQ message via the CMS Data Gateway.
5.2.7.4. Status Request
The status request is a communication channel for requesting DSS and data hub status. It is an ActiveMQ queue/message. Requests must include an identifier for the requesting system. A response will include an address for receiving status messages. Status requests are essentially a subscription request, with the response simply a location for subscribing to a continuous stream of status messages.
5.2.7.5. Status
The decision result pipeline provides the results from the DSS, providing the index of the selected decision, and the key value pairs for each response plan indicator and score elements. The decision result is not a TMDD dialog, and is available via ActiveMQ message via the CMS Data Gateway. Data hub and CMS status messages are provided on the same topic specific to the CMS-DSS pair.
5.2.7.6. Estimation Request
The estimation request pipeline provides a method for the CMS to request an estimation. If an estimation is currently running, the response to the request shall indicate the address where estimation results are published. If the estimation is not currently running, the DSS shall start an estimation and the response shall include a message indicating the DSS is beginning an estimation, and the address where estimation results are published.
5.2.7.7. Estimation Result
The estimation result pipeline provides the raw results of an estimation request, including for freeways the estimated density, flow, and speed for each network link within the freeway estimation network, and for arterials, the estimated density for each network link within the arterial estimation network.
5.2.7.8. Estimation Metrics
The estimation metrics pipeline provides estimation metric results, including travel time and current delay estimates for the freeway and arterial networks.
34
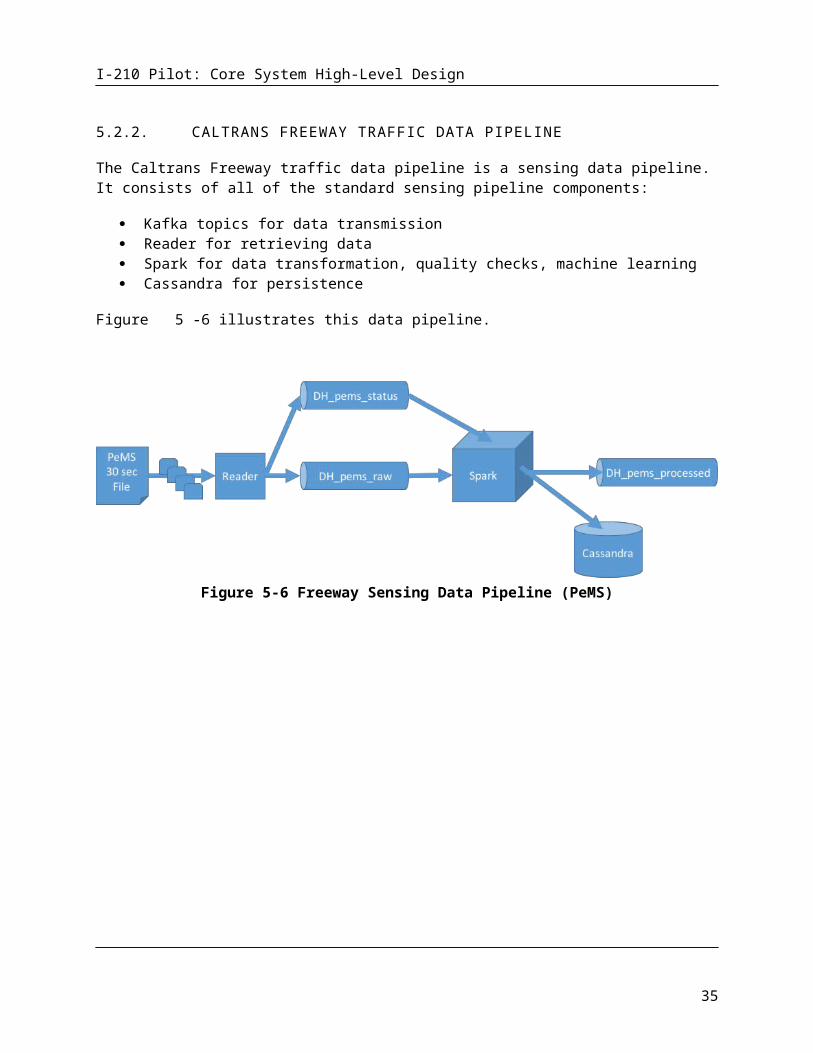
I-210 Pilot: Core System High-Level Design
5.2.7.9. Estimation Network
The estimation network pipeline provides the current estimation network in a TMDD format. This pipeline supports TMDD messaging.
5.2.7.10. Estimation Scenario
The estimation scenario pipeline provides the current estimation scenario data structure (arterial and freeway). It is not expected that this pipeline will be available in the initial system deployment.
5.2.7.11. Prediction Request
The prediction request pipeline provides a method for the CMS to request a prediction. The response to the request shall indicate the address where prediction results are published. In the initial version of the software, predictions shall only be provided either as a response to an incident as part of the DSS process, or shall be provided as a replay to a previous prediction.
5.2.7.12. Prediction Result
The prediction result pipeline provides the raw results of a prediction request. TODO: determine what from Aimsun will be provided.
5.2.7.13. Prediction Metrics
The prediction metrics pipeline provides prediction metric results, included travel time and current delay predictions.
5.2.7.14. Prediction Network
The prediction network pipeline provides the current prediction network in a TMDD format. This pipeline supports TMDD messaging.
5.2.7.15. Prediction Scenario
The prediction scenario pipeline provides the current Aimsun prediction file. It is not expected that this pipeline will be available in the initial system deployment.
5.2.8. CMS COMMAND STATUS PIPELINE
Communications between the CMS and external systems or centers are captured by the Data Hub. They are also provided to the CMS control gateway so that the data hub may respond to commands issued by the CMS system to external systems. Figure 5-12 provides an illustration of the CMS Command Status pipeline.
35

I-210 Pilot: Core System High-Level Design
Figure 5-12 CMS Command Status Pipeline
This CMS Command Status pipeline is a simple implementation of an ActiveMQ topic that is provided a copy of all CMS communications with any external center or system. All such communications are provided via ActiveMQ message containing a text representation of any message sent or received. Messages are keyed with the external system or center communicated with, as well as either send or receive to indicate whether the message was sent to the external center or system (send) or received from the external center or system (receive) as well as the time of message sent or receipt, as appropriate. All messages are saved via persistence worker to a Postgres database. The DSS data hub control gateway also subscribes to the data hub CMS command status topic and may respond with specific control actions within the data hub.
Initially, the store for commands will be Graylog, not Postgres. Graylog provides a user interface and query engine that allows users to interpret and review system processes through the captured command status messages.
5.3. EXTERNAL INTERFACE/DATA GATEWAY
The data gateway provides an external interface to the data hub for the corridor management system and the decision support system. The purpose of this data gateway is:
Provide for two-way communication between the Data Hub and the Decision Support System Provide for two-way communication between the Data Hub and the Corridor Management
System Encapsulate the functions of the data hub from other ICM component systems Provide a secure interface to the data hub Allow for the change from Kafka or ActiveMQ protocols used within the data hub to REST or
SOAP based services as well as Kafka or ActiveMQ that may be required by other ICM component systems
Allow for a switchboard like functionality that can be configured for different Corridor Management System providers or Decision Support Systems
Provide for multiple output channels to publish information to multiple downstream consumers
36

I-210 Pilot: Core System High-Level Design
The Data Hub Data Gateway uses Apache Camel to provide these services. Two primary design patterns are used as shown in Figure 5-13, first for communication to external ActiveMQ brokers, and second to external SOAP or REST web services endpoints.
Figure 5-13 Data Hub Data Gateway – ActiveMQ and Web Services Design Patterns
Each of the two designs uses Apache camel and implements a Kafka consumer to retrieve messages from a defined Kafka topic. Each also provides for a processor for transformation and routing of messages. For passing data using an ActiveMQ topic or queue hosted by an external broker, Camel’s Seda component is used for asynchronous messaging and message flow regulation. For passing data via SOAP or REST web services, an appropriate SOAP or REST endpoint is provided for communication with an external SOAP or REST endpoint.
NOTE: All internal data communications within the data hub are conducted via Kafka or ActiveMQ data messaging and JSON formatting. Native data communications are implemented using TMDD or other appropriate standard formats when available. While these standards may not implement JSON formatting, the messages within the data hub that contain this information are JSON formatted, retaining the data structures and relationships within the applicable standard. When externally exposed, these data messages are serialized back to the appropriate data format dictated by the standard used (TMDD or other).
37

I-210 Pilot: Core System High-Level Design
5.3.1. SUBSCRIPTION ENDPOINTS
Subscribe/Notify pattern (http://www.enterpriseintegrationpatterns.com/patterns/conversation/SubscribeNotify.html) - use a lease to end if no renew/continuation message received?
5.3.2. REQUEST/RESPONSE ENDPOINTS
Both ActiveMQ and Kafka – CMS gets connection via camel – camel maintains subscription to topic/queue, ActiveMQ uses a LastImageSubscriptionRecoveryPolicy subscription recovery policy. Get most recent message.Kafka – get most recent message
5.4. DATA HUB COMMAND GATEWAY
The data hub command gateway is an internal data hub component that manages all command communication and coordination activities of the data hub and orchestrates communication and control of all core ICM system components. Since the DSS and CMS do not communicate directly, the data hub orchestrates workflows and communications between the two components and the internal components of the data hub. Similar to the data hub data gateway, it uses Apache Camel to route and process Core ICM System commands. In addition, it uses a workflow component designed for a microservice architecture used by Netflix in its own production environment called Conductor. It provides the following capabilities:
Receive all core system requests for services Provide execution management of all requests for data hub services Provide execution management of workflow processing for requests involving simple single step
workflows or complex multi-step workflows Persist service requests and their outcomes (success or failure) Manage internal operations of the data hub (starting/stopping services, restart on failure, etc) Orchestrate actions between the DSS, CMS, and data hub.
Note that the data hub command gateway is an internal data hub component. At no time are the message queues and topics that it communicates with directly connected to external systems. All queues and topics that communicate with this component are internal queues and topics connected to data hub components or the data hub data gateway (for communication with external systems).
38

I-210 Pilot: Core System High-Level Design
Figure 5-14 Data Hub Command Gateway
The data hub command gateway consists of just a few primary component types. These include:
Conductor and related workflow components Camel and related routing and transformation components ActiveMQ workflow status topic ActiveMQ workflow task topic Monitor
5.4.1. CONDUCTOR
Conductor is used for orchestration of the individual pipelines and both internal and external requests for services. Conductor is an open source project developed by Netflix to manage some of its own production workflows, particularly with a micro-service architecture. There are a number of similarities between the use cases for which Conductor is designed and the orchestration of the individual pipelines and the requests for services from the DSS and CMS, as well as orchestration of the communications between DSS and CMS that make it well suited for use.
Conductor is used in an “as-is” configuration “out-of-the-box”. The data hub implementation uses the REST interfaces and in-memory database that comes with Conductor. No modifications are made to Conductor. It provides workflow management and control, with workflows described in JSON format.
39

I-210 Pilot: Core System High-Level Design
5.4.2. CAMEL
To adapt Conductor to the data hub interfaces, Camel is used as a facade to the ActiveMQ and Kafka data hub interfaces. Camel provides the interface between Conductor’s native REST interface and the data hub’s Active MQ and Kafka data bus elements.
5.4.3. ACTIVEMQ WORKFLOW STATUS TOPIC
The ActiveMQ workflow status topic is used to allow individual data hub components to provide workflow status messages to Conductor, via the Camel interface. It also is used to provide general system and component status information for use in workflow management. The data hub data gateway also provides workflow and external system status (CMS and DSS) messages via the workflow status topic. The CMS and DSS systems are never required (or allowed) to directly message via the Workflow status topic, but instead, their communications are managed by the data hub data gateway.
5.4.4. ACTIVEMQ WORKFLOW TASK TOPIC
The ActiveMQ workflow task topic is how workflow tasks are distributed from Conductor to the individual data hub components, or the DSS and CMS systems (via the data hub data gateway). As with the workflow status topic, DSS and CMS systems are never directly allowed to communicate with the workflow task topic. Instead, the data hub data gateway manages the distribution of tasks and the resulting responses via the DSS and CMS APIs.
5.4.5. MONITOR
The monitor listens to the workflow status topic for system and component status messages, always providing data hub, DSS, and CMS state and status information to the Conductor workflow manager. This allows Conductor to respond to degraded system state, either by disabling specific workflows or starting other workflows to respond to system component failures.
6. DECISION SUPPORT SYSTEM DESIGN
The decision support system’s (DSS) primary roles include:
Provide response plans following receipt of a confirmed incident Evaluate response plans and rank them based on user defined criteria Provide one or more recommendations to corridor operators and stakeholders via the Corridor
Management System, whether to implement a response plan and which response plan to implement for each received confirmed incident
Evaluate implemented response plan effectiveness and recommend new response plans when appropriate
Provide response plan evaluation results for corridor operators review via the Corridor Management System
40
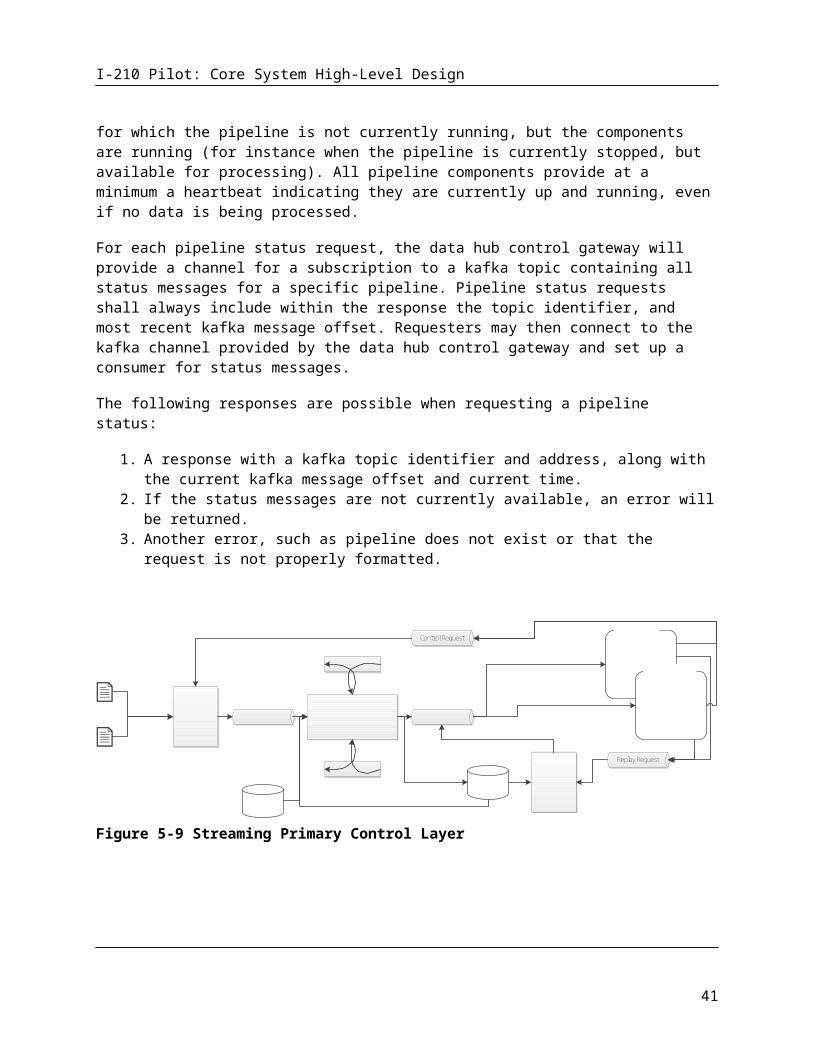
I-210 Pilot: Core System High-Level Design
The DSS accomplishes this with three primary components:
Response Plan Management Rules Engine Modeling
The response plan management component receives incident information and coordinates the development and evaluation of response plans. The rules engine provides configurable logic/rules for the decision to create response plans, response plan creation, and response plan ranking. The modeling component provides traffic estimation and prediction capabilities to support response plan creation, evaluation, and ranking.
6.1. DSS HIGH LEVEL DESIGN
The DSS’s three primary components are described in Figure 6-15. The DSS is one of the three primary ICM system subsystems, and communicates with the ICM system via the data hub’s data gateway.
Figure 6-15 DSS Architecture
All corridor information is received from the data hub data gateway. The modeling and response plan management components receive all corridor data and system status via a series of data channels available on the data hub data gateway.
41

I-210 Pilot: Core System High-Level Design
All commands to the DSS and requests for DSS status are received via a set of command channels exposed on the data hub data gateway. All command requests from entities external to the DSS are received by the response plan management component. Requests to the modeling component are originated by the response plan management component. Direct requests to the modeling component from systems external to the DSS are not allowed, and must be managed via the commands exposed by the response plan management component.
All communications with the DSS via the Data Hub Data Gateway are managed via ActiveMQ messaging. Communications between the Response Plan Management and Modeling are enabled via REST or ActiveMQ messaging. The response plan management and rules engine are tightly coupled via their java based APIs.
Output from the DSS consists primarily of response plans and their evaluations from the response plan management system, and estimation and prediction results from the modeling system.
Figure 6-16 Decision Support System High Level Design
Figure 6-16 provides a slightly more detailed view of the DSS.
6.2. RESPONSE PLAN MANAGEMENT
Response plan management provides functions for the development and selection of response plans, including coordination of the actions of the response plan management, rules engine, and the modeling components of the DSS.
The response plan management component is primarily an event based, asynchronous service that listens for a confirmed incident from the data hub, and upon receipt, orchestrates actions between itself, the rules engine, and modeling components to determine if a response plan might positively impact traffic conditions and if so, develop several response plans, evaluate them, and recommend a
42

I-210 Pilot: Core System High-Level Design
response plan for implementation. The response plan management component also has a limited selection of methods implemented so that other specific requests can be made via the data hub.
The response plan management also monitors the decision support system and its components. It has limited capabilities to perform specific startup activities required for DSS operation, monitor each DSS component, and perform limited actions should a startup activity fail (for instance, if the modeling estimation process should stop, the response plan management component shall attempt to restart the estimation process).
Figure 6-17 Response Plan Management High Level Design
The circled area of Figure 6-17 illustrates the fundamental components of the response plan management component.
On the left of the response plan management component in the figure is the data hub interface. This is an ActiveMQ based interface that subscribes to the data hub data interface and provides asset information, route information, and incident information to the response plan management component. This information is maintained in a local data store. It also listens for specific requests sent to the DSS via the data hub.
The response manager, upon receipt of a specific request or incident manages the specific workflows required to respond to the request or to provide a response plan recommendation. This includes requesting decisions and results from the rules engine, information regarding current traffic state from the modeling system, or specific predictions for response plans received from the rules engine. The response plan manager also assembles the complete response plan, and provides it as a response to the data hub for storage and distribution to the CMS.
43

I-210 Pilot: Core System High-Level Design
6.3. RULES ENGINE
The rules engine is a combination of java components and the open source Drools rules engine designed to respond to a limited number of questions that can be asked by the response plan manager. These limited questions include:
Does the current confirmed incident, with the results of a “do-nothing” prediction, require development and evaluation of response plans?
What response plans should be evaluated? Create those response plans from a limited set of response plan components.
Which response plan, given the response plans developed and their respective predictions, should be recommended, listed in a ranked order?
The rules engine is a Java library that is included in the response plan manager component with a defined api specific to answering these defined questions, given the current state of the corridor assets, defined limits within a set of user specified rules (such as “do not use this route between the hours of 3 and 5 pm”), current traffic state, current time, and incident information.
It is intended that the final user interface for developing, editing, testing, and evaluating rules and their performance will be in the CMS. However, initially, this will be limited to requiring IT support to assist with rules development, and uploading of spreadsheets to a known location where rules can be added or updated.
6.4. MODELING
The modeling system provides two primary services; traffic state estimation and traffic prediction.
6.4.1. MODELING TECHNIQUES
Three traffic models are used within the modeling system. These include:
A custom freeway traffic estimation model developed by UC Berkeley using a cell transmission model (CTM) method.
A custom arterial traffic estimation model developed by UC Berkeley using an intersection queue model method.
A commercial prediction model using TSS’s Aimsun modeling system and a micro-modeling behavioral model.
44
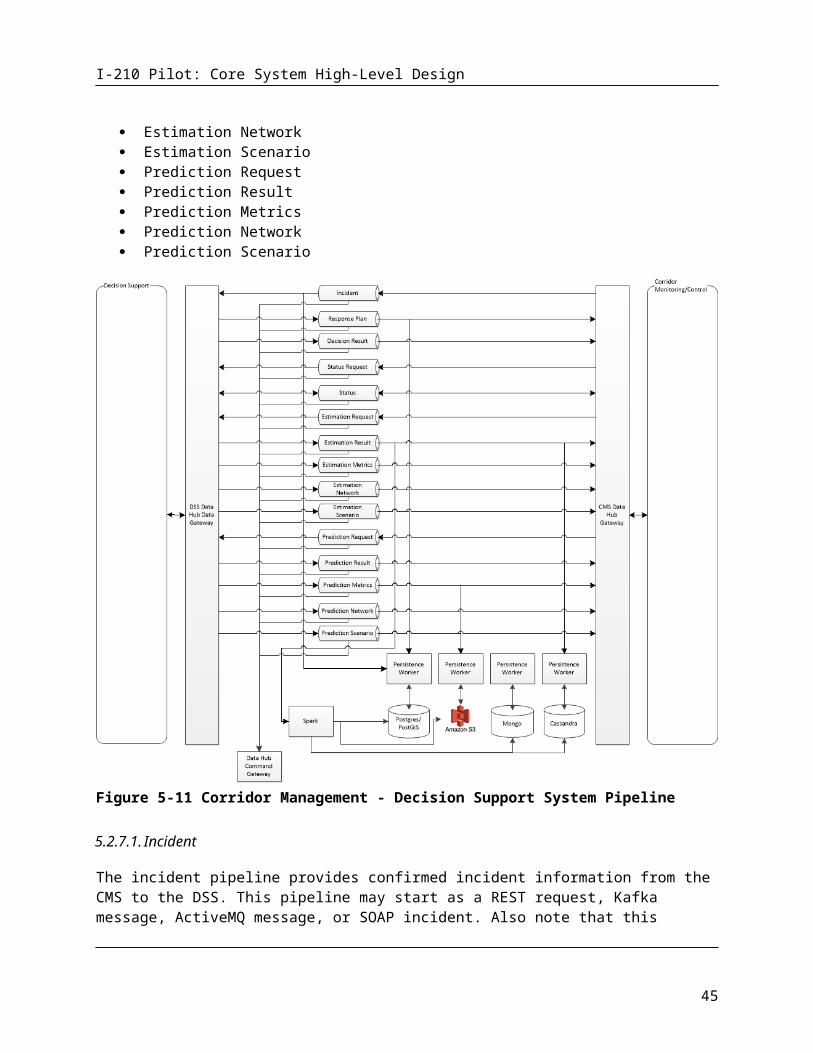
I-210 Pilot: Core System High-Level Design
Figure 6-18 - Modeling Component Design
The system is composed of several primary subsystems – Data management (in blue) – receives and processes traffic and traffic infrastructure data so
that it can be consumed by the modeling software. Estimation modeling system (in pink) – builds and runs estimations, produces output of
estimated traffic state. Prediction modeling system (in orange) – builds and runs predicted traffic state, in particular
predicted response plan performance, including performance metrics. Calculation/metrics (in light orange) – consumes estimated traffic state and produces current
traffic and network performance measures. Project Manager (in brown) – provides overall system orchestration, cloud scaling and EC2
management, workflow, and external REST interfaces. A user interface is available for estimation model development. This is currently used for internal testing and QA.
Persistence – (green/gray) – persists traffic/traffic infrastructure data, model and model building definitions, raw and processed results.
Communication with external systems and the modeling system is via a REST API exposed by the Project Manager. Data feeds from the data hub are provided data via ActiveMQ data topics. Internal component communication between modeling system components is via ActiveMQ topics (data) or queues (command).
45

I-210 Pilot: Core System High-Level Design
Technology stack: Primary components are built using Java with the Spring framework. Hibernate is used with
components requiring Postgres access. Persistence is built with Java based persistence workers (both for store and retrieve operations)
and Postgres v9.6.2 or Cassandra v3.10 for persistence. Messaging via ActiveMQ v5.14.5 Project Manager REST services hosted on Tomcat v8.5.15 Log Management via Graylog Amazon Web Services, including the following AWS services
o EC2o RDS (Postgres)o S3o VPCo IAMo Other services are used for code repository, build, and deployment services
Platform/Application Servers/OS Most any version of Linux OS is acceptable, Ubuntu 14.04 is the current standard Amazon Web Services Tomcat v8.5.15
General Architectural Approach:
The approach used has been to develop specific application components targeted to specific tasks, connect them to each other via messaging or REST services depending upon their application role (back end processing or service delivery), and provide scaling components that allow each individual component to detect load (CPU/thread utilization and its feeding queue state) and scale the number of instances of the resource type based on demand.
Primary component descriptions:
Model Engine – There are two versions of the model engine. The first is used for freeway estimation. The freeway model engine is the core component of the system that implements the CTM algorithm. This implementation is a simulation using a user defined road network, accompanying infrastructure elements including ramp meters and sensors, traffic demand, traffic behavior information (split ratios at intersections and freeway ramps), and road/traffic characteristics required by the CTM algorithm (fundamental diagrams). The simulation can be used to provide estimations of current state or predictions of future state, but is used only for freeway current traffic state within the ICM system.
The second version of the model engine is used for arterial estimation. This arterial model engine uses an algorithm using intersection sensing and signal timing and cycle information to produce an estimated traffic state of the corridor arterials.
Both types of model engine receive a request for a model run containing the scenario to be run and the desired configuration parameters. The model engine then runs the model and outputs the link state (traffic density and speed) for each road network link.
46

I-210 Pilot: Core System High-Level Design
The model engine is a multithreaded Java application, but the primary work currently remains single-threaded.
Prediction engine – The prediction engine is an implementation of TSS’s Aimsun software. It includes the Aimsun simulation software as well as a component that builds simulation models for use in the prediction workflow. The simulation build component combines a base simulation model with data from the data hub indicating current corridor asset state (signals, ramps, signs, etc), current traffic state from the freeway and arterial model engines, and the response plans from the response plan management system to create a set of one or more models that can be used to evaluate a response plan. It also provides the prediction metrics required for presentation to the user and the rules engine for response plan recommendation and selection.
Project Manager/Project Manager App - The project manager app allows external systems to interact with the modeling system. Project manager app provides REST services and messaging to initiate actions by the rest of the system. The project manager app is served via a Tomcat application server.
Scenario Builder - The scenario builder is used to create a scenario to be run. It is rarely used, but can be used when corridor infrastructure elements are modified, such as a ramp meter. It is a back-end component that receives model components (road networks, intersection signals, ramp meters, traffic demand and split sets, etc) from the project manager app and builds a model suitable for running in the freeway model engine.
Calculators - The calculators are used to take the model engine link state data and process it for consumption either as specific metrics for analysis, or as visualization information for the CMS. Each calculator job is single threaded and is designed for a specific calculation.
Persistence Worker - Persistence workers are components that are designed to either take data from a queue or topic (model engine data, model/scenario information, or calculator output) and persist it in one of the data stores (Postgres or Cassandra) or, upon request retrieve the data from one of the data stores and place in on the appropriate queue or topic for consumption by downstream processes.
Readers and Processors - These components are used to retrieve or accept pushed data from the data hub and place it into a queue or topic for consumption (reader) and to retrieve data from a queue or topic and process it for consumption by the model (processor) or prediction engine.
47


![[hal-00878469, v1] Adjoint-based optimization on a network of ...connected-corridors.berkeley.edu/sites/default/files...Alternatively, nonlinear optimization techniques can be applied](https://img.dokumen.tips/doc/110x75/60c44af02d2e87428620447c/hal-00878469-v1-adjoint-based-optimization-on-a-network-of-connected-.jpg)


