Embed Size (px)
Citation preview

Introduction (Table HH5, HH6 & HH7)
Since 1961 and uptil 1991 Census, two questionnaires of Individual Slip and Household Schedule were canvassed during the Population Enumeration. The adequacy of Individual slips as well as Household schedules for the Population Enumeration Phase-I of Census of India 2001 was reviewed in the Data Users conference and also with the Technical Advisory Committee constituted by the government for finalizing 2001 Census questions and format of questionnaire. An overwhelming number of data users advocated the use of one compact Household schedule which incorporates all the elements of the Individual slip for ease of canvassing and reducing cost. After detailed deliberations and on the recommendation of the Technical Advisory Committee, in the 2001 Census one compact questionnaire called ‘Household Schedule’ was used for collection of all the particulars during Population Enumeration phase of Census. The adoption of compact Household schedules facilitated collection of personal details for the entire Household in one schedule. This replaced the earlier system whereby Individual slip data collected in the field was transferred to Household schedule by the enumerator. Introduction of Image Based Processing using ICR technology has facilitated data capture in 100 per cent basis. This has helped in compiling several household level tables, which hitherto had never been attempted earlier except to an extent, in 1981 Census. 2. The Household is considered to be basic unit in a society for social, economic, political and socialization purpose. Sociologically, Household is a co-residential socio-economic unit regardless of kinship ties whereas family is a group - membership in which is mainly based on affinal and consanguinal ties. As per Linton (1936: 152-159 – Linton, Ralph – The study of Man), ‘while both household and families are culturally defined, the former are task-oriented residence units and the latter are conceived of as kinship groupings that need not be localized’. But the family is also co-residential, socio-economic unit in most cases. The type and size of the household in most of the societies are influenced by kinship rules, demographic and socio-economic factors, level of urbanization and industrialization. Therefore to understand the social structure of a society, its cohabitation pattern and congestion at a given point of time, the Household level data is a very useful tool.
3. Census in India traditionally collects information on three types of household namely Normal households, Institutional Households and Houseless Households. The present release, second in series on ‘Household Tables’, caters to the aged (60 years and above) by household size, marital status of head of the household and households by religion of head of the household and household size. The data presented corresponds to the tables HH-5, HH-6 and HH-7 and exclude institutional households. Currently these tables are being released in electronic format. Subsequently printed volume of these tables will also be brought out. The level of presentation for the respective tables is as follows:-
Lowest level of presentation Table No.
Title Electronic format Printed volume
HH-5 Households with number of aged persons 60 years and above by sex and household size
City City (Million plus)
HH-6 Households by marital status, sex and age of the head of Household
District State
HH-7 Households by religion, sex of the head of household and household size
State State
Census of India 2001 : Page 1 of 13

4. The concepts and definitions of the data items included in these set of tables and used in 2001 census are given at Annexure 2.
Data Highlights HH-5: Households with number of aged persons 60 years and above by sex and
household size. Of the 193.1 million households (excluding institutional households) at the national
level enumerated at the 2001 Census, about 58.3 million or 30.2 per cent of the households are reported to have at least one elderly person (60 years and above) as member of the household. Whereas, about 21.3 per cent of the households have recorded one elderly person as member, the proportion of households with two elderly persons was 8.4 per cent. The proportion of households with three or more elderly persons was a meager 0.5 per cent. The rural-urban differential is apparent with higher proportion of elderly population reported from rural households compared to the urban households. About 134.9 million or 69.8 per cent of the households (94 million or 68.4 per cent from rural areas and 40.8 million or 73.4 per cent from urban areas) did not report any aged population at the national level. The Statement 1 below gives, by residence, the number and proportion of households by number of aged persons 60 years and above.
Statement 1: Number and percentage distribution of households* by number of aged
persons 60 years and above and residence, India – 2001 Households with aged population 60 years and above Percentage Number
of aged Total Rural Urban Total Rural Urban
Total 193,119,360 137,495,260 55,624,100 100.00 100.00 100.00 None 134,852,466 94,035,577 40,816,889 69.83 68.39 73.38
1 41,117,035 30,317,317 10,799,718 21.29 22.05 19.42 2 16,294,024 12,501,423 3,792,601 8.44 9.09 6.82 3 763,059 574,151 188,908 0.40 0.42 0.34
4+ 92,776 66,792 25,984 0.05 0.05 0.05 * Exclude Institutional households
Note: India figures exclude Mao Maram, Paomata and Purul sub-divisions of Senapati district of Manipur. Statement 2 gives, at the national level, the percentage distribution of households by
household size cross classified by the number of aged persons per household by residence. As expected, the larger is the size of the household, the higher is the chance of finding at least one aged person in it. There are two important cell values in this statement that are socially important and give some preliminary insight into the living arrangement of the elderly. These are, the single member household with the only member being an aged person and the two-member household with both the members having age 60 years and above. Out of all the households having one aged member living in them, about 7.5 per cent (3.1 million) of households are single member households. In other words, 3.1 million out of the 76.4 million aged persons in the country live alone - 2.5 million in rural and 0.6 million in urban. Out of all the households having exactly two members with age 60 years and above, 15.8 percent households (2.6 million) are such which are two member households. Rural-Urban differentials are apparent with higher proportions being reported from the rural areas than in urban areas for these two categories of the households.
Census of India 2001 : Page 2 of 13

Statement 2: Percentage distribution of households* by household size and number of aged persons 60 years and above per household, India – 2001
Household sizeNumber of aged Total 1 2 3 4 5 6 7+
Total
At least one
aged 60+
100.0 5.3 9.9 7.8 10.0 14.0 14.4 38.5
1 100.0 7.5 7.8 8.0 11.2 16.0 15.1 34.42 100.0 0.0 15.8 7.4 7.3 9.5 13.0 47.03 100.0 0.0 0.0 8.9 6.0 6.7 9.1 69.3
4+ 100.0 0.0 0.0 0.0 4.8 3.9 4.4 86.9
Rural
At least one
aged 60+ aged
100.0 5.7 10.4 7.7 9.6 13.2 14.2 39.3
1 100.0 8.2 8.0 7.8 10.6 15.1 15.1 35.22 100.0 0.0 16.7 7.3 7.3 9.0 12.2 47.63 100.0 0.0 0.0 8.7 5.6 6.3 8.5 70.8
4+ 100.0 0.0 0.0 0.0 4.2 3.2 3.8 88.8 Urban
At least one
aged 60+ aged
100.0 4.0 8.6 8.3 11.4 16.4 15.2 36.1
1 100.0 5.5 7.1 8.6 12.9 18.4 15.2 32.32 100.0 0.0 13.1 7.4 7.7 11.1 15.6 45.13 100.0 0.0 0.0 9.5 7.2 7.9 11.0 64.5
4+ 100.0 0.0 0.0 0.0 6.4 5.7 6.0 81.9* Exclude Institutional households Note: India figures exclude Mao Maram, Paomata and Purul sub-divisions of Senapati district of Manipur. An interesting feature of the data set is the sex composition of the aged in the
households of different sizes (Statement 3). The overall sex ratio of the elderly persons is more or less balanced with a slight tilt towards females. The sex ratio of all the aged persons living as single member household is highly feminine which essentially means that a larger number of females than males live alone. In terms of absolute numbers, 2.1 million out of 38.8 million (5.5 percent) of the elderly women aged 60 years and above in the country live alone. The sex ratio of elderly (882 females per thousand males) in two-member household is masculine. This is mainly due to a very low sex ratio (687 females per thousand males) in such households having only one aged person. The sex ratio for elderly persons in household size 5 and 6 is highly feminine. The sex ratio (1010 females per thousand males) in the category ‘two aged persons’ is the most balanced sex ratio in all categories of the aged and is also uniform across all size of households. This is probably due to presence of one aged couple in the household across the households of different sizes.
Census of India 2001 : Page 3 of 13
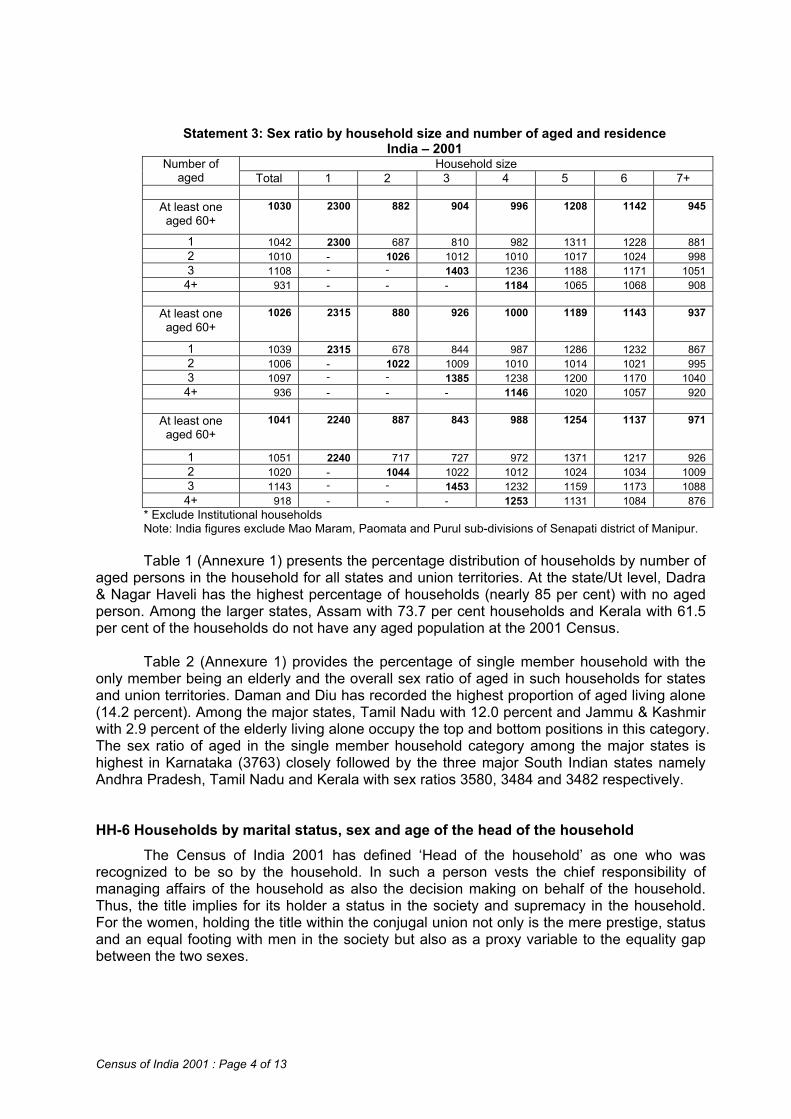
Statement 3: Sex ratio by household size and number of aged and residence India – 2001
Household sizeNumber of aged Total 1 2 3 4 5 6 7+
At least one aged 60+
1030 2300 882 904 996 1208 1142 945
1 1042 2300 687 810 982 1311 1228 881 2 1010 - 1 26 0 1012 1010 1017 1024 998 3 1108 - - 1403 1236 1188 1171 1051
4+ 931 - - - 1184 1065 1068 908
At least one aged 60+
1026 2315 880 926 1000 1189 1143 937
1 1039 2315 678 844 987 1286 1232 867 2 1006 - 1 22 0 1009 1010 1014 1021 995 3 1097 - - 1385 1238 1200 1170 1040
4+ 936 - - - 1146 1020 1057 920
At least one aged 60+
1041 2240 887 843 988 1254 1137 971
1 1051 2240 717 727 972 1371 1217 926 2 1020 - 1044 1022 1012 1024 1034 1009 3 1143 - - 1453 1232 1159 1173 1088
4+ 918 - - - 1253 1131 1084 876 * Exclude Institutional households Note: India figures exclude Mao Maram, Paomata and Purul sub-divisions of Senapati district of Manipur. Table 1 (Annexure 1) presents the percentage distribution of households by number of
aged persons in the household for all states and union territories. At the state/Ut level, Dadra & Nagar Haveli has the highest percentage of households (nearly 85 per cent) with no aged person. Among the larger states, Assam with 73.7 per cent households and Kerala with 61.5 per cent of the households do not have any aged population at the 2001 Census.
Table 2 (Annexure 1) provides the percentage of single member household with the
only member being an elderly and the overall sex ratio of aged in such households for states and union territories. Daman and Diu has recorded the highest proportion of aged living alone (14.2 percent). Among the major states, Tamil Nadu with 12.0 percent and Jammu & Kashmir with 2.9 percent of the elderly living alone occupy the top and bottom positions in this category. The sex ratio of aged in the single member household category among the major states is highest in Karnataka (3763) closely followed by the three major South Indian states namely Andhra Pradesh, Tamil Nadu and Kerala with sex ratios 3580, 3484 and 3482 respectively.
HH-6 Households by marital status, sex and age of the head of the household The Census of India 2001 has defined ‘Head of the household’ as one who was
recognized to be so by the household. In such a person vests the chief responsibility of managing affairs of the household as also the decision making on behalf of the household. Thus, the title implies for its holder a status in the society and supremacy in the household. For the women, holding the title within the conjugal union not only is the mere prestige, status and an equal footing with men in the society but also as a proxy variable to the equality gap between the two sexes.
Census of India 2001 : Page 4 of 13

Statement 4 presents, at the national level, the percentage of female-headed households by residence at the 2001 Census along with similar data as obtained from NFHS-2 (1998-1999) and NSSO–55th Round (1999-2000).
Statement 4: Percentage of female-headed households Census 2001, NFHS –II and NSSO – 55th Round, India
Residence Census 2001* NFHS-2 (1988-89) NSSO –55th round
Total 10.4 10.3 .. Rural 10.1 10.0 10.4 Urban 11.1 11.1 9.4
* Exclude Institutional households Note: India figures (Census 2001) exclude Mao Maram, Paomata and Purul sub-divisions of Senapati
district of Manipur. According to the 2001 Census, at the national level the percentage of female-
headed households is only 10.4 percent, with a marginal differential of one percentage point between the rural and urban areas. Whereas, the data provided by NFHS-2 is almost similar to the census that from NSSO 55th Round shows an appreciable variation of nearly two percentage points in the urban areas. Contrary to both Census and NFHS-2 the data from NSSO gives a higher proportion of female-headed households in the rural areas as compared to the urban areas. The distribution of households by the other two characteristics of the head of the household namely age and marital status provides further insight into the nature of female-headed households.
Table 3 (Annexure 1) gives the percentage of female-headed households for states and union territories. Lakshadweep with 34.4 percent female-headed households top the list, followed by Meghalaya (23.0 percent) and Kerala (22.6 percent). The bottom three positions are held by Rajasthan (6.9 percent), Jammu & Kashmir (6.8 percent) and Dadra & Nagar Haveli (6.3 percent).
Statement 5 below gives the distribution of 1000 households by different marital status
categories of head of the household irrespective of sex separately for rural and urban areas.
Statement 5: Distribution of 1000 households by marital status of head of the household (irrespective of sex) by residence, India*- 2001
Never Married Currently Married Widowed Divorced/SeparatedResidence Total
Households Male head
Female head
Male head
Female head
Male head
Female head
Male head
Female head
Total 1000 25 4 835 28 35 68 2 3 Rural 1000 23 3 836 29 38 66 2 4 Urban 1000 30 5 833 27 25 75 2 3 * Exclude Institutional households
Note: India figures exclude Mao Maram, Paomata and Purul sub-divisions of Senapati district of Manipur. It is clear from the statement that currently married males, quite expectedly, head a
vast majority of the households (835 out of every 1000 households). The next highest category is ‘widowed’ wherefrom 68 females out of every 1000 households have been reported as head of the household. Rural-Urban differentials are insignificant in all categories except in case of widowed members as head, where the percentage is slightly higher in urban area. It may be interesting to compare the data thrown up by Census 2001 with the data from an external source. Statement 6 gives the percent distribution of household by age of head of the household as reported at Census 2001 along with that from the National Family Health Survey–2 undertaken in 1998-99. The two data sets, as will be apparent from the table, compare reasonably well. Only about 10 to 11 percent households have reported persons in
Census of India 2001 : Page 5 of 13
the young age group as head while for the oldest age group, this ranges between 17 to 19 percent.
Statement 6: Percent distribution of households by age of
head of the household, India Census 2001* NFHS-2 (1998-99) Age of head of
household Rural Urban Rural Urban Less than 30 10.9 9.9 11.4 9.7
30-59 68.2 72.1 66.3 71.2 60+ 19.1 16.6 22.4 19.2
Age not stated 1.7 1.4 - - * Exclude Institutional households Note: India figures (Census 2001) exclude Mao Maram, Paomata and Purul
sub-divisions of Senapati district of Manipur.
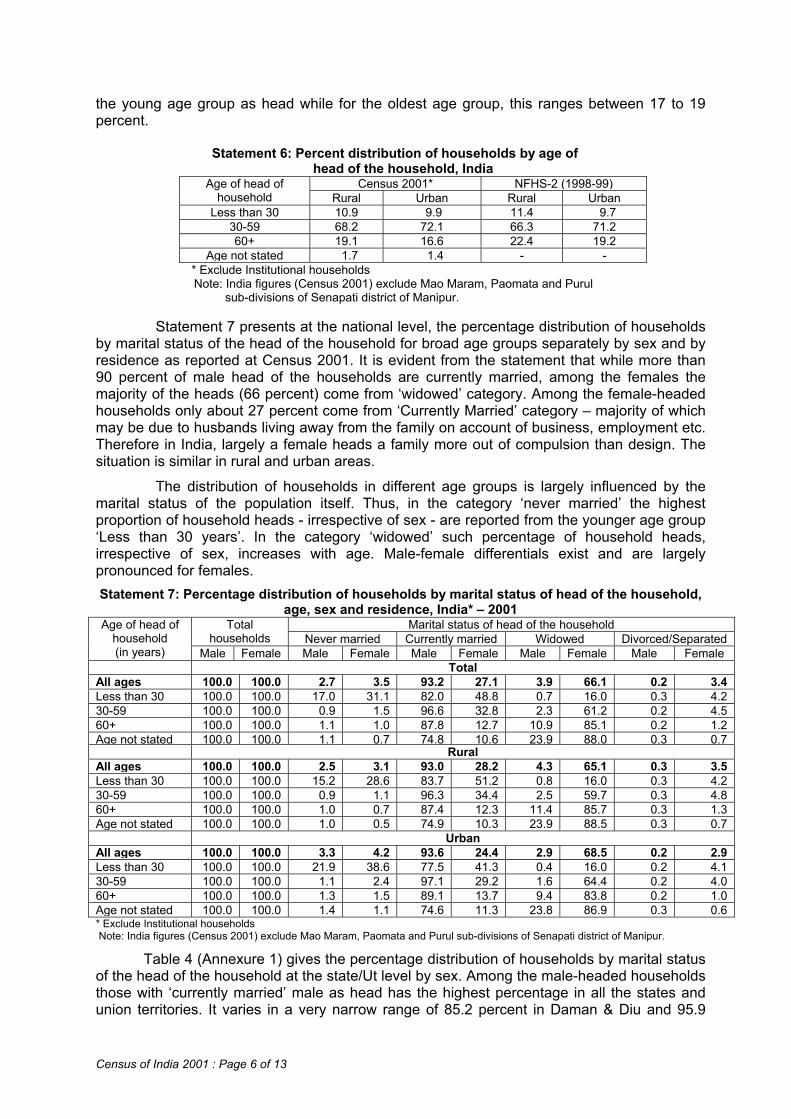
Statement 7 presents at the national level, the percentage distribution of households by marital status of the head of the household for broad age groups separately by sex and by residence as reported at Census 2001. It is evident from the statement that while more than 90 percent of male head of the households are currently married, among the females the majority of the heads (66 percent) come from ‘widowed’ category. Among the female-headed households only about 27 percent come from ‘Currently Married’ category – majority of which may be due to husbands living away from the family on account of business, employment etc. Therefore in India, largely a female heads a family more out of compulsion than design. The ituation is similar in rural and urban areas. s
The distribution of households in different age groups is largely influenced by the
marital status of the population itself. Thus, in the category ‘never married’ the highest proportion of household heads - irrespective of sex - are reported from the younger age group ‘Less than 30 years’. In the category ‘widowed’ such percentage of household heads, irrespective of sex, increases with age. Male-female differentials exist and are largely pronounced for females.
Statement 7: Percentage distribution of households by marital status of head of the household,
age, sex and residence, India* – 2001 Marital status of head of the household Total
households Never married Currently married Widowed Divorced/SeparatedAge of head of
household (in years) Male Female Male Female Male Female Male Female Male Female
TotalAll ages 100.0 100.0 2.7 3.5 93.2 27.1 3.9 66.1 0.2 3.4Less than 30 100.0 100.0 17.0 31.1 82.0 48.8 0.7 16.0 0.3 4.230-59 100.0 100.0 0.9 1.5 96.6 32.8 2.3 61.2 0.2 4.560+ 100.0 100.0 1.1 1.0 87.8 12.7 10.9 85.1 0.2 1.2Age not stated 100.0 100.0 1.1 0.7 74.8 10.6 23.9 88.0 0.3 0.7 RuralAll ages 100.0 100.0 2.5 3.1 93.0 28.2 4.3 65.1 0.3 3.5Less than 30 100.0 100.0 15.2 28.6 83.7 51.2 0.8 16.0 0.3 4.230-59 100.0 100.0 0.9 1.1 96.3 34.4 2.5 59.7 0.3 4.860+ 100.0 100.0 1.0 0.7 87.4 12.3 11.4 85.7 0.3 1.3Age not stated 100.0 100.0 1.0 0.5 74.9 10.3 23.9 88.5 0.3 0.7 UrbanAll ages 100.0 100.0 3.3 4.2 93.6 24.4 2.9 68.5 0.2 2.9Less than 30 100.0 100.0 21.9 38.6 77.5 41.3 0.4 16.0 0.2 4.130-59 100.0 100.0 1.1 2.4 97.1 29.2 1.6 64.4 0.2 4.060+ 100.0 100.0 1.3 1.5 89.1 13.7 9.4 83.8 0.2 1.0Age not stated 100.0 100.0 1.4 1.1 74.6 11.3 23.8 86.9 0.3 0.6* Exclude Institutional households Note: India figures (Census 2001) exclude Mao Maram, Paomata and Purul sub-divisions of Senapati district of Manipur.
Table 4 (Annexure 1) gives the percentage distribution of households by marital status of the head of the household at the state/Ut level by sex. Among the male-headed households those with ‘currently married’ male as head has the highest percentage in all the states and union territories. It varies in a very narrow range of 85.2 percent in Daman & Diu and 95.9
Census of India 2001 : Page 6 of 13

percent in Andhra Pradesh. However, percentage of currently married females as head varies very widely between 9.6 percent in Mizoram to 64.8 in Lakshadweep. It would be interesting to see that Uttaranchal Himachal Pradesh, Bihar, Meghalaya and Jammu & Kashmir have very high currently married females. Except for Meghalaya, where the matriarchal society among the major tribes may be the reason, the main reason can be indicative of the main breadwinner staying elsewhere for employment or business. The other important category is the ‘widowed’ female as head of household. It ranges from 28.3 percent in Lakshadweep to 77.1 percent in Gujarat. The two northeastern states of Mizoram and Meghalaya have very high percentage of female-headed households who are divorced or separated (20.9 percent and 13.5 percent respectively). HH-7: Households by religion, sex of head of the household and household size
Table HH-7 provides data on households by religion, sex of head of the household and household size as reflected at the 2001 Census and relates to normal and houseless households only. This table provides an interesting insight into the differentials that exist in the various religious communities in terms of female-headed household and also in terms of the size of the household.
Statement 8 below gives, at the national level, the percentage distribution of female-
headed households by religious communities and size of the household as revealed by Census 2001. Across the religious communities Christians (15.2 per cent) reported the highest percentage of such households followed by Buddhists (12.6 per cent). The pattern is similar when one looks at the distribution across the religious communities by size of the household. For households with household size 2 and more the percentage of female-headed households is highest in the two member households. Over the rural and urban place of residence there is a higher percentage of female-headed households in the urban areas than in the rural areas for all the religious communities except for ‘Jains’. The Jains, at 10.0 percent, recorded nearly 2 percentage point higher female-headed households in rural areas than in urban areas.
Statement 8: Percentage distribution of female-headed households by religious
communities and size of the household, India* - 2001
Household size
All households+
Hindus Muslims Christians Sikhs Buddhists Jains Others
Total Total 10.4 10.1 10.6 15.2 9.3 12.6 8.8 13.2 1 48.9 48.7 49.8 53.6 36.8 53.6 56.4 54.6 2 18.9 18.4 20.4 27.1 18.5 22.2 16.2 23.5 3-6 8.6 8.2 10.2 12.5 8.6 9.9 6.3 10.9 7-10 5.8 5.5 6.4 10.2 6.7 7.0 6.6 7.3 11+ 6.4 5.8 8.4 12.3 7.8 9.6 8.1 8.6 Rural Total 10.1 9.9 10.2 14.3 8.8 12.5 10.0 12.7 1 54.0 54.0 56.2 55.4 37.8 57.9 60.5 56.0 2 18.6 18.2 20.2 26.2 17.8 21.4 16.6 22.9 3-6 8.4 8.1 10.0 12.0 8.5 9.2 6.4 10.6 7-10 4.7 4.5 5.2 8.5 5.8 5.1 4.0 6.8 11+ 4.6 4.2 6.0 9.0 6.6 5.5 4.3 7.7 Urban Total 11.0 10.7 11.3 16.8 10.5 12.9 8.4 17.4 1 36.0 35.0 36.7 50.5 34.7 42.3 53.3 46.3 2 19.5 18.9 20.9 28.7 20.0 24.2 16.0 28.2 3-6 8.9 8.5 10.7 13.3 8.9 10.8 6.3 14.1 7-10 9.3 9.3 8.6 15.2 9.6 10.2 7.4 12.3 11+ 12.1 12.1 12.0 20.6 13.2 15.1 9.5 16.7 * Exclude Institutional households + ‘All households’ include ‘Religion not stated’
Note: India figures exclude Mao Maram, Paomata and Purul sub-divisions of Senapati district of Manipur.
Census of India 2001 : Page 7 of 13

Statement 9 gives, at the national level, the mean household size of the male-headed and female-headed households by religious communities and residence for 2001 Census. At the overall level the average size of the male-headed households is higher by about one and a half member than the female-headed households. Such variation is higher in rural areas
Statement 9: Mean household size of the male headed and female headed
households by religious communities and residence, India* – 2001
Mean household sizeTotal Rural Urban
Religious community
Male headed
Female headed
Male headed
Female headed
Male headed
Female headed
All religious communities+
5.4
4.0 5.6 3.8 5.2 4.5
Hindus 5.3 3.8 5.5 3.7 5.0 4.3 Muslims 6.3 4.9 6.2 4.5 6.4 5.7 Christians 4.9 3.8 5.0 3.8 4.5 3.8 Sikhs 5.7 4.8 5.9 4.8 5.3 4.8 Buddhists 5.1 3.7 5.0 3.3 5.1 4.3 Jains 5.3 4.2 5.3 3.1 5.3 4.5 Others 5.3 3.9 5.4 3.9 5.0 4.0
* Exclude Institutional households + ‘All religious communities’ include ‘Religion not stated’ Note: India figures exclude Mao Maram, Paomata and Purul sub-divisions of Senapati district of Manipur.
where the size of male-headed households exceeds the female-headed households almost by two members. Across the religious communities the difference in the size of male headed and female-headed households is the highest (by one and a half member) for the Hindus. This is followed by Muslims and Buddhists where such difference at 1.4 members is slightly lower than that for Hindus. Such difference is recorded to be negligible for the Christians.
---- # ---
Census of India 2001 : Page 8 of 13

Annexure 1
Table 1: Percentage distribution of households* with no aged person to total households, India - 2001
India/State/Union territory Number of households Percentage Total With no aged person
1 2 3 4 India 193,119,360 134,852,466 69.8Jammu & Kashmir 1,561,667 1,061,753 68.0Himachal Pradesh 1,219,062 803,409 65.9Punjab 4,338,365 2,804,173 64.6Chandigarh 205,892 172,199 83.6Uttaranchal 1,596,462 1,090,143 68.3Haryana 3,705,461 2,588,136 69.8Delhi 2,728,094 2,184,151 80.1Rajasthan 9,296,433 6,484,627 69.8Uttar Pradesh 25,687,792 17,200,236 67.0Bihar 13,721,541 9,659,163 70.4Sikkim 113,997 90,951 79.8Arunachal Pradesh 213,447 173,749 81.4Nagaland 326,072 259,758 79.7Manipur 373,478 262,821 70.4Mizoram 175,616 137,572 78.3Tripura 663,662 475,607 71.7Meghalaya 417,171 329,864 79.1Assam 4,901,623 3,612,468 73.7West Bengal 15,839,771 11,240,724 71.0Jharkhand 4,789,216 3,567,834 74.5Orissa 7,720,150 5,350,423 69.3Chhattisgarh 4,084,777 2,928,175 71.7Madhya Pradesh 10,893,229 7,707,634 70.8Gujarat 9,667,891 7,061,689 73.0Daman & Diu 35,557 29,106 81.9Dadra & Nagar Haveli 45,430 38,545 84.8Maharashtra 19,521,809 13,288,607 68.1Andhra Pradesh 16,961,431 12,342,379 72.8Karnataka 10,380,116 7,151,077 68.9Goa 293,758 204,212 69.5Lakshadweep 9,957 6,957 69.9Kerala 6,713,465 4,126,800 61.5Tamil Nadu 14,624,073 10,203,554 69.8Pondicherry 215,100 150,132 69.8Andaman & Nicobar Islands 77,795 63,838 82.1 * - Exclude Institutional households. Note: India excludes Mao Maram, Paomata and Purul sub-divisions of Senapati district of Manipur.
Census of India 2001 : Page 9 of 13
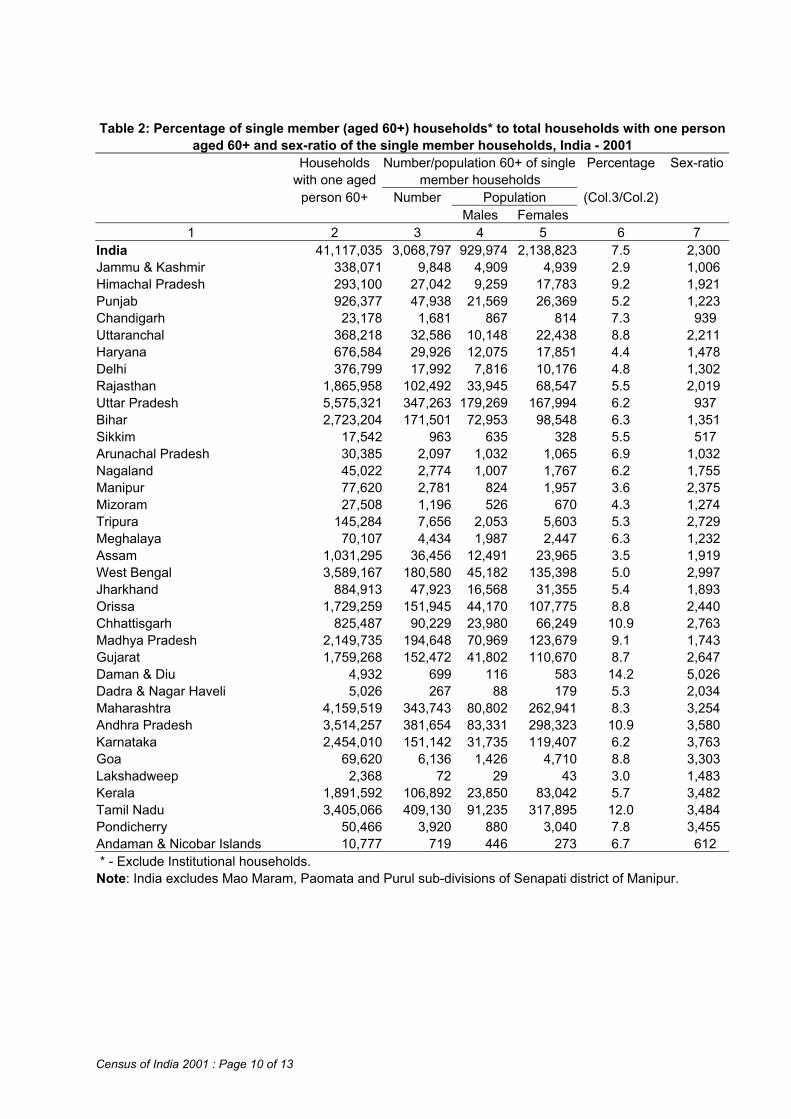
Table 2: Percentage of single member (aged 60+) households* to total households with one person aged 60+ and sex-ratio of the single member households, India - 2001 Households Number/population 60+ of single Percentage Sex-ratio with one aged member households person 60+ Number Population (Col.3/Col.2) Males Females 1 2 3 4 5 6 7
India 41,117,035 3,068,797 929,974 2,138,823 7.5 2,300 Jammu & Kashmir 338,071 9,848 4,909 4,939 2.9 1,006 Himachal Pradesh 293,100 27,042 9,259 17,783 9.2 1,921 Punjab 926,377 47,938 21,569 26,369 5.2 1,223 Chandigarh 23,178 1,681 867 814 7.3 939 Uttaranchal 368,218 32,586 10,148 22,438 8.8 2,211 Haryana 676,584 29,926 12,075 17,851 4.4 1,478 Delhi 376,799 17,992 7,816 10,176 4.8 1,302 Rajasthan 1,865,958 102,492 33,945 68,547 5.5 2,019 Uttar Pradesh 5,575,321 347,263 179,269 167,994 6.2 937 Bihar 2,723,204 171,501 72,953 98,548 6.3 1,351 Sikkim 17,542 963 635 328 5.5 517 Arunachal Pradesh 30,385 2,097 1,032 1,065 6.9 1,032 Nagaland 45,022 2,774 1,007 1,767 6.2 1,755 Manipur 77,620 2,781 824 1,957 3.6 2,375 Mizoram 27,508 1,196 526 670 4.3 1,274 Tripura 145,284 7,656 2,053 5,603 5.3 2,729 Meghalaya 70,107 4,434 1,987 2,447 6.3 1,232 Assam 1,031,295 36,456 12,491 23,965 3.5 1,919 West Bengal 3,589,167 180,580 45,182 135,398 5.0 2,997 Jharkhand 884,913 47,923 16,568 31,355 5.4 1,893 Orissa 1,729,259 151,945 44,170 107,775 8.8 2,440 Chhattisgarh 825,487 90,229 23,980 66,249 10.9 2,763 Madhya Pradesh 2,149,735 194,648 70,969 123,679 9.1 1,743 Gujarat 1,759,268 152,472 41,802 110,670 8.7 2,647 Daman & Diu 4,932 699 116 583 14.2 5,026 Dadra & Nagar Haveli 5,026 267 88 179 5.3 2,034 Maharashtra 4,159,519 343,743 80,802 262,941 8.3 3,254 Andhra Pradesh 3,514,257 381,654 83,331 298,323 10.9 3,580 Karnataka 2,454,010 151,142 31,735 119,407 6.2 3,763 Goa 69,620 6,136 1,426 4,710 8.8 3,303 Lakshadweep 2,368 72 29 43 3.0 1,483 Kerala 1,891,592 106,892 23,850 83,042 5.7 3,482 Tamil Nadu 3,405,066 409,130 91,235 317,895 12.0 3,484 Pondicherry 50,466 3,920 880 3,040 7.8 3,455 Andaman & Nicobar Islands 10,777 719 446 273 6.7 612 * - Exclude Institutional households. Note: India excludes Mao Maram, Paomata and Purul sub-divisions of Senapati district of Manipur.
Census of India 2001 : Page 10 of 13

Table 3: Percentage of female headed households to total households*
India - 2001
India/States/Union territories Number of households Percentage Total Female headed India 193,119,360 19,987,858 10.4 Jammu & Kashmir 1,561,667 105,929 6.8 Himachal Pradesh 1,219,062 218,594 17.9 Punjab 4,338,365 418,948 9.7 Chandigarh 205,892 14,809 7.2 Uttaranchal 1,596,462 260,279 16.3 Haryana 3,705,461 299,198 8.1 Delhi 2,728,094 238,090 8.7 Rajasthan 9,296,433 644,547 6.9 Uttar Pradesh 25,687,792 2,031,752 7.9 Bihar 13,721,541 1,012,794 7.4 Sikkim 113,997 11,061 9.7 Arunachal Pradesh 213,447 21,873 10.2 Nagaland 326,072 29,921 9.2 Manipur 373,478 49,074 13.1 Mizoram 175,616 21,720 12.4 Tripura 663,662 73,305 11.0 Meghalaya 417,171 95,841 23.0 Assam 4,901,623 501,789 10.2 West Bengal 15,839,771 1,709,373 10.8 Jharkhand 4,789,216 398,933 8.3 Orissa 7,720,150 776,322 10.1 Chhattisgarh 4,084,777 450,416 11.0 Madhya Pradesh 10,893,229 814,667 7.5 Gujarat 9,667,891 777,962 8.0 Daman & Diu 35,557 6,690 18.8 Dadra & Nagar Haveli 45,430 2,858 6.3 Maharashtra 19,521,809 1,976,118 10.1 Andhra Pradesh 16,961,431 1,920,951 11.3 Karnataka 10,380,116 1,441,807 13.9 Goa 293,758 62,171 21.2 Lakshadweep 9,957 3,429 34.4 Kerala 6,713,465 1,514,107 22.6 Tamil Nadu 14,624,073 2,041,997 14.0 Pondicherry 215,100 32,928 15.3 Andaman & Nicobar Islands 77,795 7,605 9.8 * - Exclude Institutional households. Note: India excludes Mao Maram, Paomata and Purul sub-divisions of Senapati district of Manipur.
Census of India 2001 : Page 11 of 13

Table 4: Percentage distribution of households* by marital status of head of the household and sex India/States/Union territories - 2001
India/States/Union territories Total Households Marital status of head of the household Never married Currently Married Widowed Divorced/Separated Male Female Male Female Male Female Male Female Male Female head head head head head head head head head head India 100.0 100.0 2.7 3.5 93.2 27.1 3.9 66.1 0.2 3.4Jammu & Kashmir 100.0 100.0 2.6 4.3 92.8 41.8 4.5 52.5 0.2 1.4Himachal Pradesh 100.0 100.0 3.3 2.4 91.9 43.3 4.5 53.2 0.3 1.2Punjab 100.0 100.0 2.3 2.1 92.6 27.3 4.9 69.6 0.2 1.0Chandigarh 100.0 100.0 5.8 4.6 91.9 29.9 2.0 63.2 0.2 2.3Uttaranchal 100.0 100.0 3.1 2.2 91.8 44.1 4.8 52.8 0.2 0.9Haryana 100.0 100.0 2.2 2.0 93.7 27.3 4.0 69.9 0.1 0.8Delhi 100.0 100.0 4.0 3.4 92.9 24.9 3.0 70.1 0.1 1.6Rajasthan 100.0 100.0 2.4 2.6 93.1 33.6 4.3 62.5 0.2 1.3Uttar Pradesh 100.0 100.0 3.7 7.6 89.2 39.4 6.8 52.3 0.2 0.7Bihar 100.0 100.0 2.6 4.3 92.3 42.5 5.1 52.6 0.1 0.6Sikkim 100.0 100.0 7.4 10.7 87.4 33.6 3.9 47.0 1.2 8.7Arunachal Pradesh 100.0 100.0 5.9 11.3 90.6 37.2 3.0 45.7 0.6 5.9Nagaland 100.0 100.0 4.3 13.0 93.1 24.9 1.8 53.8 0.7 8.3Manipur 100.0 100.0 2.1 3.9 93.6 14.8 3.7 75.4 0.6 5.9Mizoram 100.0 100.0 6.8 10.9 87.7 9.6 3.0 58.5 2.5 20.9Tripura 100.0 100.0 3.1 3.2 94.0 18.0 2.5 71.8 0.3 7.0Meghalaya 100.0 100.0 4.1 5.9 91.9 42.1 2.7 38.5 1.3 13.5Assam 100.0 100.0 4.5 3.9 91.8 22.0 3.4 70.7 0.3 3.4West Bengal 100.0 100.0 2.8 3.4 94.6 19.4 2.3 72.4 0.3 4.7Jharkhand 100.0 100.0 2.9 4.8 92.6 30.5 4.3 63.1 0.2 1.6Orissa 100.0 100.0 3.2 4.1 93.1 25.2 3.4 66.7 0.3 4.0Chhattisgarh 100.0 100.0 2.5 3.8 92.8 26.1 4.2 64.5 0.5 5.6Madhya Pradesh 100.0 100.0 2.6 3.0 92.5 24.8 4.5 68.7 0.3 3.5Gujarat 100.0 100.0 2.3 2.7 93.5 17.6 3.7 77.1 0.4 2.7Daman & Diu 100.0 100.0 12.8 2.9 85.2 41.6 1.7 53.3 0.3 2.2Dadra & Nagar Haveli 100.0 100.0 7.1 3.4 91.2 38.0 1.3 54.8 0.3 3.8Maharashtra 100.0 100.0 2.8 3.0 94.6 23.7 2.4 69.0 0.2 4.3Andhra Pradesh 100.0 100.0 1.4 1.8 95.9 20.7 2.4 73.2 0.2 4.3Karnataka 100.0 100.0 3.0 3.1 94.2 24.1 2.6 69.4 0.2 3.3Goa 100.0 100.0 6.1 4.4 90.9 25.2 2.8 69.1 0.2 1.3Lakshadweep 100.0 100.0 6.4 2.2 90.1 64.8 2.8 28.3 0.7 4.6Kerala 100.0 100.0 2.0 2.7 95.2 29.6 2.6 62.5 0.3 5.1Tamil Nadu 100.0 100.0 2.0 2.0 94.4 22.4 3.3 71.2 0.3 4.4Pondicherry 100.0 100.0 2.5 2.8 94.7 17.0 2.5 75.7 0.3 4.6Andaman & Nicobar Islands 100.0 100.0 5.6 4.3 91.6 31.2 2.3 60.2 0.5 4.3 * - Exclude Institutional households. Note: India excludes Mao Maram, Paomata and Purul sub-divisions of Senapati district of Manipur.
Census of India 2001 : Page 12 of 13

Annexure 2 Concepts and Definitions
Household: A ‘household’ is usually a group of persons who normally live together and take their meals from a common kitchen unless the exigencies of work prevent any of them from doing so. Persons in a household may be related or unrelated or a mix of both. However, if a group of unrelated persons live in a census house but do not take their meals from the common kitchen, then they are not constituent of a common household. Each such person should be treated as a separate household. The important link in finding out whether it is a household or not, is a common kitchen. There may be one member households, two member households or multi-member households. In a few situations, it may become difficult to apply the definition of household strictly as given above. For example, a person living alone in a census house whether cooking or not cooking meals is treated as a household. Similarly, if husband and wife or a group of related persons are living together in a census house but not cooking their meals, it also constitutes a normal household. Institutional households- A group of unrelated persons who live in an institution and take their meals from a common kitchen is called an Institutional Household. Examples of Institutional Households are boarding houses, messes, hostels, hotels, rescue homes, jails, ashrams, orphanages, etc.
If in a building which is occupied by an Institutional Household, the families of the warden and the peon are also living in separate census houses and cooking for themselves separately, then each of the family is treated as separate household and the houses occupied by them is treated as separate census houses. In this situation there will be one building, three census houses and three households i.e. one Institutional Household and two Normal Households. If a group of unrelated persons, sharing a common kitchen, is found living in a census house which is not an institution, such a household does not form an Institutional Household but is treated like other Normal household.
Houseless households- Households who do not live in buildings or census houses but live in the open on roadside, pavements, in Hume pipes, under flyovers and staircases, or in the open in places of worship, mandaps, railway platforms, etc. are treated as Houseless households.
Head of the household- The head of household for census purposes was defined to be one who was recognized as such by the household. She or he was generally the person who chiefly responsible for managing the affairs of the household and took decision on behalf of the household. The head of household need not necessarily be the oldest male member or an earning member, but may be a female or a younger member of either sex. In case of an absentee de jure ‘Head’, the person on whom the responsibility of managing the affairs of household rests was regarded as the head irrespective whether the person was male or female.
Census of India 2001 : Page 13 of 13