Embed Size (px)
Citation preview

Control Loop Performance Assessment 14 October, 2012
1
Introduction and basics of performance
assessment of univariate loops
Prof. M.A.A. Shoukat Choudhury
Department of Chemical Engineering
BUET, Dhaka

Control Loop Performance Assessment 14 October, 2012
2Organization
Introduction and motivation
MV Benchmark basics
Time-domain analysis
Spectral analysis
Concluding remarks

Control Loop Performance Assessment 14 October, 2012
3Main message
Maintenance is an important part of the asset life cycle.
Maintenance costs can constitute anywhere from 3 to 50 percent of production costs. „Fail and Fix‟ is OUT.
„Predict and Prevent‟ is IN.
Paradigm shift underway in process operation: „Listen‟ to your data and use it to monitor the performance of your process.
Examine data in a multivariate framework

Control Loop Performance Assessment 14 October, 2012
4The Technology
Data fusion: Combine/fuse information
from all pertinent sensors (multivariate
data analysis) + information from the
peripheral production system
Predictive Maintenance
Smart
Sensors
Convert process
data into
information
Produce
‘Machine Health’
Information or index

Control Loop Performance Assessment 14 October, 2012
5Information-based Decision Support System
Data
Action
D
C
S
P
R
O
C
E
S
S
Data
Processing
Know ledge
Extraction
Conditioned
data
Know ledge
metricsDecision
Support
Direct action
through DCS or
through operator
Operating personnel ,
engineer, or m anagement
Information flow in a real-time information-based decision support system.

Control Loop Performance Assessment 14 October, 2012
6
Why monitor loop performance?

Control Loop Performance Assessment 14 October, 2012
7Eastman loop “demographics”
Flow
32%
Pressure
15%Level
18%
Temperature
20%
Other
15%
Percent of 14,000 loops by type
Percent of 8,500 loops by performance
Best
25%
Good
33%
Fair
32%
Poor
10%
Credits: Michael A. Paulonis and John W. Cox, Eastman Chemical Company, USA

Control Loop Performance Assessment 14 October, 2012
8Why monitor controller performance?
PID controllers are the „workhorses‟ of process industry
More than 90% of the controllers are PI(D)s
More than 30% of PIDs operate in manual
More than 30% of loops increase short-term variability
About 25% of loops use default settings
About 30% of loops have equipment problems
APCs are not useful when PIDs are badly tuned

Control Loop Performance Assessment 14 October, 2012
Performance Assessment
Q. Is your controller doing a satisfactory job?
A. Compare it with a benchmark
What benchmarks?
Best achievable control
• for the process
• amongst a class of controllers
User specified benchmarks etc.

Control Loop Performance Assessment 14 October, 2012
10
Remember that:
)variablescontrolled(
1Pr
VarianceofitandQuality
Quality and Variance

Control Loop Performance Assessment 14 October, 2012
11How well is your controller performing?
Good, bad or optimal ?
Look at variance of the controlled variable to measure performance.
But this by itself does not provide a measure of performance.
We need a yardstick or a metric to compare this number.
1
)(
)( 1
2
2
N
yy
yVar
N
iy

Control Loop Performance Assessment 14 October, 2012
12
Actual variance :
Lowest achievable variance is:
One measure of performance is:
2
y
2
mv
2
2
y
mv
NOTE: The Performance Index is not a measure of variability. It is a
measure of the potential that exists for improving current controller
performance.
Controller Performance Assessment

Control Loop Performance Assessment 14 October, 2012
13Why monitor controller performance?
time / min
0 2000 4000 6000 8000 100000
10
20
30
40
50
60
70
Le
ve
l
Change in the operating target due to
reduced variance
Constraint
OPPORTUNITY

Control Loop Performance Assessment 14 October, 2012
14
The case for reducing variability
time / min
0 2000 4000 6000 8000 100000
10
20
30
40
50
60
70
Le
ve
l
Constraint
μpresent
μnew
newnewpresentpresent 33Constraint
)(3 newpresetpresentnew
HOW MUCH ?
presentnewyopportunit
2
2
present
MVC

Control Loop Performance Assessment 14 October, 2012
15Performance monitoring & the role of FB control
Smaller Variability
Typical variability decrease with on-line monitoring: 30 %
Fre
qu
en
cy
Upper Spec Low Spec Target
Before Advanced
Control
After Advanced
Control

Control Loop Performance Assessment 14 October, 2012
16
Loop to be evaluated
Schematic Diagram of an Industrial Process
Look at a real industrial process

Control Loop Performance Assessment 14 October, 2012
17
0 2 4 6 8 10 12 14 16280
290
300
310
Te
mp
era
ture
hrs
How good a job are we doing in regulating this temperature ?
Can we do any better ?
Can this variance be reduced
by retuning this loop?
What is the lowest possible variance that we can achieve
for this loop?
Quality and Variance

Control Loop Performance Assessment 14 October, 2012
18Performance Assessment : SISO System
0 2 4 6 8 10 12 14 16280
290
300
310
Temperature
after tuningbefore tuning
hrs
02 4 6 8 10 12 14 16
0
0.2
0.4
0.6
hrs
Performance Index
Tighter temperature
regulation resulted in
22% increase in catalyst
life

Control Loop Performance Assessment 14 October, 2012
19
ProcessController
dr u y
Performance of univariate or multivariate controllers ???
Simplistically ask: How “healthy” is your controller?
Performance assessment
Main benefit: Develop a tool that would help towards
low maintenance and optimal process performance.

Control Loop Performance Assessment 14 October, 2012
20Summary so far
With easy data access:
Routine controller monitoring can
answer the following questions: How
well is your controller tuned: Good, bad
or optimal? Can performance be
improved?
Main issue: How to have a reliable APC
asset base with low maintenance?

Control Loop Performance Assessment 14 October, 2012
21Organization
Introduction and motivation
MV Benchmark basics
Time-domain analysis
Concluding remarks
Control Loop Performance Assessment 14 October, 2012
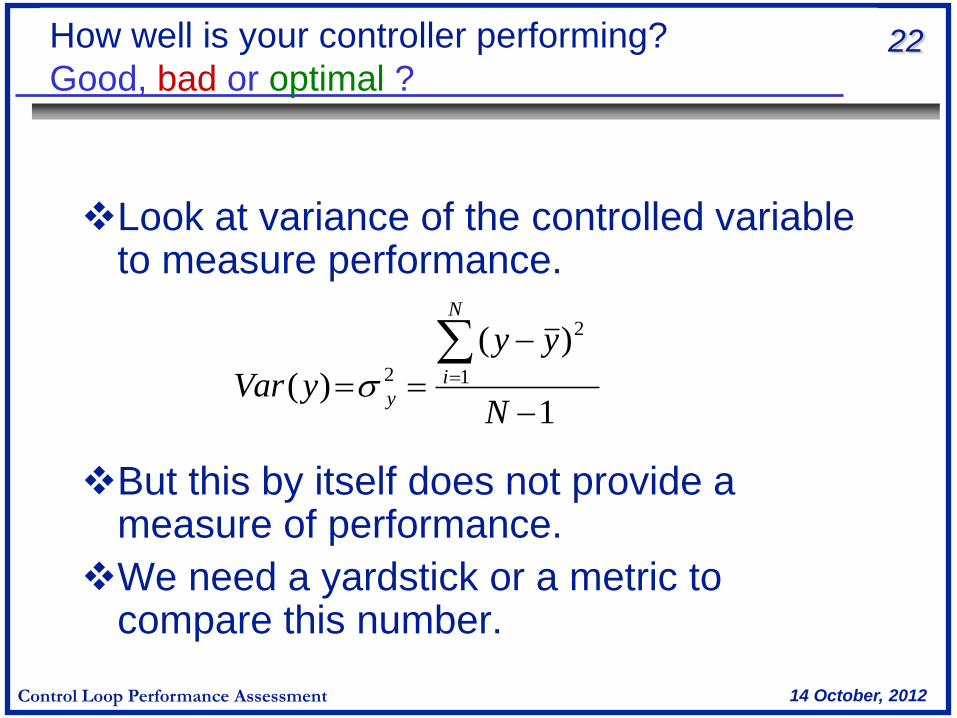
22How well is your controller performing?
Good, bad or optimal ?
Look at variance of the controlled variable to measure performance.
But this by itself does not provide a measure of performance.
We need a yardstick or a metric to compare this number.
1
)(
)( 1
2
2
N
yy
yVar
N
iy

Control Loop Performance Assessment 14 October, 2012
23
Actual variance :
Lowest achievable variance is:
One measure of performance is:
2
y
2
mv
2
2
y
mv
NOTE: The Performance Index is not a measure of variability. It is a
measure of the potential that exists for improving current controller
performance.
Controller Performance Assessment

Control Loop Performance Assessment 14 October, 2012
Closed - loop response: yN
q TQat d t
1~
write
where
and is a transfer function
N F q R
F F Fq F q
R
d
d
d
0 1
1
1
1 ( )
q Td ~Q
y t-
N
Preliminaries
at

Control Loop Performance Assessment 14 October, 2012
25
Cold WaterFaucet
Hot WaterHot
Water
Tank
Transportation Lag
Delays pose fundamental limitations to
achievable control performance

Control Loop Performance Assessment 14 October, 2012
yN
q TQa
F q R
q TQa
F q TQ q R FTQ
q TQa
F qR FTQ
q TQa
F a Fa F a L a
t d t
d
d t
d d
d t
d
d t
t t d t d
e
t d
t
1
1
1
1
1
0 1 1 1 1 0
~
~(
~) (
~)
~
(
~
~ )
1 24444 34444
L a
e Fa Q
w
t d
w
t t
t d
t d
1 1
1 2444 3444
where is independent of the control law
while is dependent on the control law
Preliminaries …contd

Control Loop Performance Assessment 14 October, 2012
y e wt t t d
Controller Invariant Term
Var y Var e Var w Var et t t d t( ) ( ) ( ) ( )
Since is independent of the controller,
this lower bound is achieved if and only if
. This yields the minimum
variance control law as
Var e
Var w
QR
TF
t
t d
( )
( )
~
0
Preliminaries …contd

Control Loop Performance Assessment 14 October, 2012
28Preliminaries …contd
y e wt t t d
y2
Control loop performance measure: 1)(2
2
y
mvd
Var y Var e Var w Var et t t d t( ) ( ) ( ) ( )
Controller Invariant Term
)()()( dttt wVareVaryVar
Total Variance Achievable Minimum Variance
mv2
Control Loop Performance Assessment 14 October, 2012
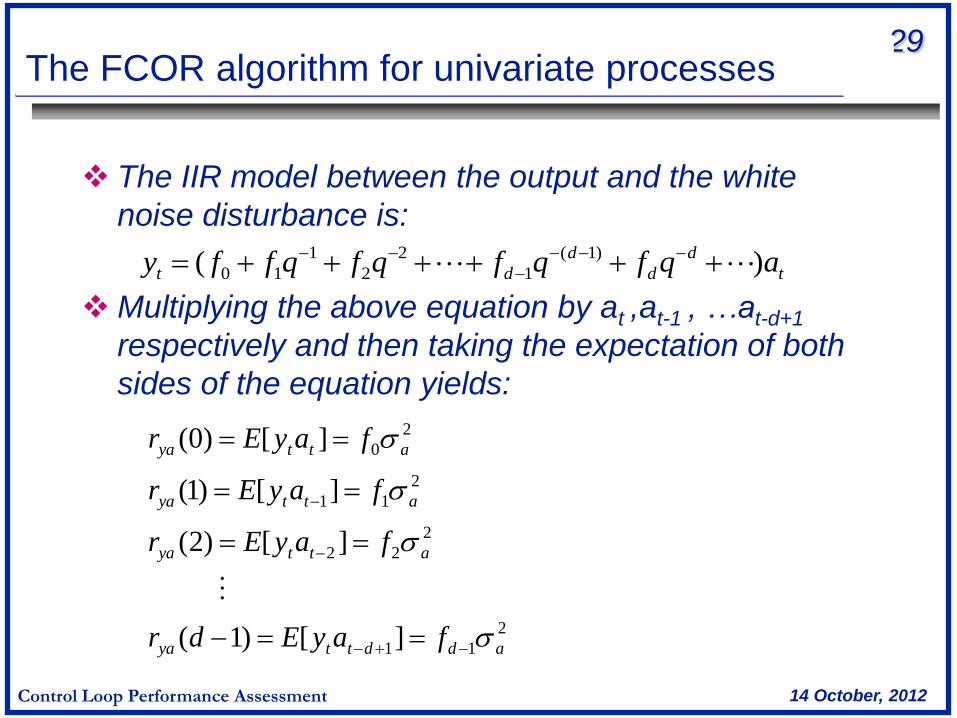
29The FCOR algorithm for univariate processes
The IIR model between the output and the white
noise disturbance is:
Multiplying the above equation by at ,at-1 , …at-d+1
respectively and then taking the expectation of both
sides of the equation yields:
t
d
d
d
dt aqfqfqfqffy )( )1(
1
2
2
1
10
2
11
2
22
2
11
2
0
][)1(
][)2(
][)1(
][)0(
addttya
attya
attya
attya
fayEdr
fayEr
fayEr
fayEr

Control Loop Performance Assessment 14 October, 2012
30The FCOR algorithm for univariate processes
The controller invariant or minimum variance portion
of the output is:
The minimum variance of the output is:
t
d
d
d
dt aqfqfqfqffy )( )1(
1
2
2
1
10
mvy
2222
2
2
2
2
2
2
2
22
1
2
2
2
1
2
0
2
/)1()1()0(
)1()1()0(
)(
ayayaya
a
a
ya
a
ya
a
ya
admv
drrr
drrr
ffff

Control Loop Performance Assessment 14 October, 2012
31The FCOR algorithm for univariate processes
If the controller performance index is defined as:
; Note that this index is a function of the delay order ’d’ &
The index can be expressed as:
Where Z is the cross-correlation coefficient vector
between and for lags 0 to (d-1), i.e.
2
2
)(y
mvd
1)(0 d
T
yayaya
ayyayaya
ZZ
d
drrrd
)1()1()0(
/)1()1()0()(
222
22222
)]1()1()0([ dZ yayaya

Control Loop Performance Assessment 14 October, 2012
y t
at
a t
controller process-
disturbance
corr y at t( )
corr y at t( )1
corr y at t d( ) 1
q 1
q 1
ya d( )1
ya ( )1
ya ( )0
time series analysis
Steps:
1) time series analysis
2) correlation
3) obtain
The FCOR Algorithm

Control Loop Performance Assessment 14 October, 2012
33The FCOR Algorithm:
Filter design: Univariate AR or ARMA
modeling to estimate the white noise
sequence.
Correlation analysis between the estimated
white noise sequence and the measured
output.
Inner product of the correlation coefficients
yields SISO performance index.

Control Loop Performance Assessment 14 October, 2012
34
0.00
0.05
0.10
0.15
0.20
0.25
0.30
PI(var) vs. Delay: MOIC25276P.PV
PI(var)
Delay 10 11 12 13 14 15 16 17 18 19 20Delay
PI(var) 0.126 0.142 0.159 0.176 0.194 0.213 0.232 0.252 0.272 0.291 0.310
Performance Index of the new controller using
The MV benchmark

Control Loop Performance Assessment 14 October, 2012
35Organization
Introduction and motivation
MV Benchmark basics
Time-domain analysis
Concluding remarks

Control Loop Performance Assessment 14 October, 2012
36Concluding Remarks
Detailed time-domain analysis gives insight into loop performance.
Engineering knowledge is important in drawing meaningful conclusions from the analysis.
“Bottom-up” approach is important.
Start with the lowest level loops to ensure that APC algorithms and optimizers can actually deliver optimum performance.