Embed Size (px)
Citation preview
RELATIONSHIP BETWEEN EVA & SHARE PRICE
M. P. Birla Institute of Management 1
RESEARCH PROJECT ON “RELATIONSHIP BETWEEN
ECONOMIC VALUE ADDED AND SHARE PRICE”
SUBMITTED IN PARTIAL FULFILLMENTOF THE
REQUIREMENTS FOR THE AWARD OF MBA DEGREE OF
BANGALORE UNIVERSITY.
Submitted By
SHOUKAT. P. Reg. No: 06XQCM6079
UNDER THE GUIDANCE OF
Prof. PRAVEEN BHAGAWAN. M. INTERNAL GUIDE
M.P.BIRLA INSTITUTE OF MANAGEMENT
ASSOCIATE BHARTIYA VIDYA BHAVAN
BANGALORE-560001 2006-2008

RELATIONSHIP BETWEEN EVA & SHARE PRICE
M. P. Birla Institute of Management 2
DECLARATION
I hereby declare that the research entitled “RELATIONSHIP
BETWEEN ECONOMIC VALUE ADDED AND SHARE PRICE”
has been carried out by me under the guidance and
supervision of Prof. PRAVEEN BHAGAWAN. M., Internal Guide,
M.P.Birla Institute of Management, Bangalore.
I also declare that this report has not been submitted to any
University/Institution for the award of any Degree/Diploma.
Date: (SHOUKAT. P.) Place: Bangalore Reg. No 06XQCM6079

RELATIONSHIP BETWEEN EVA & SHARE PRICE
M. P. Birla Institute of Management 3
GUIDE’S CERTIFICATE
This is to certify that Mr. SHOUKAT. P., a student of M.P.BIRLA INSTITUTE OF MANAGEMENT Associate Bharatiya Vidya Bhavan, Bangalore, has successfully completed the research work entitled “RELATIONSHIP BETWEEN ECONOMIC VALUE ADDED AND SHARE PRICE” for the partial fulfillment of the requirements of MASTER OF BUSINESS ADMINISTRATION degree of BANGALORE UNIVERSITY, under my guidance and supervision. Place: Bangalore Prof. Praveen Bhagawan. M. Date: (Internal guide)

RELATIONSHIP BETWEEN EVA & SHARE PRICE
M. P. Birla Institute of Management 4
PRINCIPAL’S CERTIFICATE
This is to certify that Mr.SHOUKAT. P. bearing the register number 06XQCM6079 has undertaken a research project and has prepared a report titled “RELATIONSHIP BETWEEN ECONOMIC VALUE ADDED AND SHARE PRICE” under the guidance and supervision of Prof. PRAVEEN BHAGAWAN.M. This has not formed a basis for the award of any degree/ diploma for any university.
Place: Bangalore (Dr. N.S. MALAVALLI) Date: Principal
RELATIONSHIP BETWEEN EVA & SHARE PRICE
M. P. Birla Institute of Management 5
ACKNOWLEDGEMENT
I am happy to express my deep sense of gratitude to my
internal guide Prof. PRAVEEN BHAGAWAN. M. for his
enormous guidance and assistance. He has been my mentor and
guide, his continuous encouragement and valuable
suggestions helped me at every stage of this project.
I would also like to express my thanks to Dr. N.S. MALAVALLI,
Principal, M. P. Birla Institute of Management, Bangalore.
Special thanks to my friends and family for their
encouragement and help in completion of the study
successfully.
SHOUKAT. P.

RELATIONSHIP BETWEEN EVA & SHARE PRICE
M. P. Birla Institute of Management 6
CONTENT SHEET
Chapter No Topics Page No
1 Research Extracts 1
2 Introduction 4
3 Literature Review 18
4 Research Methodology 25
5 Data Analysis and Interpretations 31
6 Summary and Recommendations 60
7 Bibliography 64

RELATIONSHIP BETWEEN EVA & SHARE PRICE
M. P. Birla Institute of Management 7
LIST OF TABLES
SI NO NAME OF THE TABLE PAGE NO
1 Sample profile 27
2 Beta of sample companies 32
3 Invested capital of selected companies 33
4 Nopat of selected companies 34
5 WACC of selected companies 35
6 Share prices of selected companies 36
7
Forecasted EVA and Share price of selected
companies
38
8 Degrees of correlation 36
9 EVA, Share price and regression statistics
of selected companies
40-59
RELATIONSHIP BETWEEN EVA & SHARE PRICE
M. P. Birla Institute of Management 8
CHAPTER 1
RESEARCH EXTRACTS

RELATIONSHIP BETWEEN EVA & SHARE PRICE
M. P. Birla Institute of Management 9
1. RESEARCH EXTRACTS:
Dissatisfaction with traditional accounting-based performance measures has
spawned a number of alternatives, of which Economic Value Added (EVA) is
currently the most prominent. Today, performance of the company with respect
to wealth creation is more important than the profit it earns or the dividend it
pays to the shareholders. Market prices of the shares reflect the performance of
the company
This research examines suitability of Economic Value Added (EVA) as a
performance measure. EVA is an effective measure of the quality of managerial
decisions as well as a reliable indicator of an enterprise’s value growth in
future.
The value-based management performance measure EVA, introduced by Stern
Stewart & Co. is an incarnation of the underlying residual income (RI) concept
EVA and its variability are observed to be strongly affected by the firm's growth
policies because of leverage effects. Methodologically, the paper demonstrates
the advantages of using a controlled simulation approach in financial research.
The EVA is computed and compared with the respective share prices of 20
companies of the SENSEX for a period of 5 years beginning from FY 2002-03
to FY 2006-07.

RELATIONSHIP BETWEEN EVA & SHARE PRICE
M. P. Birla Institute of Management 10
From the study it is observed that there is there is no relationship between EVA
and share prices but EVA is the true profit that the company is able to generate
which also considers opportunity cost of the capital invested in the business.
The study adds that EVA is the one of the measure, which is used to measure
the performance of the company but it cannot be used to forecast the share
price of the company.

RELATIONSHIP BETWEEN EVA & SHARE PRICE
M. P. Birla Institute of Management 11
CHAPTER 2
INTROCUCTION

RELATIONSHIP BETWEEN EVA & SHARE PRICE
M. P. Birla Institute of Management 12
2. INTRODUCTION:
2.1. Background of the study: Performance measurement has, of late, become an area of considerable
practitioner interest. Consulting firms routinely develop proprietary performance
measures for implementation by their client firms and have attempted to outdo
each other with claims of their own metric's "superiority." This "superiority" has
often been defined in terms of the correlation between the metric and realized
stock returns.
Stern Stewart & Co, a consulting firm based in New York, introduced the concept
of EVA as a measurement tool in 1989, and trademarked it. The EVA concept is
often called Economic Profit (EP) to avoid problems caused by the trade
marking. EVA is so popular and well known that all residual income concepts are
often called EVA even though they do not include the main elements defined by
Stern Stewart & Co (Pinto, 2001)
Stern Stewart developed EVA to help managers incorporate two basic principles
of finance into their decision making:
1. The primary objective of maximizing the wealth of its shareholders; and
2. Accepting that the value of a company depends on the extent to which
investors expect future profits to exceed or fall short of the cost of capital.
Today, this mechanism enable all types of firms to determine their value creation
and share holders to determine the value created on their investments. The first
question coming to our mind after reading this is:

RELATIONSHIP BETWEEN EVA & SHARE PRICE
M. P. Birla Institute of Management 13
2.2. WHAT IS EVA?
EVA is a value based financial performance measure, an investment decision
tool and a performance measure reflecting the absolute amount of shareholder
value created. It is computed as the product of the “excess return” made on an
investment or investments and the capital invested in that investment or
investments. EVA is the net operating profit minus an appropriate charge for the
opportunity cost of all capital invested in an enterprise or project. It is an estimate
of true economic profit, or the amount by which earnings exceed or fall short of
the required minimum rate of return investors could get by investing in other
securities of comparable risk (Stewart, 1990).
2.3 Profits the way shareholders count them:
By taking all capital costs into account, including the cost of equity, EVA shows
the monetary amount of wealth a business has created or destroyed in each
reporting period. In other words, EVA is the profit as defined by the share
holders.
The capital charge is the most distinctive and important aspect of EVA. Under
conventional accounting, most companies appear profitable but many in fact are
not. As Peter Drucker put the matter in a Harvard Business Review article, "Until
a business returns a profit that is greater than its cost of capital, it operates at a
loss. Never mind that it pays taxes as if it had a genuine profit. The enterprise still
returns less to the economy than it devours in resources…Until then it does not
create wealth; it destroys it." EVA corrects this error by explicitly recognizing that
when managers employ capital they must pay for it, just as if it were a wage.

RELATIONSHIP BETWEEN EVA & SHARE PRICE
M. P. Birla Institute of Management 14
If the shareholders expect, say, a 10% return on their investment, they "make
money" only to the extent that their share of after-tax operating profits exceeds
10% of equity capital. Everything before that is just building up to the minimum
acceptable compensation for investing in a risky enterprise.
2.4 HOW EVA CAN BE USED:
In stock selection the EVA tool can be used in four distinct ways.
• Analyzing historical trends:
EVA can measure a company’s historical success in creating shareholder
wealth.
• Using EVA to forecast a target stock price:
EVA can be used to determine whether a stock is fairly valued based on a
forecast of economic profits. Such a forecast converts discounted EVA into
a share price.
• To quantify Competitive Advantage Period (CAP):
Stock prices in many cases may reflect a long competitive advantage
period. Analysts can use the value driver model to look at their assumptions
regarding risk and CAP.
RELATIONSHIP BETWEEN EVA & SHARE PRICE
M. P. Birla Institute of Management 15
• To examine excess returns and its impact on valuation of a stock:
Another way of exploring the explanatory power of the value drivers in an EVA
model is to perform a regression analysis of invested capital(ROIC) minus the
weighted average cost of capital (WACC) spread as the independent variable
and enterprise value to invest capital as the dependant variable. The correlation
between return spreads and valuation is quite strong.
2.5 APPLICATIONS OF EVA:
1. To measure how much shareholder value the firm has created in the past and
2. To determine investor expectations as they relate to the stock price.
2.6 ADVANTAGES OF EVA:
EVA is frequently regarded as a single, simple measure that provides a real
picture of shareholder wealth creation. In addition to motivating managers to
create shareholder value and to serving as a basis for the calculation of
management compensation, there are further practical advantages that value
based measurement systems can offer. According to Roztoci & Needy an EVA
system helps managers to:
• Make better investment decisions;
• Identify improvement opportunities; and
• Consider long-term and short-term benefits for the company.
RELATIONSHIP BETWEEN EVA & SHARE PRICE
M. P. Birla Institute of Management 16
EVA is an effective measure of the quality of managerial decisions and a reliable
indicator of a company’s value growth in the future. Constant positive EVA values
over time will increase company values, while negative EVA values might
decrease company values.
Above all, EVA helps in overcoming the ambiguity of financial goals. Most
companies use a plethora of measures to express their financial goals and
objective.

RELATIONSHIP BETWEEN EVA & SHARE PRICE
M. P. Birla Institute of Management 17
2.7 Development of the concept of EVA:
EVA is not new. Residual income, an accounting performance measure, is
defined to be operating profit with a capital charge subtracted. Thus, EVA is
variant of residual income, with adjustments to how one calculates income and
capital.
Up to 1970 residual income did not get wide publicity and it was not the prime
performance measure for companies (Mäkeläinen, 1998). However, in the
1990’s, the creation of shareholder value has become recognized as the ultimate
economic purpose of a corporation.
Firms adopt this concept to track their financial position and to guide
management decisions regarding resource allocation, capital budgeting and
acquisition analysis.
Two views behind the concept of economic profit:
The financial concept underlying EVA was originally propagated by Adam
Smith, who proclaimed that the social mission of an individual enterprise is
to maximize the value of shareholders.
One of the earliest to mention the residual income concept was Alfred
Marshall in 1890. Marshall defined economic profit as total net gains less
the interest on invested capital at the current rate.
At operational level EVA approach leads often to increased shareholder value
through increased capital turnover (Wallace 1997, p.16). In many companies
everything has been done in cutting costs but the capital efficiency has been
ignored. EVA has been helpful because it forces to pay attention to capital
employed and especially to excess working capital. Allocating the capital costs to
their originators i.e. individual functions of organization can further reinforce this
impact.

RELATIONSHIP BETWEEN EVA & SHARE PRICE
M. P. Birla Institute of Management 18
2.8 What others say about EVA? (Articles published on web)
"There is no profit unless you earn the cost of capital. Alfred Marshall said that in
1896, Peter Drucker said that in 1954 and in 1973, and now EVA (economic
value added) has systematized this idea, thank God."
- Peter Drucker
University of California, Irvine
"Companies that adopt EVA incentives increased their market-to-book value ratio
by nearly 0.6 more than that of non-EVA peer companies. That means for every
$1 billion in book value an EVA firm creates nearly $600 million more in market
value than the non-EVA peer companies."
- Jim Wallace, A. Professor
"EVA based companies outperform their non-EVA peer companies by 9%, 12%,
& 10%, one, two and three years, respectively, following adoption of EVA. Prior
to adoption of EVA, the EVA-based companies demonstrated no significant
excess performance relative to non-EVA peers."
- Robert Kleiman, Professor
"Unlike earnings or ROE or any of those other measures, EVA gets at what we're
really after: the creation of value by earning returns above our required cost of
capital across time."
- Bob Boldt, Senior Investment Officer
Northwest Mutual Fund
"We don't look for companies with the highest EVA for our funds, but for
companies that can positively increase their EVA."
- Michael Butler, President & CEO

RELATIONSHIP BETWEEN EVA & SHARE PRICE
M. P. Birla Institute of Management 19
It has been shown that share price has a much higher positive correlation with
EVA than with any other measure of value.
- IPS Advisory, Inc.
WALL STREET RESEARCH ANALYSTS
"The EVA methodology explicitly addresses business and financial risk and
allows the investor to gauge the magnitude and sustainability of returns.
Moreover, this structure examines the three fundamental principles of value
creation: cash flow, risk, and sustainability of returns. Of all financial measures, it
best explains the creation of shareholder value."
- Al Jackson
"The EVA approach to equity analysis has become increasingly popular because
it more accurately reflects economic reality (as opposed to accounting reality)
when compared with many traditional valuation measures, such as earnings per
share (EPS), return on equity (ROE), and free cash flow."
- Steven G.Einhorn
"Economic Value Added (EVA) is a superior metric… EVA has a higher
correlation with wealth creation than do EPS, ROE, or cash flow."
- Steven Milunovic
COMPANIES
COCO-COLA
“Economic Profit is the way to keep score. Why everybody doesn’t use it is a
mystery to me.”
- Roberto Goizueta, Past CEO
RELATIONSHIP BETWEEN EVA & SHARE PRICE
M. P. Birla Institute of Management 20
Corporation Bank:
“Economic Value Added is the foundation of everything we do at SPX.”
- John Blystone, CEO
“To help us make all the short- and long-term decisions that affect our company
and help it to grow, we use a highly respected performance indicator,
measurement, and compensation system called Economic Value Added (EVA).”
- Michael Volkema, CEO
2.9 Problem Statement: There are various views with respect to whether traditional measures or value-
based measures influence change in share price.
The question to be addressed is whether there is relationship between EVA and
Wealth creation and whether this relationship is significant
2.10 Significance of the study:
The research provides a fundamental platform to investors to analyze the
companies in terms of its present position; earning capabilities and the growth
potential unleashed which leads to value addition and subsequently increase or
decrease of share prices.

RELATIONSHIP BETWEEN EVA & SHARE PRICE
M. P. Birla Institute of Management 21
There is a lot of academic and professional research undergoing these days with
the following question common to every research:
Which measure is better suitable in computing the value created on the
investments?
If the research conducted succeeds in the identification of the direct relationship
that exists between EVA and share, there will be a value addition to available
database.
2.11 The objective of the study is:
1) To describes the theory and characteristics of EVA.
2) To analyze the relationship between EVA and share prices.
3) To judge the relation between EVA and change in market capitalization
4) To establish that EVA is a better measure of performance
5) To give the framework to the investors to use EVA considering both its
favorable and unfavorable features in determination of the value created
on their investments
2.12 Scope of the study: The scope for the research investigation is restricted only to the following:-
• The research focuses only on twenty companies listed in BSE Sensex.
• The research is limited to the data available from 2002-03 to 2006-07.
2.13 Calculation of EVA,
Following steps are followed:
1) Calculating NOPAT (Net Operating Profit After Tax) using profit and loss
account.

RELATIONSHIP BETWEEN EVA & SHARE PRICE
M. P. Birla Institute of Management 22
2) Calculating invested capital using Balance Sheet.
3) Calculating the returns on the market using the indices, which represent
the Market.
4) Extracting the risk free rate from sources.
5) Calculating cost of debt.
6) Calculating the cost of equity using CAPM model.
7) Using the above information, calculating EVA.
EVA calculation: Every calculation is done under Microsoft Excel mostly with the help of inbuilt
functions.
EVA Calculation
EVA = NOPAT - WACC (Capital Invested)
There are three stages involved in this they are
1. Calculation of NOPAT: Net Operating Profit after Taxes
2. Calculation of WACC: Weighted Average Cost of Capital
3. Calculation of Invested Capital
The Stages of the Process: 1. Calculation of NOPAT:
Getting to NOPAT takes three basic steps:
1. Start with earning before interest and taxes (EBIT)
2. Make the key adjustments - these come in two flavors:
a. Eliminating accounting distortions (convert accrual to cash).
b. Reclassifying some expenses as investments (i.e. Capitalizing
them to Balance sheet)
RELATIONSHIP BETWEEN EVA & SHARE PRICE
M. P. Birla Institute of Management 23
3. Subtract cash operating taxes
The basic exemption of Stern Stewart is that second step can be adjusted
as per the convenience of the research person but the only condition is that the
same process has to be followed for all the years and all the companies under
research.
The formula adopted to calculate NOPAT is as follows
NOPAT = EBIT (1+ Tax rate)
2. Calculation of WACC:
It refers weighted average cost of capital (equity and debt). WACC used in the
calculations is at book value of equity and debt. It is calculated as follows:
WACC = Ke *W1+ Kd *W2
Where,
W1 is weight of EQUITY
W2 is weight of DEBT
Ke is cost of EQUITY
Kd is cost of DEBT
W1 = Total equity / Total Capital.
W2 = Total debt / Total capital
Ke = Risk-Free Rate + (Beta x Equity Premium)
Equity Premium = Rf + β (Rm - Rf)
Where
Rf is Risk-Free Rate of Return.

RELATIONSHIP BETWEEN EVA & SHARE PRICE
M. P. Birla Institute of Management 24
Rm is Average Return from Sensex which is considered as proxy to Market.
β is Beta.
Kd = Interest expenses (1- Tax rate) / Amount of Debt
3. Calculation of Invested Capital:
Getting to Capital invested takes three basic steps:
a. Get invested book capital from Balance sheet.
b. Make adjustments that convert accounting accruals to cash.
c. Make adjustments that recognize off-balance sheet sources of
funds. The basic exception of Stern Stewart is that there are many
processes for calculating but while calculating Invested Capital, the
most important condition is that the same process has to be
followed for all the years and all the companies under research.

RELATIONSHIP BETWEEN EVA & SHARE PRICE
M. P. Birla Institute of Management 25
CHAPTER 3
LITRATURE REVIEW
RELATIONSHIP BETWEEN EVA & SHARE PRICE
M. P. Birla Institute of Management 26
3. REVIEW OF LITRATURE:
Stern Stewart in 1990 has first studied this relationship with market data of
618 U.S. companies. Stewart presents the results in his book "The quest
for value". Stewart has studied the relationship between EVA and market
value of the company and he has produced a list of companies’ EVA
annually since 1982, its coverage is limited to the largest 1,000
companies.
Stern Stewart claims that:
• EVA is the only true indicator of business and management performance;
• EVA is "today's hottest financial idea and getting hotter";
• EVA "allows all financial decisions to be modeled, monitored, evaluated,
communicated, and compensated in terms of a single measure";
• "EVA is the only reliable and unambiguous continuous-improvement
metric"
• EVA must be used to guide every decision;
• EVA should be used as the "deciding factor in all business decisions.
• Grant in 1996 showed that
EVA significantly impacts the market value added of a firm and that this wealth
effect stems from the company’s positive residual return on capital. He calculates
regression statistics between the MVA-to-capital and EVA-to-capital ratios from
the data of 983 firms.
• Peterson in 1996 showed that

RELATIONSHIP BETWEEN EVA & SHARE PRICE
M. P. Birla Institute of Management 27
Value-added measures are slightly but not significantly more correlated with
stock returns than traditional performance measures.
• Lehn and Makhija in 1996 conducted a study on EVA and MVA as
performance measures and signals for strategic change. Their data
consists of 241 U.S. companies and cover years 1987, 1988, 1992 and
1993. The researchers find out that
“Both measures correlate positively with stock returns and that the correlation is
slightly better than with traditional performance measures like return on assets
(ROA), return on equity (ROE) and return on sales (ROS).
Additionally they study how companies’ performance, as measured in terms of
EVA and MVA, affect on the CEO firings. Finally they examine the relationship
between EVA/MVA and corporate focus. Lehn and Makhija find an inverse
relation between EVA/MVA and abnormal CEO turnover.
They also find that firms with greater focus on their business activities have
significantly higher MVA than their less focused counterparts.
Lehn and Makhija conclude that their results suggest EVA and MVA to be
effective performance measures that contain information about the quality of
strategic decisions and serve as signals of strategic change.”
• Myers study of 1997 states that

RELATIONSHIP BETWEEN EVA & SHARE PRICE
M. P. Birla Institute of Management 28
EVA is the most widely used Value-Based performance measure probably just
because it happens to be an easier concept compared to the others. In
implementing EVA, one of the most important things is to get the people in
organizations to commit to EVA and thereby also to understand EVA. Even as
easy concept as EVA seems to be quite hard to communicate down the
organization. That is why complicated measures do not work very well.
• A research conducted by Dodd & Chen in 1998 suggests that
“Some Value-Based measures have been found to correlate better with share
prices than EVA and find that Cash Flow Return on investment (CFROI) explains
share price movements better than EVA. Of course EVA can also be modified in
order to avoid some accounting distortions and to correlate better with share
prices, but then we have almost as complicated measure as CFROI. The best
possible correlation with share prices is not however the main point, especially
when the differences in correlations are quite small and also disputable.
All the shareholder value metrics are said to be identical to discounted free cash
flow -method, so it is no wonder that we can relate the results of these metrics "to
the fourth decimal points". With the complicated shareholder wealth -measures it
is not always the toughest part to communicate these to people, but to calculate
these in day-to-day operations. E.g. CFROI calls for taking into account the
effects of inflation to asset values and this in turn takes time and resources.
In other words: it takes money. Hence it can perhaps in many occasions be
stated that the other metrics do not pass a prudent cost-benefit analysis; the
additional costs with implementing them instead of EVA are often more than the
incremental information achieved with them.”

RELATIONSHIP BETWEEN EVA & SHARE PRICE
M. P. Birla Institute of Management 29
• A research conducted by Ashok Banerjee on “Economic Value Added and
Shareholder Wealth - An empirical study of relationship” on nine industries
in 1999 concludes that
“EVA has proved to be an important explanatory variable with the observation
and it is true that companies, which have started disclosing EVA results in their
Annual Reports, would see a more direct impact on stock price.”
• Another research conducted by Dr. Srinivasan, Professor, National
Institute of Industrial Engineering (NITIE) on “Economic Value Added
(EVA) - An Emerging Tool for Value Creation” in 2000 suggests that
The study points out that EVA alone cannot be an ‘Indicator of
Value.’ At the best it can be used an additional tool. However the
use of EVA analysis in isolation can lead to misleading results.
In India, there is no big correlation between EVA, management
innovation and stock market analysis. EVA serves a useful indicator
only at the conceptual stage rather than on the operational stage.
As regards stock market indicator it cannot be relied upon as a sole
measure.
As far as India is concerned the stock trends depend on a number
of variables of which EVA is one among them. It is clear that only a
blend of EVA and other variables can give a holistic future on stock
market.
RELATIONSHIP BETWEEN EVA & SHARE PRICE
M. P. Birla Institute of Management 30
• Another research conducted by Gerald T. Garvey and Todd T.
Milbourn states that
“They advance the literature by ascertaining the relative weights that firms should
use in a realistic setting where they do not know all of the relevant attributes of
alternative performance measures a priori.
More surprisingly, they show that the apparently simplistic idea of comparing the
relative ability of alternative measures to explain stock returns is both
theoretically defensible and a reasonable representation of practice. Therefore,
firms contemplating the adoption of EVA would be well advised to begin with an
examination of EVA's R2 with its stock returns.”
• One more research conducted by Madhav V. Rajan on “EVA versus
Earnings: Does It Matter Which Is More Highly Correlated with Stock
Returns?” In 2000 suggests that
“Implementing EVA in a form would have access to sufficient data about the
metrics to again obviate the need for R2 information. This paper concludes with
the message that a researcher who is unaware of the parameters governing the
metrics for a firm can make use of a complex nonlinear function of the metrics'
correlation with price to compute the value of adopting EVA. These are obviously
not the same things.”

RELATIONSHIP BETWEEN EVA & SHARE PRICE
M. P. Birla Institute of Management 31
• A research conducted by M Geyser & IE Liebenberg on “CREATING A
NEW VALUATION TOOL” on agricultural co-operatives in South Africa
in 2003 concludes that
“EVA as a value enhancement measure for agricultural co-operatives. EVA
measures the excess return on existing assets. It is important to remember when
using EVA as a value enhancement measure that it will not work unless there is
a commitment on the part of managers to make value maximization their primary
objective.
Finally, there are no magic bullets that create value. Value creation is hard work
in competitive markets and almost always involves a trade off between costs and
benefits. Everyone has a role in value creation and it certainly is not the sole
domain of financial analysts. In fact, the value created by financial engineers is
smaller and less significant than the value created by good strategic marketing,
production and personnel decisions.”
Learning form the review of literature:
From the study of above mentioned research papers, one can understand that
there is only confusion but not any clear idea regarding the usage or non-usage
of EVA in forecasting the share prices of the company.
Here is the research gap and the main objective behind this research

RELATIONSHIP BETWEEN EVA & SHARE PRICE
M. P. Birla Institute of Management 32
CHAPTER 4
Research Methodology

RELATIONSHIP BETWEEN EVA & SHARE PRICE
M. P. Birla Institute of Management 33
4. Research Methodology
4.1 Type of Research
The research type is historical analytical and quantitative.
Historical as the historical information is used for analysis and interpretation.
Analytical as facts and existing information is used for the analysis.
Quantitative as EVA is calculated and the variables are expressed in measurable
terms.
4.2 Sampling Technique
The Sampling method used here is Simple Random Sampling. The companies
listed in the stock exchange are considered since the market prices can be
obtained. The companies in the Sensex are chosen because it is an ideal index
and it is considered to be a good proxy for the whole market. Also it is a
barometer that indicates the state and health of the economy.
4.3 Sample Description Out of 30 companies included in the list of BSE Sensex, our Sample includes 20
companies for which relevant data is available, for a period of 5 years starting
from FY 2002-03 to FY 2006-07.
At irregular intervals, the Bombay Stock Exchange (BSE) authorities review and
modify its composition to make sure it reflects current market conditions.
Therefore only 20 companies are considered for the research as the data of all
the 30 companies for all the five years is unavailable.

RELATIONSHIP BETWEEN EVA & SHARE PRICE
M. P. Birla Institute of Management 34
4.4 Sample Profile The following are the sample 20 companies:
Sl.no Company Name Sector
1 Associated Cement Companies Ltd. Housing Related 2 Bharati Airtel. Telecom 3 Bharat Heavy Electricals Ltd. Capital Goods 4 Cipla Ltd. Healthcare 5 Grasim Industries Ltd. Diversified 6 Gujarat Ambuja Cements Ltd. Housing Related 7 HDFC Finance Finance 8 HDFC Bank Finance 9 Hindalco Metal, Metal Products &
Mining 10 Hindustan Lever Ltd. FMCG 11 Infosys Technologies Ltd Information Technology
12 ITC Ltd. FMCG 13 Larsen & Tourbro Ltd. Capital Goods &
Construction
14 Mahindra & Mahindra Transport Equipments 15 Maruti Transport Equipments 16 ONGC Oil & Gas 17 Ranbaxy Laboratories Ltd. Healthcare 18 Reliance Industries Oil & Gas 19 Reliance Energy Power 20 Wipro Ltd. Information Technology

RELATIONSHIP BETWEEN EVA & SHARE PRICE
M. P. Birla Institute of Management 35
4.5 Data gathering procedure and instrumentation
Data type: Secondary data
Required data:
• Balance Sheet
• Profit and loss Account
• History of stock prices
• History of market index
• Risk free rate of return
• Corporate tax rate
Data Source
• Balance sheet and Profit and loss Account are taken from the financial
statements of the selected companies from the database of Capital
Market.
• History of stock prices and history of market index are downloaded from
database of Capital Market and Bombay stock exchange.
• Risk free rate of return of relevant years is taken from the RBI bulletin
As 365 days Treasury bill rate is considered to be the proxy for risk free
rate of return.
• Corporate tax rate is taken from the Indian annual budget statements and
KPMG survey 2006.

RELATIONSHIP BETWEEN EVA & SHARE PRICE
M. P. Birla Institute of Management 36
4.6 Hypothesis
H0: There is no relationship between EVA and Share prices.
H1: There is a relationship between EVA and Share prices.
Tools used for testing of hypothesis:
The hypothesis is tested using linear regression tool, simple co-efficient of
Correlation, co-efficient of determination and t-statistic.
Co-efficient of correlation is used to describe how well one variable is explained
by the other variable. It reveals the magnitude and direction of relationship. The
magnitude is the degree to which variables move in the same or opposite
direction. The co-efficient signifies the direction of the relationship.
Co-efficient of determination measures the extent, or strength of the association
that exists between the two variables.
T-statistic is used for testing the significance of an dependent variable over the
independent variable.
There are two methods of testing the relationship with the help of t-statistics.
They are
1. To compare the values of t- calculated with that of t- tabulated.
In this case if the calculated t-value is greater than that of table value null
hypothesis has to be rejected and alternate hypothesis has to be accepted.

RELATIONSHIP BETWEEN EVA & SHARE PRICE
M. P. Birla Institute of Management 37
2. To compare the p- value with that of level of significance.
In this research report this method is adopted.
• If the p-value is greater than or equal to level of significance the null
hypothesis is accepted.
• If the p-value is less than the level of significance, the null
hypothesis is rejected.

RELATIONSHIP BETWEEN EVA & SHARE PRICE
M. P. Birla Institute of Management 38
CHAPTER 5
DATA ANALYSIS AND
INTERPRETATION
RELATIONSHIP BETWEEN EVA & SHARE PRICE
M. P. Birla Institute of Management 39
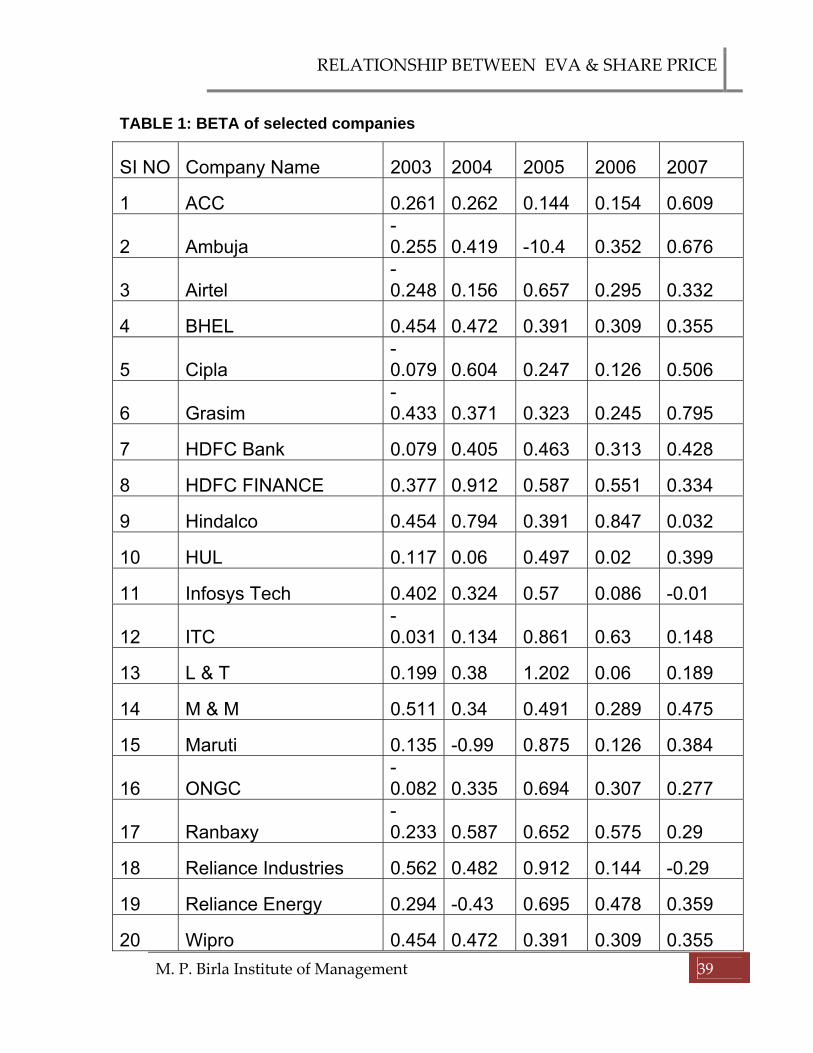
TABLE 1: BETA of selected companies
SI NO Company Name 2003 2004 2005 2006 2007
1 ACC 0.261 0.262 0.144 0.154 0.609
2 Ambuja -0.255 0.419 -10.4 0.352 0.676
3 Airtel -0.248 0.156 0.657 0.295 0.332
4 BHEL 0.454 0.472 0.391 0.309 0.355
5 Cipla -0.079 0.604 0.247 0.126 0.506
6 Grasim -0.433 0.371 0.323 0.245 0.795
7 HDFC Bank 0.079 0.405 0.463 0.313 0.428
8 HDFC FINANCE 0.377 0.912 0.587 0.551 0.334
9 Hindalco 0.454 0.794 0.391 0.847 0.032
10 HUL 0.117 0.06 0.497 0.02 0.399
11 Infosys Tech 0.402 0.324 0.57 0.086 -0.01
12 ITC -0.031 0.134 0.861 0.63 0.148
13 L & T 0.199 0.38 1.202 0.06 0.189
14 M & M 0.511 0.34 0.491 0.289 0.475
15 Maruti 0.135 -0.99 0.875 0.126 0.384
16 ONGC -0.082 0.335 0.694 0.307 0.277
17 Ranbaxy -0.233 0.587 0.652 0.575 0.29
18 Reliance Industries 0.562 0.482 0.912 0.144 -0.29
19 Reliance Energy 0.294 -0.43 0.695 0.478 0.359
20 Wipro 0.454 0.472 0.391 0.309 0.355

RELATIONSHIP BETWEEN EVA & SHARE PRICE
M. P. Birla Institute of Management 40
TABLE 2: INVESTED CAPITAL of selected companies:
SI NO Company Name 2003 2004 2005 2006 2007
1 ACC 2982.88 3317.69 3347.51 4100.38 4647.71
2 Ambuja 3367.863 3291.37 3305.84 4355.96 4991.29
3 Airtel 4825.67 5451.22 9527.89 12129.72 16724.01
4 BHEL 5337.89 5835.87 6563.87 5835.87 8877.59
5 Cipla 1164.86 1474.63 1744.83 2454.18 3359.83
6 Grasim 5053.38 5676.38 6336.69 6961.75 9181.6
7 HDFC Bank 91319.29 73586.87 51505.98 42379.98 30482.45
8 HDFC FINANCE 26296.14 32077.83 40530.5 51189.68 62744.42
9 Hindalco 8586.11 9422.5 11466.58 14509.7 19786.64
10 HUL 3843.03 3563.83 2362.56 2796.09 1427.77
11 Infosys Tech 2,860.65 3,253.43 5,242.00 6,897.00 11,162.00
12 ITC 5482.6 6530.91 8140.97 9181.21 10637.96
13 L & T 6738.54 4099.39 5228.19 6093.74 7846.18
14 M & M 2709.68 2504.84 3039.15 3792.25 5188.91
15 Maruti 3554 3903.1 4686.4 5524.3 7484.7
16 ONGC 36539.19 51950.89 56761.64 66682.28 77033
17 Ranbaxy 36539.19 51950.89 56761.64 66682.28 77033
18 Reliance Industries 50132.72 55397.11 59187.91 71699.87 91792.86
19 Reliance Energy 3209.88 7159.54 9532.66 12075.51 15222.2
20 Wipro 3,399.96 3,608.28 4,954.53 6,470.61 9,554.90

RELATIONSHIP BETWEEN EVA & SHARE PRICE
M. P. Birla Institute of Management 41
TABLE 3: NOPAT of selected companies:
SI NO Company Name 2003 2004 2005 2006 2007
1 ACC 244.0322 360.3113 500.2317 1129.85 1336.173
2 Ambuja 253.466 331.8299 406.8937 1303.285 1858.893
3 Airtel 2100.105 1440.739 125424.9 170181.8 325578.9
4 BHEL 571.4686 716.5625 1108.709 1748.781 2519.679
5 Cipla 211.3306 271.9536 350.8642 483.9642 546.1206
6 Grasim 448.6824 820.801 961.6947 872.9836 1558.878
7 HDFC Bank 1175.265 1286.738 1529.743 2122.113 3212.294
8 HDFC FINANCE 188064.7 193432.3 214596.1 270334.8 376085.5
9 Hindalco 691.1346 948.5941 1382.836 1553.991 2498.138
10 HUL 1489.901 1076.707 1095.341 1465.567 1568.945
11 Infosys Tech 773.1587 980.8624 1486.741 1824.758 2768.805
12 ITC 1397.697 1568.905 2052.236 2163.622 2628.625
13 L & T 511.8523 596.0165 937.9069 1036.732 1427.851
14 M & M 208.9079 343.4305 486.2981 751.0109 958.9079
15 Maruti 223.2112 542.1604 893.978 1180.326 1545.011
16 ONGC 1082423 910278.8 1313489 1458806 1580592
17 Ranbaxy 282.6992 448.8008 514.7158 452.6917 400.2217
18 Reliance Industries 4353.131 5157.498 7025.245 7721.119 10473.43
19 Reliance Energy 152.6476 324.8496 469.4301 648.9124 748.3974
20 Wipro 622.751 723.683 1174.56 1561.95 2122.37
RELATIONSHIP BETWEEN EVA & SHARE PRICE
M. P. Birla Institute of Management 42
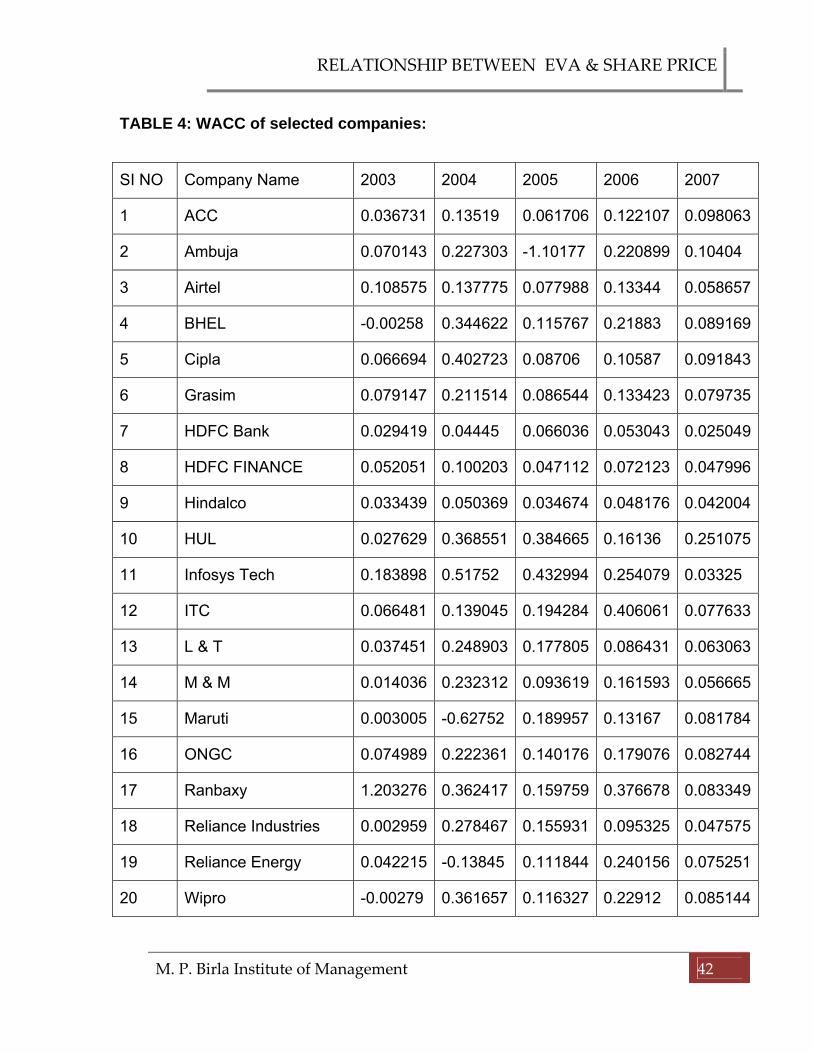
TABLE 4: WACC of selected companies:
SI NO Company Name 2003 2004 2005 2006 2007
1 ACC 0.036731 0.13519 0.061706 0.122107 0.098063
2 Ambuja 0.070143 0.227303 -1.10177 0.220899 0.10404
3 Airtel 0.108575 0.137775 0.077988 0.13344 0.058657
4 BHEL -0.00258 0.344622 0.115767 0.21883 0.089169
5 Cipla 0.066694 0.402723 0.08706 0.10587 0.091843
6 Grasim 0.079147 0.211514 0.086544 0.133423 0.079735
7 HDFC Bank 0.029419 0.04445 0.066036 0.053043 0.025049
8 HDFC FINANCE 0.052051 0.100203 0.047112 0.072123 0.047996
9 Hindalco 0.033439 0.050369 0.034674 0.048176 0.042004
10 HUL 0.027629 0.368551 0.384665 0.16136 0.251075
11 Infosys Tech 0.183898 0.51752 0.432994 0.254079 0.03325
12 ITC 0.066481 0.139045 0.194284 0.406061 0.077633
13 L & T 0.037451 0.248903 0.177805 0.086431 0.063063
14 M & M 0.014036 0.232312 0.093619 0.161593 0.056665
15 Maruti 0.003005 -0.62752 0.189957 0.13167 0.081784
16 ONGC 0.074989 0.222361 0.140176 0.179076 0.082744
17 Ranbaxy 1.203276 0.362417 0.159759 0.376678 0.083349
18 Reliance Industries 0.002959 0.278467 0.155931 0.095325 0.047575
19 Reliance Energy 0.042215 -0.13845 0.111844 0.240156 0.075251
20 Wipro -0.00279 0.361657 0.116327 0.22912 0.085144

RELATIONSHIP BETWEEN EVA & SHARE PRICE
M. P. Birla Institute of Management 43
TABLE 5: SHARE PRICES of selected companies:
SI NO Company Name 2003 2004 2005 2006 2007
1 ACC 148.6025 204.3667 289.4408 487.4683 927.9225
2 Ambuja 23.36667 32.2275 43.05583 72.89083 117.9617
3 Airtel 29.895 78.55667 171.5175 507.8867 520.17
4 BHEL 87.97917 198.0733 315.5742 626.155 1118.903
5 Cipla 73.1 79.8225 104.6858 153.6733 246.0817
6 Grasim 314.2883 727.4717 1158.968 1332.09 2359.734
7 HDFC Bank 217.5967 301.9808 438.1608 659.4875 914.3142
8 HDFC FINANCE 329.5208 501.585 662.8167 1018.214 1408.893
9 Hindalco 241.615 94.3425 305.6117 291.6358 172.8783
10 HUL 136.05 153.35 134.7933 176.8075 231.5117
11 Infosys Tech 482.9508 531.025 863.8875 1258.33 1880.815
12 ITC 43.1391 57.3225 75.275 128.1108 178.2592
13 L & T 92.2483 181.6175 402.6267 764.5017 1326.798
14 M & M 49.9025 136.3542 237.8483 397.59 719.2775
15 Maruti 266.47 328.9178 427.8058 575.4542 870.47
16 ONGC 236.0683 399.19 516.6467 684.5133 819.08
17 Ranbaxy 236.0683 399.19 516.6467 684.5133 819.08
18 Reliance Industries 222.1617 348.5825 421.955 605.1217 1154.897
19 Reliance Energy 218.7675 411.07 598.27 581.3517 504.8458
20 Wipro 241.615 207.303 305.612 409.492 543.657

RELATIONSHIP BETWEEN EVA & SHARE PRICE
M. P. Birla Institute of Management 44
Interpretation: TABLE 1: BETA It can be seen that beta for most of the companies has increased from year to
year from Table-1. Earlier, in 2003 it was on an average of 0.15 when all the
companies are taken together. But slowly it has increased to about 0.40 by the
end of 2007. Thus we can say that riskiness of the stock is increased during the
period of 2003 to 2007.
TABLE 2: INVESTED CAPITAL Total capital employed of almost companies is increased consistently from
2003-2007. While, HUL has reduced its capital fund from 3843.03 crore to
1427.77 crore in 2007. L&T and Ambuja have also reduced its capital fund during
2004 but it has again increased the capital fund in 2005 and 2006.
TABLE 3: NOPAT NOPAT is increased consistently increased and improved from year to year of
almost companies. There are some variations in case of Airtel, HUL, ONGC and
Ranbaxy.
TABLE 4: WACC From the table it is concluded that weighted average cost of capital (WACC) of
the all companies during 2003 and 2004 is very low. WACC is around 0.02
during these years. But in 2004 WACC is increased drastically because of
increasing beta. In case of Infosys there is only equity fund employed and they
are known as debt free company.
TABLE 5: SHARE PRICES From the table it is clear that the share prices went on increasing from year to
year because of increase in beta. It is because as the market is becoming more
and more risky investors expected return is going on a hike.

RELATIONSHIP BETWEEN EVA & SHARE PRICE
M. P. Birla Institute of Management 45
Forecasted Eva & Share price for the year 2008. Sl No Company EVA SHARE PRICE
1 ACC 1032.674 908.8834
2 Ambuja 2086.779 60.73627
3 Airtel 368196.9 645.0349
4 BHEL 1583.445 799.9634
5 Cipla 320.6328 167.6571
6 Grasim 734.6403 1894
7 HDFC Bank 2324.705 918.177
8 HDFC FINANCE -2153.76 838.026
9 Hindalco 1749.137 230.4962
10 HUL 983.0629 172.6005
11 Infosys Tech 1769.17 1563.617
12 ITC 274.7111 96.18761
13 L & T 941.7613 1119.56
14 M & M 596.8598 574.6667
15 Maruti 589.3737 496.8845
16 ONGC ‐6713.34
530.9883
17 Ranbaxy Laboratories Ltd. 451.9943
756.4965
18 Reliance Industries 4232.465
678.2184
19 Reliance Energy -1701.04
550.3152
20 Wipro Ltd. 1011.646 421.6915
RELATIONSHIP BETWEEN EVA & SHARE PRICE
M. P. Birla Institute of Management 46
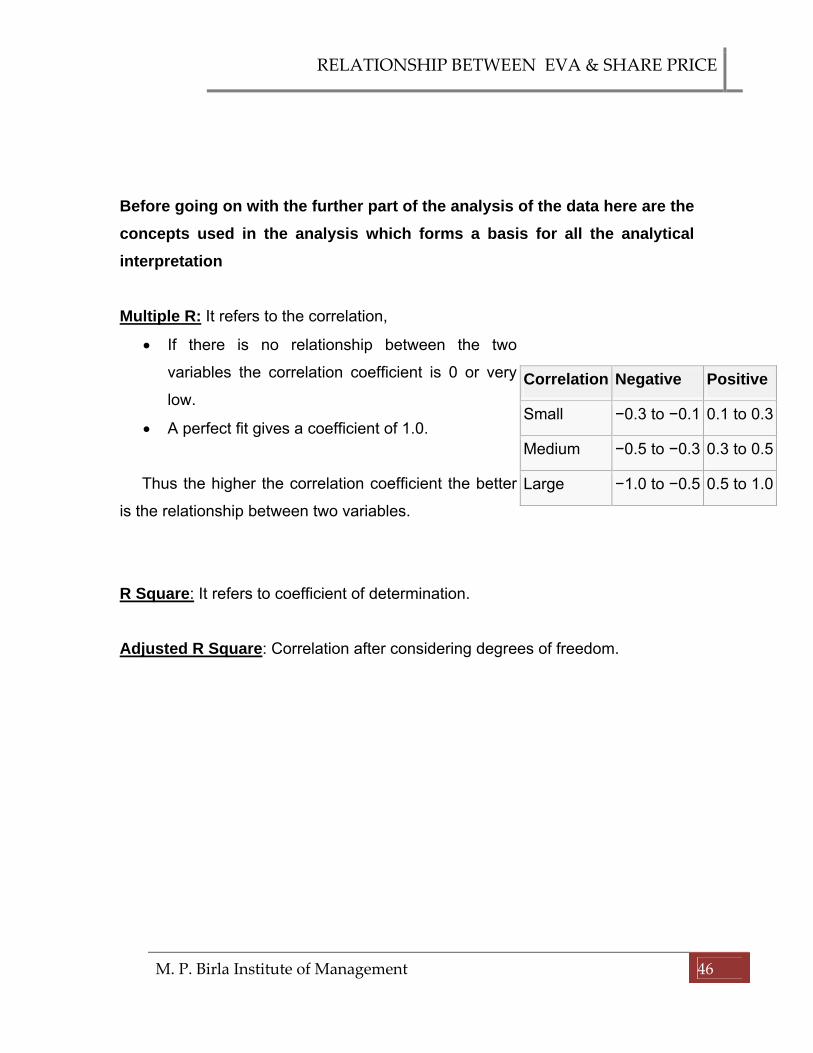
Before going on with the further part of the analysis of the data here are the concepts used in the analysis which forms a basis for all the analytical interpretation Multiple R: It refers to the correlation,
• If there is no relationship between the two
variables the correlation coefficient is 0 or very
low.
• A perfect fit gives a coefficient of 1.0.
Thus the higher the correlation coefficient the better
is the relationship between two variables.
R Square: It refers to coefficient of determination.
Adjusted R Square: Correlation after considering degrees of freedom.
Correlation Negative Positive
Small −0.3 to −0.1 0.1 to 0.3
Medium −0.5 to −0.3 0.3 to 0.5
Large −1.0 to −0.5 0.5 to 1.0

RELATIONSHIP BETWEEN EVA & SHARE PRICE
M. P. Birla Institute of Management 47
ACC:
→Large positive correlation. If EVA moves by one, share
price will move by 0.9189 in the same direction.
→84.44% of change in share price is due to change in EVA.
The t-statistics of this is 4.034568. The p- value in this case is 0.027384, which is less than 5% level of significance.
Therefore Alternate hypothesis is accepted.
As such there is a relationship between EVA and share.
Year EVA(X) Share price(Y)
2003 134.466784 148.6025
2004 -88.205619 204.3667
2005 293.671408 289.4408
2006 629.166754 487.4683
2007 880.402994 927.9225
Regression
Statistics
Multiple R 0.918902
R Square 0.84438
Adjusted R Square 0.792507

RELATIONSHIP BETWEEN EVA & SHARE PRICE
M. P. Birla Institute of Management 48
Airtel:
→Large positive correlation. If EVA moves by one, share
price will move by 0.9189 in the same direction.
→84.44% of change in share price is due to change in EVA.
The t-statistics of this is 3.479578. The p- value in this case is 0.040067, which is less than 5% level of significance.
Therefore Alternate hypothesis is accepted.
As such there is relationship between EVA and share price.
Year EVA(X) Share price(Y)
2003 1576.15597 29.895
2004 689.694416 78.55667
2005 124681.872 171.5175
2006 168563.252 507.8867
2007 324597.963 520.17
Regression
Statistics
Multiple R 0.895222
R Square 0.801423
Adjusted R Square 0.73523

RELATIONSHIP BETWEEN EVA & SHARE PRICE
M. P. Birla Institute of Management 49
BHEL:
→Large positive correlation. If EVA moves by one, share
price will move by 0.708 in the same direction.
→50%of change in share price is due to change in EVA.
The t-statistics of this is 1.737359. The p- value in this case is 0.180718, which is more than 5% level of significance.
Therefore Null hypothesis is accepted.
As such there is no relationship between EVA and share price.
Year EVA(X) Share price(Y)
2003 585.241841 87.97917
2004 -1294.6058 198.0733
2005 348.829449 315.5742
2006 471.716669 626.155
2007 1728.07144 1118.903
Regression
Statistics
Multiple R 0.708188
R Square 0.50153
Adjusted R Square 0.335373

RELATIONSHIP BETWEEN EVA & SHARE PRICE
M. P. Birla Institute of Management 50
CIPLA:
→Large positive correlation. If EVA moves by one, share
price will move by 0.529 in the same direction.
→27.97% of change in share price is due to change in EVA.
The t-statistics of this is 1.079284 The p- value in this case is 0.3595, which is more than 5% level of significance.
Therefore Null hypothesis is accepted.
As such there is no relationship between EVA and share price.
Year EVA(X) Share price(Y)
2003 133.641809 73.1
2004 -321.91415 79.8225
2005 198.95983 104.6858
2006 224.140919 153.6733
2007 237.544622 246.0817
Regression
Statistics
Multiple R 0.528854
R Square 0.279687
Adjusted R Square 0.039582
RELATIONSHIP BETWEEN EVA & SHARE PRICE
M. P. Birla Institute of Management 51
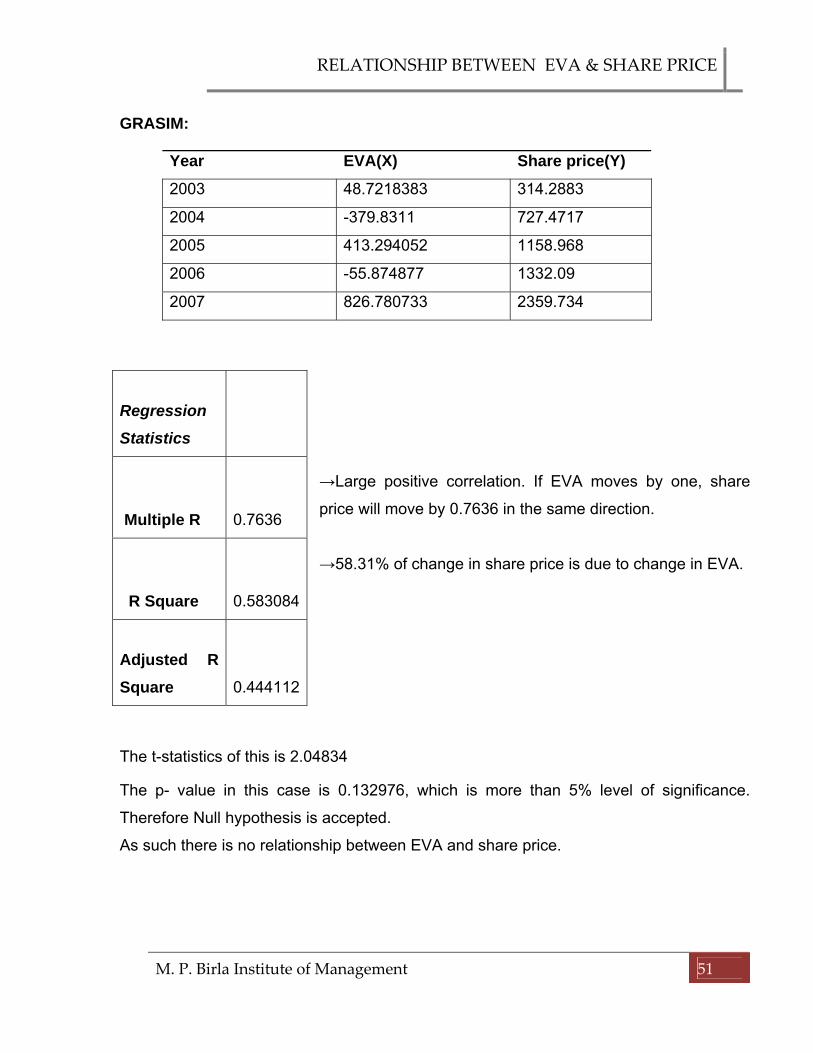
GRASIM:
→Large positive correlation. If EVA moves by one, share
price will move by 0.7636 in the same direction.
→58.31% of change in share price is due to change in EVA.
The t-statistics of this is 2.04834 The p- value in this case is 0.132976, which is more than 5% level of significance.
Therefore Null hypothesis is accepted.
As such there is no relationship between EVA and share price.
Year EVA(X) Share price(Y)
2003 48.7218383 314.2883
2004 -379.8311 727.4717
2005 413.294052 1158.968
2006 -55.874877 1332.09
2007 826.780733 2359.734
Regression
Statistics
Multiple R 0.7636
R Square 0.583084
Adjusted R Square 0.444112

RELATIONSHIP BETWEEN EVA & SHARE PRICE
M. P. Birla Institute of Management 52
Gujarat Ambuja
→Small positive correlation. If EVA moves by one, share
price will move by 0.129 in the same direction.
→1.67% of change in share price is due to change in EVA.
The t-statistics of this is 0.225943.
The p- value in this case is 0.835764, which is more than 5% level of significance.
Therefore Null hypothesis is accepted.
As such there is no relationship between EVA and share price.
Year EVA(X) Share price(Y)
2003 17.233118 23.36667
2004 -416.30818 32.2275
2005 4049.15398 43.05583
2006 341.058943 72.89083
2007 1339.60156 117.9617
Regression
Statistics
Multiple R 0.129352
R Square 0.016732
Adjusted R Square -0.31102

RELATIONSHIP BETWEEN EVA & SHARE PRICE
M. P. Birla Institute of Management 53
HDFC Bank:
→Large positive correlation. If EVA moves by one, share
price will move by 0.9252 in the same direction.
→85.56% of change in share price is due to change in EVA.
The t-statistics of this is 4.223525.
The p- value in this case is 0.02427, which is less than 5% level of significance.
Therefore Alternate hypothesis is accepted.
As such there is a relationship between EVA and share price.
Year EVA(X) Share price(Y)
2003 -1511.2649 217.5967
2004 -1984.2215 301.9808
2005 -1871.5028 438.1608
2006 -125.84661 659.4875
2007 2448.75096 914.3142
Regression
Statistics
Multiple R 0.925221
R Square 0.856033
Adjusted R Square 0.808045

RELATIONSHIP BETWEEN EVA & SHARE PRICE
M. P. Birla Institute of Management 54
HDFC Finance:
→Small positive correlation. If EVA moves by one, share
price will move by 0.24 in the same direction.
→5.76% of change in share price is due to change in EVA.
The t-statistics of this is -0.42825.
The p- value in this case is 0.697356, which is more than 5% level of significance.
Therefore Null hypothesis is accepted.
As such there is no relationship between EVA and share price.
Year EVA(X) Share price(Y)
2003 186695.968 329.5208
2004 16127.9931 501.585
2005 212686.62 662.8167
2006 266642.834 1018.214
2007 373074.025 1408.893
Regression
Statistics
Multiple R 0.240021
R Square 0.05761
Adjusted R Square -0.25652
RELATIONSHIP BETWEEN EVA & SHARE PRICE
M. P. Birla Institute of Management 55
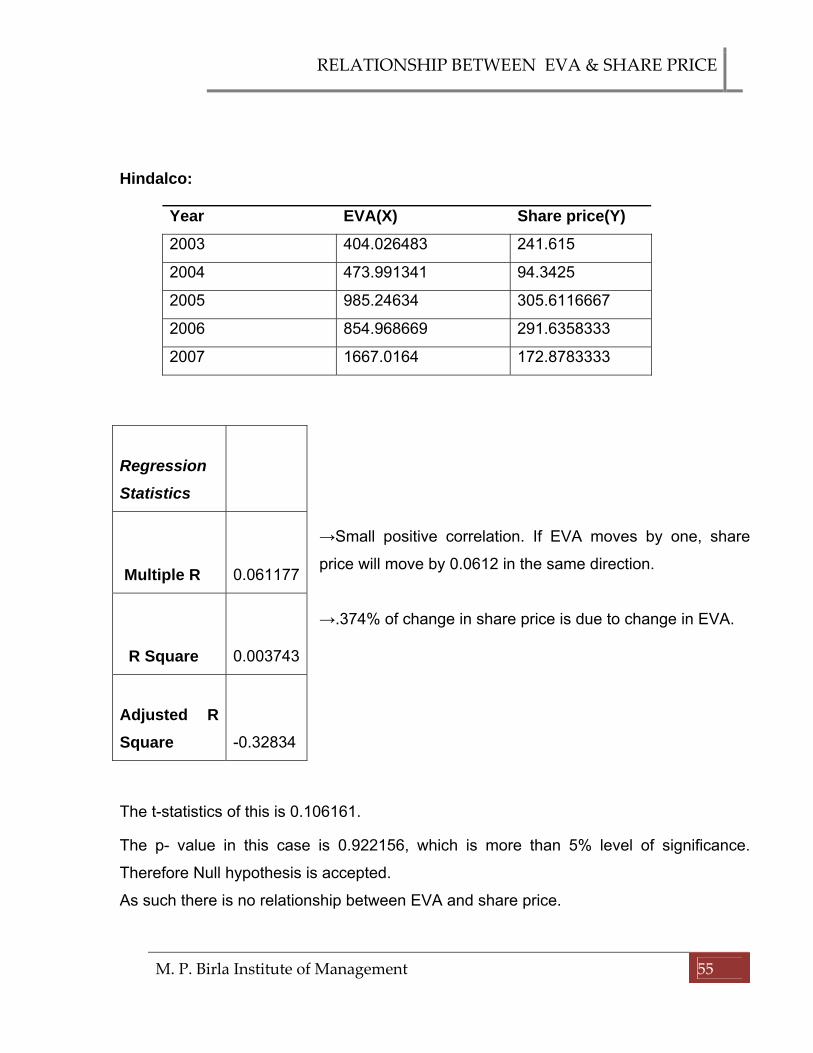
Hindalco:
→Small positive correlation. If EVA moves by one, share
price will move by 0.0612 in the same direction.
→.374% of change in share price is due to change in EVA.
The t-statistics of this is 0.106161. The p- value in this case is 0.922156, which is more than 5% level of significance.
Therefore Null hypothesis is accepted.
As such there is no relationship between EVA and share price.
Year EVA(X) Share price(Y)
2003 404.026483 241.615
2004 473.991341 94.3425
2005 985.24634 305.6116667
2006 854.968669 291.6358333
2007 1667.0164 172.8783333
Regression
Statistics
Multiple R 0.061177
R Square 0.003743
Adjusted R Square -0.32834

RELATIONSHIP BETWEEN EVA & SHARE PRICE
M. P. Birla Institute of Management 56
HUL:
→Medium positive correlation. If EVA moves by one, share
price will move by 0.392784 in the same direction.
→15.43% of change in share price is due to change in EVA.
The t-statistics of this is 0.739777
The p- value in this case is 0.513066, which is more than 5% level of significance.
Therefore Null hypothesis is accepted.
As such there is no relationship between EVA and share price.
Year EVA(X) Share price(Y)
2003 1383.72394 136.05
2004 -236.74715 153.35
2005 186.546737 134.7933
2006 1014.38882 176.8075
2007 1210.46748 231.5117
Regression
Statistics
Multiple R 0.392784
R Square 0.154279
Adjusted R Square -0.12763

RELATIONSHIP BETWEEN EVA & SHARE PRICE
M. P. Birla Institute of Management 57
Infosys:
→Large positive correlation. If EVA moves by one, share
price will move by 0.9189 in the same direction.
→84.44% of change in share price is due to change in EVA.
The t-statistics of this is 2.43647. The p- value in this case is 0.092792, which is more than 5% level of significance.
Therefore Null hypothesis is accepted.
As such there is no relationship between EVA and share price.
Year EVA(X) Share price(Y)
2003 247.089698 482.9508
2004 -702.85272 531.025
2005 -783.01145 863.8875
2006 72.375037 1258.33
2007 2397.6686 1880.815
Regression
Statistics
Multiple R 0.815042
R Square 0.664294
Adjusted R Square 0.552392

RELATIONSHIP BETWEEN EVA & SHARE PRICE
M. P. Birla Institute of Management 58
ITC:
→Small positive correlation. If EVA moves by one, share
price will move by 0.0254 in the same direction.
→.0646% of change in share price is due to change in EVA.
The t-statistics of this is 0.04402
The p- value in this case is 0.967654, which is more than 5% level of significance.
Therefore Null hypothesis is accepted.
As such there is no relationship between EVA and share price.
Year EVA(X) Share price(Y)
2003 1033.20737 43.1391
2004 660.817448 57.3225
2005 470.572946 75.275
2006 -1564.5084 128.1108
2007 1802.76922 178.2592
Regression
Statistics
Multiple R 0.025407
R Square 0.000646
Adjusted R Square -0.33247

RELATIONSHIP BETWEEN EVA & SHARE PRICE
M. P. Birla Institute of Management 59
L & T:
→Large positive correlation. If EVA moves by one, share
price will move by 0.8394 in the same direction.
→70.46% of change in share price is due to change in EVA.
The t-statistics of this is 2.674852
The p- value in this case is 0.075378, which is more than 5% level of significance.
Therefore Null hypothesis is accepted.
As such there is no relationship between EVA and share price.
Year EVA(X) Share price(Y)
2003 259.48926 92.2483
2004 -424.3343 181.6175
2005 8.30691828 402.6267
2006 510.042795 764.5017
2007 933.05102 1326.798
Regression
Statistics
Multiple R 0.839389
R Square 0.704574
Adjusted R Square 0.606099

RELATIONSHIP BETWEEN EVA & SHARE PRICE
M. P. Birla Institute of Management 60
M & M:
→Large positive correlation. If EVA moves by one, share
price will move by 0.7924 in the same direction.
→62.78% of change in share price is due to change in EVA.
The t-statistics of this is 2.2496
The p- value in this case is 0.109975, which is more than 5% level of significance.
Therefore Null hypothesis is accepted.
As such there is no relationship between EVA and share price.
Year EVA(X) Share price(Y)
2003 170.875309 49.9025
2004 -238.47406 136.3542
2005 201.775889 237.8483
2006 138.209798 397.59
2007 664.878032 719.2775
Regression
Statistics
Multiple R 0.792358
R Square 0.627831
Adjusted R Square 0.503774
RELATIONSHIP BETWEEN EVA & SHARE PRICE
M. P. Birla Institute of Management 61
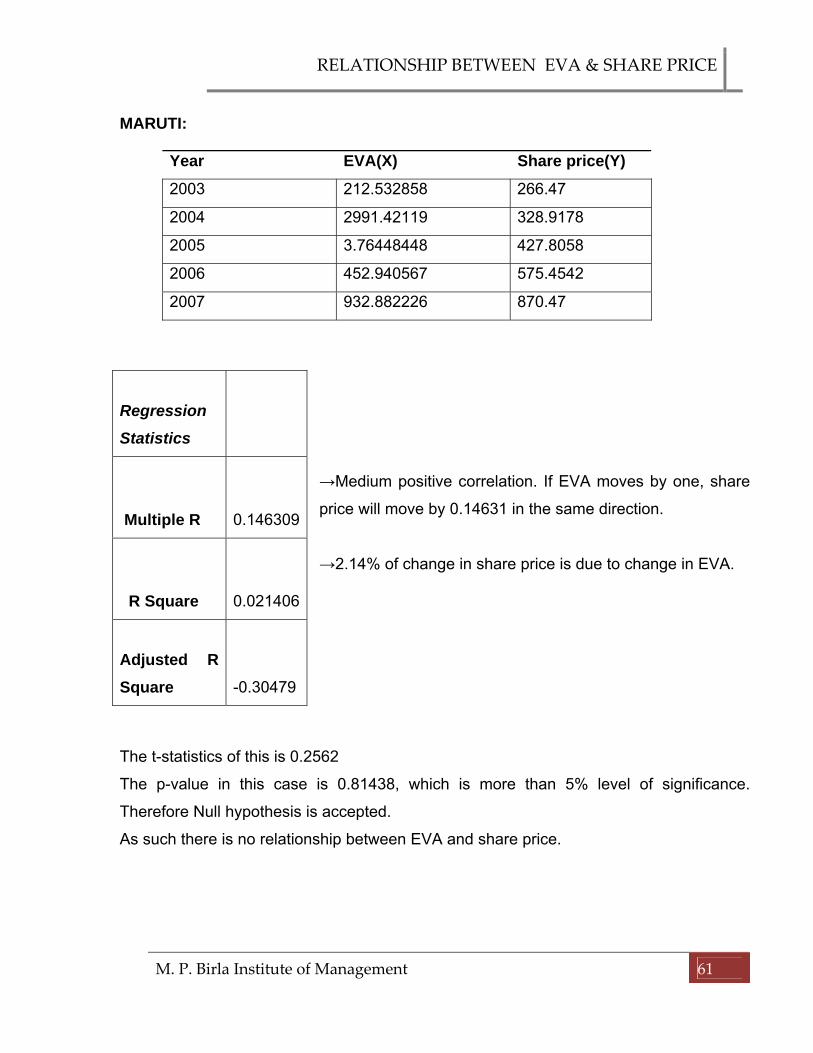
MARUTI:
→Medium positive correlation. If EVA moves by one, share
price will move by 0.14631 in the same direction.
→2.14% of change in share price is due to change in EVA.
The t-statistics of this is 0.2562
The p-value in this case is 0.81438, which is more than 5% level of significance.
Therefore Null hypothesis is accepted.
As such there is no relationship between EVA and share price.
Year EVA(X) Share price(Y)
2003 212.532858 266.47
2004 2991.42119 328.9178
2005 3.76448448 427.8058
2006 452.940567 575.4542
2007 932.882226 870.47
Regression
Statistics
Multiple R 0.146309
R Square 0.021406
Adjusted R Square -0.30479

RELATIONSHIP BETWEEN EVA & SHARE PRICE
M. P. Birla Institute of Management 62
ONGC:
→Very small positive correlation. If EVA moves by one,
share price will move by 0.0130 in the same direction.
→0.0168% of change in share price is due to change in EVA.
The t-statistics of this is -0.022.
The p- value in this case is 0.983482, which is more than 5% level of significance.
Therefore Null hypothesis is accepted.
As such there is no relationship between EVA and share price.
Year EVA(X) Share price(Y)
2003 -2719.0387 236.0683
2004 -11537.433 399.19
2005 -6702.3579 516.6467
2006 -10239.35 684.5133
2007 -3118.1909 819.08
Regression
Statistics
Multiple R 0.012974
R Square 0.000168
Adjusted R Square -0.33311

RELATIONSHIP BETWEEN EVA & SHARE PRICE
M. P. Birla Institute of Management 63
Ranbaxy:
→Very small positive correlation. If EVA moves by one,
share price will move by 0.0130 in the same direction.
→0.0168% of change in share price is due to change in EVA.
The t-statistics of this is 1.7715.
The p- value in this case is 0.983482, which is more than 5% level of significance.
Therefore Null hypothesis is accepted.
As such there is no relationship between EVA and share price.
Year EVA(X) Share price(Y)
2003 -1979.8566 236.0683
2004 -404.34376 399.19
2005 92.5464295 516.6467
2006 -830.58204 684.5133
2007 -60.508 819.08
Regression
Statistics
Multiple R 0.012974
R Square 0.000168
Adjusted R Square -0.33311

RELATIONSHIP BETWEEN EVA & SHARE PRICE
M. P. Birla Institute of Management 64
Reliance Industries:
→ Medium positive correlation. If EVA moves by one, share
price will move by 0.50152 in the same direction.
→ 25.15% change in share price is due to change in EVA.
The t-statistics of this is 0.3893.
The p- value in this case is 0.389327, which is more than 5% level of significance.
Therefore Null hypothesis is accepted.
As such there is no relationship between EVA and share price.
Year EVA(X) Share price(Y)
2003 4204.79832 222.1617
2004 -10268.775 348.5825
2005 -2203.991 421.955
2006 886.327229 605.1217
2007 6106.42638 1154.8971
Regression
Statistics
Multiple R 0.50152
R Square 0.251522
Adjusted R Square 0.002029

RELATIONSHIP BETWEEN EVA & SHARE PRICE
M. P. Birla Institute of Management 65
Reliance Energy:
→Large positive correlation. If EVA moves by one, share
price will move by 0.5480 in the same direction.
→30% of change in share price is due to change in EVA.
The t-statistics of this is 0.3389
The p- value in this case is 0.33894, which is more than 5% level of significance.
Therefore Null hypothesis is accepted.
As such there is no relationship between EVA and share price.
Year EVA(X) Share price(Y)
2003 17.1439079 411.07
2004 -10268.775 348.5825
2005 -596.73733 598.27
2006 -2251.0993 581.3517
2007 -397.08924 504.8458
Regression
Statistics
Multiple R 0.548017
R Square 0.300323
Adjusted R Square 0.067097

RELATIONSHIP BETWEEN EVA & SHARE PRICE
M. P. Birla Institute of Management 66
Wipro:
→Large positive correlation. If EVA moves by one, share
price will move by 0.5480 in the same direction.
→30% of change in share price is due to change in EVA.
The t-statistics of this is 1.6221.
The p- value in this case is 0.203243, which is more than 5% level of significance.
Therefore Null hypothesis is accepted.
As such there is no relationship between EVA and share price.
Year EVA(X) Share price(Y)
2003 632.23431 241.615
2004 -581.2762 207.3025
2005 598.2125 305.6117
2006 79.405193 409.4917
2007 1308.8339 543.6567
Regression
Statistics
Multiple R 0.683551
R Square 0.467242
Adjusted R Square 0.289656

RELATIONSHIP BETWEEN EVA & SHARE PRICE
M. P. Birla Institute of Management 67
CHAPTER 6
SUMMARY AND
RECOMMENDATIION
RELATIONSHIP BETWEEN EVA & SHARE PRICE
M. P. Birla Institute of Management 68
6.1 Findings form the study:
• Investing in the market is becoming more and more risky as the beta of the
individual securities is increasing year by year.
• The increase in beta is increasing weighted average cost of capital; it specifies
that capital is becoming more and more costly.
• Majority of the companies are increasing their capital to meet the increased
expenses.
• As the market is becoming more and more risky, investors’ expectations are
increasing and therefore share prices of almost all the companies for almost all
the years showed an increasing trend.
• Data analysis of 20 companies shows that
Share prices of two companies’ shows high correlation of coefficient and
coefficient of determination with EVA.
Share prices of eighteen companies’ shows low correlation of coefficient
and coefficient of determination with EVA.

RELATIONSHIP BETWEEN EVA & SHARE PRICE
M. P. Birla Institute of Management 69
This specifies that there is no relationship between EVA and share price.
6.2 Conclusion from the study: This report explains the importance of using EVA as a tool for measuring
financial performance. The study reveals that there is no strong pattern of EVA of
selected companies during the period.
The wealth created by most companies in year 2004 is negative because of
higher cost of capital. The central idea of EVA is subtracting the cost of capital
from the firm's profits to measure, as the term indicates, the economic additional
value produced by the firm to its owners over the weighted cost of the capital
employed. It reveals that the the decision of managers between using equity fund
or debt fund will influence EVA to the greater extent. This raised the question of
the effect of the debt and equity cost components on the behavior of EVA. It was
observed that the cost of debt has little effect on the EVA's. On the other hand,
as is expected, EVA behaves in a linear fashion with respect to the cost of equity
It is also observed that there is no strong relation between EVA and market
prices of the companies. Thus, it can be understood that investor do not give so
importance to EVA for its investment decision. Extensive study is required to
establish the influence of other factors like non-fund based income, spread,

RELATIONSHIP BETWEEN EVA & SHARE PRICE
M. P. Birla Institute of Management 70
deployment of funds, market price, etc. It is also expected that the usage of EVA
as a financial performance tool will also be more in India.
The study adds that EVA is the one of the measure, which can be used to
measure the performance of the company but it cannot be used to forecast the
share price of the company.
6.2 Suggestions for further research:
This research has a limited scope, that is only five years and the data of only
twenty companies is taken into consideration. These five years had showed a lot
of variations with respect to beta, invested capital, weighted average cost of
capital and share prices.
To overcome this limitation of the study, the sample size and the years of
consideration for the research has to be increased, so as to decrease the
variations with respect to the above mentioned variables.
Extensive study is required to establish the influence of other factors like
expectations of investors with respect to mergers and acquisitions, sold outs and
various other factors which influence investors to undertake investing decisions.
It is because in these days all the above mentioned factors are common and it is
expected that it will also influence share prices.

RELATIONSHIP BETWEEN EVA & SHARE PRICE
M. P. Birla Institute of Management 71
Bibliography: A. Books
• Chandra, Prasanna, Financial management, Second Edition, New Delhi:
Tata McGraw-Hill Publishing Company Limited, 2005.
• Kulkarni, P.V. and Sathyaprasad B.G., Financial Management, Ninth
Edition, Himalaya Publishing House, 1999.
• Pandey, I.M., Financial Management, Eighth Edition, Vikas Publishing
House Pvt. Ltd., 1999.
B. Articles • Lehn and Makhija., “a study on EVA and MVA as performance measures
and signals for strategic change”.
• Banerjee, Ashok., “Economic Value Added and Shareholder Wealth - An
empirical study of relationship”.
• Dr. Srinivasan, Professor, National Institute of Industrial Engineering
(NITIE) on “Economic Value Added (EVA) - An Emerging Tool for Value
Creation”
• “Relationship between EVA and share price”, The ICFAI Journal of
Applied Finance, Vol. 13, No.1, (January, 2007), pp. 5-20.
• Sheik, Aamir M., “How EVA influences stock market”, The Journal of
Finance, Vol. 44, No. 5. (December, 1987), pp. 1361-1372.
RELATIONSHIP BETWEEN EVA & SHARE PRICE
M. P. Birla Institute of Management 72
C. Databases
• Prowess
• Capital-online
D. Websites • www.nseindia.com
• www.google.com
• www.rediff.com/finance
• www.jstor.com
• www.eva.com
• www.wikepedia.com
• www.sternstewart.com

RELATIONSHIP BETWEEN EVA & SHARE PRICE
M. P. Birla Institute of Management 73
APPENDICES:
ACC
year beta kd Ke wd we wacc Capital NOPAT Share price
2002-03 0.2606441 0.0487292 0.023202 0.53 0.47 0.0367314 2982.88 244.0322 148.6025
2003-04 0.2617192 0.0401992 0.2264548 0.49 0.51 0.1351895 3317.69 360.31135 204.3667
2004-05 0.1444204 0.037272 0.0754496 0.36 0.64 0.0617056 3347.51 500.23168 289.4408
2005-06 0.1536011 0.0540168 0.142445 0.23 0.77 0.1221065 4100.38 1129.8498 487.4683
2006-07 0.6089198 0.1031633 0.0974968 0.1 0.9 0.0980635 4647.71 1336.1735 927.9225
AMBUJA year beta kd Ke wd we wacc Capital NOPAT Share price
2002-03 -
0.2551141 0.0482033 0.0939115 0.52 0.48 0.0701433 3367.863 253.46601 23.36667 2003-04 0.4185113 0.0599761 0.3342824 0.39 0.61 0.2273029 3291.37 331.82992 32.2275
2004-05 -
10.383869 0.0542668 -
1.6972972 0.34 0.66 -
1.1017655 3305.84 406.89368 43.05583 2005-06 0.3516393 0.0872339 0.254315 0.2 0.8 0.2208988 4355.96 1303.2852 72.89083 2006-07 0.6758358 0.1534891 0.1003175 0.07 0.93 0.1040395 4991.29 1858.8929 117.9617
AIRTEL year beta kd Ke wd we wacc Capital NOPAT Share price
2002-03 -
0.2482196 1.65545 0.0929504 0.01 0.99 0.1085754 4825.67 2100.105 29.895 2003-04 0.1563647 0.0037467 0.1543408 0.11 0.89 0.1377754 5451.22 1440.7387 78.55667 2004-05 0.656729 0.0007436 0.1616704 0.52 0.48 0.0779884 9527.89 125424.94 171.5175 2005-06 0.2948477 0.0004351 0.22211 0.4 0.6 0.13344 12129.72 170181.84 507.8867 2006-07 0.3315816 0.0009038 0.0858351 0.32 0.68 0.0586571 16724.01 325578.94 520.17
BHEL

RELATIONSHIP BETWEEN EVA & SHARE PRICE
M. P. Birla Institute of Management 74
year beta kd Ke wd we wacc Capital NOPAT Share price
2002-03 0.4537341 0.0683648 -
0.0032969 0.01 0.99 -
0.0025803 5337.89 571.46857 87.97917 2003-04 0.4720303 0.0741724 0.3713696 0.09 0.91 0.3446219 5835.87 716.56249 198.0733 2004-05 0.391259 0.1010765 0.1170444 0.08 0.92 0.115767 6563.87 1108.7088 315.5742 2005-06 0.3086232 0.0701645 0.23002 0.07 0.93 0.2188301 5835.87 1748.7808 626.155 2006-07 0.3548143 0.3233864 0.0868034 0.01 0.99 0.0891692 8877.59 2519.6793 1118.903
CIPLA
GRASIM year beta kd Ke wd we wacc Capital NOPAT Share price
2002-03 -
0.4334252 0.0540824 0.1183509 0.61 0.39 0.0791471 5053.38 448.68243 314.2883 2003-04 0.3714894 0.0506442 0.3020028 0.36 0.64 0.2115137 5676.38 820.80104 727.4717 2004-05 0.3231908 0.0460636 0.1055932 0.32 0.68 0.0865437 6336.69 961.69475 1158.968 2005-06 0.2448064 0.0348156 0.19386 0.38 0.62 0.1334231 6961.75 872.98365 1332.09 2006-07 0.7951595 0.0252625 0.1053695 0.32 0.68 0.0797353 9181.6 1558.8779 2359.734
HDFC BANK year beta kd Ke wd we wacc Capital NOPAT Share price
2002-03 0.0786464 0.0280062 0.0481906 0.93 0.07 0.0294191 30482.45 1175.2654 217.5967 2003-04 0.4053889 0.023307 0.325354 0.93 0.07 0.0444503 42379.98 1286.7377 301.9808 2004-05 0.4626458 0.0598086 0.1290008 0.91 0.09 0.0660359 51505.98 1529.7432 438.1608 2005-06 0.3128944 0.0416023 0.23228 0.94 0.06 0.053043 73586.87 2122.1128 659.4875 2006-07 0.4277428 0.0201691 0.0898767 0.93 0.07 0.0250486 91319.29 3212.2939 914.3142
HDFC FINANCE year beta kd Ke wd we wacc Capital NOPAT Share price
2002-03 0.3766111 0.056479 0.0072752 0.91 0.09 0.0520507 26296.14 188064.7 329.5208 2003-04 0.9118899 0.0435655 0.6728748 0.91 0.09 0.1002034 32077.83 19342.3 501.585 2004-05 0.5867557 0.0356933 0.1498824 0.9 0.1 0.0471122 40530.5 214596.1 662.8167
year beta kd Ke wd we wacc Capital NOPAT Share price
2002-03 -
0.0790866 0.0315835 0.0697467 0.08 0.92 0.0666936 1164.86 211.33057 73.1 2003-04 0.6039599 0.0426463 0.4613404 0.14 0.86 0.4027232 1474.63 271.9536 79.8225 2004-05 0.2471491 0.0406575 0.0927948 0.11 0.89 0.0870597 1744.83 350.86421 104.6858 2005-06 0.1258566 0.0228485 0.126625 0.2 0.8 0.1058697 2454.18 483.9642 153.6733 2006-07 0.5056715 0.0602167 0.0931605 0.04 0.96 0.0918427 3359.83 546.12064 246.0817

RELATIONSHIP BETWEEN EVA & SHARE PRICE
M. P. Birla Institute of Management 75
2005-06 0.5514618 0.0356389 0.367315 0.89 0.11 0.0721233 51189.68 270334.8 1018.214 2006-07 0.334217 0.0428188 0.0859614 0.88 0.12 0.0479959 62744.42 376085.5 1408.893
HINDALCO year beta kd Ke wd we wacc Capital NOPAT Share price
2002-03 0.4537341 0.038209 0.0292084 0.47 0.53 0.0334387 8586.11 691.13456 241.6152003-04 0.7938111 0.0460524 0.0537608 0.44 0.56 0.0503691 9422.5 948.59409 94.34252004-05 0.391259 0.029819 0.0383361 0.43 0.57 0.0346738 11466.58 1382.8358 305.6116667 2005-06 847.43935 0.0306154 0.0546713 0.27 0.73 0.0481762 14509.7 1553.991 291.6358333 2006-07 0.03179 0.0219311 0.0498104 0.28 0.72 0.0420042 19786.64 2498.1382 172.8783333
HUL year beta kd Ke wd we wacc Capital NOPAT Share price
2002-03 0.1166857 0.0261155 0.0277424 0.07 0.93 0.0276285 3843.03 1489.9012 136.05 2003-04 0.0602001 0.0589059 0.378128 0.03 0.97 0.3685513 3563.83 1076.7072 153.35 2004-05 0.4965496 0.2248093 0.3879276 0.02 0.98 0.3846652 2362.56 1095.3414 134.7933 2005-06 0.0196613 0.0985357 0.205018 0.41 0.59 0.1613603 2796.09 1465.5666 176.8075 2006-07 0.3986352 0.1920349 0.297464 0.44 0.56 0.2510752 1427.77 1568.9451 231.5117
INFOSYS year beta kd Ke wd we wacc Capital NOPAT Share price
2002-03 0.4021504 0 0.1838984 0 1 0.1838984 2,860.65 773.15866 482.95082003-04 0.3240143 0 0.51752 0 1 0.51752 3,253.43 980.86237 531.0252004-05 0.5702256 0 0.4329936 0 1 0.4329936 5,242.00 1486.741 863.88752005-06 0.0863103 0 0.254079 0 1 0.254079 6,897.00 1824.7579 1258.33
2006-07 -
0.0115387 0 0.03325 0 1 0.03325 11,162.00 2768.8051 1880.815
ITC year beta kd Ke wd we wacc Capital NOPAT Share price
2002-03 -0.031024 0.2293954 0.0631563 0.02 0.98 0.0664811 5482.6 1397.6965 43.1391 2003-04 0.1338316 0.1885627 0.1385444 0.01 0.99 0.1390446 6530.91 1568.9051 57.3225 2004-05 0.8607638 0.1380354 0.196024 0.03 0.97 0.1942843 8140.97 2052.2359 75.275 2005-06 0.6300881 0.1174924 0.41195 0.02 0.98 0.4060608 9181.21 2163.6215 128.1108 2006-07 0.14834 0.0532351 0.0781308 0.02 0.98 0.0776329 10637.96 2628.6248 178.2592
L & T year beta kd Ke wd we wacc Capital NOPAT Share price
2002-03 0.1991978 0.0541673 0.0315773 0.26 0.74 0.0374507 6738.54 511.85226 92.2483 2003-04 0.3795847 0.063355 0.3074972 0.24 0.76 0.2489031 4099.39 596.01647 181.6175 2004-05 1.2017352 0.0433287 0.2534484 0.36 0.64 0.1778053 5228.19 937.90689 402.6267

RELATIONSHIP BETWEEN EVA & SHARE PRICE
M. P. Birla Institute of Management 76
2005-06 0.0603446 0.0790599 0.0899 0.32 0.68 0.0864312 6093.74 1036.7318 764.5017 2006-07 0.1887499 0.0441718 0.0798148 0.47 0.53 0.0630626 7846.18 1427.8514 1326.798
M & M year beta kd Ke wd we wacc Capital NOPAT Share price
2002-03 0.5111344 0.0677901 -
0.0112603 0.32 0.68 0.0140358 2709.68 208.9079 49.90252003-04 0.3403584 0.0702775 0.280712 0.23 0.77 0.2323121 2504.84 343.4305 136.35422004-05 0.4909302 0.0191532 0.133716 0.35 0.65 0.093619 3039.15 486.2981 237.84832005-06 0.2891674 0.0203471 0.219285 0.29 0.71 0.161593 3792.25 751.0109 397.592006-07 0.4748729 0.0080689 0.0918554 0.42 0.58 0.0566651 5188.91 958.9079 719.2775
MARUTI year beta kd Ke wd we wacc Capital NOPAT Share price
2002-03 0.13487 0.0770506 -
0.0034342 0.08 0.92 0.0030046 3554 223.21116 266.47
2003-04 -0.99352 0.0927694 -
0.6347924 0.01 0.99 -
0.6275168 3903.1 542.16044 328.91782004-05 0.8747752 0.0780273 0.1983816 0.07 0.93 0.1899568 4686.4 893.97803 427.80582005-06 0.1257093 0.1896887 0.126625 0.08 0.92 0.1316701 5524.3 1180.3257 575.45422006-07 0.3841321 0.0397399 0.0880664 0.13 0.87 0.081784 7484.7 1545.0106 870.47
ONGC year beta kd Ke wd we wacc Capital NOPAT Share price
2002-03 -0.082004 0.0943109 0.0701586 0.2 0.8 0.0749891 36539.19 21.00105 236.0683 2003-04 0.3352983 0.0026919 0.277278 0.2 0.8 0.2223608 51950.89 14.407387 399.19 2004-05 0.6944469 0.0025112 0.1680696 0.27 0.83 0.1401758 56761.64 1254.2494 516.6467 2005-06 0.3068171 0.0024608 0.22889 0.22 0.78 0.1790756 66682.28 1701.8184 684.5133 2006-07 0.2773362 0.0017421 0.0835617 0.01 0.99 0.0827435 77033 3255.7894 819.08
RANBAXY year beta kd Ke wd we wacc Capital NOPAT Share price
2002-03 -
0.2333128 2.0087961 0.0908909 0.58 0.42 1.2032759 1880.33 282.6992 236.0683 2003-04 0.5873083 0.1572369 0.4503516 0.3 0.7 0.3624172 2354.04 448.8008 399.19 2004-05 0.6515054 0.0538817 0.1608284 0.01 0.99 0.1597589 2642.54 514.7158 516.6467 2005-06 0.5748039 0.017098 0.38031 0.01 0.99 0.3766779 3406.82 452.6917 684.5133 2006-07 0.2896844 0.0122576 0.0840669 0.01 0.99 0.0833488 5527.73 400.2217 819.08
RELIANCE INDUSTRIES year beta kd Ke wd we wacc Capital NOPAT Share price
2002-03 0.562 0.0524754 -
0.0182626 0.3 0.7 0.0029588 50132.72 4353.131 222.16172003-04 0.482 0.0456693 0.3782376 0.3 0.7 0.2784671 55397.11 5157.4979 348.5825 2004-05 0.912 0.0521255 0.2047808 0.32 0.68 0.1559311 59187.91 7025.2446 421.955 2005-06 0.144 0.0267417 0.13736 0.38 0.62 0.095325 71699.87 7721.1194 605.1217

RELATIONSHIP BETWEEN EVA & SHARE PRICE
M. P. Birla Institute of Management 77
2006-07 -0.285 0.0282939 0.0599015 0.39 0.61 0.0475745 91792.86 10473.43 1154.8971
RELIANCE ENERGY year beta kd Ke wd we wacc Capital NOPAT Share price
2002-03 0.2936612 0.079039 0.0186711 0.39 0.61 0.0422146 3209.88 152.64763 218.7675
2003-04 -
0.4295468 0.0553031 -
0.2474372 0.36 0.64 -
0.1384507 7159.54 324.84958 411.07 2004-05 0.6946358 0.0239005 0.1680696 0.39 0.61 0.1118436 9532.66 469.43014 598.27 2005-06 0.4782984 0.0298164 0.32607 0.29 0.71 0.2401565 12075.51 648.91244 581.3517
2006-07 0.3588462 0.0283681 0.0869718 0.2 0.8 0.0752511 15222.2 748.39742 504.8458
WIPRO TECH year beta kd Ke wd we wacc Capital NOPAT Share price
2002-03 0.453734 0.0280062 -
0.0034342 0.0205149 0.9794851 -
0.0027892 3399.96 622.75114 241.6152003-04 0.4720303 0.023307 0.3713696 0.0279053 0.9720947 0.3616568 3608.28 723.68285 207.30252004-05 0.391259 0.0598086 0.1170444 0.012532 0.987468 0.1163271 4954.53 1174.5587 305.61172005-06 0.3086232 0.0416023 0.230585 0.007752 0.992248 0.22912 6470.61 1561.9514 409.49172006-07 0.3548143 0.0201691 0.0868034 0.0249087 0.9750913 0.0851436 9554.9 2122.3728 543.6567