Embed Size (px)
Citation preview
Microfluídica
1
Introducción: Fundamentos, Historia, Mo8vación, Aplicaciones, Tendencias…
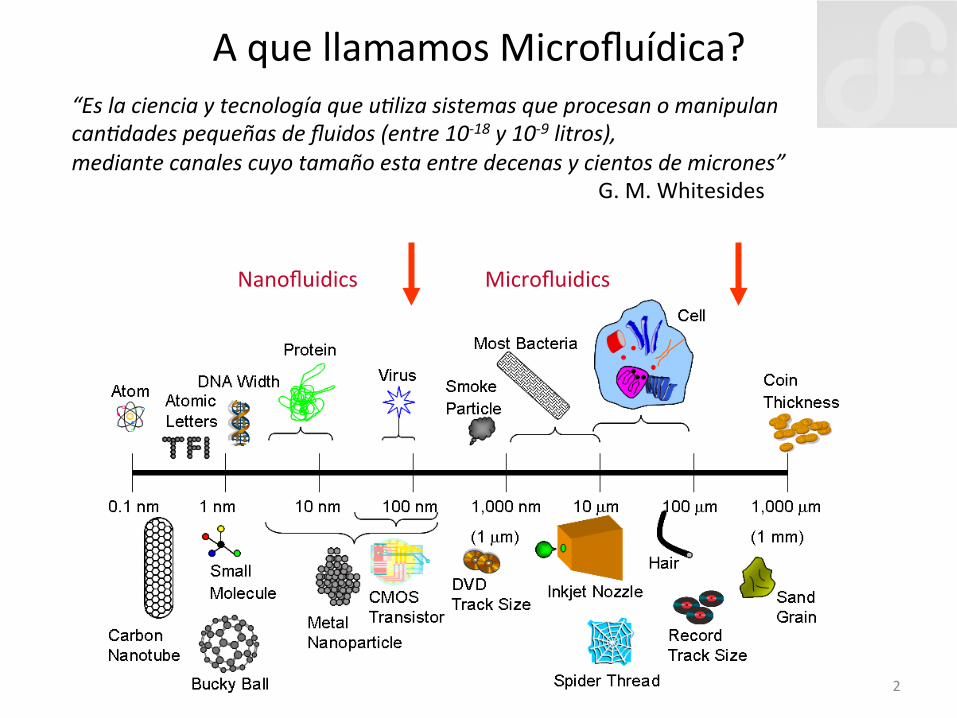
A que llamamos Microfluídica?
2
“Es la ciencia y tecnología que u2liza sistemas que procesan o manipulan can2dades pequeñas de fluidos (entre 10-‐18 y 10-‐9 litros), mediante canales cuyo tamaño esta entre decenas y cientos de micrones”
G. M. Whitesides
Nanofluidics Microfluidics
3
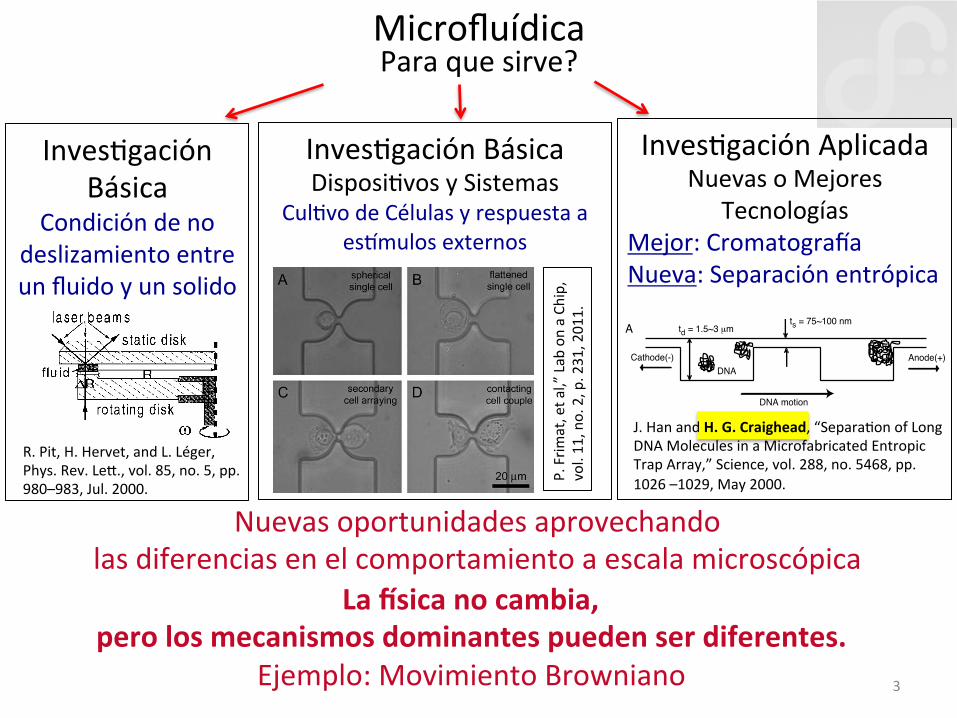
Microfluídica Para que sirve?
Inves8gación Aplicada Nuevas o Mejores
Tecnologías Mejor: CromatograLa Nueva: Separación entrópica
Nuevas oportunidades aprovechando las diferencias en el comportamiento a escala microscópica
La $sica no cambia, pero los mecanismos dominantes pueden ser diferentes.
Ejemplo: Movimiento Browniano
J. Han and H. G. Craighead, “Separa8on of Long DNA Molecules in a Microfabricated Entropic Trap Array,” Science, vol. 288, no. 5468, pp. 1026 –1029, May 2000.
Separation of Long DNAMolecules in a Microfabricated
Entropic Trap ArrayJ. Han and H. G. Craighead*
A nanofluidic channel device, consisting of many entropic traps, was designedand fabricated for the separation of long DNAmolecules. The channel comprisesnarrow constrictions and wider regions that cause size-dependent trapping ofDNA at the onset of a constriction. This process creates electrophoreticmobilitydifferences, thus enabling efficient separation without the use of a gel matrixor pulsed electric fields. Samples of long DNA molecules (5000 to !160,000base pairs) were efficiently separated into bands in 15-millimeter-long chan-nels. Multiple-channel devices operating in parallel were demonstrated. Theefficiency, compactness, and ease of fabrication of the device suggest thepossibility of more practical integrated DNA analysis systems.
Gel electrophoresis is the standard method forseparation of DNA by length. The efficiency ofgel electrophoresis deteriorates seriously, how-ever, for DNA molecules longer than about40,000 base pairs (40 kbp). Slab gel pulsed-field gel electrophoresis (PFGE), using time-varying drive voltages, can be used to separatelonger double-stranded DNA (dsDNA) frag-ments, but generally the process is slow, andrecovery of separated DNA from gel is com-plex. Efficient separation has been reportedwith pulsed-field capillary gel electrophoresis(PFCGE) (1–3). However, only one samplecould be run at a time in PFCGE, and somultiple capillary systems would be requiredfor large-scale genome sequencing or DNAfingerprinting (4). Moreover, with respect tofuture integrated bioanalysis systems (5, 6)—the so-called micro total analysis systems ("-TAS)—it could be cumbersome to introduce aforeign sieving matrix into the channel of ahighly integrated device.
A variety of microfabricated systems (7–12)have been studied for separation of dsDNA.However, early artificial gel systems (8, 10)with arrays of pillars showed poor dc electro-phoretic separation for long DNA molecules,and the use of pulsed electric fields was re-quired (9). More recently, a single-moleculeDNA sizing device (11) and a diffusion sortingarray (12) were reported. Despite the advantag-es of these new systems, it is still unclear howthese systems might be incorporated into estab-lished bioanalysis protocols.
Recently we introduced an entropic traparray system with lithographically defined con-strictions comparable to molecular dimensions;this system can be used with static (dc) electricfields to rapidly separate large DNA fragments
(13). A spatially varying but static electric fieldand an array of constrictions act as size-depen-dent traps for DNA motion. Separation matricessuch as gels or polymer solutions are not used,and the methods used to fabricate this array arecompatible with silicon-based processing.Therefore, this device could easily be integratedinto a larger total analysis system. The basictheory of operation of the device has beendescribed (14). Here, we demonstrate one ap-plication of the entropic trap array device byusing it in a way similar to conventional slabgel PFGE methods.
The basic design of the entropic trap array
(Fig. 1A) consists of alternating thin andthick regions in a microfabricated channel.The channel depth of the thin region is small-er than the radius of gyration (Ro) of DNAmolecules being separated, and thus it servesas a molecular sieve. In the thick region,DNA molecules can form spherical equilib-rium shapes because the thickness here islarger than Ro, whereas in the thin regionDNA molecules are deformed. When drivenby an electric field, DNA molecules travelthrough alternating thick and thin regions andrepeatedly change their conformation. Thisconformation change costs entropic free en-ergy, so DNA molecules are temporarilytrapped at the entrance of the thin regions.The entropic trapping limits the overall mo-bility of DNA molecules in the channel, andthe mobility of DNA becomes length-depen-dent. Interestingly, longer DNA moleculesactually have higher mobility in this channel(13). In the escape of a DNA molecule froman entropic trap, only the part of the moleculethat is in contact with the boundary of the thinregion plays a crucial role. Whenever a suf-ficient number of DNA monomers are intro-duced into the high-field thin region (byBrownian motion), the escape of the wholemolecule is initiated (14). Longer DNA mol-ecules, with larger Ro, have a larger surfacearea in contact with the boundary and there-fore have a higher probability to escape perunit time (due to a higher escape attemptfrequency), which leads to a shorter trappingtime and a higher overall mobility (Fig. 1B).
School of Applied and Engineering Physics, CornellUniversity, Ithaca, NY 14853, USA.
*To whom correspondence should be addressed. E-mail: [email protected]
DNA Cathode(-)
A
BThick region Thin region
Anode(+)
30 µm a
b
wawb
ts = 75~100 nmtd = 1.5~3 µm
2Ro
DNA motion
Cbuffer
solution
+-
Fluorescencemicroscopyobservation
DNA
Fig. 1. Nanofluidic sep-aration device withmany entropic traps.(A) Cross-sectionalschematic diagram ofthe device. Electro-phoresed DNA mole-cules are trappedwhenever they meet athin region, becausetheir radius of gyra-tion (Ro) is much larg-er than the thin regiondepth (here, td and tsare the thick and thinregion depths, respec-tively). (B) Top view ofthe device in opera-tion. Trapped DNAmolecules eventuallyescape, with a proba-bility of escape pro-portional to the lengthof the slit that theDNA molecule covers(wa and wb). Largermolecules have ahigher escape proba-bility because theycover wider regions ofthe slit (wb # wa). (C)Experimental setup.Reservoirs are made at both ends of the channel and filled with DNA solution.
R E P O R T S
12 MAY 2000 VOL 288 SCIENCE www.sciencemag.org1026
on
April
7, 2
011
ww
w.s
cien
cem
ag.o
rgD
ownl
oade
d fro
m
Inves8gación Básica Disposi8vos y Sistemas
Cul8vo de Células y respuesta a esbmulos externos
perfusion for 1 hour at!5 mm s"1 would be sufficient to replenish
the media, with soluble factors retained during static incubation
for the remainder of the day. In the following proof-of-concept
experiments we opted to use continuous media perfusion at !5
mm s"1.
The influence of the flow ratio and the trap dimensions was
investigated. In this study we used a channel height (H # 28 mm)
double that of the cells’ mean diameter (14.6 mm). This relatively
large size reduces the possibility of shear-induced damage during
microfluidic transport to the trap structures. This deviates from
the H < 1.4 cell diameters value recommended by Tan and
Takeuchi for use with a flow ratio of 3.95,18 and demands a lower
flow ratio for successful sequential single cell arraying. We
examined flow ratios ranging from 0.6 to 1.8 and can confirm the
Q1/Q2 > 1 requirement for effective microfluidic arraying. Shown
in Fig. 4(A), flow ratios $1.4 enabled efficient arraying that was
largely insensitive to variations in the size of the SW480 epithelial
cells (Ø SD$ 3.0 mm). Recorded in Fig. 4(B), only!25% of traps
were occupied when using flow ratios #1.0, whereas >98% of
traps were occupied with flow ratios $1.4. Single cell occupancy
was 80.6% (SD $ 4.3) when using a flow ratio of 1.4 and 85.0%
(SD $ 2.8) with a flow ratio of 1.8. The influence of the trap size
was also examined and had only a minor impact on cell arraying
characteristics. In this experiment, >99% of traps were occupied
for trap diameters ranging from 15 mm (cell-sized) to 37 mm.
Single cell occupancy was typically 80%, with the exception of the
largest traps where only 68.6% (SD $ 6.7) of traps contained
single cells. This small but significant reduction (*p # 0.005) may
be caused by the greater freedom of cell placement with the
possibility of failing to divert the streamlines once the first cell is
loaded, or that cell doublets were sheltered from flow-induced
disaggregation and separation.
Single cell pairing
Cell viability is a fundamental pre-requisite for cellular valving.
Viable cells can adhere to the substrate and flatten, acting as
a living valve to restore the Q1 > Q2 condition and enable pairing
of the second cell type using a reversed flow. The complete single
cell pairing process is documented in Fig. 5. Following adhesion,
the MCF-7 cells adopted a morphology typical of cells cultured
on standard tissue culture substrates (see Fig. 5(B)). This flat-
tened state enabled the delivery of the second cell type which also
adhered to the substrate. With continued culture, neighbouring
single cell pairs formed physical contacts across the micro-
structured aperture (see Fig. 5(D)). This demonstrates that the
cellular valving principle can indeed be used to establish con-
tacting single cell co-cultures. The method has a wide ranging
scope, being suitable for coupling where at least one of the
cellular partners can act as microfluidic valve (i.e. adheres and
becomes flattened). The coupling principle can also be applied to
cell types with different sizes, with the simple requirement that
the aperture is smaller than the smallest cell type. Moreover, the
use of the differential resistance arraying method eliminates the
risk of channel blocking which can occur with systems designed
to contact cells across the width of a single microchannel.12
Further developments were required to provide a reliable
single cell co-culture platform. Dead, non-adherent cells (!10%)
should be removed. However, flow reversal while viable cells are
in the flattened state would only direct dead cells into neigh-
bouring traps immediately across the microfluidic channel. This
is solved by exploiting the longer time scales required for cell
flattening than initial adhesion. Within 2 hours of loading, viable
cells become adherent but retain a relatively spherical
morphology. At this stage the cellular valve is in a partially
closed state, and by flow reversal dead cells are diverted into the
serpentine channel and removed from the system. Following
a further 4 hours incubation, the remaining cells flatten in
readiness for arraying the second cell type. This method ensures
that at least one of the cell partners is viable. With the second
arraying phase, 90% of the cells are estimated to be viable such
that !90% of the pairs are also likely to contain viable cell
partners.
Co-culture experiments require time scales of the order of
hours to days. However, with the immediate introduction of
aqueous media following plasma-based device assembly, the
PDMS maintains a hydrophilic character21 which supports cell
adhesion22 and migration. Within 24 hours some cells migrated
outside the trap region (see Fig. S2(A)†), and to the extremities of
the serpentine channel by the fourth day of culture (see
Fig. S2(B)†). Migration prevents controlled single cell co-culture.
To remedy this limitation we implemented a plasma stencilling
method22 to pattern cells within the trap regions. This approach
requires a hydrophobic PDMS state which can be restored,
following plasma bonding, by the diffusive return of oligomers to
the surface during overnight incubation in a dry state.24 Native
PDMS surfaces provide biologically inert backgrounds which
resist cell adhesion.26–28 Hydrophilic patterns for cell adhesion
were provided within the microfluidic system by plasma stencil-
ling using a Tesla generator.22 As with the aqueous flows, the
plasma was routed along the linear path of least resistance,
oxidizing the surface to produce a hydrophilic state which
Fig. 5 The cellular valving approach for single cell co-culture. Single cell
arraying (A) and cellular adhesion, transforming to a flattened
morphology to act as a valve in the open state (B). Introduction of the
second cell (C) and following further culture the cell flattened and con-
tacted the first cell (D).
This journal is ª The Royal Society of Chemistry 2011 Lab Chip, 2011, 11, 231–237 | 235
Publ
ished
on
27 O
ctob
er 2
010.
Dow
nloa
ded
by R
UTG
ERS
STA
TE U
NIV
ERSI
TY o
n 01
/07/
2013
23:
11:4
4.
View Article Online
P. Frim
at, et a
l,” Lab on a Ch
ip,
vol. 11, no. 2, p. 231, 2011.
Inves8gación Básica
Condición de no deslizamiento entre un fluido y un solido
VOLUME 85, NUMBER 5 P H Y S I C A L R E V I E W L E T T E R S 31 JULY 2000
FIG. 1. (a) Schematic of half the flow cell; (b) equivalencebetween slip and shear rate.
(TIR) at the solid/liquid interface. Immediately after thebleaching pulse, the fluorescence intensity is low (photo-bleached probes are inside the illuminated area), and itprogressively recovers due to the transport of nonbleachedprobes into the evanescent wave. The kinetics of fluores-cence recovery after photobleaching (FRAP) reflects thefluid velocity close to the solid wall. If diffusion is negli-gible compared to convection, the relation between FRAPand ys is straightforward [17,19]: With slip at the wall,the base of the photobleached cylinder is translated at thevelocity ys ! b "g, while in case of NSBC, fluorescentprobes only penetrate into the illuminated zone becausethe bleached cylinder is tilted by the flow. The fluores-cence recovery is then more rapid for slip than for no slipat the wall. For simple liquids such as hexadecane, diffu-sion is fast and strongly competes with convection compli-cating the quantitative analysis of the FRAP curves, whilethe above qualitative trends are still observed. The diffu-sion coefficient of hexadecane is too large to be directlymeasured by FRAP techniques but an estimate through theStokes formula gives D ! 10210 m2!s, with a 50% accu-racy. Characteristic diffusion times can be evaluated usingthe Einstein-Stokes equation, z2 ! 2Dt"z#, for the variouscharacteristic lengths of the experiment. Diffusion blursout the photobleached cylinder in t"F!2# $ 4.5 s, whilethe diffusion time over the penetration depth of the evanes-cent wave is t"L# $ 50 ms. The first time is large com-pared to the experimental fluorescence recovery time, t,(t , 100 ms for the whole range of "g investigated). Thesecond time, t"L#, is short compared to t, meaning thatthe velocity gradient normal to the surface will be totallyblurred through diffusion during the fluorescence recov-ery experiment [22,23]. The fluorescence recovery is thussensitive to an average of all velocities within a thicknessDz ! "2Dt#1!2: y ! "g"Dz!2 1 b# [Fig. 1(b)]. This av-erage velocity, y, remains sensitive to slip and allows oneto measure b as long as Dz!2 is not much larger than b.
As illustrated in Fig. 1(b), the same y may be obtainedwith a no slip BC, replacing the imposed shear rate "g byan effective shear rate "gb ! 2y!Dz. The fluorescence re-covery time t can be estimated as the time necessary fora probe to cross the bleaching beam diameter at the ve-locity y: t ! 2"F2!4D#1!3 "g
22!3b . All curves can thus be
scaled on a single master curve through the time scaling:t0 ! t "g
2!3b . This provides an experimental determination
of the effective shear rate, "gb , and thus of the slip length:b ! Dz!2 3 " "gb 2 "g#! "g. Clearly, Dz and thus b de-pend on the value of the diffusion coefficient D. This isanyhow a weak dependence "D1!2#, and the poor accuracyin the estimate of D results only in a systematic uncertaintyof 20% in the b values.
The diffusion length during t gives an upper limit forDz: Dzmax ! 2"DF!2 "gb#1!3. For hexadecane, Dzmax isof the order of a micrometer, a value that we have obtainedindependently by solving numerically the convection-diffusion equations for a two-dimensional modeling of theexperiment. This agreement between experimental andsimulated Dz values means that if numerical prefactors ex-ist in the relation defining Dz, they remain of the order of1 and should not drastically affect the estimated b values.It is important to notice that the experiment is sensitiveto the BC at a distance L ! 80 nm though the measuredvelocity is averaged over a micrometer: The FRAPexperiment appears quite analogous to a thin capillaryflow experiment (diameter in the micron range), but itallows a better control of the quality of the solid surface.
We have examined the flow behavior of hexadecane, amodel lubricant with a rather high surface energy (gL !27.4 mJ!m2 at 20 ±C). The fluorescent probe, NBD dihex-adecylamine at 5 ppm, showed no preferential adsorptionon any of the investigated surfaces. The solid surface wassapphire a-Al2O3 %0001& with a rms roughness of 0.4 nmas determined by x-ray reflectivity. It has been treatedin four ways: (a) an UV/ozone cleaning [24] yielded asurface totally wetted by hexadecane "gs . 72 mJ!m2#;two controlled lyophobic surfaces were obtained bygrafting a self-assembled monolayer of (b) octade-cyltrichlorosilane (OTS: gs ! 21 mJ!m2) and (c)perfluorodecanetrichlorosilane (FDS: gs , 13 mJ!m2)following a procedure similar to that used for silica[25,26]; (d) adsorption of stearic acid (octadecanoic acid)from the hexadecane solution produced an in situ surfacemodification within the flow cell. Wetting characteriza-tions of surface (c) suggested that the FDS monolayerwas incomplete, leading to a chemically inhomogeneoussurface made of FDS islands, in a way similar to whathas been seen by atomic force microscopy (AFM) onincomplete OTS surfaces [27].
Typical fluorescence recovery curves at different im-posed shear rates are reported in Fig. 2 for two differentsurfaces: FDS (closed symbols) and bare sapphire (opensymbols). The use of a normalized relative intensity DI!I ,with DI the decrease in fluorescent intensity due to thephotobleaching, and I the average intensity after fluores-cence recovery, allows one to get rid of experimental con-ditions such as photobleaching intensity, concentration influorescent probes, duration of the bleaching period, inten-sity of the evanescent reading beam, . . . . In such normal-ized intensity units the fluorescence recovery curves arecharacteristic of one shear rate and of one surface. It isclear in Fig. 2 that the fluorescence recovery kinetics arefaster on bare sapphire than on the FDS surface, whatever
981
R. Pit, H. Hervet, and L. Léger, Phys. Rev. Lef., vol. 85, no. 5, pp. 980–983, Jul. 2000.
4
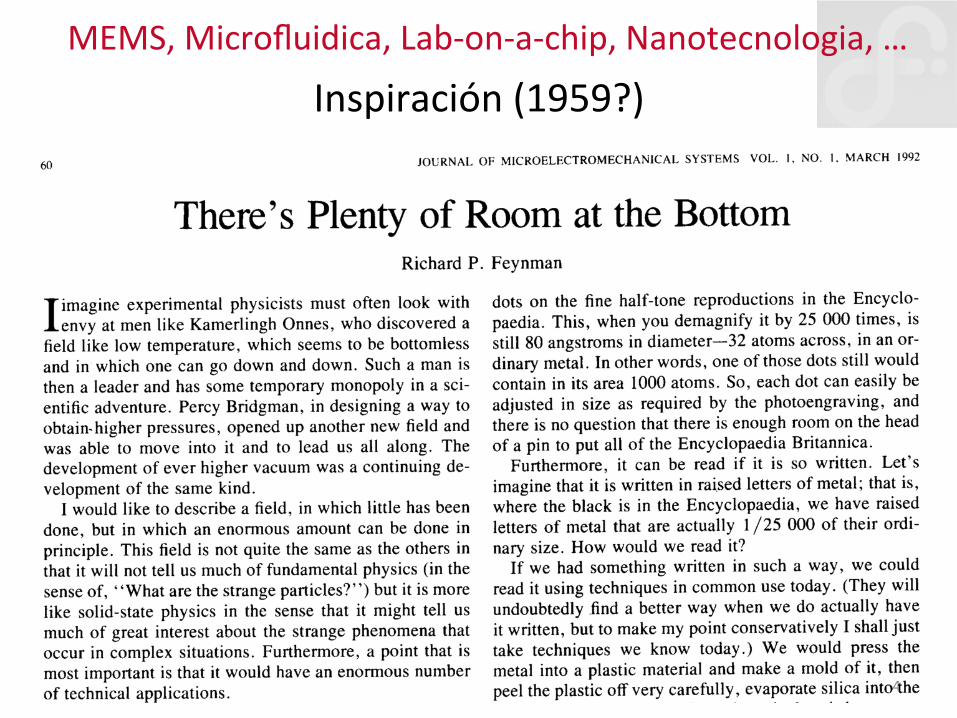
Inspiración (1959?) MEMS, Microfluidica, Lab-‐on-‐a-‐chip, Nanotecnologia, …
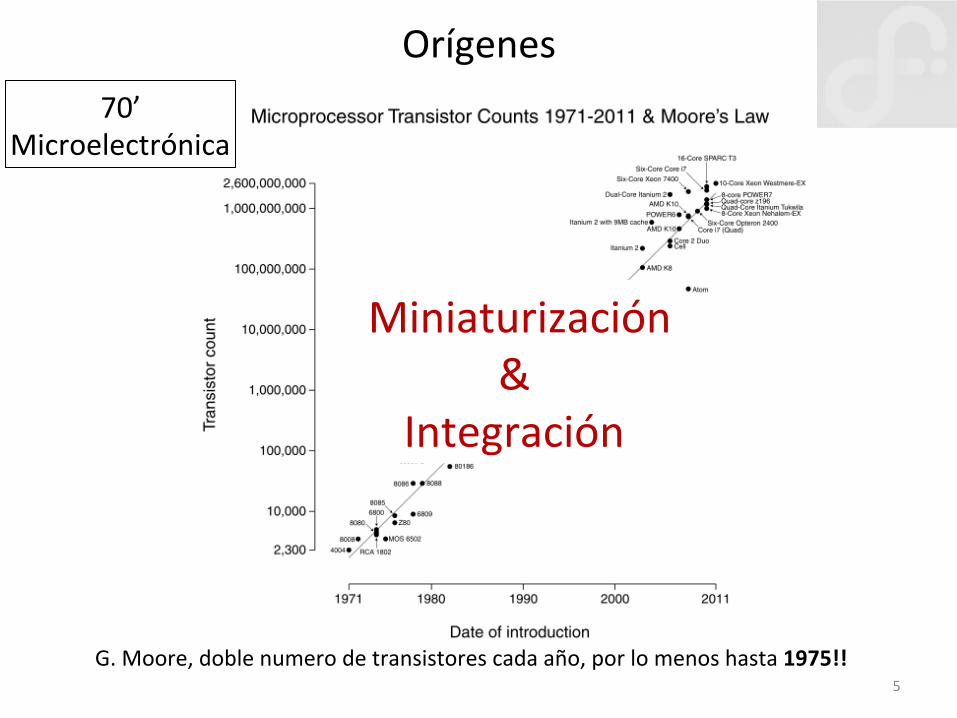
G. Moore, doble numero de transistores cada año, por lo menos hasta 1975!! 5
Orígenes 70’
Microelectrónica
Miniaturización &
Integración
6
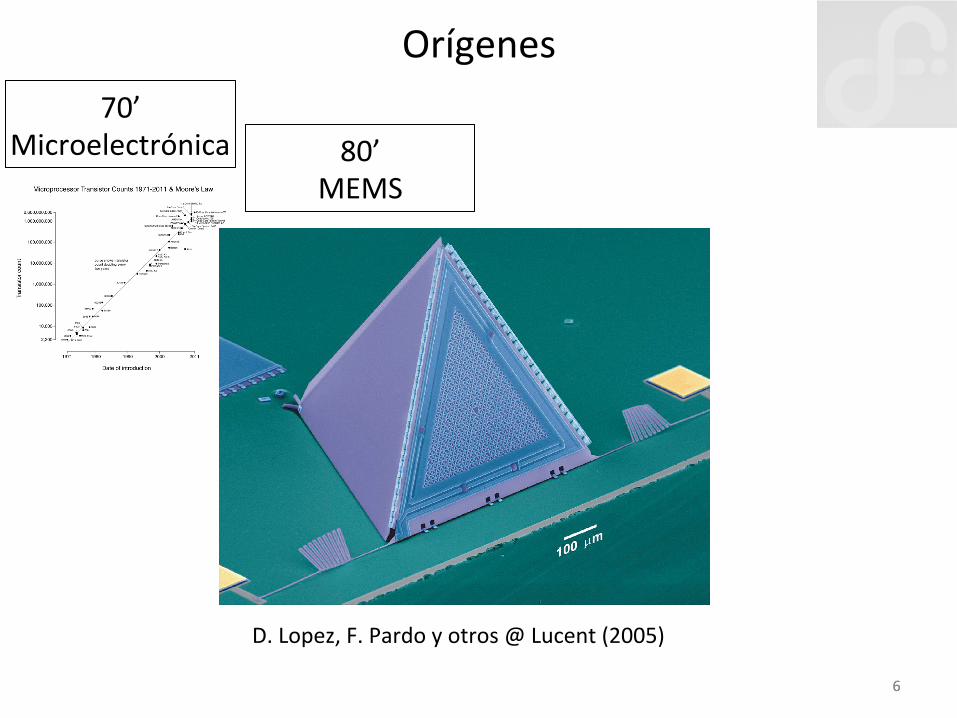
Figure 7.Scanning electron micrograph of the all-surface-micromachined “tent” microphone made at the MCNC foundry.
194 Bell Labs Technical Journal
determined by the size and tension of the membranebut by the tunable length of the beams. The assemblyis accomplished in one step by pulling upwards with amicropipette from the vertex as shown in Figure 8.Several self-assembly techniques have also been triedbut measurements have not yet been made on thesedevices. A sound pressure difference between theinterior and exterior of the chamber forces the mem-brane to move and the change in capacitance isdetected by a charge sensitive amplifier.
The main construction steps for the “tent” micro-phone are shown in Figure 8. Here one can see thatthe assembly requires the pulling of the apex up outof the plane and the pushing in from the two sidesto form the tetrahedron. Sealing of the hinge was
Poly 1 (P1) and Poly 2 (P2) layers are shown in magenta and blue, respectively. The active elementsare the P1 triangular plate and beams (visible below the P2 layer due to the conformal depositionprint trough) and the P2 grid on top, forming a capacitor whose electrodes are connected to bondpads via serpentine springs. The mechanical Q ( 2) is governed by the size and distribution of holesin the grid and the resonance frequency (19 kHz) by the mass of the P1 plate and stiffness of thethree beams.
Hinges
Figure 8.Main MEMS “tent” microphone construction steps.
D. Lopez, F. Pardo y otros @ Lucent (2005)
6
80’ MEMS
70’ Microelectrónica
Orígenes
7 7
80’ MEMS
70’ Microelectrónica
Figure 7.Scanning electron micrograph of the all-surface-micromachined “tent” microphone made at the MCNC foundry.
194 Bell Labs Technical Journal
determined by the size and tension of the membranebut by the tunable length of the beams. The assemblyis accomplished in one step by pulling upwards with amicropipette from the vertex as shown in Figure 8.Several self-assembly techniques have also been triedbut measurements have not yet been made on thesedevices. A sound pressure difference between theinterior and exterior of the chamber forces the mem-brane to move and the change in capacitance isdetected by a charge sensitive amplifier.
The main construction steps for the “tent” micro-phone are shown in Figure 8. Here one can see thatthe assembly requires the pulling of the apex up outof the plane and the pushing in from the two sidesto form the tetrahedron. Sealing of the hinge was
Poly 1 (P1) and Poly 2 (P2) layers are shown in magenta and blue, respectively. The active elementsare the P1 triangular plate and beams (visible below the P2 layer due to the conformal depositionprint trough) and the P2 grid on top, forming a capacitor whose electrodes are connected to bondpads via serpentine springs. The mechanical Q ( 2) is governed by the size and distribution of holesin the grid and the resonance frequency (19 kHz) by the mass of the P1 plate and stiffness of thethree beams.
Hinges
Figure 8.Main MEMS “tent” microphone construction steps.
Orígenes
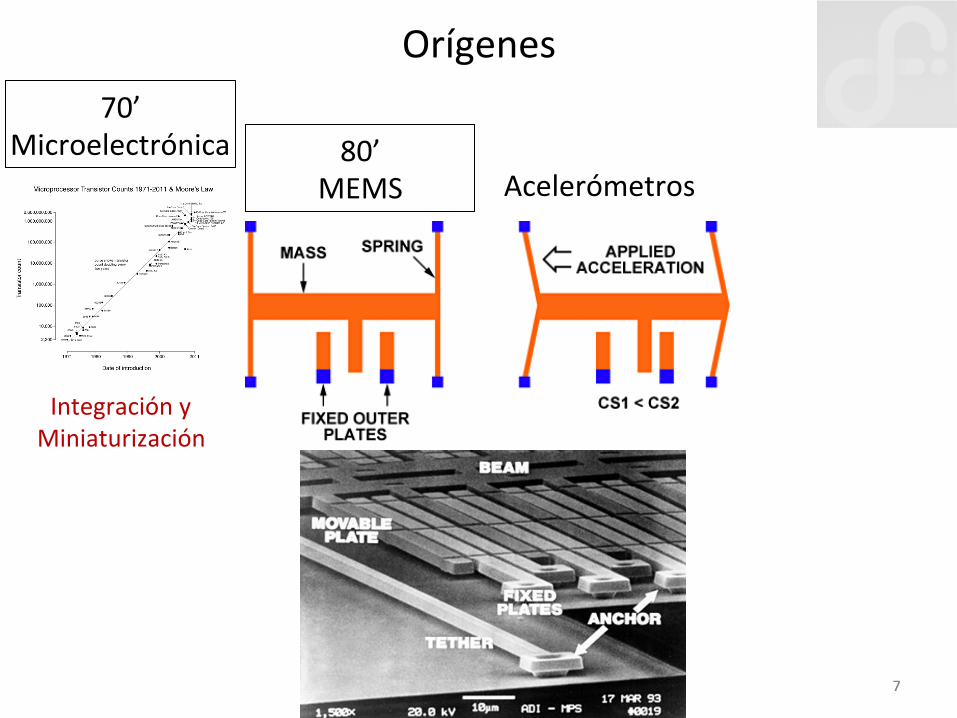
Acelerómetros
Integración y Miniaturización
8
Orígenes
80’ MEMS
70’ Microelectrónica
Figure 7.Scanning electron micrograph of the all-surface-micromachined “tent” microphone made at the MCNC foundry.
194 Bell Labs Technical Journal
determined by the size and tension of the membranebut by the tunable length of the beams. The assemblyis accomplished in one step by pulling upwards with amicropipette from the vertex as shown in Figure 8.Several self-assembly techniques have also been triedbut measurements have not yet been made on thesedevices. A sound pressure difference between theinterior and exterior of the chamber forces the mem-brane to move and the change in capacitance isdetected by a charge sensitive amplifier.
The main construction steps for the “tent” micro-phone are shown in Figure 8. Here one can see thatthe assembly requires the pulling of the apex up outof the plane and the pushing in from the two sidesto form the tetrahedron. Sealing of the hinge was
Poly 1 (P1) and Poly 2 (P2) layers are shown in magenta and blue, respectively. The active elementsare the P1 triangular plate and beams (visible below the P2 layer due to the conformal depositionprint trough) and the P2 grid on top, forming a capacitor whose electrodes are connected to bondpads via serpentine springs. The mechanical Q ( 2) is governed by the size and distribution of holesin the grid and the resonance frequency (19 kHz) by the mass of the P1 plate and stiffness of thethree beams.
Hinges
Figure 8.Main MEMS “tent” microphone construction steps.
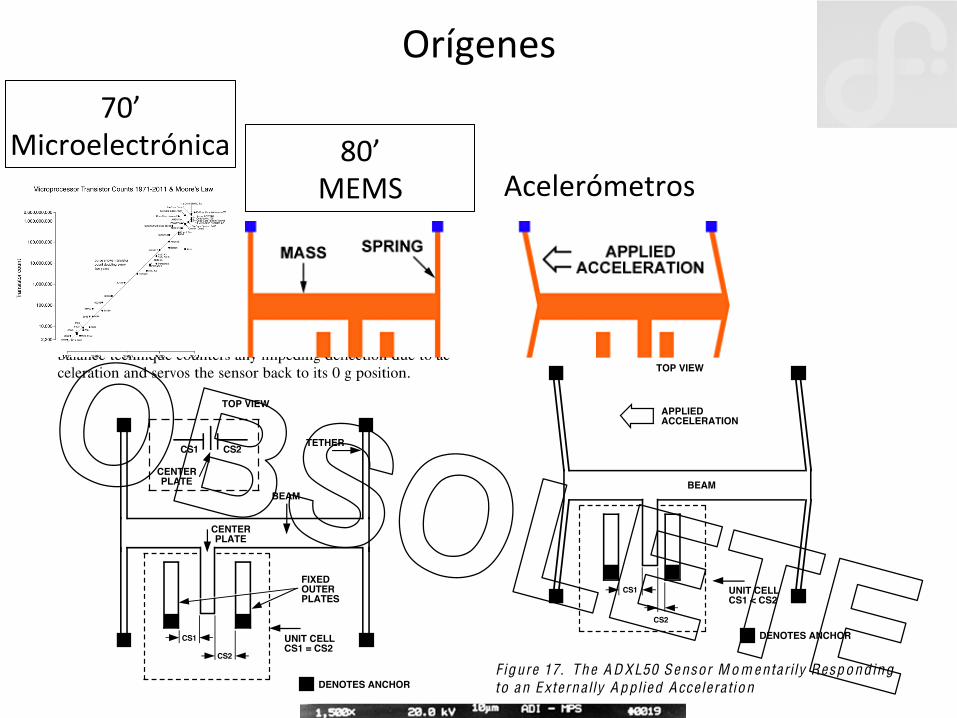
Acelerómetros
ADXL50
–8– RE V . B
THEORY OF OPERATIONThe ADXL50 is a complete acceleration measurement systemon a single monolithic IC. It contains a polysilicon surface-mi-cro machined sensor and signal conditioning circuitry. TheADXL50 is capable of measuring both positive and negative ac-celeration to a maximum level of ±50 g.
Figure 16 is a simplified view of the ADXL50’s accelerationsensor at rest. The actual structure of the sensor consists of 42unit cells and a common beam. The differential capacitor sensorconsists of independent fixed plates and a movable “floating”central plate which deflects in response to changes in relativemotion. The two capacitors are series connected, forming a ca-pacitive divider with a common movable central plate. A forcebalance technique counters any impeding deflection due to ac-celeration and servos the sensor back to its 0 g position.
CS1
CS2
CENTERPLATE
FIXEDOUTERPLATES
UNIT CELLCS1 = CS2
BEAM
TETHERCS1 CS2
CENTERPLATE
TOP VIEW
DENOTES ANCHOR
Figure 16. A Sim plified Diagra m of the A D XL50 Sensor atRest
Figure 17 shows the sensor responding to an applied accelera-tion. When this occurs, the common central plate or “beam”moves closer to one of the fixed plates while moving furtherfrom the other. The sensor’s fixed capacitor plates are drivendeferentially by a 1 MHz square wave: the two square wave am-plitudes are equal but are 180° out of phase from one another.When at rest, the values of the two capacitors are the same andtherefore, the voltage output at their electrical center (i.e., at thecenter plate) is zero.
When the sensor begins to move, a mismatch in the value oftheir capacitance is created producing an output signal at thecentral plate. The output amplitude will increase with theamount of acceleration experienced by the sensor. Informationconcerning the direction of beam motion is contained in thephase of the signal with synchronous demodulation being usedto extract this information. Note that the sensor needs to be po-sitioned so that the measured acceleration is along its sensitiveaxis.
Figure 18 shows a block diagram of the ADXL50. The voltageoutput from the central plate of the sensor is buffered and thenapplied to a synchronous demodulator. The demodulator is alsosupplied with a (nominal) 1 MHz clock signal from the sameoscillator which drives the fixed plates of the sensor. The
demodulator will rectify any voltage which is in sync with itsclock signal. If the applied voltage is in sync and in phase withthe clock, a positive output will result. If the applied voltage is insync but 180° out of phase with the clock, then the demodu-lator’s output will be negative. All other signals will be rejected.An external capacitor, C1, sets the bandwidth of the demodulator.
The output of the synchronous demodulator drives the preamp—an instrumentation amplifier buffer which is referenced to+1.8 volts. The output of the preamp is fed back to the sensorthrough a 3 MΩ isolation resistor. The correction voltage re-quired to hold the sensor’s center plate in the 0 g position is adirect measure of the applied acceleration and appears at theVPR pin.
CS1
CS2
UNIT CELLCS1 < CS2
BEAM
TOP VIEW
DENOTES ANCHOR
APPLIEDACCELERATION
Figure 17. The A D XL50 Sensor M o m entarily Respondingto an Externally A pplied Acceleration
When the ADXL50 is subjected to an acceleration, its capacitivesensor begins to move creating a momentary output signal. Thisis signal conditioned and amplified by the demodulator andpreamp circuits. The dc voltage appearing at the preamp outputis then fed back to the sensor and electrostatically forces thecenter plate back to its original center position.
At 0 g the ADXL50 is calibrated to provide +1.8 volts at theVPR pin. With an applied acceleration, the VPR voltage changesto the voltage required to hold the sensor stationary for the du-ration of the acceleration and provides an output which variesdirectly with applied acceleration.
The loop bandwidth corresponds to the time required to applyfeedback to the sensor and is set by external capacitor C1. Theloop response is fast enough to follow changes in g level up toand exceeding 1 kHz. The ADXL50’s ability to maintain a flatresponse over this bandwidth keeps the sensor virtually motion-less. This essentially eliminates any nonlinearity or aging effectsdue to the sensor beam’s mechanical spring constant, as com-pared to an open-loop sensor.
An uncommitted buffer amplifier provides the capability to ad-just the scale factor and 0 g offset level over a wide range. An in-ternal reference supplies the necessary regulated voltages forpowering the chip and +3.4 volts for external use.
OBSOLETE
9
90’ Microfluidica Lab-‐on-‐a-‐chip
9
Orígenes
80’ MEMS
70’ Microelectrónica
Figure 7.Scanning electron micrograph of the all-surface-micromachined “tent” microphone made at the MCNC foundry.
194 Bell Labs Technical Journal
determined by the size and tension of the membranebut by the tunable length of the beams. The assemblyis accomplished in one step by pulling upwards with amicropipette from the vertex as shown in Figure 8.Several self-assembly techniques have also been triedbut measurements have not yet been made on thesedevices. A sound pressure difference between theinterior and exterior of the chamber forces the mem-brane to move and the change in capacitance isdetected by a charge sensitive amplifier.
The main construction steps for the “tent” micro-phone are shown in Figure 8. Here one can see thatthe assembly requires the pulling of the apex up outof the plane and the pushing in from the two sidesto form the tetrahedron. Sealing of the hinge was
Poly 1 (P1) and Poly 2 (P2) layers are shown in magenta and blue, respectively. The active elementsare the P1 triangular plate and beams (visible below the P2 layer due to the conformal depositionprint trough) and the P2 grid on top, forming a capacitor whose electrodes are connected to bondpads via serpentine springs. The mechanical Q ( 2) is governed by the size and distribution of holesin the grid and the resonance frequency (19 kHz) by the mass of the P1 plate and stiffness of thethree beams.
Hinges
Figure 8.Main MEMS “tent” microphone construction steps.
Acelerómetros
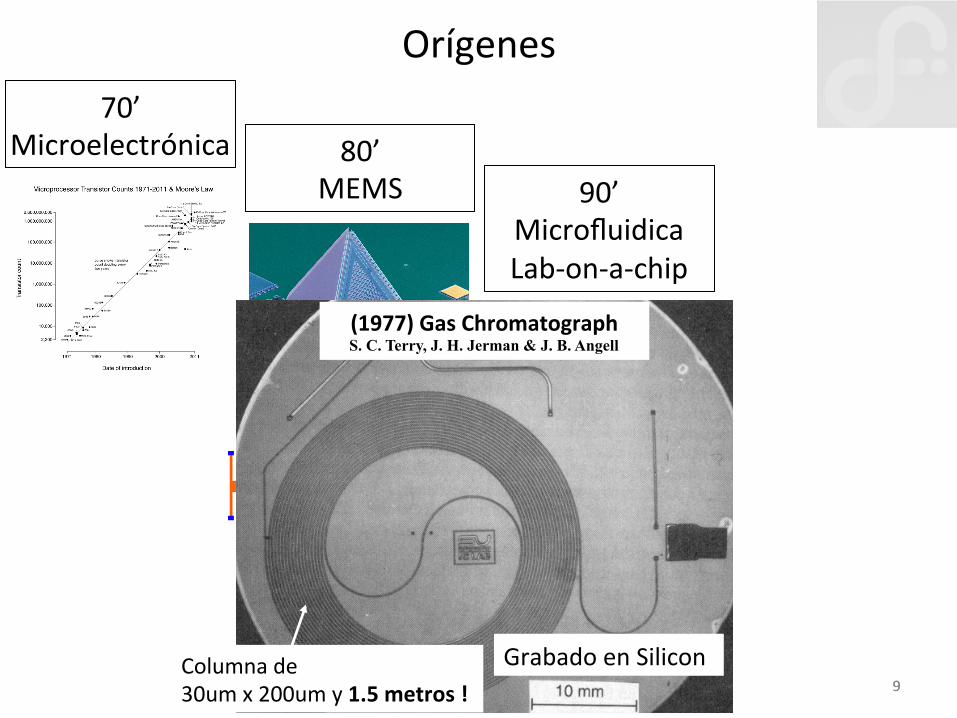
(1977) Gas Chromatograph S. C. Terry, J. H. Jerman & J. B. Angell
Columna de 30um x 200um y 1.5 metros !
Grabado en Silicon
10
90’ Microfluidica Lab-‐on-‐a-‐chip
10
Orígenes
80’ MEMS
70’ Microelectrónica
Figure 7.Scanning electron micrograph of the all-surface-micromachined “tent” microphone made at the MCNC foundry.
194 Bell Labs Technical Journal
determined by the size and tension of the membranebut by the tunable length of the beams. The assemblyis accomplished in one step by pulling upwards with amicropipette from the vertex as shown in Figure 8.Several self-assembly techniques have also been triedbut measurements have not yet been made on thesedevices. A sound pressure difference between theinterior and exterior of the chamber forces the mem-brane to move and the change in capacitance isdetected by a charge sensitive amplifier.
The main construction steps for the “tent” micro-phone are shown in Figure 8. Here one can see thatthe assembly requires the pulling of the apex up outof the plane and the pushing in from the two sidesto form the tetrahedron. Sealing of the hinge was
Poly 1 (P1) and Poly 2 (P2) layers are shown in magenta and blue, respectively. The active elementsare the P1 triangular plate and beams (visible below the P2 layer due to the conformal depositionprint trough) and the P2 grid on top, forming a capacitor whose electrodes are connected to bondpads via serpentine springs. The mechanical Q ( 2) is governed by the size and distribution of holesin the grid and the resonance frequency (19 kHz) by the mass of the P1 plate and stiffness of thethree beams.
Hinges
Figure 8.Main MEMS “tent” microphone construction steps.
Acelerómetros
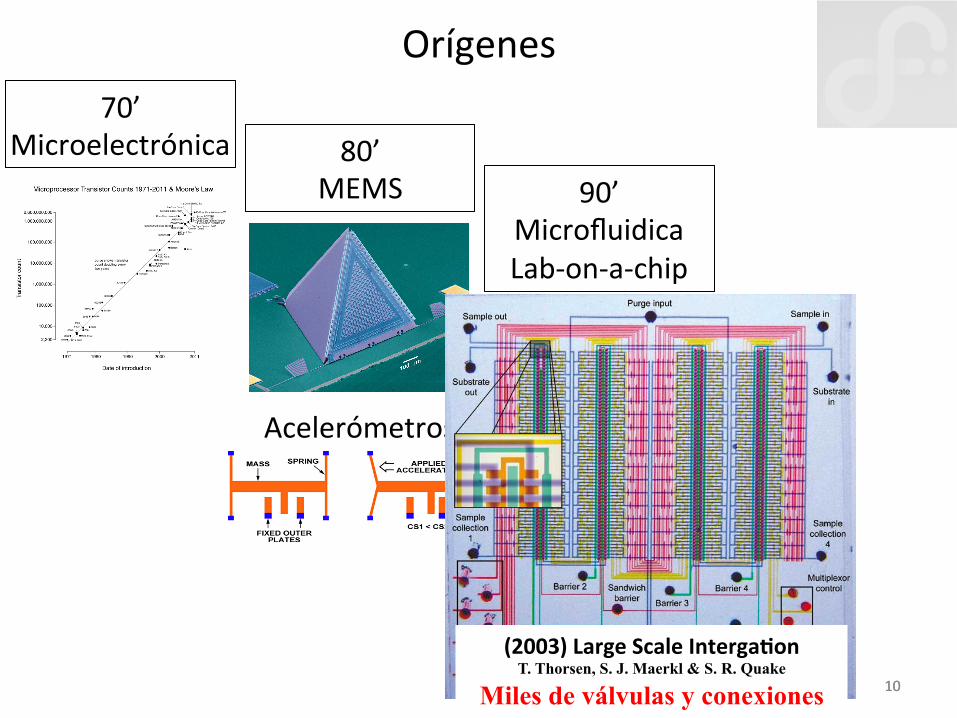
(2003) Large Scale IntergaGon T. Thorsen, S. J. Maerkl & S. R. Quake
Miles de válvulas y conexiones
11
90’ Microfluidica Lab-‐on-‐a-‐chip
11
Orígenes
80’ MEMS
70’ Microelectrónica
Figure 7.Scanning electron micrograph of the all-surface-micromachined “tent” microphone made at the MCNC foundry.
194 Bell Labs Technical Journal
determined by the size and tension of the membranebut by the tunable length of the beams. The assemblyis accomplished in one step by pulling upwards with amicropipette from the vertex as shown in Figure 8.Several self-assembly techniques have also been triedbut measurements have not yet been made on thesedevices. A sound pressure difference between theinterior and exterior of the chamber forces the mem-brane to move and the change in capacitance isdetected by a charge sensitive amplifier.
The main construction steps for the “tent” micro-phone are shown in Figure 8. Here one can see thatthe assembly requires the pulling of the apex up outof the plane and the pushing in from the two sidesto form the tetrahedron. Sealing of the hinge was
Poly 1 (P1) and Poly 2 (P2) layers are shown in magenta and blue, respectively. The active elementsare the P1 triangular plate and beams (visible below the P2 layer due to the conformal depositionprint trough) and the P2 grid on top, forming a capacitor whose electrodes are connected to bondpads via serpentine springs. The mechanical Q ( 2) is governed by the size and distribution of holesin the grid and the resonance frequency (19 kHz) by the mass of the P1 plate and stiffness of thethree beams.
Hinges
Figure 8.Main MEMS “tent” microphone construction steps.
Acelerómetros
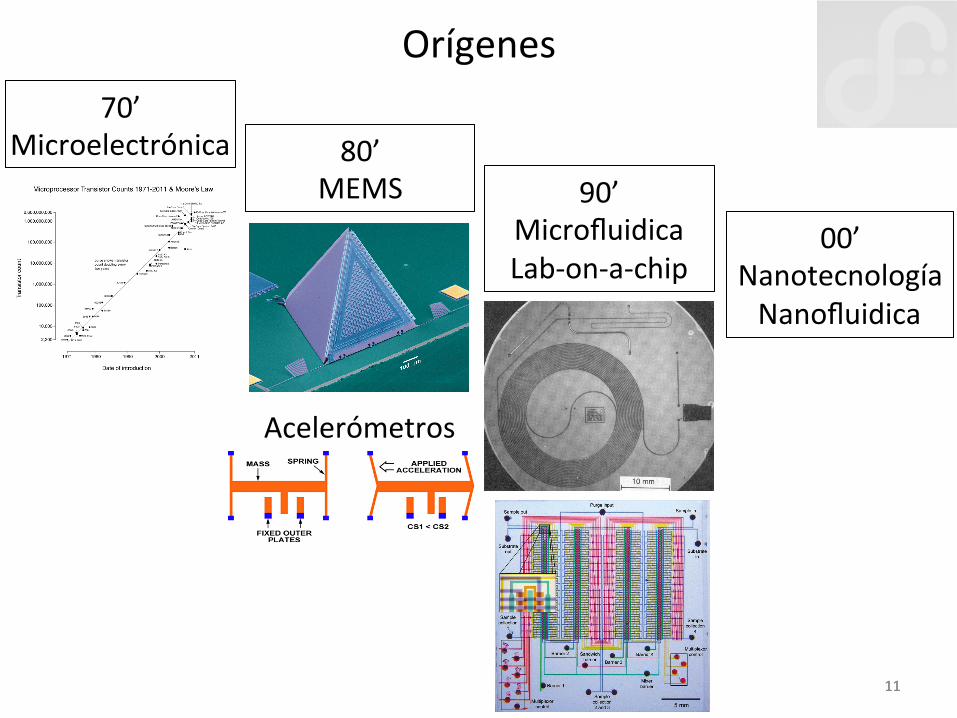
00’ Nanotecnología Nanofluidica
12
Historia Breve (e incompleta)
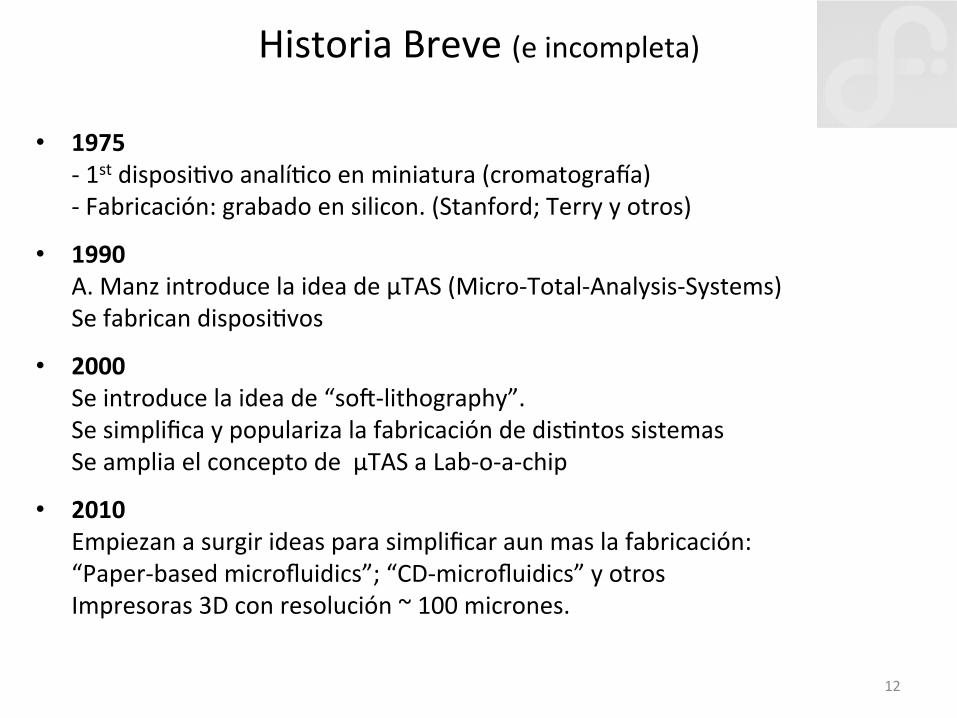
• 1975 -‐ 1st disposi8vo analí8co en miniatura (cromatograLa) -‐ Fabricación: grabado en silicon. (Stanford; Terry y otros)
• 1990 A. Manz introduce la idea de μTAS (Micro-‐Total-‐Analysis-‐Systems) Se fabrican disposi8vos
• 2000 Se introduce la idea de “sor-‐lithography”. Se simplifica y populariza la fabricación de dis8ntos sistemas Se amplia el concepto de μTAS a Lab-‐o-‐a-‐chip
• 2010 Empiezan a surgir ideas para simplificar aun mas la fabricación: “Paper-‐based microfluidics”; “CD-‐microfluidics” y otros Impresoras 3D con resolución ~ 100 micrones.
13
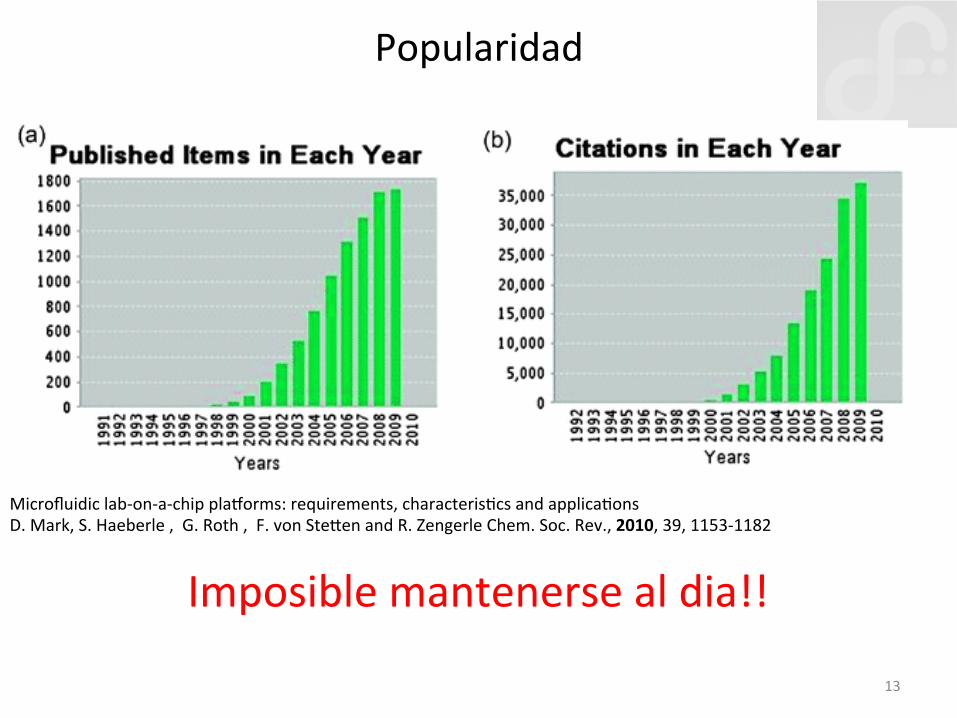
Popularidad
Imposible mantenerse al dia!!
Microfluidic lab-‐on-‐a-‐chip plavorms: requirements, characteris8cs and applica8ons D. Mark, S. Haeberle , G. Roth , F. von Stefen and R. Zengerle Chem. Soc. Rev., 2010, 39, 1153-‐1182
14
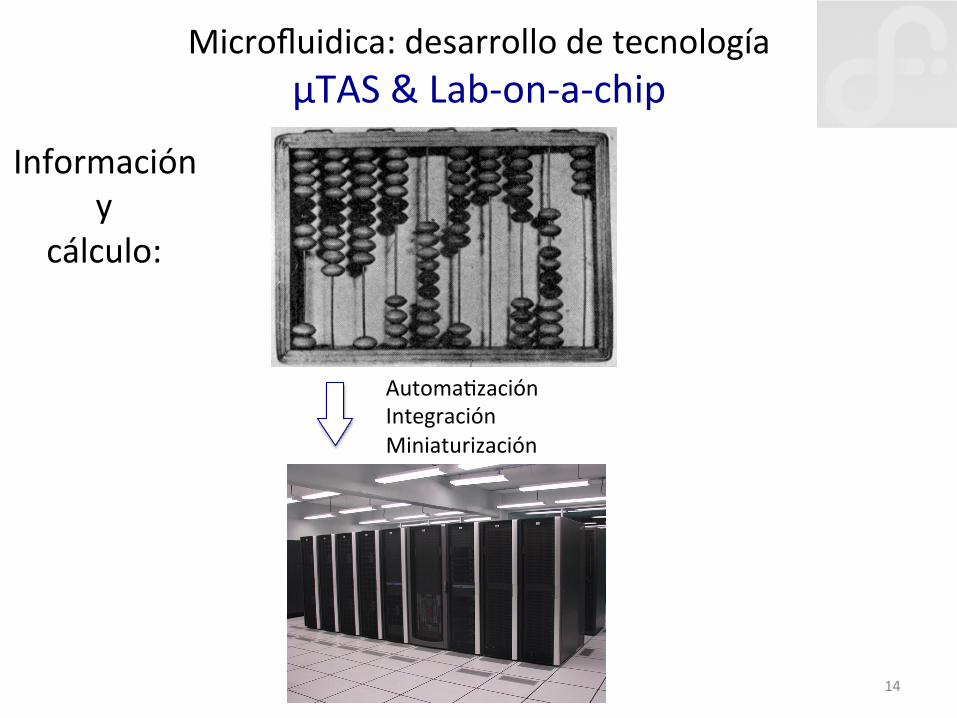
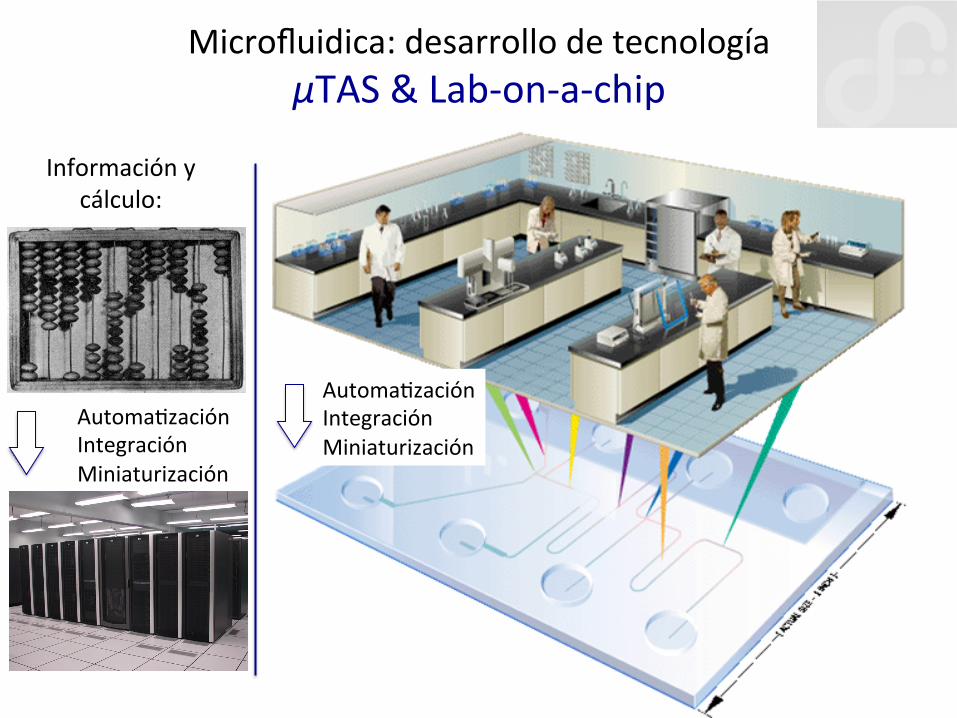
Microfluidica: desarrollo de tecnología μTAS & Lab-‐on-‐a-‐chip
Información y
cálculo:
Automa8zación Integración Miniaturización
15
Microfluidica: desarrollo de tecnología μTAS & Lab-‐on-‐a-‐chip Procesos y análisis químicos: Tubos de ensayo… Información y
cálculo:
Automa8zación Integración Miniaturización
Automa8zación Integración
Automa8zación Integración Miniaturización
16
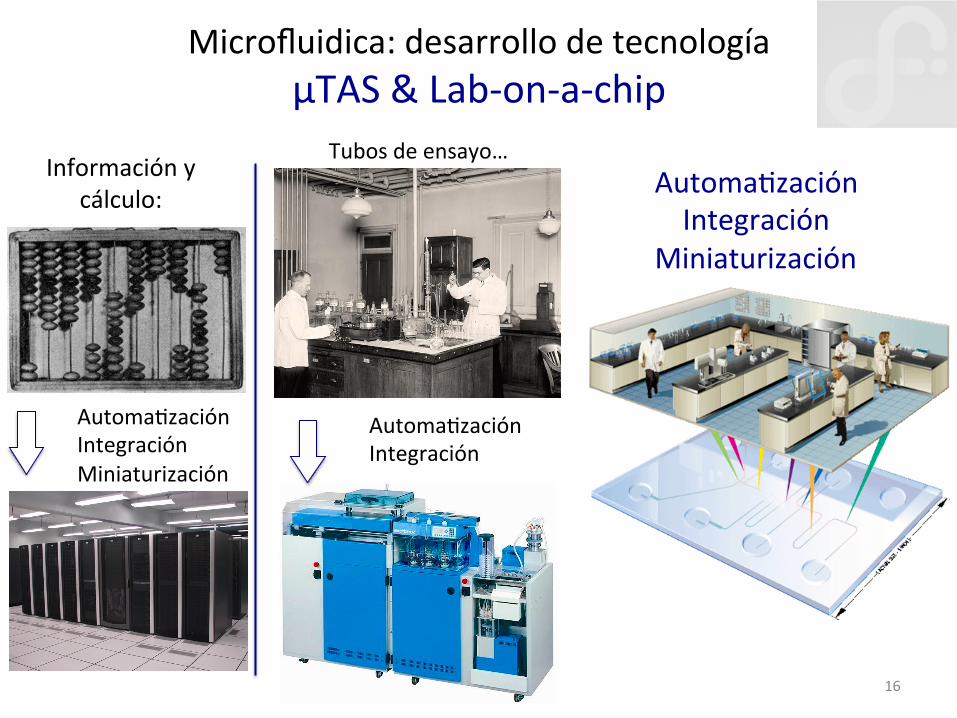
Microfluidica: desarrollo de tecnología μTAS & Lab-‐on-‐a-‐chip
Tubos de ensayo… Información y
cálculo:
Automa8zación Integración Miniaturización
Automa8zación Integración
Automa8zación Integración
Miniaturización
17
μTAS & Lab-‐on-‐a-‐chip Que ventajas 8ene?
más chico; más rápido; más simple, más economico, …mejor!!
• Portá8l • Menos volumen de químicos • Mayor seguridad • Reduce la contaminación • Bajo costo y producción masiva • Más rápido • Análisis en paralelo • Usos novedosos (implantes?) • Métodos novedosos ?
18
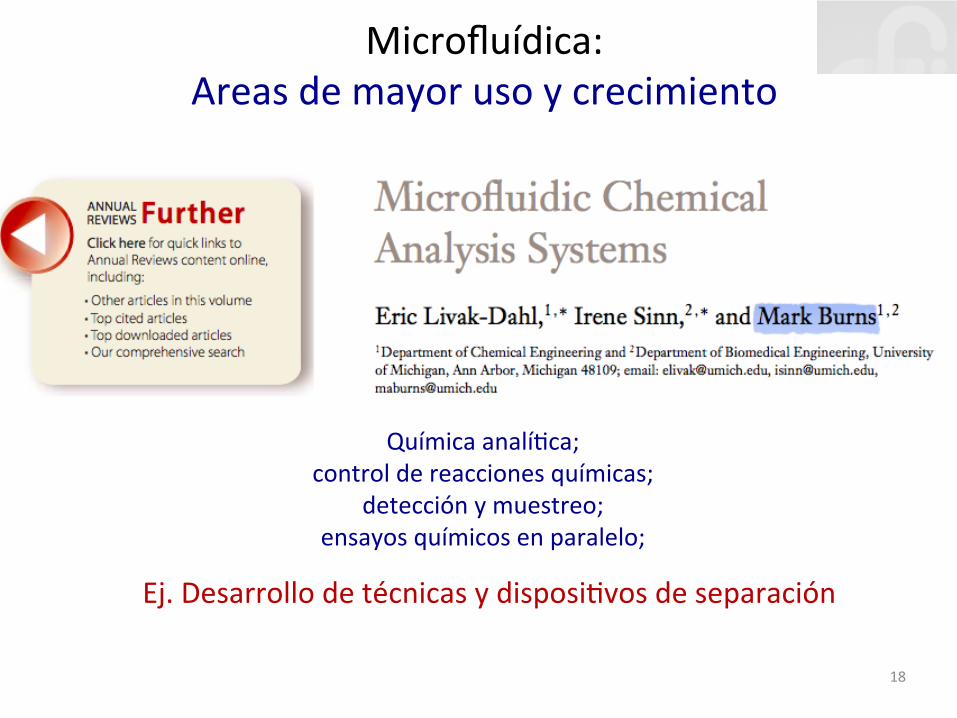
Microfluídica: Areas de mayor uso y crecimiento
Química analí8ca; control de reacciones químicas;
detección y muestreo; ensayos químicos en paralelo;
Ej. Desarrollo de técnicas y disposi8vos de separación
19
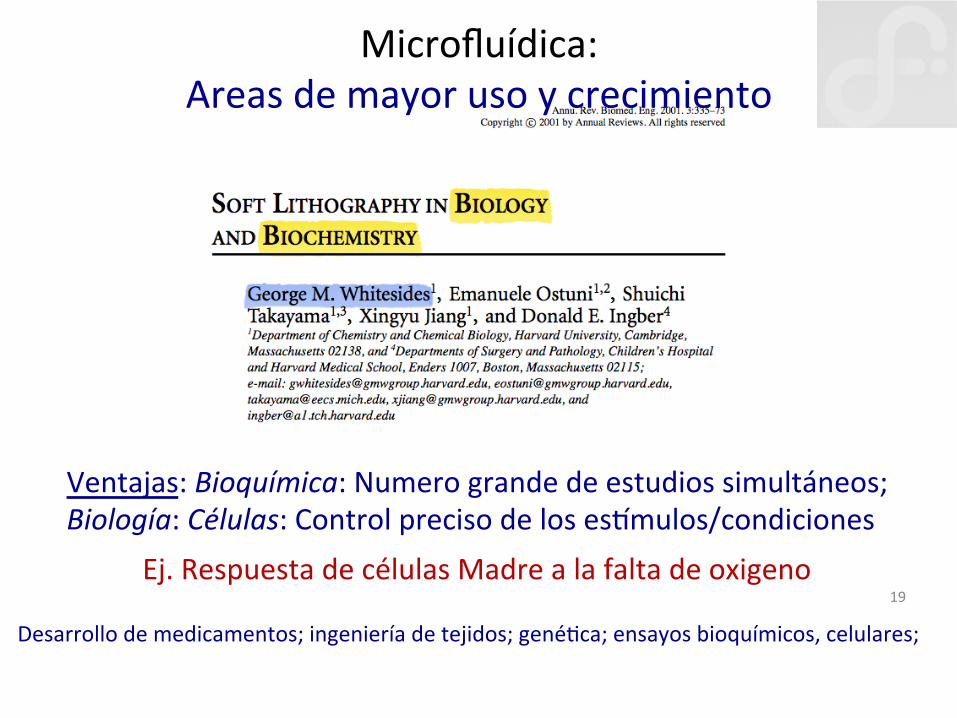
Microfluídica: Areas de mayor uso y crecimiento
Ej. Respuesta de células Madre a la falta de oxigeno
Ventajas: Bioquímica: Numero grande de estudios simultáneos; Biología: Células: Control preciso de los esbmulos/condiciones
Desarrollo de medicamentos; ingeniería de tejidos; gené8ca; ensayos bioquímicos, celulares;
20
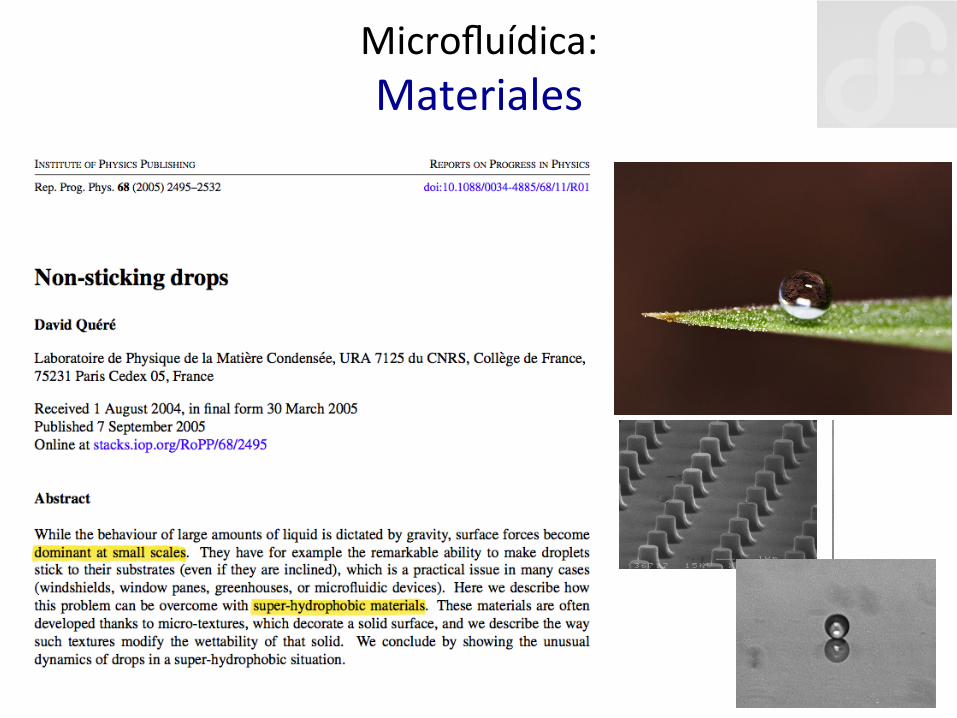
Microfluídica: Materiales
2508 D Quere
Figure 12. Substrate decorated with posts (the bar indicates 1 µm). If coated with a monolayer offluorinated silanes, this substrate is found to be super-hydrophobic [37].
Other important observations can be deduced from the Kao experiments: (a) Thehydrophilic and hydrophobic cases can be asymmetric—we see in figure 10 that the contactangle jumps to a much larger value as soon we enter the hydrophobic domain. (b) On the otherhand, the variation of the contact angle is continuous in the hydrophilic part, but two regimes(both linear) seem to be successively followed. (c) It is impossible to induce either a wettingtransition (!! = 0˚) or a drying one (!! = 180˚), thanks to roughness—the solid asperitiesenhance the natural trend of the material, but the wetting (or de-wetting) remains partial, evenif it is significantly improved in both cases.
3.1.2.3. Patterned surfaces. The super-hydrophobic effect can also be induced by using asurface of much smaller roughness, yet textured in an appropriate way. This was proved byBico et al in 1999 [37], using a silicon surface decorated with micrometric posts (figure 12).If this surface is treated with a fluorosilane, it is observed to be super-hydrophobic: the contactangle of water jumps from 110˚ (in the absence of the posts) to 160˚ (with the posts). Wealso note in figure 12 the reflection of the drop: the texture is quite dilute (5% of the surface isdecorated with posts), so that the silicon surface retains good reflection properties.
The surface in figure 12 can be seen as a simplified version of a natural surface as displayedin figure 8. It was confirmed by Oner and McCarthy that such geometric designs indeed havethe ability to generate a super-hydrophobic behaviour, whatever the shape or height of the posts(provided that they remain significantly smaller than the drop size) [38]. On the other hand,the same authors nicely showed that the shape of the post can affect the value of the recedingangle: roughly speaking, the smoother this shape (i.e. circular posts, rather than square ones),the smaller the contact angle hysteresis. The question of the size was also addressed: it wasfound that super-hydrophobic properties remain for post diameters as large as 100 µm [39]and as small as 100 nm [40].
As a promising variation on this theme, let us quote the case of assemblies of nanospheresdeposited from solutions on substrates and then self-organizing in a very regular way. Severalauthors proved that such substrates can also provide super-hydrophobicity [41–43]. In addition,for polystyrene spheres, an oxygen plasma etching reduces the size of the beads (keeping theirmutual distance constant), allowing us to change the resulting contact angle (typically between170˚ and 130˚, for increasing bead size).
We thus saw that both disordered and regular surfaces could generate super-hydrophobicity. In the last few years, many papers have presented ways of making suchmaterials, which could be classified according to the technique inducing roughness ortexture: spraying, dispersing, or simply depositing particles [8, 41–50], sol–gel techniques[51–53], plasma treatments (either deposition or etching) [54–66], drying a mixture
21
Microfluídica: Salud
Microfluidic systems can be designed to obtain and process measure-ments from small volumes of complex fluids with efficiency and speed, and without the need for an expert operator; this unique set of capabili-ties is precisely what is needed to create portable point-of-care (POC) medical diagnostic systems1,2. Fortunately for the microfluidics field, the military has always had a need to practise medicine in challenging and resource-limited environments, and so has long been trying to acquire robust medical technologies that add an absolute minimum to the bur-den of those people and machines transporting them. It was for this reason that microfluidics research in the United States was given a great boost in the 1990s by funding from the US Defense Advanced Research Projects Agency (DARPA). The technologies developed with DARPA’s support (for examples, see www.darpa.mil/MTO/mFlumes) have the characteristics needed for delivering appropriate medical diagnos-tics to the world’s poorest people. Today, the potential of microfluidic technologies to enhance the decentralization of medical testing is becoming accepted as one element in the next stage in the evolution of healthcare. Thanks to an upsurge in interest in (and funding of) health-care in the developing world, combined with a slow pace of change in the developed world, this new microfluidic diagnostic technology (MDT) may be adopted first for civilian healthcare in the developing world. Some initial steps towards designing appropriate microfluidic diagnostic systems are described here.
Overview of global health issuesIn recent decades, substantial progress has been made in public health, but this progress has not been equal in developed and devel-oping countries. The benefits and services that we in the West take for granted are often inadequate or lacking in many developing coun-tries3,4. For example, of the world’s population of 6.1 billion people, 3 billion lack basic sanitation, 2 billion do not have access to elec-tricity and more than 1 billion lack basic healthcare services and clean drinking water5,6. For every public health triumph such as the eradication of smallpox, other infectious diseases such as tubercu-losis and malaria have re-emerged, accompanied by new diseases such as HIV/AIDS (Fig. 1). More than half the deaths in the poorest countries are the result of infectious diseases (compared with less than 5% in the richest)7,8. Global health, poverty and development are interdependent. Endemic poverty is a significant impediment to improving health9. One billion, or half of the world’s children, live
Microfluidic diagnostic technologies for global public healthPaul Yager1, Thayne Edwards1, Elain Fu1, Kristen Helton1, Kjell Nelson1, Milton R. Tam2 & Bernhard H. Weigl3
The developing world does not have access to many of the best medical diagnostic technologies; they were designed for air-conditioned laboratories, refrigerated storage of chemicals, a constant supply of calibrators and reagents, stable electrical power, highly trained personnel and rapid transportation of samples. Microfluidic systems allow miniaturization and integration of complex functions, which could move sophisticated diagnostic tools out of the developed-world laboratory. These systems must be inexpensive, but also accurate, reliable, rugged and well suited to the medical and social contexts of the developing world.
1Department of Bioengineering, Box 355061, University of Washington, Seattle, Washington 98195, USA.27501 21st Avenue NE, Seattle, Washington 98115, USA. 3PATH (Program for Appropriate Technology in Health), 1455 NW Leary Way, Seattle, Washington 98107, USA.
in poverty. Health indicators for mothers, newborns and children in many of the poorest countries have remained the same or have even declined in recent years10.
Until recently, diagnostic tests were not routinely developed primarily for developing-country markets, although two exceptions are the Program for Appropriate Technology in Health (PATH) HealthTech initiative, discussed below, and Helen Lee’s diagnostics development programme at the University of Cambridge, UK. Led by the Bill & Melinda Gates Foundation, initial funding has been provided to search for innovative technologies and solutions, including development of new in vitro diagnostic tests and test platforms, for the world’s neglected diseases11. The US National Institute of Allergy and Infectious Disease is also funding an in vitro diagnostics development programme for biode-fence to address these issues12. Three additional initiatives that focus on the development of diagnostic tools are funded by the UK Department for International Development13, the Foundation for Innovative New Diagnostics, Geneva, Switzerland (www.finddiagnostics.org) and the Doris Duke Charitable Foundation (www.ddcf.org).
Figure 1 | Disability-adjusted life years (DALYs) for infectious and parasitic diseases. To properly reflect the full impact of a disease, disease burdens can be measured in DALYs by adding the years of life lost by a person’s premature death to the time lived with a disability. Infectious and parasitic diseases accounted for almost 30% of all DALYs and 15 million deaths each year worldwide. Shown are the infectious and parasitic diseases responsible for the DALYs in 2005 (figures from the US Centers for Disease Control and Prevention).
24%
23%17%
12%
6%
9%
3% 6%
Infectious disease DALYs
Lower respiratory infections
HIV/AIDS
Diarrhoeal diseases
Malaria
Measles
Tuberculosis
Pertussis
Others
412
INSIGHT REVIEW NATURE|Vol 442|27 July 2006|doi:10.1038/nature05064
Yager.indd 412Yager.indd 412 17/7/06 11:47:07 am17/7/06 11:47:07 am
Nature Publishing Group ©2006
22
Microfluídica: Medicina