Embed Size (px)
Citation preview
7/21/2019 Intro to Aspen Plus Simulation Part 1
http://slidepdf.com/reader/full/intro-to-aspen-plus-simulation-part-1 1/3
INTRODUCTION TO ASPEN PLUS SIMULATION
What is Process Simulation Analysis
The purpose of analysis/simulation is to model and predict the performance of a process. It involves the
decomposition of the process into its constituent elements (e.g. units) for individual study of performance. The process characteristics (e.g. flowrates, compositions, temperatures, pressures,
properties, equipment sizes, etc.) are predicted using analysis techniques. These techniques includemathematical models, empirical correlations and computer-aided process simulation tools (e.g. ASPEN
Plus). In addition, process analysis may involve the use of experimental means to predict and validate
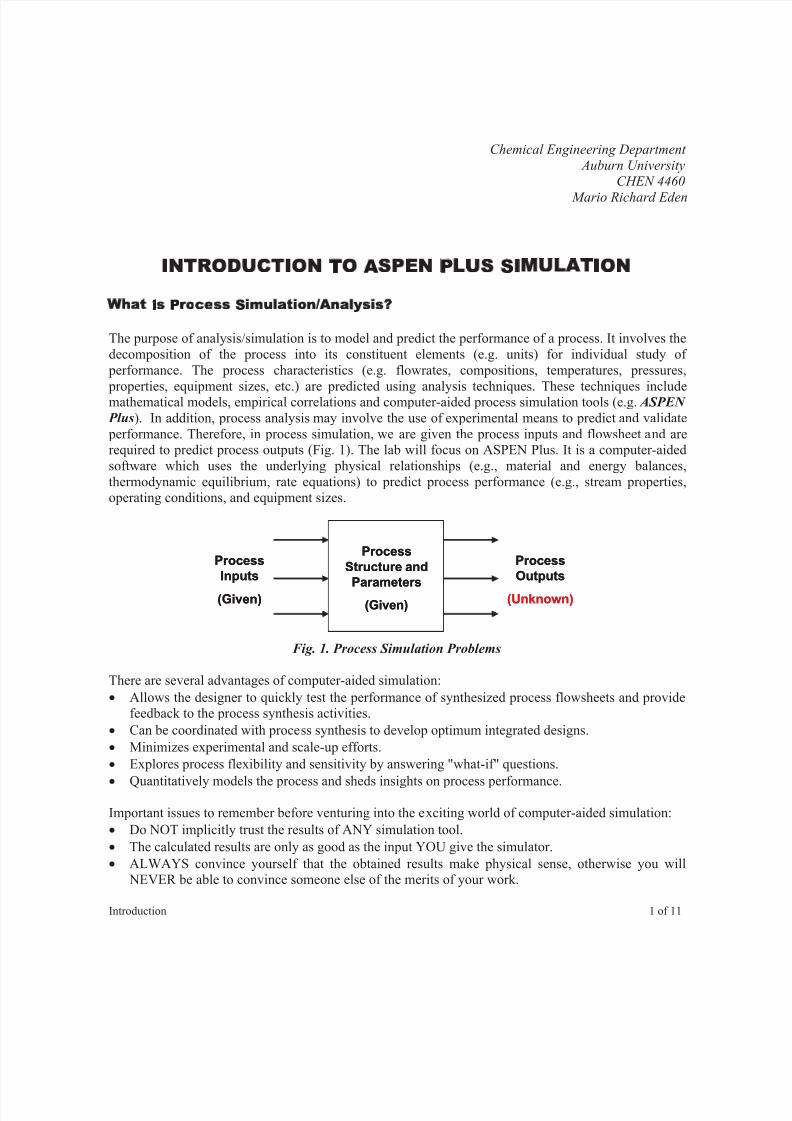
performance. Therefore, in process simulation, we are given the process inputs and flowsheet and arerequired to predict process outputs (Fig. 1). The lab will focus on ASPEN Plus. It is a computer-aided
software which uses the underlying physical relationships (e.g., material and energy balances,
thermodynamic equilibrium, rate equations) to predict process performance (e.g., stream properties,operating conditions, and equipment sizes.
Process
Structure and
Parameters
(Given)
Process
Inputs
(Given)
Process
Outputs
(Unknown)
Process
Structure and
Parameters
(Given)
Process
Inputs
(Given)
Process
Outputs
(Unknown)
Fig. 1. Process Simulation Problems
There are several advantages of computer-aided simulation:
Allows the designer to quickly test the performance of synthesized process flowsheets and providefeedback to the process synthesis activities.
Can be coordinated with process synthesis to develop optimum integrated designs.
Minimizes experimental and scale-up efforts.
Explores process flexibility and sensitivity by answering "what-if" questions.
Quantitatively models the process and sheds insights on process performance.
Important issues to remember before venturing into the exciting world of computer-aided simulation:
Do NOT implicitly trust the results of ANY simulation tool.
The calculated results are only as good as the input YOU give the simulator.
ALWAYS convince yourself that the obtained results make physical sense, otherwise you will
NEVER be able to convince someone else of the merits of your work.
Introduction 1 of 11

7/21/2019 Intro to Aspen Plus Simulation Part 1
http://slidepdf.com/reader/full/intro-to-aspen-plus-simulation-part-1 2/3
Basic Information on ASPEN PLUS and Its Graphical Operations
I. How Do I Start It?
From the Windows Start menu, select Programs then ASPEN Tech, then ASPEN Engineering Suite,
then ASPEN Plus 12.1, then ASPEN Plus user interface (Fig. 2).
Fig. 2. Starting ASPEN Plus
Next, you will have the option of opening an existing file, using an existing template or starting a blanksimulation. Choose a blank simulation (Fig. 3).
Fig. 3. Starting a Simulation
Introduction 2 of 11

7/21/2019 Intro to Aspen Plus Simulation Part 1
http://slidepdf.com/reader/full/intro-to-aspen-plus-simulation-part-1 3/3
ASPEN Plus will display the User Interface (Fig. 4). Features of the User Interface:
Menus: are used to specify program options and commands
Toolbar allows direct access to commonly-used functions
Data Browser: is used to navigate folders, forms, and sheets.
Sheets make up forms and forms make up folders (a sheet in a form in a folder).
Folders are the root items in the Data browser.
Forms: are located in folders and are used to enter data and view simulation results.
Sheets: are contained in folders and are selected using tabs at the top of each sheet.
II. Mouse Functions:
: Select object/field
: Bring up a menu for a selected object/field
: Open Data Browser object sheet.
Run ID
Setup
Button
Status
Area
Menu Bar
Data
Browser
Select
Mode
ButtonModel
Library
Model
Menu
Tabs
Process Flowsheet Window
(Working Area where you will draw your flowsheet)
Title Bar Next Button
Fig. 4. The User Interface
Introduction 3 of 11