Embed Size (px)
Citation preview

Automated Corridors 1
INTERSTATE 80 PLANNING STUDY (PEL)
Automated Corridors Office of Location and Environment | June 2017

Table of Contents Executive Summary ...................................................................................................................................... 4 Introduction.................................................................................................................................................... 6 Study Purpose and Approach ....................................................................................................................... 6 Scenario Planning ....................................................................................................................................... 10 Traffic Capacity Analysis / Quality of Service ............................................................................................. 12 Safety Analysis ............................................................................................................................................ 14 Travel Time Reliability ................................................................................................................................. 16 Future-Proofing ........................................................................................................................................... 18 Conclusions ................................................................................................................................................. 19 Design Recommendations .......................................................................................................................... 22 Glossary ...................................................................................................................................................... 23 References .................................................................................................................................................. 25 Appendix A – Existing Automated Vehicle Initiatives .................................................................................. A1 Appendix B – Literature Synthesis .............................................................................................................. B1 Appendix C – Traffic Capacity Methodology and Results .......................................................................... C1 Appendix D – Corridor Safety Methodology and Results .......................................................................... D1 Appendix E – Corridor Reliability Methodology and Results ...................................................................... E1 Appendix F – Future Proofing and Design Considerations ......................................................................... F1
Figures Figure 1. Interstate 80 Planning Study – Study Area Map ............................................................................ 6 Figure 2. Levels of Automation ..................................................................................................................... 7 Figure 3. Automated Vehicle Technology ..................................................................................................... 9 Figure 4. Scenario Planning ........................................................................................................................ 10 Figure 5. Automated Vehicle Adoption ....................................................................................................... 10 Figure 6. Scenarios ..................................................................................................................................... 11 Figure 7. Automated Vehicle Platooning Scenario ..................................................................................... 12 Figure 8. Roadway Capacity versus Automated Vehicle Capacity ............................................................. 13 Figure 9. AV Safety Technologies .............................................................................................................. 14 Figure 10. Safety Analysis Results ............................................................................................................. 15 Figure 11. Travel Time Reliability Results .................................................................................................. 17 Figure 12. Original Interstate 80 Widening Concept ................................................................................... 18 Figure 13. Preferred Interstate 80 Widening Concept with Automated Vehicle Findings ........................... 18 Figure 14. Interstate 80 Automated Corridors Study Results ..................................................................... 20 Figure B.1. Forecast of Automated Vehicle Penetration Rates from 2020 to 2060 .................................... B3
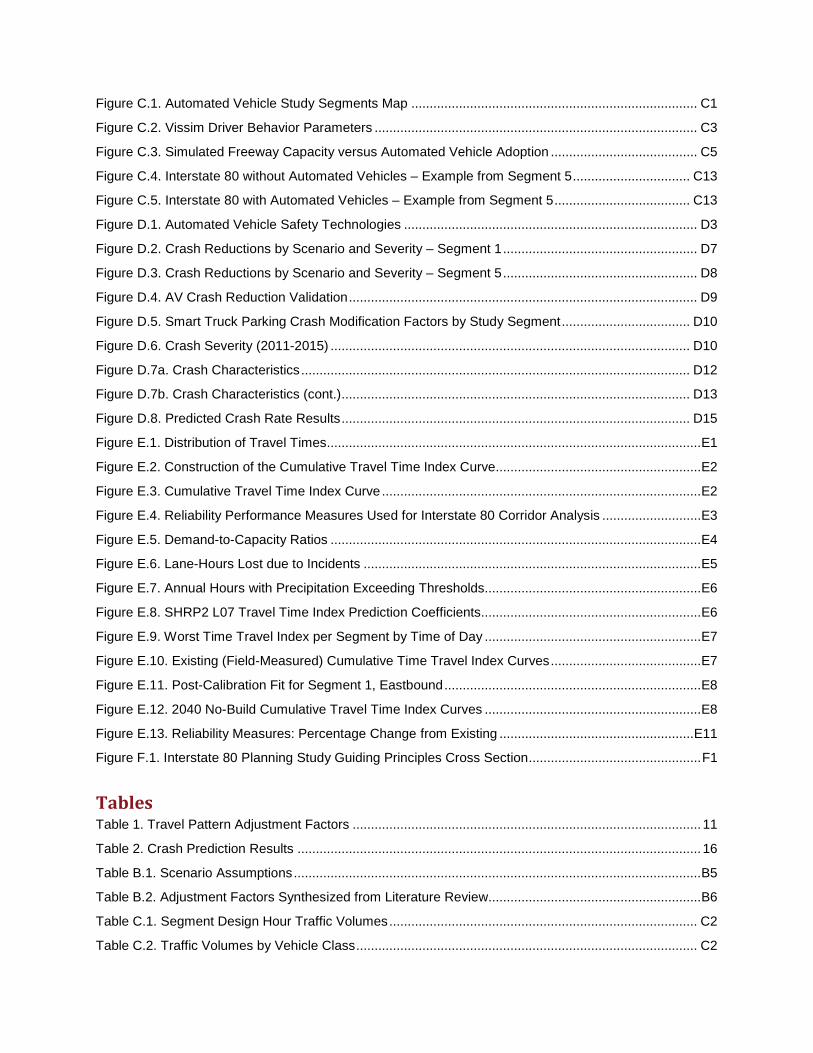
Figure C.1. Automated Vehicle Study Segments Map .............................................................................. C1 Figure C.2. Vissim Driver Behavior Parameters ........................................................................................ C3 Figure C.3. Simulated Freeway Capacity versus Automated Vehicle Adoption ........................................ C5 Figure C.4. Interstate 80 without Automated Vehicles – Example from Segment 5 ................................ C13 Figure C.5. Interstate 80 with Automated Vehicles – Example from Segment 5 ..................................... C13 Figure D.1. Automated Vehicle Safety Technologies ................................................................................ D3 Figure D.2. Crash Reductions by Scenario and Severity – Segment 1 ..................................................... D7 Figure D.3. Crash Reductions by Scenario and Severity – Segment 5 ..................................................... D8 Figure D.4. AV Crash Reduction Validation ............................................................................................... D9 Figure D.5. Smart Truck Parking Crash Modification Factors by Study Segment ................................... D10 Figure D.6. Crash Severity (2011-2015) .................................................................................................. D10 Figure D.7a. Crash Characteristics .......................................................................................................... D12 Figure D.7b. Crash Characteristics (cont.) ............................................................................................... D13 Figure D.8. Predicted Crash Rate Results ............................................................................................... D15 Figure E.1. Distribution of Travel Times ...................................................................................................... E1 Figure E.2. Construction of the Cumulative Travel Time Index Curve........................................................ E2 Figure E.3. Cumulative Travel Time Index Curve ....................................................................................... E2 Figure E.4. Reliability Performance Measures Used for Interstate 80 Corridor Analysis ........................... E3 Figure E.5. Demand-to-Capacity Ratios ..................................................................................................... E4 Figure E.6. Lane-Hours Lost due to Incidents ............................................................................................ E5 Figure E.7. Annual Hours with Precipitation Exceeding Thresholds........................................................... E6 Figure E.8. SHRP2 L07 Travel Time Index Prediction Coefficients............................................................ E6 Figure E.9. Worst Time Travel Index per Segment by Time of Day ........................................................... E7 Figure E.10. Existing (Field-Measured) Cumulative Time Travel Index Curves ......................................... E7 Figure E.11. Post-Calibration Fit for Segment 1, Eastbound ...................................................................... E8 Figure E.12. 2040 No-Build Cumulative Travel Time Index Curves ........................................................... E8 Figure E.13. Reliability Measures: Percentage Change from Existing ..................................................... E11 Figure F.1. Interstate 80 Planning Study Guiding Principles Cross Section ............................................... F1
Tables Table 1. Travel Pattern Adjustment Factors ............................................................................................... 11 Table 2. Crash Prediction Results .............................................................................................................. 16 Table B.1. Scenario Assumptions ............................................................................................................... B5 Table B.2. Adjustment Factors Synthesized from Literature Review.......................................................... B6 Table C.1. Segment Design Hour Traffic Volumes .................................................................................... C2 Table C.2. Traffic Volumes by Vehicle Class ............................................................................................. C2

Table C.3. Traffic Capacity Increase .......................................................................................................... C5 Table C.4. Summary of Segment Results – Segment 1 .......................................................................... C11 Table C.5. Summary of Segment Results – Segment 2 .......................................................................... C11 Table C.6. Summary of Segment Results – Segment 3 .......................................................................... C12 Table C.7. Summary of Segment Results – Segment 4 .......................................................................... C12 Table C.8. Summary of Segment Results – Segment 5 .......................................................................... C14 Table D.1. Mapping of Rural Freeway Pre-Crash Scenarios to Safety Technologies based on 2013 General Estimates System......................................................................................................................... D4 Table D.2. Effectiveness Assumptions of Safety Applications in Three Scenarios ................................... D5 Table D.3. Crash Mapping ......................................................................................................................... D6 Table D.4 Resulting Crash Modification Factors by Scenario for Each Segment ..................................... D7 Table D.5. Predicted Crash Results ......................................................................................................... D14 Table E.1. Proportions Used for Non-crash Incidents ............................................................................... E4 Table E.2. Reliability Performance Measures – Existing vs. No-Build ....................................................... E9 Table E.3. Reliability Performance Measures All Scenarios ..................................................................... E10 Table F.1. Lane Use Sensitivity Test - Segment 5 – Eastbound Only ........................................................ F6 Table F.2. Grade Sensitivity Test - Segment 5 – Eastbound Only ............................................................. F7
Office of Location and Environment Automated Corridors
June 2017
Automated Corridors 4
Executive Summary The Iowa Department of Transportation (DOT) is conducting a planning study of the rural portions of the Interstate 80 corridor to best address safety and mobility needs of all freight and passenger travelers (Planning Study). This study is being conducted using the federally adopted Planning and Environmental Linkage (PEL) Study process. The Planning Study will allow near-term improvements to be planned, designed, and as funding is available, constructed in accordance with the long-term plan. As part of the Planning Study, an Automated Corridors study was conducted. The goals of the Interstate 80 Automated Corridors Study include:
• Leverage existing automated vehicle (AV) knowledge • Help understand AVs and other transformative shifts in transportation • Prepare for AV impacts on safety, mobility and travel time reliability in Iowa • Plan for the future by considering the impact of AVs in the design of the proposed improvements
The guiding principles for the Planning Study include balancing mobility and access, designing for future needs, and right-sizing the corridor. These principles are the key reasons for the Interstate 80 Automated Corridors Study. Iowa envisions the future where advanced technologies make travelers safer and the transportation system more efficient and reliable. AVs are the primary technology to deliver these benefits.
As part of their vision, Iowa DOT will build smart corridors with communication and sensing technology to enable AVs to deliver increased safety and mobility benefits to travelers. AVs are vehicles enabled with technology that allow vehicles to control parts of the driving task, under a range of circumstances. This study employs the Society of Automotive Engineers definitions of the scale of vehicle automation from level zero to five (see Figure 2). Benefits include:
• Reducing the number of crashes related to human factors and weather • Making significant improvements to highway capacity without the need for additional construction • Reducing aggressive driving • Improving travel efficiency and reliability • Improving mobility to disabled and senior citizens • Improving fuel efficiency through vehicle drafting
A needs analysis was conducted to account for AVs in the future Interstate 80 design. The study approach was driven by a set of conclusions and recommendations that were developed acknowledging the uncertainty involved with technology advancements and market adoption. This study considered multiple future scenarios (see Figure 5).Three primary factors were considered as part of the needs analysis; quality of peak traffic service, traffic safety and travel time reliability.
The study approach used a three-step method of scenario planning, scenario analysis and future-proofing. Scenario planning considered the range of possible futures and how likely trends may affect future transportation operations. From the scenario planning stage, four scenarios were advanced to scenario analysis: Early AV Adoption, Rise of the AVs, Limited AV Adoption, and AV Domination.

Office of Location and Environment Automated Corridors
June 2017
Automated Corridors 5
The analysis of each scenario informed the project team of the range of future design needs. Future-Proofing provided flexibility in the proposed design features, resulting in enhanced adaptability to future trends including AVs.
Conclusions were reached about how Interstate 80 might operate in the future at certain levels of AV adoption. Each of these findings will help Iowa DOT shape future agency policy and practices on how to deal with emerging AV technologies. Key to the study is several recommendations regarding Interstate 80 design and an additional study that should be completed to prepare Iowa DOT for AVs.
Key findings were identified for each topic area and provide Iowa DOT data that can be shared with others within the agency to lead to organizational awareness and impact policies related to AVs. Key findings for each topic area include:
Scenario Planning • AVs will serve as the primary vehicle type in the future. Design projects need to consider how
current design practices might change to accommodate future trends including AVs. • AVs are projected to substantially increase traffic demand. Traditional planning studies should
include scenarios that examine the sensitivity of increased demand and its impact on corridor needs.
Traffic Capacity/Quality of Service Analysis • Near-term analysis of AV adoption shows AVs in mixed traffic at lower levels of AV adoption do
not show a decrease in segment average travel speeds. • Mobility needs across most of Interstate 80 in the future will warrant six to eight lanes. Higher
levels of automation show a substantial increase in the efficiency of Interstate 80 to carry higher traffic volumes.
Safety Analysis • The safety analysis indicated that AVs are capable of preventing the majority of car crashes that
occur on Interstate 80 today. The number of crashes per mile will decrease by 59% and the number of fatal and major injury crashes will decrease by 50% by 2040 assuming high levels of AV use. These crash reductions would happen even with traffic volume doubling.
Travel Time Reliability Analysis • Without AVs and without widening Interstate 80, travelers will experience slightly longer delays in
traffic. • With AVs and after widening Interstate 80, travelers will experience more days without a
slowdown. Future-Proofing
• Future uncertainty needs to be considered in the design of Interstate 80 to provide flexibility to operate under the full range of options identified in the scenario planning process.
A primary need of the overall Interstate 80 Planning Study is to identify the future needs of Interstate 80. The detailed analysis found in the Interstate 80 Automated Corridors Study generated a list of recommended changes to the Interstate 80 design to provide enhanced flexibility in the future.
Office of Location and Environment Automated Corridors
June 2017
Automated Corridors 6
Introduction Technology is changing the world around us, including transportation. In the last decade, automakers have started outfitting vehicles with driver assistance devices and sensors that allow newer vehicles to alert drivers to unseen hazards and perform basic functions, such as parallel parking. The same automakers have begun partnering with tech companies at a rapid pace and these joint ventures have publicly announced vehicles with the next level of automation being sold within the next 5 years. As the technology and transportation sectors merge and automated vehicles (AVs) become a reality on Iowa roadways, Iowa Department of Transportation (DOT) needs to consider what a future interstate across Iowa looks like. To better understand the impact of future technology and plan for the future, Iowa DOT has conducted this Interstate 80 Automated Corridors Study as a component of a broader Interstate 80 Planning Study. The goals of the Interstate 80 Automated Corridors Study include:
• Leverage existing AV knowledge • Help understand AVs and other transformative shifts in transportation • Prepare for AV impacts on safety, mobility and reliability in Iowa • Consider the impact of AVs on the future Interstate 80 design criteria.
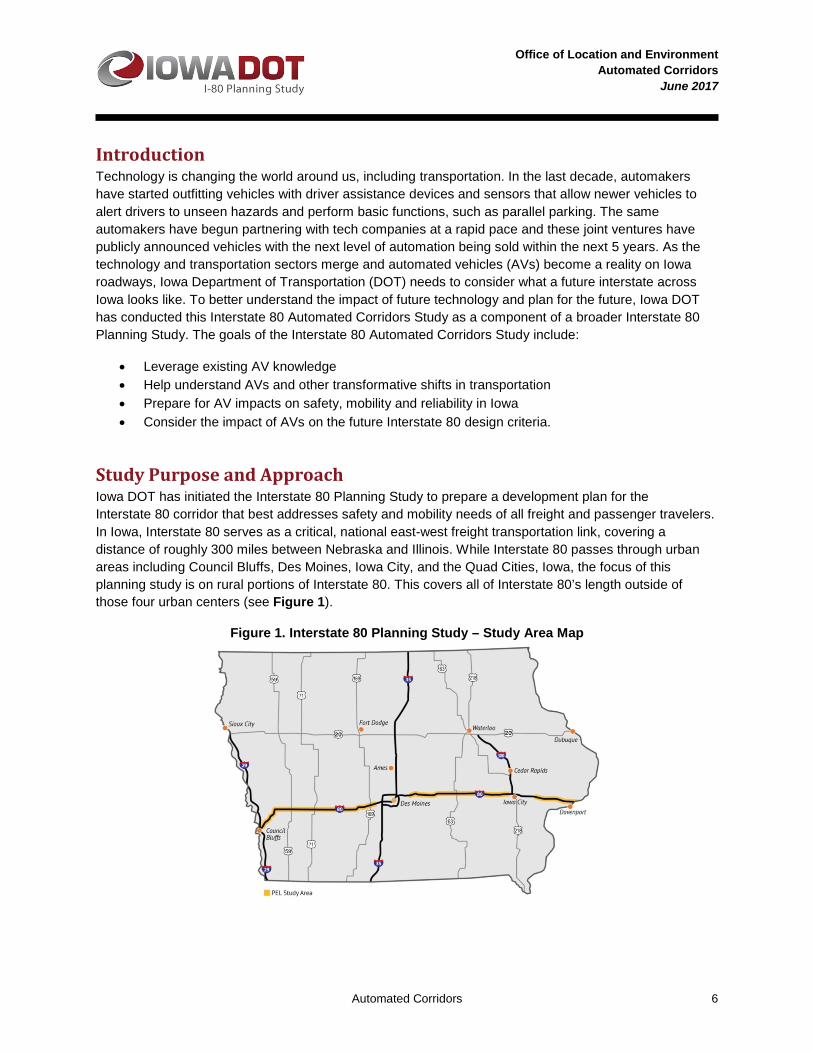
Study Purpose and Approach Iowa DOT has initiated the Interstate 80 Planning Study to prepare a development plan for the Interstate 80 corridor that best addresses safety and mobility needs of all freight and passenger travelers. In Iowa, Interstate 80 serves as a critical, national east-west freight transportation link, covering a distance of roughly 300 miles between Nebraska and Illinois. While Interstate 80 passes through urban areas including Council Bluffs, Des Moines, Iowa City, and the Quad Cities, Iowa, the focus of this planning study is on rural portions of Interstate 80. This covers all of Interstate 80’s length outside of those four urban centers (see Figure 1).
Figure 1. Interstate 80 Planning Study – Study Area Map
Office of Location and Environment Automated Corridors
June 2017
Automated Corridors 7
Along the study area, Interstate 80 faces safety and mobility challenges, including: • Vehicle crashes and fatalities • Growth in freight and passenger vehicle trips causing increasing congestion • Aging pavement and bridges • Adverse weather
The guiding principles for the Interstate 80 Planning Study include balancing mobility and access, designing for future needs and right-sizing the corridor. These principles are the key reasons for the Interstate 80 Automated Corridors Study. Iowa has a vision in which advanced technologies make travelers safer and the transportation system more reliable. The AV is the primary technology poised to deliver these safety and mobility benefits.
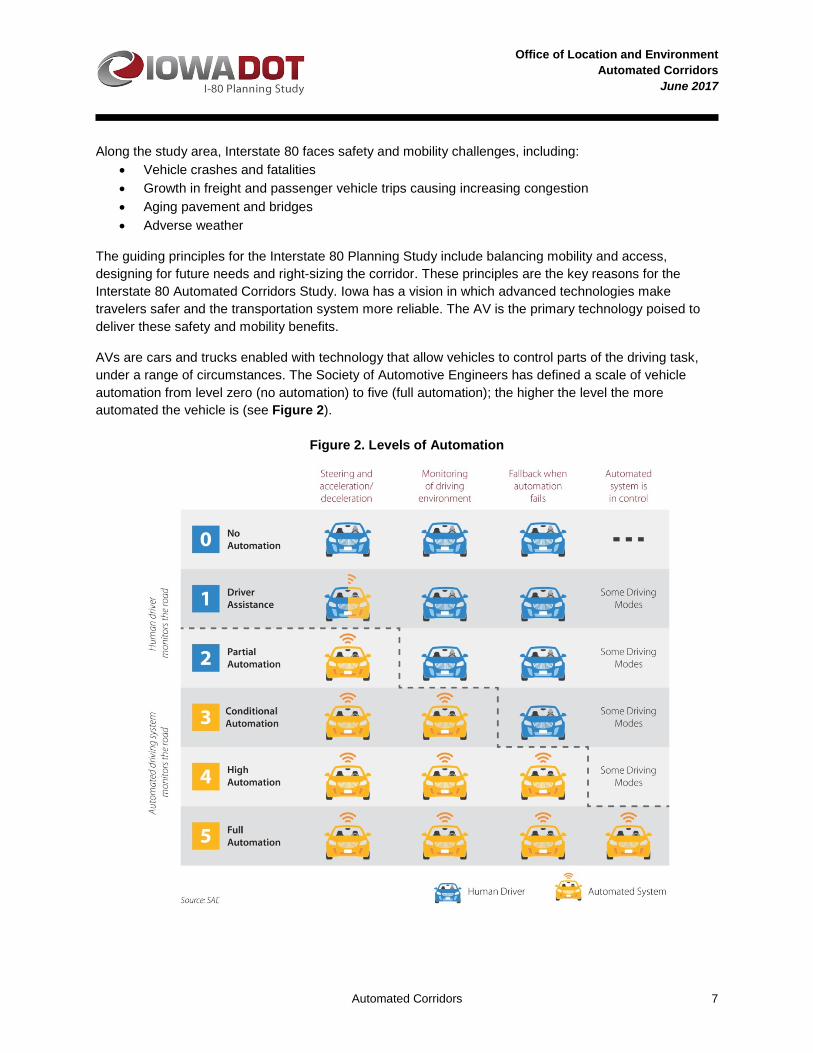
AVs are cars and trucks enabled with technology that allow vehicles to control parts of the driving task, under a range of circumstances. The Society of Automotive Engineers has defined a scale of vehicle automation from level zero (no automation) to five (full automation); the higher the level the more automated the vehicle is (see Figure 2).
Figure 2. Levels of Automation

Office of Location and Environment Automated Corridors
June 2017
Automated Corridors 8
Level zero (no automation) means the driver has 100% control at all times. Level one (driver assistance) is when the vehicle helps the driver out with single tasks, such as an automatic indicator light for blind spot warning. Level two (partial automation) takes it one step further. In this level, features such as Adaptive Cruise Control, which is the automatic adjustment of speed to maintain a safe distance from the vehicles ahead, or Forward Collision Warning (FCW), the use of optical or other technologies to detect a potential upcoming crash, are used. The vehicle is making some adjustments and helping drive, but there are functions that the vehicle cannot handle without driver involvement and if trouble arises, it is the driver’s responsibility to take over control of the vehicle.
The Tesla Model S is a good example of the limited level three (conditional automation) vehicles that are on the road today. In this level, the driver gives control to the vehicle in certain circumstances. It would be the driver’s job to take control of the vehicle, if needed, like in the case of inclement weather.
Level four (high automation) is designed to perform all driving functions and monitor conditions of the road, the majority of the time. In this level, the driver will occasionally need to take over control of the vehicle, but most of the time on the interstate system the car will do the work for the driver.
Finally, in level five (full automation) all one needs to do is buckle up, give the vehicle a destination, and the vehicle will handle the rest of the driving. An automated microtransit shuttle or the Google Waymo vehicle are examples of full automation.
Though many level four and level five technologies today are tested in highly constrained, low speed environments, the longer term vision of this technology is that high or full automation vehicles will be able to operate in mixed traffic on freeway’s within the next decade. For that reason, this study considered the future users of Interstate 80 to be a mix of manual drivers (who might use some low level automation features) and upper level AVs (future versions of Level three, four, and five automation).
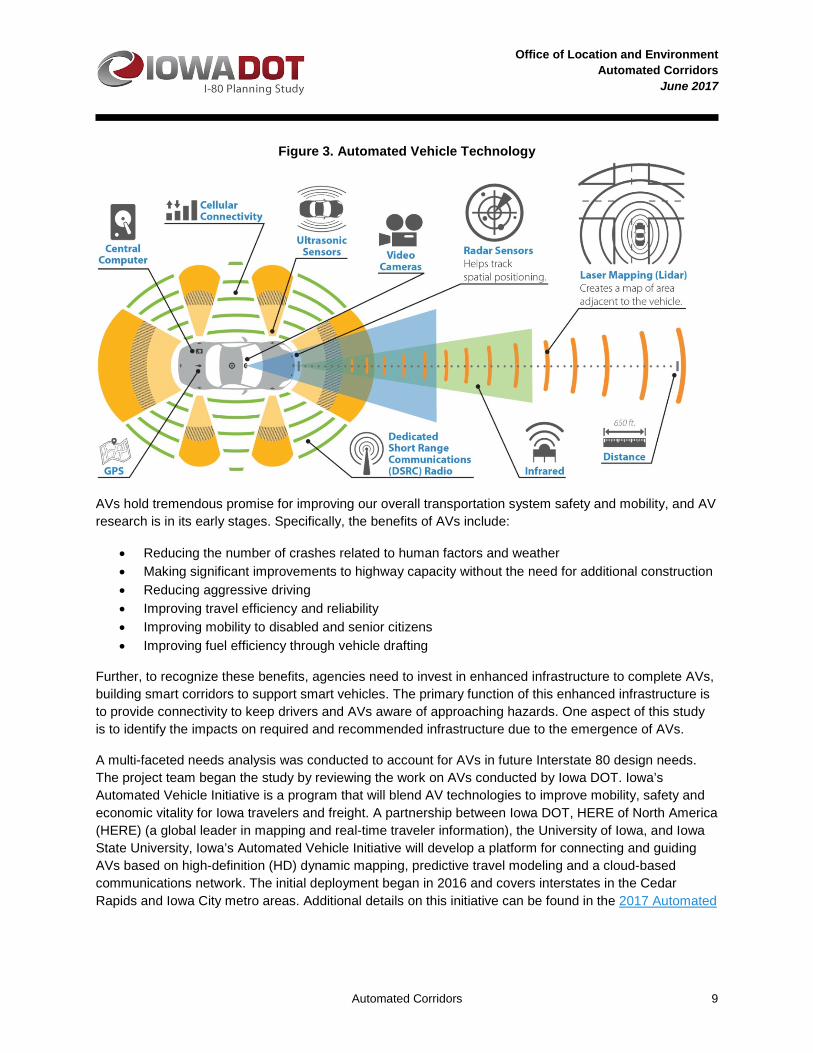
A vehicle that drives itself relies heavily on technologies that monitor the driving environment for obstacles, anticipate and quickly react to potential conflicts with nearby vehicles, pedestrians, and other objects, and are capable of controlling vehicle acceleration, braking and steering. Additionally, AVs utilize internal sensors, connectivity to the internet, global positioning systems (GPS), and communications with other vehicles and surrounding infrastructure to create a greater awareness of the vehicles surroundings (illustrated in Figure 3).
Office of Location and Environment Automated Corridors
June 2017
Automated Corridors 9
Figure 3. Automated Vehicle Technology
AVs hold tremendous promise for improving our overall transportation system safety and mobility, and AV research is in its early stages. Specifically, the benefits of AVs include:
• Reducing the number of crashes related to human factors and weather • Making significant improvements to highway capacity without the need for additional construction • Reducing aggressive driving • Improving travel efficiency and reliability • Improving mobility to disabled and senior citizens • Improving fuel efficiency through vehicle drafting
Further, to recognize these benefits, agencies need to invest in enhanced infrastructure to complete AVs, building smart corridors to support smart vehicles. The primary function of this enhanced infrastructure is to provide connectivity to keep drivers and AVs aware of approaching hazards. One aspect of this study is to identify the impacts on required and recommended infrastructure due to the emergence of AVs.
A multi-faceted needs analysis was conducted to account for AVs in future Interstate 80 design needs. The project team began the study by reviewing the work on AVs conducted by Iowa DOT. Iowa’s Automated Vehicle Initiative is a program that will blend AV technologies to improve mobility, safety and economic vitality for Iowa travelers and freight. A partnership between Iowa DOT, HERE of North America (HERE) (a global leader in mapping and real-time traveler information), the University of Iowa, and Iowa State University, Iowa’s Automated Vehicle Initiative will develop a platform for connecting and guiding AVs based on high-definition (HD) dynamic mapping, predictive travel modeling and a cloud-based communications network. The initial deployment began in 2016 and covers interstates in the Cedar Rapids and Iowa City metro areas. Additional details on this initiative can be found in the 2017 Automated

Office of Location and Environment Automated Corridors
June 2017
Automated Corridors 10
Vehicle Technologies Project Vision Document.1 Work on AVs conducted by the United States DOT (USDOT) and peer agencies is included in Appendix A – Existing Automated Vehicle Initiatives. The project team also synthesized research studies to provide a foundation of assumed impacts.
Scenario Planning The nature of this study on AVs and advanced technologies rests on the outcome of an uncertain future. The benefits behind the technology may be extraordinarily high if AVs are commonplace or insignificant if the idea dies out. It is important that the study approach drives a set of conclusions and recommendations that are developed acknowledging the uncertainty involved, considering multiple future scenarios. Scenario planning is the approach chosen to systematically account for uncertainty (illustrated in Figure 4).
This approach widens the focus from one future that represents the same trends continuing on the same path as the current day, to a number of possible futures that capture a wide variety of potential impacting factors. A study based in scenario planning can look at one future where the new technologies boom and change how our society operates and another scenario where the technology fad fades. The future’s sensitivity to any trend can be investigated and with each additional future reviewed, the study’s findings become more robust, preparing for a wider set of ways that the future might develop.
As a primary element of scenario planning, the project team conducted research on trends in AV adoption, as documented in Figure 5. Four AV adoption scenarios were identified for further analysis along with a no-build, non-technology scenario.
1 https://www.iowadot.gov/pdf_files/IowaVisionDocument.pdf.
Figure 5. Automated Vehicle
Figure 4. Scenario Planning

Office of Location and Environment Automated Corridors
June 2017
Automated Corridors 11
The scenarios differ in the assumptions used for the AV adoption rate and include up to three additional key factors with the potential to impact future transportation. The combination of Scenarios 1 (Early AV Adopters), 2 (Rise of the AVs), and 4 (AV Domination) represent a future with aggressive AV adoption at different points in time: 2025, 2030 and 2040. These scenarios include the less dominant, trip-reducing impacts of Millennial travel behavior and an aging population. Alternatively, Scenario 3 (Limited AV Adopters) represents a conservative future in which drivers adopt AV slowly and the impacts of additional travel behavior factors are not included. All four scenarios included the impact of smart truck parking, based on Iowa’s involvement in the successful Mid America Association of State Transportation Officials (MAASTO) grant application to deploy the technology at key public and private truck parking areas along Interstate 80. All scenarios are detailed in Figure 6. A detailed explanation of the assumptions related to the four analyzed scenarios is included in Appendix B – Literature Synthesis.
Also included in all four scenarios is the assumption that Interstate 80 will be widened statewide to six lanes. Interstate 80 has existing and near-term traffic capacity and safety needs (as established in other technical memorandums developed under this Planning Study) and even aggressive predictions for AV adoption recognize that Level 3 and above AVs will not have a majority share of the vehicle market until at least 2030. Given near-term needs, that will not foreseeably be met by AV technology, the project management team decided to focus this scenario analysis on the impact of AV technology on an assumed six-lane Interstate 80 cross section.
For these scenarios, adjustment factors impacting travel patterns were synthesized from the research. The primary affected travel factors were number of trips, vehicle miles traveled, roadway capacity and crash frequency. Adjustment factors were developed in two steps. First, the expected impacts of key factors on the travel patterns were determined using the values identified in the literature review. Second, the weighted average impact of the key factors on each travel demand variable was calculated to determine the overall impact. Table 1 presents the adjustment factors synthesized from the literature for each scenario.
Table 1. Travel Pattern Adjustment Factors
Travel Pattern Scenario 1 Early AV Adopters
Scenario 2 Rise of the AVs
Scenario 3 Limited AV Adopters
Scenario 4 AV Domination
Trips +6% +14% +6% +19%
Vehicle Miles Traveled +9% +16% +11% +34%
Roadway Capacity +4% +22% +4% +64%
Crash Frequency -21% -43% -17% -72% Source: HDR Note: automated vehicle (AV)
In this study of Interstate 80, the project team went beyond simply extrapolating the work of others and developed analysis methods that provided locally specific estimates of the impact of AV technology mixed
Figure 6. Scenarios

Office of Location and Environment Automated Corridors
June 2017
Automated Corridors 12
with manually operated vehicles on Interstate 80. Three primary factors were considered as part of the Interstate 80 needs analysis: quality of peak traffic service, traffic safety, and travel time reliability. Each of these types of analysis required an analysis methodology that captured the effects of AVs and advanced technology.
Traffic Capacity Analysis / Quality of Service A standard of freeway design is providing high quality traffic operations. To assess how AV technology might affect how well the road is operating, the project team developed a custom Vissim traffic microsimulation model to capture the impact of individual vehicle interactions between AVs and manual vehicles. Once AV technology enters the traffic fleet, vehicles will be able to make driving maneuvers with better awareness of their own surroundings and in cooperation with other communications-enabled vehicles. To assess AV impacts appropriately, this cooperative behavior must be added to Vissim through custom programming developed specific to this project.
To illustrate the added value of AVs, an example of the flow of the AV simulation tool is shown in Figure 7. An AV enters a section of freeway in the model in the middle lane of a three-lane freeway. The simulation is informed of the new AV’s presence and then checks the AV’s position relative to the vehicle leading the AV. The lead vehicle is a manually driven vehicle. The AV is provided a special class of driver behavior by the custom programming so that the AV can reduce his following distance behind the manual vehicle to account for the AVs near instantaneous perception-reaction time. As the AV continues, it can tell through the standard Vissim procedure that it is traveling faster than the manual vehicle and will either need to slow or change lanes. Vissim allows the AV to pass to the left of the slow vehicle and now run in the inside lane. Once in the inside lane, the AV now has a new lead vehicle. The new lead vehicle happens to be another AV that is the rear vehicle in a platoon, or group, of three AVs. The custom programming tells the AV that it is allowed to speed up a set amount in order to catch the platoon. Once the AV reaches the back of the platoon, the custom programming allows the platoon to accept or reject this new vehicle into the platoon based on an assumed maximum platoon size of five vehicles. Because the approaching vehicle yields only a four-vehicle platoon, the new AV is allowed into the platoon and instructed by the simulation to close the spacing between itself and the vehicle in front of it and then reset its desired speed to match the platoon leader’s speed. Vissim continues the simulation as if each individual vehicle is making separate driving choices, but the custom programming provides some extra cooperation between the four vehicles in the platoon, so they can for a time operate as a unit. The combination of the custom programming and Vissim run the entire analysis
Figure 7. Automated Vehicle Platooning Scenario

Office of Location and Environment Automated Corridors
June 2017
Automated Corridors 13
period operating in a similar fashion to provide that extra information to each AV. The custom programming also manages when vehicles would want to leave a platoon and reset to its original preferred speed. The custom AV simulation tool was applied to the study scenarios and AV adoption rates. From that analysis, two key findings were realized. See Appendix C – Corridor Traffic Capacity Methodology and Results for further details.
The first key finding was that the project team identified the increased roadway capacity impact of AVs in mixed traffic. Figure 8 shows the simulated capacity compared to adoption levels of Level 3 and above AVs, and at 85% AV adoption levels the capacity of a single freeway lane was found to be more than 3,000 vehicles per hour. At 100% adoption, researchers using a similar approach to the project team found capacities as high as 4,000 vehicles per hour, which would essentially double the amount of traffic that could be moved on a given roadway during peak traffic.
Figure 8. Roadway Capacity versus Automated Vehicle Capacity
The second key finding was that the introduction of AVs changes how the quality of traffic service is measured. AVs change how transportation performance is assessed because a self-driving vehicle is less affected by how many vehicles are on the road. This is the key determinate of the most common freeway performance measure. It is referred to as level of service (LOS). In fact, AVs are expected to be designed to have connectivity features that encourage vehicles to drive in small groups or platoons. These platoons will operate with vehicles closely following a lead vehicle that is sending the trailing vehicles information about the speed to maintain, changes in roadway direction, and approaching hazards. The benefit of these dense platoons is that their space efficiency could lead to extra space for manually operated vehicles and allow Iowa DOT to provide a better operating system with fewer new construction projects.
Density, speeds and demand-to-capacity ratios for multiple scenarios were compared at multiple locations. Across the board, AV technology led to higher average freeway densities, which in traditional analysis would signify a decline in the LOS score. Yet, the simulation model showed that AV technology led to higher average speeds and corresponding decreased travel times. The project team found that while the relationship between traffic volume and roadway density appears to be less relevant in the
0
1000
2000
3000
4000
5000
0% 20% 40% 60% 80% 100%
Cap
acity
(pas
seng
er
car/h
our/l
ane)
AV Adoption %
University of CaliforniaBerkeley Research
I-80 AutomatedCorridor
Vehicle Platooning: AV will travel in platoons for greater efficiency, enabled by vehicle connectivity.

Office of Location and Environment Automated Corridors
June 2017
Automated Corridors 14
context of AVs in the vehicle fleet, the analysis results show the correlation between average speeds and demand-to-capacity ratio is similar in cases with AV as it would be in cases without AV. Consequently, future planning and preliminary design efforts that include the impact of AVs should consider using demand-to-capacity ratio as a key performance metric.
Safety Analysis AVs are capable of preventing the vast majority of car crashes that result from human error or judgment and saving tens of thousands of lives in the United States.The National Highway Traffic Safety Administration (NHTSA) has performed studies linking 94% of crashes to driver behavior, so AVs that mitigate driver error must be pursued to increase roadway safety. With lower level automation technologies already on the market, evidence is growing that automation features can reduce crashes.
The AV safety technologies in the research cover applications such as Forward Collision Warning (FCW), Cooperative Adaptive Cruise Control (CACC), and Lane Change Warning (LCW) as illustrated in Figure 9. A FCW “system has forward-looking vehicle detection capability, using sensing technologies such as cameras, radar, and Lidar. Sensor data are processed and analyzed, and alerts are provided if a collision with another vehicle is imminent.” When combined with automatic electronic braking (AEB) and/or automated steering this system could slow or stop a vehicle or shift it laterally; thereby reducing many common crash types such as rear-end crashes (Kockleman, Avery Bansal et al. 2016 pgs. 7 and 79).
• CACC is a system that involves vehicles communicating with other vehicles behind them regarding speed and lane assignment. The technology can improve both safety and traffic flow. The safety benefits are due in part to the ability to communicate and act on that communication nearly instantaneously. The brake reaction time for a CACC equipped vehicle following another CACC equipped vehicle has been estimated at 0.1 second. This is substantially faster than the fastest human brake reaction time of 0.47 second.
• LCW/Lane Departure Warning (LDW) technologies use sensors to detect the position and trajectory of surrounding vehicles and will warn the driver and/or take action if another vehicle poses a safety threat. It will also warn the driver and/or take action if the vehicle itself is leaving its lane in a manner that presents a safety threat. This technology is related to blind-spot monitoring and has the potential to reduce many common multi-vehicle crashes.
Research synthesized for the Interstate 80 Automated Corridors Study looked at the crash reduction potential of a combination of automation features that would be present in AVs. The researchers also
Figure 9. AV Safety Technologies
Office of Location and Environment Automated Corridors
June 2017
Automated Corridors 15
created an association between events just prior to a crash and specific automation features that would be triggered by that event, a technique called crash mapping.
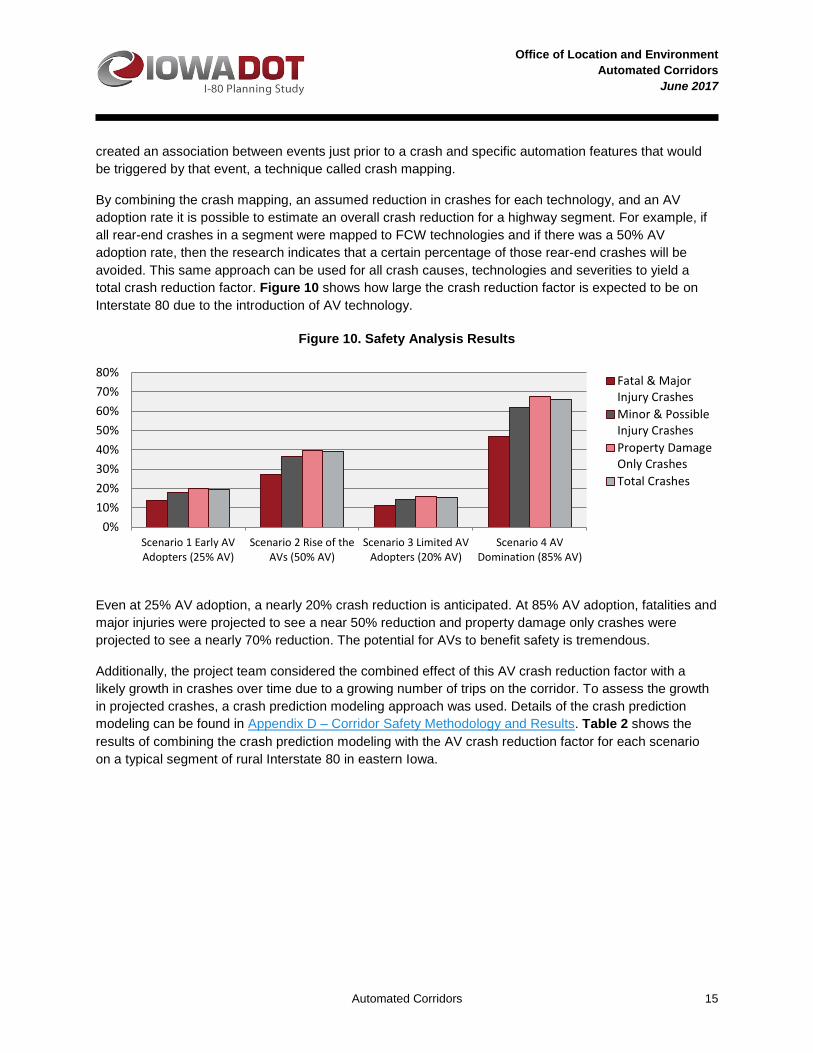
By combining the crash mapping, an assumed reduction in crashes for each technology, and an AV adoption rate it is possible to estimate an overall crash reduction for a highway segment. For example, if all rear-end crashes in a segment were mapped to FCW technologies and if there was a 50% AV adoption rate, then the research indicates that a certain percentage of those rear-end crashes will be avoided. This same approach can be used for all crash causes, technologies and severities to yield a total crash reduction factor. Figure 10 shows how large the crash reduction factor is expected to be on Interstate 80 due to the introduction of AV technology.
Figure 10. Safety Analysis Results
Even at 25% AV adoption, a nearly 20% crash reduction is anticipated. At 85% AV adoption, fatalities and major injuries were projected to see a near 50% reduction and property damage only crashes were projected to see a nearly 70% reduction. The potential for AVs to benefit safety is tremendous.
Additionally, the project team considered the combined effect of this AV crash reduction factor with a likely growth in crashes over time due to a growing number of trips on the corridor. To assess the growth in projected crashes, a crash prediction modeling approach was used. Details of the crash prediction modeling can be found in Appendix D – Corridor Safety Methodology and Results. Table 2 shows the results of combining the crash prediction modeling with the AV crash reduction factor for each scenario on a typical segment of rural Interstate 80 in eastern Iowa.
0%10%20%30%40%50%60%70%80%
Scenario 1 Early AVAdopters (25% AV)
Scenario 2 Rise of theAVs (50% AV)
Scenario 3 Limited AVAdopters (20% AV)
Scenario 4 AVDomination (85% AV)
Fatal & MajorInjury CrashesMinor & PossibleInjury CrashesProperty DamageOnly CrashesTotal Crashes
Office of Location and Environment Automated Corridors
June 2017
Automated Corridors 16
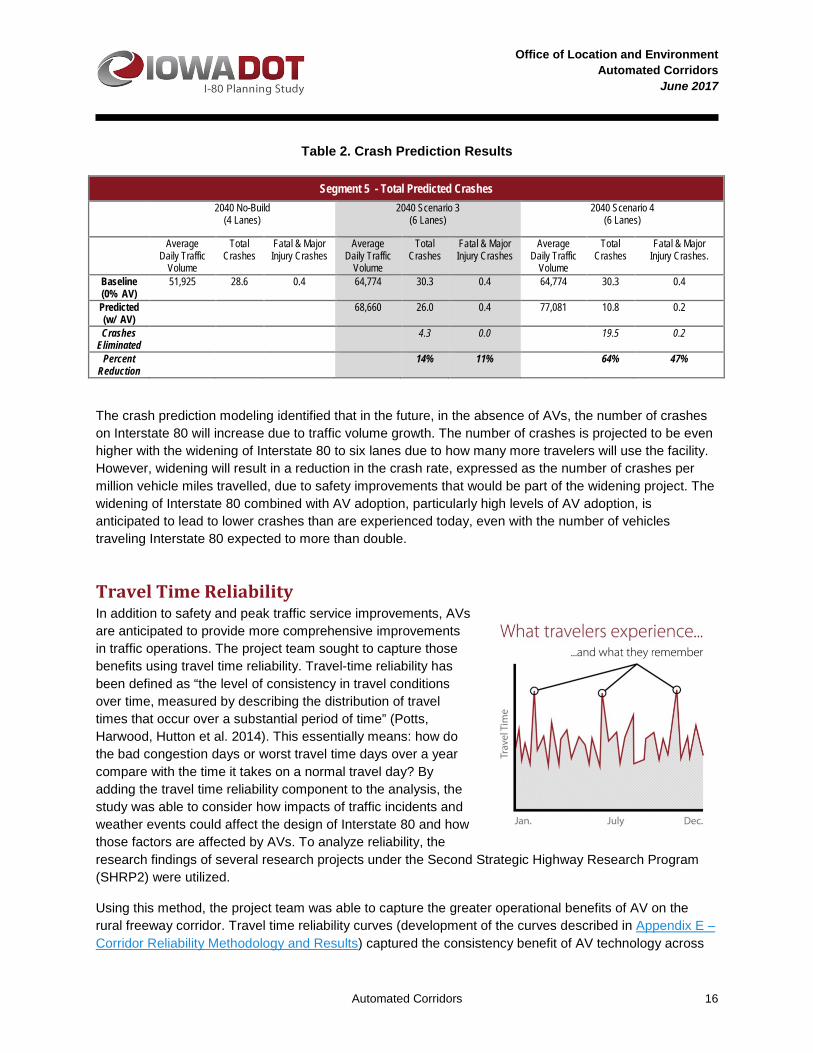
Table 2. Crash Prediction Results
Not
The crash prediction modeling identified that in the future, in the absence of AVs, the number of crashes on Interstate 80 will increase due to traffic volume growth. The number of crashes is projected to be even higher with the widening of Interstate 80 to six lanes due to how many more travelers will use the facility. However, widening will result in a reduction in the crash rate, expressed as the number of crashes per million vehicle miles travelled, due to safety improvements that would be part of the widening project. The widening of Interstate 80 combined with AV adoption, particularly high levels of AV adoption, is anticipated to lead to lower crashes than are experienced today, even with the number of vehicles traveling Interstate 80 expected to more than double.
Travel Time Reliability In addition to safety and peak traffic service improvements, AVs are anticipated to provide more comprehensive improvements in traffic operations. The project team sought to capture those benefits using travel time reliability. Travel-time reliability has been defined as “the level of consistency in travel conditions over time, measured by describing the distribution of travel times that occur over a substantial period of time” (Potts, Harwood, Hutton et al. 2014). This essentially means: how do the bad congestion days or worst travel time days over a year compare with the time it takes on a normal travel day? By adding the travel time reliability component to the analysis, the study was able to consider how impacts of traffic incidents and weather events could affect the design of Interstate 80 and how those factors are affected by AVs. To analyze reliability, the research findings of several research projects under the Second Strategic Highway Research Program (SHRP2) were utilized.
Using this method, the project team was able to capture the greater operational benefits of AV on the rural freeway corridor. Travel time reliability curves (development of the curves described in Appendix E – Corridor Reliability Methodology and Results) captured the consistency benefit of AV technology across
Segment 5 - Total Predicted Crashes 2040 No-Build
(4 Lanes) 2040 Scenario 3
(6 Lanes) 2040 Scenario 4
(6 Lanes)
Average Daily Traffic
Volume
Total Crashes
Fatal & Major Injury Crashes
Average Daily Traffic
Volume
Total Crashes
Fatal & Major Injury Crashes
Average Daily Traffic
Volume
Total Crashes
Fatal & Major Injury Crashes.
Baseline (0% AV)
51,925 28.6 0.4 64,774 30.3 0.4 64,774 30.3 0.4
Predicted (w/ AV)
68,660 26.0 0.4 77,081 10.8 0.2
Crashes Eliminated
4.3 0.0 19.5 0.2
Percent Reduction
14% 11% 64% 47%
Office of Location and Environment Automated Corridors
June 2017
Automated Corridors 17
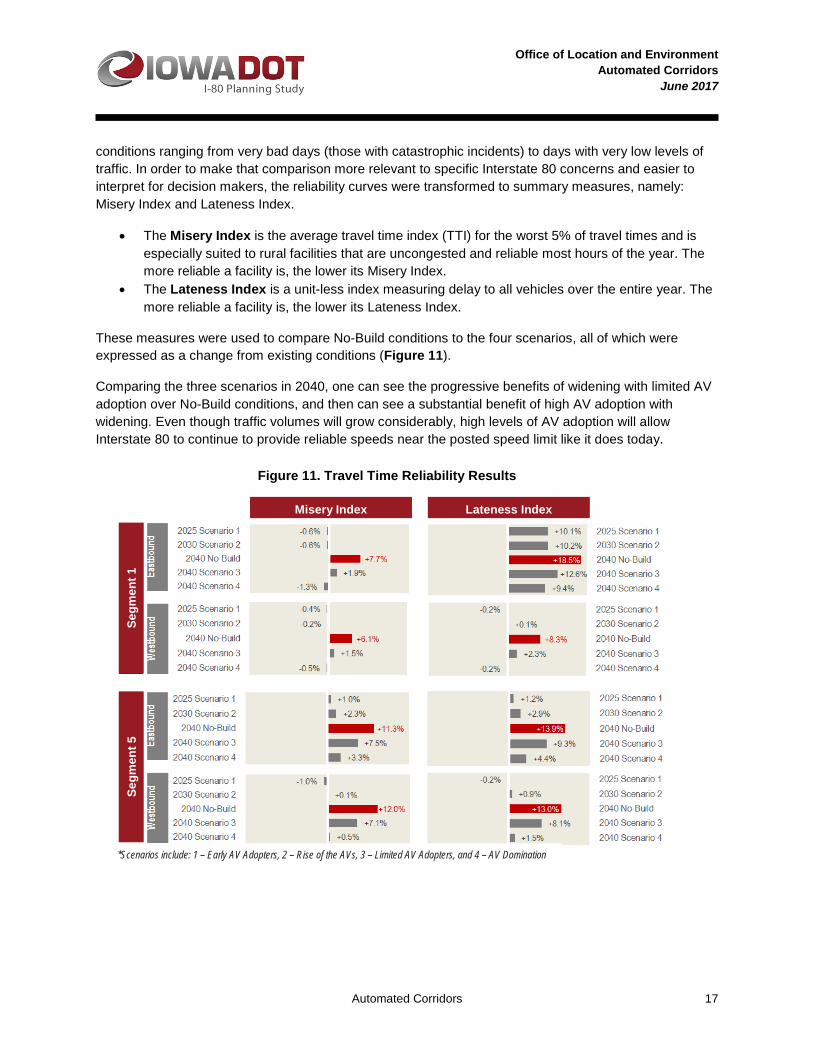
conditions ranging from very bad days (those with catastrophic incidents) to days with very low levels of traffic. In order to make that comparison more relevant to specific Interstate 80 concerns and easier to interpret for decision makers, the reliability curves were transformed to summary measures, namely: Misery Index and Lateness Index.
• The Misery Index is the average travel time index (TTI) for the worst 5% of travel times and is especially suited to rural facilities that are uncongested and reliable most hours of the year. The more reliable a facility is, the lower its Misery Index.
• The Lateness Index is a unit-less index measuring delay to all vehicles over the entire year. The more reliable a facility is, the lower its Lateness Index.
These measures were used to compare No-Build conditions to the four scenarios, all of which were expressed as a change from existing conditions (Figure 11).
Comparing the three scenarios in 2040, one can see the progressive benefits of widening with limited AV adoption over No-Build conditions, and then can see a substantial benefit of high AV adoption with widening. Even though traffic volumes will grow considerably, high levels of AV adoption will allow Interstate 80 to continue to provide reliable speeds near the posted speed limit like it does today.
Segm
ent 1
Se
gmen
t 5
Misery Index Lateness Index
*Scenarios include: 1 – Early AV Adopters, 2 – Rise of the AVs, 3 – Limited AV Adopters, and 4 – AV Domination
Figure 11. Travel Time Reliability Results

Office of Location and Environment Automated Corridors
June 2017
Automated Corridors 18
Future-Proofing At the conclusion of the multi-faceted scenario analysis, the scenario planning results were applied back to the primary concern of the Interstate 80 Planning Study; namely, designing a solution that meets the needs experienced along Interstate 80. The challenge in this case is designing for the uncertainty in the timing of the proliferation of advanced technology. The future-proofing process led to recommendations for the design of Interstate 80 that allow the corridor to be flexible to adjust in response to future technology and other transformative factors. The key areas addressed to balance needs with flexibility while limiting expense were:
• Mobility needs and expandability • AV infrastructure needs • Construction methods and materials • Right of way needs
By considering built-in flexibility in these areas of design, the proposed concept allows for the ability to better utilize the available pavement within the widened footprint when proliferation of AV technology is realized. Also, investments in communication and sensing technology will transform Interstate 80 into a smart corridor, better able to react to traveler needs. For example, by repurposing the left shoulder and left lane areas for conditional AV use, Interstate 80 will provide more traffic and capacity and will be less likely to breakdown due to increased traffic volumes and incidents. One illustration of how this transition could occur is represented in the changes from Figure 12 to Figure 13.
Figure 12. Original Interstate 80 Widening Concept
Figure 13. Preferred Interstate 80 Widening Concept with Automated Vehicle Findings
Highlights of the design considerations that would allow a seamless transition in time from the cross section in Figure 12 to Figure 13 include:
• 12-foot-wide left and right shoulders with full depth pavement for future flexibility o Left shoulder: Future use as a conditional shoulder/AV-only lane o Right shoulder: Use as a safe breakdown area and maintenance of traffic in work zones

Office of Location and Environment Automated Corridors
June 2017
Automated Corridors 19
• Robust pavement design considering higher levels of heavy vehicle exposure within one path of the critical design lane.
• Design of AV-supportive infrastructure o Communications infrastructure: Advanced cellular and fiber o Detection: Cameras, sensors and processed data from AVs
All of these proposed modifications address current corridor operations, safety and reliability needs while being flexible with the introduction of AV technology. AVs provide a growing set of benefits to traffic operations and design, and require AV supported infrastructure. Infrastructure elements include both physical elements such as fiber and cameras and virtual elements, such as HD mapping, which provides additional sensing capabilities that work beyond the range of AV sensors and functions in all weather scenarios. AV supported infrastructure will transition Interstate 80 to a corridor that provides connected and cooperative information between vehicles and the roadway and roadway operator. Appendix F – Future Proofing and Design Considerations discusses AV-supportive infrastructure that should be considered for deployment along Interstate 80 as AVs gain more widespread use.
Conclusions The project team assessed the Interstate 80 corridor for AV impacts as part of the broader Interstate 80 Planning Study. The study approach used a three-step method of scenario planning, scenario analysis and future-proofing. Scenario planning considered the range of possible futures and how likely trends may affect future transportation operations. Out of the scenario planning stage, four scenarios were advanced to scenario analysis. The traffic team did a detailed scenario analysis for Early AV Adoption, Rise of the AVs, Limited AV Adoption, and AV Domination in the areas of:
• Traffic capacity/quality of service • Traffic safety • Travel time reliability
The detailed output of these scenario analyses informed the project team of the range of future design needs. Future-proofing sought to associate flexible design features with future design needs to mitigate Iowa DOT’s risk of improving Interstate 80 in a way that does not meet traveler needs.
From this effort, many conclusions were reached about how Interstate 80 might operate in the future at certain levels of AV adoption. Each of those findings will help Iowa DOT shape future agency policy and practices on how to deal with this emerging set of transportation technologies. Key to the study was several recommendations regarding modifications to the original Interstate 80 design (listed above in Future-Proofing) and an additional study that should be completed to prepare Iowa DOT for AVs.
KEY FINDINGS Along the study process, a number of key findings were identified by the project team. Key findings represent the key outcomes of the study in a concise manner, such that the Iowa DOT team that managed this study can share these findings with others within the agency to lead to organizational awareness and potentially change policies related to AVs. Key findings are listed below by topic area. Figure 14 illustrates the Interstate 80 Automated Corridors Study results.

Office of Location and Environment Automated Corridors
June 2017
Automated Corridors 20
Figure 14. Interstate 80 Automated Corridors Study Results
Scenario Planning AVs are projected to make up 20% to 85% of all traffic by 2040. 2040 is less than 25 years away, thus well within the planning horizon for agency long range plans. Based on the results of this study and related efforts, agencies should standardize the practice of including AV scenario analysis in long range plans and alternatives analyses for specific corridor/site improvements. A supplemental finding is that AVs need to be considered at all levels of the design process. For example, when considering pavement design, pavements are designed to perform for up to 40 years of design life before requiring rehabilitation. By 2060, 40 years after the first segment of Interstate 80 could be open to traffic; AVs are projected to make up 65% to 100% of all traffic. Thus, with AVs serving as the primary vehicle type, design projects need to consider how the previous design practices might change to accommodate AVs. Advances will need to be made in how bridge and pavement infrastructure are maintained and replaced with consideration of many more vehicles on the roadway.
AVs are projected to substantially increase trips, by as much as 19% for high levels of AV adoption on rural freeways. As traditional planning studies are conducted to identify corridor needs, studies should include scenarios that examine the sensitivity of increased demand and its impact on corridor needs. To a lesser degree, some societal impacts will change travel demand over time. Demographic trends show that the U.S. population is aging and Millennials (those born 1979 through 2000) are becoming a more dominant part of the traveling population. As research points to those cohorts traveling less frequently, travel demand may see a less than 5% reduction in the number of trips on rural freeways.

Office of Location and Environment Automated Corridors
June 2017
Automated Corridors 21
Traffic Capacity/Quality of Service Analysis Traffic needs for rural Interstate 80 were assessed for a variety of segments across the study area. The portions of Interstate 80 between Iowa City and the Quad Cities exhibit the poorest quality of travel today and are projected to have the most significant mobility needs in 2040. On this segment, the projected number of vehicles in 2040 is high enough to warrant six to eight lanes on Interstate 80 to meet the desired design LOS alone. However, the studied scenarios with AV at various adoption rates in mixed traffic with manually operated vehicles, showed promise for increasing the capacity and quality of service over scenarios omitting technology. At high levels of AV adoption, roadway capacity was found to increase substantially even with AVs in mixed traffic with manually operated vehicles. Based on that finding, high levels of AV adoption could delay the need for additional Interstate 80 expansion by 20 to 30 years or more over standard analyses that omit the impacts of AV.
While several of the study scenarios looked at the design year impact of AV adoption, a few scenarios were reserved for near-term analysis of the impact of AVs. The key finding from these scenarios is that AVs in mixed traffic at lower levels of AV adoption do not show a decrease in segment average travel speeds. This finding is significant because some have characterized the transition years where AVs first enter general traffic as being dominated by slow speeds due to overly cautious AV driving.
AV adoption increased the speeds on the interstate, even though AVs also increased the number trips. As demand reaches very high levels of density, overall simulated speeds stayed higher due to consistent AV operations. As further studies confirm that LOS based on density is becoming obsolete under the rollout of AVs, the industry will have to look at modifying design guidelines that size facilities by a density-based LOS. The Interstate 80 Planning Study Guiding Principles set the threshold performance in the design year for Interstate 80 at LOS B. In the long-term, Interstate 80 may carry traffic much more dense than that criteria, but based on the AV operations analysis, freeway speeds will still provide travelers with more efficient travel times.
Safety Analysis The safety analysis indicated that AVs are capable of preventing the majority of car crashes that occur on Interstate 80 today. Based on the crash mapping method developed using local Interstate 80 data, crash reductions of 18% compared to No-Build were observed at 20% AV adoption. At 85% adoption, AVs yield a crash reduction of 63%, compared to No-Build conditions, even under higher levels of traffic than the No-Build.
A safety analysis method was applied that provides for a location-specific estimate of crashes that could be prevented using AV technology. This safety method for AV projects will help agencies study and prioritize roadways with the highest potential AV benefits.
Travel Time Reliability Analysis AVs are expected to provide a benefit to traffic operations beyond peak hour quality of service and a reduction in the number of crashes, called travel time reliability. The study applied a travel time reliability approach that considered how AVs reduce bottlenecks, reduce crashes and incidents and potentially mitigate weather events. The method showed that without AVs or widening on Interstate 80 those worst travel days are going to happen more frequently, keeping drivers stuck in traffic for longer periods of time. The analysis indicated that No-Build conditions increase the Misery Index, a travel time reliability performance metric, by 4% to 12% (less reliable conditions) compared to existing conditions. However,

Office of Location and Environment Automated Corridors
June 2017
Automated Corridors 22
high AV adoption levels combined with Interstate 80 widening keeps the Misery Index for 2040 near existing levels. This is significant because the corridor will be carrying considerably more traffic with relative growth far exceeding the amount of roadway capacity that would be added through widening.
Future-Proofing Scenario planning helps inform future facility needs across a range of potential futures. Future uncertainty means the design of Interstate 80 should be flexible to operate under the range of possible technology adoption futures identified in the project scenario planning. The traffic capacity, safety and reliability benefits will vary depending on how the future of AV and other trends unfold over time.
Design Recommendations A primary need of the overall Interstate 80 Planning Study is to identify the future needs of Interstate 80. Many of those future needs are unrelated to AVs and have been conducted as separate tasks under the larger umbrella of the Interstate 80 Planning Study. It will take a synthesis of all of these tasks to reach a preferred design for Interstate 80. That said, the detailed analysis of Interstate 80 for the impacts of AVs generated a list of recommended changes to the Interstate 80 cross section first presented in the guiding principles of the Interstate 80 Planning Study. Recommendations include:
• Design pavement considering AVs o Potential impact on pavement thickness
• Design the pavement base and geogrid to extend the full width of the pavement • 12-foot-wide left shoulder and right shoulder with full depth shoulder pavement • Construct continuous fiber optic and power lines along the corridor • Design AV-supportive infrastructure
o Communications infrastructure: Advanced cellular and fiber o Detection: Cameras, sensors and processed data from AVs
• Limit fixed deployments of traveler information (e.g. Dynamic Message Signs)
ADDITIONAL STUDY This automated corridors analysis has uncovered a number of key findings and design recommendations to address the potential AV impact on Interstate 80. Yet, there are still many action items left to properly incorporate AVs into the Interstate 80 corridor and widespread use on public roadways in general. Many of these action items fall upon the industry as a whole and are beyond the scope of designing and studying Interstate 80. Two action items in particular are very significant to the design of Interstate 80 for accommodating AV technology, namely:
• Develop a concept of operations for Interstate 80 and AVs, including consideration of AV-supportive infrastructure
• Study pavement effects of truck only facilities and vehicles with little lateral movement within lanes due to lane centering
Due to the planning nature of this study more substantive recommendations on how to design for AV operations were not completed. Future work will include the development of the concept of operations for Interstate 80, which will provide specific technology needs on Interstate 80 for AV-supportive infrastructure and be used for future project development, maintenance and operation of the system.

Office of Location and Environment Automated Corridors
June 2017
Automated Corridors 23
Glossary Access – Ease of getting people and goods to or from specific locations adjacent to the roadway.
Adaptive Cruise Control (ACC) – Vehicle assistance technology that combines traditional set-speed cruse control with sensors and automatic braking to maintain a safe following distance relative to the car ahead.
Automated Vehicle – Vehicles enabled with technology that allow vehicles to control parts of the driving task, under a range of circumstances.
Automatic Electronic Braking (AEB) – Vehicle assistance technology that applies the vehicle’s brakes automatically and forcibly if sensors on the vehicle recognize that a collision with the car ahead is imminent.
Cloud – Internet storage and processing available on demand, accessible from virtually any location.
Connectivity – Linkage between two separate entities; can include physical linkage between two physical locations or virtual linkages, such as communication of information between vehicles.
Dedicated Short Range Communications (DSRC) Radio – Radio capable of sharing messages 10 times a second within a fixed boundary over a specific communications band reserved for transportation.
Forward Collision Warning (FCW) – Vehicle assistance technology that audibly or visually warns a driver if sensors on the vehicle recognize that a collision with the car ahead is imminent.
Future-proofing – Flexible design of a system to build in adaptability to future trends and disruptions.
Global Positioning System (GPS) – Navigation system that provides a receiver’s location if the receiver has an unobstructed line of sight to four or more positioning satellites.
Lane Change Warning (LCW) – Vehicle assistance technology that audibly or visually warns a driver if another vehicle is occupying the adjacent, target lane when a turn signal has been activated.
Lane Departure Warning (LDW) – Vehicle assistance technology that audibly or visually warns a driver if their vehicle begins to cross a painted lane line without activating a turn signal.
Lateness Index – A unit-less index measuring the delay to all vehicles over the entire travel-time reliability study period.
Level 1 Automation – A vehicle equipped with one or more driver assistance functions that support either steering or acceleration/deceleration of the vehicle.
Level 2 Automation – A vehicle equipped with driver assistance functions that simultaneously supports steering and acceleration/deceleration of the vehicle.
Level 3 Automation – A vehicle that can steer and accelerate/decelerate automatically and monitor the driving environment; these vehicles rely on a human driver to take over control of the vehicle if automation fails.

Office of Location and Environment Automated Corridors
June 2017
Automated Corridors 24
Level 4 Automation – A vehicle that can steer and accelerate/decelerate automatically, monitor the driving environment and have automated systems as a fallback if automation fails; these vehicles will operate in automated mode most of the time, but in certain circumstances will give control of the vehicle to a human driver.
Level 5 Automation – A vehicle that is fully controlled by automated technology with no intervention from a human driver.
Level of Service (LOS) – Traffic standard for the quality of multimodal traffic operations governed within the Highway Capacity Manual. Multiple performance measures can be converted to a scale between LOS A (high quality operations, practically unimpeded flow) and LOS F (poor quality operations, vehicles excessively delayed).
Lidar (Laser Mapping, Light Detection and Ranging) – Technology that uses laser sensing to measure the distance to objects rapidly in three dimension (3D). Individual measurements are layered together to create digital, 3D representation of the surrounding environment.
MAASTO (Mid America Association of State Transportation Officials) – Transportation organization including 10 states that collaborate to foster the development, operation and maintenance of an integrated and balanced transportation system for users within the region.
Misery Index – The average travel time index (TTI) for the worst 5% of travel times.
Mobility – The ability to move people or goods from place to place.
No-build – A future alternative where no alterations/modifications are made to the transportation infrastructure.
Peak Traffic Service – Conditions during either the morning or afternoon rush hour; assessing the quality of traffic flow, often using the LOS scale.
Platoon – A group of vehicles that follow one another with close spacing and coordination of vehicle speeds.
Travel-time Reliability – The level of consistency in travel conditions over time based on the distribution of travel times observed.
Travel Time Index (TTI) – The ratio of actual time spent traveling a certain distance to the ideal travel time to cover the same distance on an open road.
Vissim Traffic Microsimulation Model – Tool for creating a digital representation of real-world traffic operations. The model uses vehicle mechanics and rules for vehicle behavior and interaction to simulate traffic flow moment by moment.
Office of Location and Environment Automated Corridors
June 2017
Automated Corridors 25
References Archambault, Patrick, et al. (Goldman Sachs) “Monetizing The Rise of Autonomous Vehicles.” Cars 2025
3 (2015). http://pg.jrj.com.cn/acc/Res/CN_RES/INVEST/2015/9/17/f70472c6-f4ad-4942-8eab-3c01f3c717a7.pdf. (Accessed November 22, 2016).
Kockelman, Kara and Prateek Bansal. “Forecasting America's Long-Term Adoption of Connected and Autonomous Vehicle Technologies.” Under review for publication in Transportation Research Part A: Policy and Practice, April 2016. http://www.caee.utexas.edu/prof/kockelman/public_html/TRB16CAVTechAdoption.pdf.
Kockelman, Kara, Paul Avery, and Prateek Bansal et al. “Implications of Connected and Automated Vehicles on the Safety and Operations of Roadway Networks: A Final Report.” Texas Department of Transportation, August 2016. http://library.ctr.utexas.edu/ctr-publications/0-6849-1.pdf. (Accessed November 22, 2016).
Litman, Todd. “Autonomous Vehicle Implementation Predictions: Implications for Transport Planning.” Victoria Transport Policy Institute, January 2, 2017. http://www.vtpi.org/avip.pdf. (Accessed November 22, 2016).
Shladover, Steven, Christopher Nowakowski, Xiao-Yun Lu and Robert Ferlis. “Cooperative Adaptive Cruise Control Definitions and Operating Concepts.” Transportation Research Record: Journal of the Transportation Research Board, 2014, no. 2489. http://docs.trb.org/prp/15-3265.pdf. (Accessed November 22, 2016).
“Fact Sheet: Encouraging the Safe and Responsible Deployment of Automated Vehicle.” (September 19, 2016). Office of the Press Secretary – White House. https://obamawhitehouse.archives.gov/the-press-office/2016/09/19/fact-sheet-encouraging-safe-and-responsible-deployment-automated. (Accessed June 15, 2017).
“Traffic Safety Facts: Critical Reasons for Crashes Investigated in the National Motor Vehicle Crash Causation Survey.” U.S. Department of Transportation National Highway Traffic Safety Administration. (February 2015). DOT HS 812 115. https://crashstats.nhtsa.dot.gov/Api/Public/ViewPublication/812115. (Accessed June 15, 2017).
Appendix References Archambault, Patrick, et al. (Goldman Sachs) “Monetizing The Rise of Autonomous Vehicles.” Cars 2025
3 (2015). http://pg.jrj.com.cn/acc/Res/CN_RES/INVEST/2015/9/17/f70472c6-f4ad-4942-8eab-3c01f3c717a7.pdf. (Accessed November 22, 2016).
Blumenberg, Evelyn, Brian Taylor, Michael Smart, Kelcie Ralph, Madeline Wander and Stephen Brumbaugh. “The Next Generation of Travel Statistical Analysis.” Office of Transportation Policy Studies, Federal Highway Administration, U.S. Department of Transportation, February 2013. https://www.fhwa.dot.gov/policy/otps/nextgen_stats/. (Accessed November 22, 2016).

Office of Location and Environment Automated Corridors
June 2017
Automated Corridors 26
Childress, Suzanne et al. “Using an Activity Based Model to Explore Possible Impacts of Automated Vehicles.” Transportation Research Board 2015 Annual Meeting, August 1, 2014. https://psrc.github.io/attachments/2014/TRB-2015-Automated-Vehicles-Rev2.pdf. (Accessed November 22, 2016).
Circella, Giovanni, Kate Tiedeman, Susan Handy and Patricia Mokhtarian. “Factors affecting passenger travel demand in the United States.” National Center for Sustainable Transportation, November 2015. http://www.dot.ca.gov/hq/tpp/offices/owd/horizons_files/NCST_WP_Travel_Demand_Draft.pdf. (Accessed November 22, 2016).
Davis, Benjamin, Tony Dutzik, and Phineas Baxandall. “Transportation and the new generation: Why young people are driving less and what it means for transportation policy.” Frontier Group. U.S. PIRG Education Fund, 2012. http://www.uspirg.org/sites/pirg/files/reports/Transportation%20%26%20the%20New%20Generation%20vus_0.pdf. (Accessed November 22, 2016).
Eccles, Kimberly, Frank Gross, Mindy Liu and Forrest Council. “Crash Data Analyses for Vehicle to Infrastructure Communications for Safety Applications.” Office of Safety Research and Development, Federal Highway Administration, U.S. Department of Transportation, November 2012. https://www.fhwa.dot.gov/publications/research/connectedvehicles/11040/11040.pdf. (Accessed November 22, 2016).
Garikpati, Venu, Ram Pendyala, Eric Morris, Patricia Mokhtarian and Noreen McDonald. “Activity patterns, time use, and travel of millennials: a generation in transition?” Transport Reviews 36, no. 5 (2016): 558-584. http://dx.doi.org/10.1080/01441647.2016.1197337.
HNTB Corporation. “Smart Truck Parking.” ITS Heartland. HNTB, April 28, 2015. http://www.itsheartland.org/2015mtg/Presentations/Session2.Miller.pdf. (Accessed November 22, 2016).
Hu, Hsi-Hwa, Simon Choi, and Frank Wen. “Aging Population and Greenhouse Gas (GHG) Emissions in the Southern California Region.” Southern California Association of Governments, 2012. https://www.scag.ca.gov/DataAndTools/Documents/Resources/2012RP_03.pdf.
Kockelman, Kara, Paul Avery, and Prateek Bansal et al. “Implications of Connected and Automated Vehicles on the Safety and Operations of Roadway Networks: A Final Report.” Texas Department of Transportation, August 2016. http://library.ctr.utexas.edu/ctr-publications/0-6849-1.pdf. (Accessed November 22, 2016).
Kockelman, Kara and Prateek Bansal. “Forecasting America's Long-Term Adoption of Connected and Autonomous Vehicle Technologies.” Under review for publication in Transportation Research Part A: Policy and Practice, April 2016. http://www.caee.utexas.edu/prof/kockelman/public_html/TRB16CAVTechAdoption.pdf.
Litman, Todd. “Autonomous Vehicle Implementation Predictions: Implications for Transport Planning.” Victoria Transport Policy Institute, January 2, 2017. http://www.vtpi.org/avip.pdf. (Accessed November 22, 2016).
Office of Location and Environment Automated Corridors
June 2017
Automated Corridors 27
McDonald, Noreen. “Are Millennials Really the 'Go-Nowhere' Generation?” Journal of the American Planning Association 81, no. 2 (2015). http://dx.doi.org/10.1080/01944363.2015.1057196.
McGuckin, Nancy and Section 1909 Commission Staff. “Analysis of Future Issues and Changing Demands on the System, Part A. Demographic Changes: Impacts on Passenger Travel.” National Surface Transportation Policy and Revenue Study Commission, 2007. http://www.transportationfortomorrow.com/final_report/volume_3_html/technical_issues_papers/paperf91e.htm?name=4a_02. (Accessed November 22, 2016).
Mackenzie, Don, Zia Wadud and Paul Leiby. “A First Order Estimate of Energy Impacts of Automated Vehicles in the United States.” TRB Paper No. 14-2193 (2014). http://faculty.washington.edu/dwhm/wp-content/uploads/2016/07/MacKenzie-Wadud-Leiby-14-2193-as-submitted.pdf. (Accessed November 22, 2016).
Perry, Ernest, Eric Oberhart, and Steven Wagner. “Truck Parking Management Systems.” Mid-America Freight Coalition, 2015. http://midamericafreight.org/wp-content/uploads/MAFC_TPMS_Synthesis_07012015.pdf. (Accessed November 22, 2016).
Potts, Ingrid, Douglas Harwood, Jessica Hutton, Chris Fees, Karin Bauer and Lindsay Lucas. 2014. Identification and Evaluation of the Cost-Effectiveness of Highway Design Features to Reduce Nonrecurrent Congestion. Strategic Highway Research Program. Report S2-L07-RR-1. http://shrp2archive.org/wp-content/uploads/SHRP2_S2-L07-RR-1.pdf. (Accessed June 26, 2017).
Rao, Anand S., and Mehrad Ahari. “Impact of Car Sharing, Automated Driver Assistance, Autonomous Cars on Insurance.” PwC, 2014. https://www.pwc.com/ca/en/insurance/publications/pwc-impact-of-driverless-cars-2015-12-en.pdf. (Accessed November 22, 2016).
Shladover, Steven, Christopher Nowakowski, Xiao-Yun Lu and Robert Ferlis. “Cooperative Adaptive Cruise Control Definitions and Operating Concepts.” Transportation Research Record: Journal of the Transportation Research Board, 2014, no. 2489. http://docs.trb.org/prp/15-3265.pdf. (Accessed November 22, 2016).
The Economist. “Look, No Hands.” Technology Quarterly, The Economist, September 1, 2012. http://www.economist.com/node/21560989. (Accessed November 22, 2016.)
Tientrakool, Patcharinee, Ya-Chi Ho, and Nicholas Maxemchuk. “Highway Capacity Benefits from using Vehicle to Vehicle Communication and Sensors for Collision Avoidance.” Department of Electrical Engineering, Columbia University, 2011. https://pdfs.semanticscholar.org/db00/a24d0980bd977dac7de7fed56b19785b6c68.pdf. (Accessed November 22, 2016).
ADDITIONAL REVIEWED REFERENCES (NOT CITED) Pinjari, Abdul Rawoof, Bertho Augustin, and Nikhil Menon. “Highway Capacity Impacts of Autonomous
Vehicles: An Assessment.” Center for Urban Transportation Research, November 2013. http://www.automatedvehicleinstitute.org/pdf/TAVI_8-CapacityPinjari.pdf. (Accessed November 22, 2016).

Office of Location and Environment Automated Corridors
June 2017
Automated Corridors 28
Schoettle, Brandon, and Michael Sivak. “Potential Impact of Self-Driving Vehicles on Household Vehicle Demand and Usage.” University of Michigan Transportation Research Institute, 2015, no. 3. http://www.driverlesstransportation.com/wp-content/uploads/2015/02/UMTRI-2015-3.pd. (Accessed November 22, 2016).
U.S. Dept. of Transportation, Federal Highway Administration, Policy and Governmental Affairs. 2013 Status of the Nation's Highways, Bridges, and Transit: Conditions and Performance, Chapter 1, 2013. https://www.fhwa.dot.gov/policy/2013cpr/chap1.cfm#6. (Accessed November 22, 2016).
Wadud, Zia, Don Mackenzie, and Paul Leiby. “Help or Hindrance? The travel, energy, and carbon impacts of highly automated vehicles.” Transportation Research Part A: Policy and Practice 86. (2015): 1-18. http://dx.doi.org/10.1016/j.tra.2015.12.001.
"Self Driving Cars: The Next Revolution.” KPMG Center for Automotive Research, 2012. https://www.kpmg.com/us/en/IssuesAndInsights/ArticlesPublications/Documents/self-driving-cars-next-revolution.pdf. (Accessed November 22, 2016).

Office of Location and Environment Automated Corridors
June 2017
Automated Corridors A1
Appendix A – Existing Automated Vehicle Initiatives In planning for the future needs of Interstate 80, a wide net was cast to draw on automated vehicle (AV) experiences across the country, especially efforts led by the U.S. Department of Transportation (USDOT).
A.1 - IOWA’S AUTOMATED VEHICLE INITIATIVE Iowa’s Automated Vehicle Initiative is a transformational program that will blend connected and autonomous vehicles technologies to improve mobility, safety, and economic vitality for Iowa travelers and freight. A partnership between Iowa Department of Transportation (DOT), HERE of North America (HERE) (a global leader in mapping and real-time traveler information), the University of Iowa, and Iowa State University, Iowa’s Automated Vehicle Initiative will develop a platform for connecting and guiding automated (connected and autonomous) vehicles based on high-definition (HD) dynamic mapping, predictive travel modeling and a cloud-based communications network. The initial deployment began in 2016 and covers interstates in the Cedar Rapids and Iowa City metro areas. All covered roadways will be part of the dynamic HD map or HD Live Map, constantly sharing centimeter-level accuracy in feature information to the cloud where it can be retrieved by in-vehicle navigation systems, mobile phone applications, and eventually high-functioning, AVs.
The HD Live Map is an agency-enabled layer of extra sensing capabilities to add to the existing sensing capabilities of AVs and provide better real-time information to drivers. The HD Live Map directly addresses traffic safety, alerting vehicles to prevent end of queue and weather-related crashes. From 2010 to 2014, the Cedar Rapids – Iowa City area accounted for 5% of statewide traffic fatalities. Iowa’s Automated Vehicle Initiative is expected to provide dramatic reductions in those numbers. Further, the cloud platform supporting the HD Live Map constantly synthesizes and communicates data, allowing AVs, first responders, Iowa State Patrol, and the statewide traffic management center to mitigate unexpected occurrences of congestion. Iowa’s Automated Vehicle Initiative will go further than highly effective communication of recent events, going as far as to leverage big data to predict future crashes and congestion, and advise vehicles to take precautionary measures. Major program accomplishments are expected in 2017, including complete HD Live Map coverage of the program area and development of initial predictive travel models. Beyond 2017, the program is expected to continue to keep up with a growing number of AVs on Iowa’s transportation infrastructure. Additional details on Iowa’s Automated Vehicle Initiative can be found in the 2017 Automated Vehicle Technologies Project Vision Document.
A.2 - USDOT INITIATIVES USDOT is undertaking several initiatives to help realize autonomous and connected vehicle implementation.
Beyond Traffic 2045
USDOT has recognized the great potential that emerging technology trends can play in making America’s transportation system once again the best in the world. USDOT provides a visioning framework for the transportation system of the future in the Beyond Traffic 2045 report.2 The report lays out key trends and implications to all modes of travel, including the highway system, with a significant focus on the opportunities that transportation technologies might provide. Beyond Traffic 2045 first provides some context by discussing trends in several sections: 2 https://www.transportation.gov/sites/dot.gov/files/docs/Draft_Beyond_Traffic_Framework.pdf

Office of Location and Environment Automated Corridors
June 2017
Automated Corridors A2
• How we move discusses key demographic shifts that will affect our country between now and 2045, including population growth, aging Americans, continued growth of American mega-regions, high levels of time lost due to traffic congestion and transportation needs of the poorest Americans.
• How we move things outlines the growth in multimodal freight shipments, emerging opportunities, challenges and potential impacts on the economy and transportation system.
• How we move better covers technology opportunities and how we can take steps to leverage opportunities to improve information for travelers and safety and mobility for all modes of travel.
• How will we adapt discusses how we can make infrastructure more resilient and reduce the footprint of transportation, particularly in the face of climate change.
• How we align decisions and dollars lays out how transportation is funded, current shortfalls, and describes a path forward to build a system that serves the nation’s needs.
The report then transitions from a discussion of trends to a review of system implications. It offers a multimodal perspective and acknowledges challenges such as increasing congestion, aging highways and bridges and declining revenues. The final section, A Better Path, suggests that to address challenges, there is a set of principles that guide policy decisions ahead. Much of that discussion centers on opportunities technologies play in addressing transportation challenges ahead. The key takeaway is that USDOT expects a significant influx of transportation technologies that will change how the transportation system operates.
Intelligent Transportation Systems (ITS) Strategic Plan (2015-2019)
USDOT has conducted several research activities to promote the adoption of transportation technologies through the implementation of the ITS Strategic Plan 2015–2019.3 Strategic plan priorities are to:
• Enable safer vehicles and roadways • Enhance mobility • Limit environmental impacts • Promote innovation • Support transportation system information sharing
3 www.its.dot.gov/strategicplan/

Office of Location and Environment Automated Corridors
June 2017
Automated Corridors A3
The ITS Strategic Plan 2015–2019 identified six program categories as priorities for research and investment. Much of the program categories focused on various elements of automated and connected vehicles. These program categories are:
• Connected Vehicles (CV) activities focused on adoption and deployment of CV systems, particularly: 1) Vehicle-to-vehicle (V2V) communications based on dedicated short-range communications (DSRC) technology; and 2) other CV technologies and communications enabled by DSRC or other technologies (e.g., cellular, Wi-Fi or satellite).
• Automation activities focused on automated road-vehicle system research that transfers various levels of vehicle control from the driver to the vehicle.
• Emerging Capabilities initiative focused on evaluating emerging and long-term technologies that might transform our transportation systems.
• Enterprise Data activities focused on integrating new, emerging transportation data sources for use in researching, measuring and managing the transportation system.
• Interoperability focused on developing standards and architecture to ensure ITS elements in vehicles, devices and infrastructure can communicate and work together.
• Accelerating Deployment facilitating a smooth transition from the initial adoption stage to widespread deployment.
Other important USDOT publications regarding planning for a technology empowered transportation future include:
• Smart City Challenge is an initiative whereby USDOT pledged up to $40 million in funding to a medium-sized city, to help it leverage the opportunities technologies provide in addressing the challenges of improving mobility. In competition with 77 cities submitting applications, Columbus, Ohio, was selected as the winner of the grant. The program’s goal is to help Columbus integrate innovative technologies, such as connected vehicles, traveler information, smart infrastructure, and smart sensors, into the city’s transportation network. The Columbus Smart City project started in fall 2016. More details on the program are provided in Section A.3.
• Regional Connected Vehicle Pilot Programs were sponsored by the USDOT ITS Joint Program Office (JPO) to implement and test several different CV technologies. In 2016, USDOT awarded three cooperative agreements with Wyoming, New York City, and Tampa to initiate a design-build-test phase of the CV Pilot Deployment Program. Each pilot site is demonstrating different technology applications relevant to their setting, including V2V and vehicle-to-infrastructure (V2I) applications such as Forward Collision Warning, Work Zone Warning, Spot Weather Impact Warning, Speed Compliance, Intersection Movement Assist, Pedestrian in Signalized Crosswalk, Transit Signal Priority and Red Light Violation Warning. Additional details of these regional connected vehicle pilot tests are documented in Section A.3.
Office of Location and Environment Automated Corridors
June 2017
Automated Corridors A4
• AV Proving Grounds were designated in January 2017 by USDOT. Ten proving ground sites were selected from a pool of 60 applicants to foster innovations for safe testing of automated technology. The 10 sites include: o City of Pittsburgh, Pennsylvania, and the Thomas D. Larson Pennsylvania Transportation
Institute o Texas AV Proving Grounds Partnership o U.S. Army Aberdeen Test Center o American Center for Mobility (ACM) at Willow Run o Contra Costa Transportation Authority (CCTA) and GoMentum Station o San Diego Association of Governments o Iowa City/Cedar Rapids Corridor and the University of Iowa’s National Advanced
Driving Simulator o University of Wisconsin-Madison o Central Florida AV Partners o North Carolina Turnpike Authority
• South Eastern Michigan Connected Vehicle Test Bed is run by the USDOT research program. It offers an environment for testing technology, applications and services to its members, an affiliation of companies and institutions collaborating to exchange information, share lessons learned and develop a common technical platform. The current test bed is in southeast Michigan, and offers a wide range of V2V and V2I testing features.
• Connected Vehicle Safety Pilot is a pilot project that demonstrated DSRC-based, connected vehicle safety applications for potential deployment. The pilot is testing the effectiveness of these applications under real-world conditions to determine safety effectiveness. Recent pilot projects have assessed applications on transit vehicles.
• Dynamic Mobility Applications take data collected from smart vehicles and devices and connects those elements to share data to benefit safety and mobility. There are six applications that are currently being advanced: o Enable Advanced Traveler Information System (EnableATIS) – working toward a
framework for taking dynamic mobility data and providing advanced traveler information. o Freight Advanced Traveler Information Systems (FRATIS) – travel information, load
matching and routing optimization application specific to the freight industry. o Integrated Dynamic Transit Operation (IDTO) – data and connections that increase the
likelihood of riders making successful transfers between vehicles and systems, provide enhanced real-time data to both riders and system operators, and allow for dynamic ridesharing in real time via mobile devices.
o Intelligent Network Flow Optimization (INFLO) – utilizing a combination of V2V and V2I deployments to provide location-specific information to drivers in an effort to harmonize speeds, warn of impending queues and operate cooperative adaptive cruise control (CACC) among vehicles in a platoon.
o Multi-Modal Intelligent Traffic Signal Systems (MMITSS) - using advanced communications and data to improve mobility and facilitate the efficient travel of passenger vehicles, pedestrians, transit, freight and emergency vehicles through the system.
Office of Location and Environment Automated Corridors
June 2017
Automated Corridors A5
o Response, Emergency Staging and Communications, Uniform Management, and Evacuation (R.E.S.C.U.M.E.) – improves traffic safety and mobility during crashes and other highway network emergencies by focusing on incident management and responder safety. R.E.S.C.U.M.E. provides pre-arrival data to emergency responders, work zone alerts for drivers and workers and emergency communications for evacuation.
A.3 - OTHER STATE PROGRAMS Whether funded through a USDOT initiative or the vision of agency management, these state initiatives parallel Iowa’s effort to speed the realization of autonomous and connected vehicle implementation. The primary other state programs include:
• Colorado Road X – Colorado DOT’s advanced technologies incubator program will eventually support a fully connected transportation system between drivers, vehicles, infrastructure and the agency. Road X began in earnest in 2016 through the development of a project team including consulting firms CH2M Hill, AECOM, and Atkins, technology partners Panasonic, HERE, and OTTO (now owned by Uber), and local agency partners like the City of Denver. In October 2016, the Road X project demonstrated the ability for a commercial delivery to be made via a self-driving truck within specially mapped freeway corridors. The project is in the process of delivering a smart truck parking system using cellular and DSRC technologies. One of Road X’s key 2017 priorities is to overhaul an active traffic management and ramp metering system on Interstate 25 with the goal of moving more traffic with greater efficiency without widening the freeway.
• Smart Columbus – Columbus, Ohio, was the winner of USDOT’s first Smart City Challenge based on their vision of Smart Columbus. The Smart Columbus vision was based on five key tenets: access to jobs, smart logistics, connected residents, connected visitors and sustainable transportation. Once implemented, Smart Columbus will improve resident quality of life through a bundle of applications supporting more efficient mobility with a focus on equitable transportation options across social groups. Smart Columbus will provide connected vehicle and infrastructure solutions for the city’s new CMAX bus rapid transit (BRT). It will also provide electric, self-driving shuttles at transit hubs to improve accessibility for the first and last mile of transit trips.
• NYC CV Regional Pilot – New York City was one of three original pilot projects part of the USDOT Connected Vehicle Deployment Program. The New York City pilot focused on equipping up to 8,000 vehicles that frequently travel in Midtown Manhattan and Central Brooklyn to transmit and receive connected vehicle data. The pilot also includes deploying roadside units (RSUs) to provide infrastructure-based updates to connected vehicles. Up to 100 pedestrians will wear personal devices that communicate with instrumented vehicles. New York City’s goal for this pilot is to focus on unlocking potential safety improvements of connected vehicle technologies for all modes.
• Tampa CV Regional Pilot – Tampa Hillsboro Expressway Authority (THEA) was the second of three original pilot projects that were part of the USDOT Connected Vehicle Deployment Program. The THEA pilot focused on benefits of connected vehicle technology in improving safety and mobility during morning commutes. THEA manages reversible express lanes that bring commute traffic into downtown Tampa as the focal point of the pilot area in addition to three major downtown arterial streets. The THEA deployment includes equipped vehicles, infrastructure and pedestrians: 1,500 cars, 10 buses, 10 trolleys, 500 pedestrians and 40 roadside units.

Office of Location and Environment Automated Corridors
June 2017
Automated Corridors A6
• Wyoming CV Regional Pilot – Wyoming DOT was the final recipient of three original pilot projects that were part of the USDOT Connected Vehicle Deployment. The focus of the Wyoming pilot was to improve traveler safety on Interstate 80, particularly considering extreme weather and commercial vehicles. The Wyoming pilot included 400 equipped trucks (mix of agency-owned and private trucks) and 75 roadside units.
• Chattanooga CV Demonstration – In addition to the USDOT-sponsored connected vehicle pilots, some other agencies have begun to fund their own connected vehicle pilot projects. Chattanooga, Tennessee, developed a connected vehicle pilot plan and is now undertaking portions of the project as part of an existing congestion mitigation study with funding from the State of Tennessee and the Federal Highway Administration (FHWA). The Chattanooga pilot addressed the need for transit signal priority.
• Smart Belt Coalition – The Ohio, Michigan and Pennsylvania DOTs, along with the Ohio Turnpike and Infrastructure Commission and the Pennsylvania Turnpike have formed a coalition focused on advancing technologies collaboratively and consistently in the tri-state area.
• Missouri Road-to-Tomorrow – Missouri DOT has launched a technology focused program designed to enhance the testing, adoption and promotion of new transportation technologies including new pavement design and construction, solar roadways and other innovative technologies.
• Texas Smart State – Cities and regions across Texas are partnering with the Texas A&M Transportation Institute, the University of Texas at Austin’s Center for Transportation Research (CTR) and Southwest Research Institute (SwRI) to form the Texas AV Proving Ground Partnership. The statewide partnership has the goal of making Texas the nation’s first Smart State by creating a platform for innovation to address community challenges.
• Maricopa County Department of Transportation (MCDOT) Connected Vehicle Test Bed and SmartDrive Program – MCDOT along with Arizona DOT and the University of Arizona collaborated to develop a Connected Vehicle Test Bed in Anthem, Arizona, to test the MCDOT SMARTDriveSM Program's vehicle prioritization technology.
Autonomous and Connected Vehicle Test Facilities
• MCity – The University of Michigan and Michigan DOT collaborated to design this 32-acre site of private testing roadways on the University’s North Campus. MCity opened in July 2015 and allows AV manufacturers, after-market automation technology companies and researchers to test their vehicles on a strategically designed test bed. MCity roadways include features such as intersections, traffic signs and signals, sidewalks, benches, simulated buildings, streetlights and obstacles such as construction barriers.
• CCTA –CCTA is a public agency serving Contra Costa County in the San Francisco Bay Area. CCTA has taken a progressive stance toward the inclusion of future technologies, such as vehicle automation, in their long-range planning. CCTA has acquired an abandoned naval campus and opened the facility to industry testing of autonomous and connected vehicles. The vehicle testing program has been dubbed Gomentum and CCTA has established an initial vehicle automation testing program with partner OTTO, a truck-focused vehicle automation company.
• Transportation Research Center (TRC) – Located in Marysville, Ohio, TRC is the largest independent vehicle testing facility and proving grounds in the U.S. covering more than 4,500 acres of automotive courses and test tracks. TRC is home to National Highway Traffic Safety Administration (NHTSA) Vehicle Research and Test Center, which is the only federal

Office of Location and Environment Automated Corridors
June 2017
Automated Corridors A7
vehicle research and test laboratory in the country. Recently, TRC announced a $45 million investment plan to implement new connected and autonomous vehicles testing capabilities and courses at the facility.
• Texas Transportation Institute RELLIS Campus – Located 10 miles from Texas A&M’s main campus, the RELLIS Campus provides testing facilities that accommodate a wide variety of transportation research and implementation projects, including those associated with connected and autonomous vehicles.
• SunTrax Test Facility – Florida DOT has recently announced a partnership with the Florida Polytechnic University to create this 2.25-mile oval track on a 400-acre site in Polk County explicitly to test emerging transportation technologies such as connected and autonomous vehicles.
A.4 - EMERGING FUNDING SOURCES Funding programs represent the public side of support behind AV evolution. Details of these funding programs continue to develop, thus details in this report may not reflect final program details.
AASHTO Signal Phasing and Timing (SPaT) Challenge – AASHTO has released a draft document providing guidelines of a planned challenge to state and local agencies regarding SPaT. The SPaT message set conveys important signal timing information from the traffic signal controller to a connected or AV using DSRC. Use of SPaT could eventually lead to signal priority applications, red light violation warnings, and intelligent signal systems applications that would allow the signal to optimize its timings on the fly. AASHTO sees an opportunity to help member agencies be better prepared for connected vehicles by deploying this key communication tool. AASHTO is challenging each state to deploy at least 20 traffic signals with SPaT by 2020 and commit to operate SPaT for a minimum of 10 years. AASHTO does not have a dedicated funding stream for this challenge, but, along with other members of the V2I Deployment Coalition, will provide technical guidance to agencies requesting assistance. The challenge will be effective upon approval by at least a two-thirds majority of the AASHTO Standing Committee on Highways, which had not been achieved at the time of publication of this report.
• FAST Technology Grants – The U.S. Congress approved the Fixing America’s Surface Transportation (FAST) Act in December 2015. Included in the legislation were several funding opportunities to be competitively distributed by USDOT. One of these opportunities was the Advanced Transportation and Congestion Management Technologies Deployment (ATCMTD) Initiative. The ATCMTD initiative was targeted at emerging technologies that reduce congestion and improve safety. Sixty million dollars of funding was set aside by Congress for each year from 2016 through 2020. Agencies competed for up to 10 awards out of the $60 million funding pool, and were required to provide 50% of matching funds. The winners of the 2016 program were announced in October 2016. It is anticipated that USDOT will publish a similar notice of funding opportunity for 2017 in the coming months.
• National Institute of Standards and Technology (NIST) and U.S. Ignite Global City Teams Challenge (GCTC) – NIST and U.S. Ignite have collaborated to create the GCTC. This provides a platform for local government representatives and technology issues.

Office of Location and Environment Automated Corridors
June 2017
Automated Corridors B1
Appendix B – Literature Synthesis This appendix presents the synthesis of literature reviewed on a number of key factors anticipated to impact future travel patterns and travel performance in rural stretches of the interstate. It contains three sections. Following this introduction, the first section (Section B.1) provides a description of the potential factors that could affect travel conditions on Interstate 80 based on a scan of the literature. The middle section (Section B.2) presents a summary of the literature review. The final section (Section B.3) presents the adjustment factors developed.
B.1 - POTENTIAL FACTORS AFFECTING INTERSTATE 80 CORRIDOR This section summarizes the potential factors considered and the key factors selected that may influence the Interstate 80 Planning Study. First, the project team carried out a high-level review of the potential factors considered in Iowa’s Automated Vehicle Initiative, the scope of work for the study, and other potential factors that might affect the Interstate 80 Planning Study. Second, through discussions with Iowa Department of Transportation (DOT), the project team identified the key factors most likely and significantly to affect the Interstate 80 Planning Study. The following is a summary of the potential factors considered and the key factors selected.
Automated Vehicle (AV) Technologies involve the use of sensors and other technologies to detect the surrounding environment and carry out driving tasks. AV technologies can lead to major improvements in safety, accessibility and capacity. As a result, the level of AV technology adoption was selected as a key factor in the scenario planning.
Millennial Travel Behavior refers to the tendency of Millennials to travel less. Since 2015, Millennials (i.e., people born between 1979 and 2000) represent the largest population segment. Millennials own fewer cars and drive less than previous generations. However, it is unclear whether current Millennial travel behavior represents a permanent shift in attitudes toward car ownership and driving or a short-term behavioral modification. Millennial travel behavior was selected as a key factor to consider in the scenario planning.
Aging Population corresponds to the growth in population aged 65 and above. This segment of the population continues to increase significantly, as the Baby Boom generation (i.e, people born between 1946 and 1964) enters the demographic group. Studies show that vehicle miles traveled (VMT) levels change with age, with peak levels occurring during middle age and VMT decreasing thereafter. A growing population 65 and older is expected to lead to lower travel demand per capita. Aging population was selected as a key factor for the scenario planning.
Smart Truck Parking involves the use of road signs, smartphone apps, websites, and messaging to inform truck drivers of parking availability in real time. Access to information on the availability of parking allows truckers to plan their trips. Smart truck parking is expected to reduce the number of crashes caused by driver fatigue. Also, the Mid America Association of State Transportation Officials, which includes Iowa, recently was awarded federal grant funding to develop smart truck parking. Given its high degree of likely development, smart truck parking was selected as a key factor for the scenario planning.
Car Sharing provides members access to a fleet of shared vehicles on an hourly basis (e.g. Zipcar). Car sharing services reduce the need to own private vehicles. Car sharing services were not included as a key factor for scenario planning due to their limited availability (and impact) in rural settings.
Office of Location and Environment Automated Corridors
June 2017
Automated Corridors B2
Ride Hailing Services connect riders with drivers, who are independent contractors using private vehicles to provide rides (e.g. Uber, Lyft). Ride hailing services facilitate the process of obtaining for-hire transportation and are generally cheaper than taxis in most major American cities, which may lead to increases in VMT and congestion. Ride hailing services were not included as a key factor due to their limited availability in rural settings.
Telecommuting includes working from home for one or more days a week. Telecommuting may lead to reductions in VMT and the number of work trips made by commuters. Telecommuting was not included as a key factor because it is a relatively minor impact in rural settings. As telecommunication companies provide more ubiquitous coverage, more people may be able to work from home, including in rural areas, but it is unlikely to take many trips off the road in rural settings.
B.2 - RESEARCH SUMMARY: EMERGING TRENDS AND TECHNOLOGY AND POTENTIAL IMPACT ON TRAVEL This section presents the expected impacts of key factors on travel demand, capacity and safety.
AV Technologies
The literature suggests that the number of trips, VMT, and trip length may increase as Level 3 and above AV adoption rates rise. Childress et al. (2014) finds that trip making increases by around 2% when high-income households adopt AVs and by around 5% when AVs reach 100% adoption. Alternatively, Kockelman, Avery, Bansal et al. (2016) finds that the number of long distance trips may increase by more than 30% with 100% AV adoption.
Estimates for the impacts of AVs on VMT are wide-ranging and vary depending on assumptions about the AV technologies adopted, AV adoption rates, opportunity costs for travel time and the elasticity of travel demand. For instance, Mackenzie, Wadud and Leiby (2014) predict that VMT may increase from 4% to 156%. The lower value assumes the adoption of low-level AV technologies with a low elasticity of travel demand, whereas the upper bound assumes the opposite. Alternatively, Childress et al. (2014) predicts that VMT may grow by 5% when only high-income households adopt Level 5 AVs and by 20% when all households adopt Level 5 AVs. That same study finds that trip length increases by about 4% when high-income households adopt AVs and by around 15% when all households adopt AVs.
Two factors are expected to drive the increase in travel demand. First, AVs provide an underserved population access to cars. For example, elderly, children and the segment of the population with disabilities who are unable to drive will be able to increase their mobility by using AVs. Second, AVs may lead to decreases in travel time costs. AV passengers can work or carry out other activities during travel, which reduces the opportunity cost of AV travel time. As more people have access to travel in cars and as the travel time costs of driving decrease, more people will be willing and able to travel more frequently and for longer distances.
A growing penetration of AVs may also increase roadway capacity. AVs enable shorter following gaps between vehicles without reduced speeds, which result in greater roadway capacity. The expected impact of AVs on roadway capacity will depend on the levels of penetration that AVs achieve. For example, while Tientrakool, Ho and Maxemchuk (2011) find that roadway capacity can increase by around 273% at 100% adoption rate, capacity gains are significantly lower at lower AV penetration rates (e.g., 88% capacity gain for 80% penetration, and 30% capacity gain for 50% penetration).

Office of Location and Environment Automated Corridors
June 2017
Automated Corridors B3
Other studies estimate less aggressive capacity gains from AV penetration. For example, Shladover et al. (2014) finds that at 100% adoption of AVs, roadway capacity only increases by 80%, while an 80% adoption leads to a 50% increase in capacity. The studies use different assumptions for automated tasks: Shladover et al. (2014) assumes that the driver carries out braking, while Tientrakool, Ho and Maxemchuk (2011) assume that the vehicle has automatic braking.
The reliability of capacity gain estimates depend on the accuracy of forecasted AV adoption rates. Figure B.1 summarizes forecasted AV penetration rates from various studies for 2020 to 2060 [Litman 2017, Kockelman and Bansal 2016, Archambault et al. 2015]. The figure shows that, while there is significant variation between the conservative and aggressive scenarios in some studies, there is overlap in forecasted penetration rates across the studies. This suggests that there is some consistency on what the upper and lower bounds of AV adoption may be in the future.
Figure B.1. Forecast of Automated Vehicle Penetration Rates from 2020 to 2060
AVs may lead to safety improvements. AVs may prevent many collisions caused by human error, which account for about 90% of collisions (The Economist 2012). Studies suggest that collision reductions may range from 14% (Rao and Ahari 2014) to 90% (Litman 2017). Reductions vary depending on what aspect of vehicle accidents each study attempts to measure. For example, Rao and Ahari (2014) measure the impact of Automated Driver Assistance Systems on crash frequency, while Eccles et al. (2012) measures multi- and single-vehicle crashes that could be mitigated by Vehicle-to-Infrastructure (V2I) communications.
Technological advances in vehicle automation and communication can reduce the economic and comprehensive costs of vehicle crashes. Kockelman and Bansal (2016) estimates the adoption of connected and AV technologies over the long term and review impacts on safety, estimated crash count and crash cost reductions through various AV technologies. The study details the crash-related gains of various AV and connectivity features and assesses near-term and long-range impacts on car crashes in
Office of Location and Environment Automated Corridors
June 2017
Automated Corridors B4
Texas. A more in-depth discussion of AV safety technologies can be found in Appendix D - Corridor Safety Methodology and Results.
Millennial Travel Behavior
Millennial travel behavior may lead to decreases in travel demand. Millennials own fewer cars and drive less than previous generations at the same age bracket. Given this trend to date, the overall number of trips and VMT may decrease as Millennials age and make up the largest portion of the labor force. For example, McDonald (2015) finds that Millennials make 18% to 24% fewer trips compared to previous generations. Circella et al. (2015) finds that the youngest cohort of Millennials make 4% fewer trips compared to previous generations. Davis, Dutzik and Baxandall (2012) find that trips taken by drivers aged 16 to 34 dropped 15% from 2001 to 2009. Taken together, these and other studies indicate that the VMT for Millennials is about 16% to 25% lower than the VMT of previous generations.
Caution is necessary in using forecasts of decreased travel demand due to Millennial travel behavior because there are a number of other factors involved. Trends driving lower travel demand among Millennials include being unemployed, living with parents, and living in urban areas. For example, Garikapati et al. (2016) finds that these trends represent the aftermath effects of the recession and are short term. The study explains that Millennials are lagging in adopting lifestyle patterns related to greater travel demand. The study predicts that Millennial travel behavior will converge with that of older generations once Millennials fully recover and reach the stages of life related to higher travel demand. In fact, the study finds that the travel behavior of older Millennials that reach the life stages with higher travel demand converge with those of previous generations.
Aging Population
The aging population may lead to decreases in future travel demand. The population 65 years and older will significantly increase as the Baby Boom generation enters this demographic group. VMT falls as people retire and work trips decrease to zero. As a larger portion of the population forms the 65 and older age group, average VMT per capita is expected to decline.
The literature shows that an aging population will lead to decreases in travel demand. Hu, Choi and Wen (2012) find significantly lower travel demand in the 65 and older population compared to the 50- to 64-year-old population. They find that, on average, the 65 and older population takes 12% to 29% fewer trips and travel 28% to 54% fewer miles.
An examination of the 65 and plus population’s travel behavior over time reveals that current Baby Boomers turning 65 have decreasing travel demand compared to previous generations and that this trend is expected to continue into the future. The Federal Highway Administration (FHWA) finds that per person trips of the 65 and older population fell by 6% from 2001 to 2009 (Blumenberg et al. 2013). McGuckin and Section 1909 Commission Staff (2007) forecasts that VMT per capita among the 65 and older population will fall by 7% by 2050 compared to 2000 levels.
Smart Truck Parking
Smart truck parking may lead to decreases in the number of truck collisions. Smart truck parking can reduce driver fatigue by allowing truckers to plan rest stops and reduce the amount of time spent driving under fatigue conditions. Studies find that collisions due to driver fatigue account from about 2% (Perry,
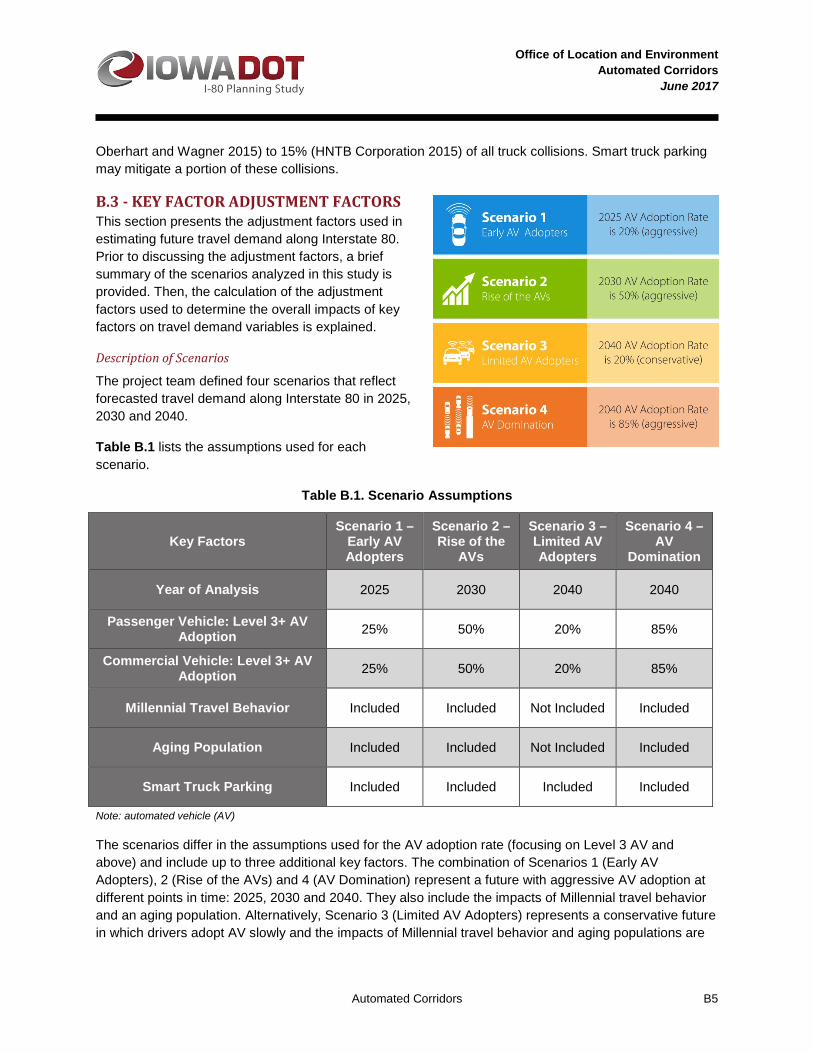
Office of Location and Environment Automated Corridors
June 2017
Automated Corridors B5
Oberhart and Wagner 2015) to 15% (HNTB Corporation 2015) of all truck collisions. Smart truck parking may mitigate a portion of these collisions.
B.3 - KEY FACTOR ADJUSTMENT FACTORS This section presents the adjustment factors used in estimating future travel demand along Interstate 80. Prior to discussing the adjustment factors, a brief summary of the scenarios analyzed in this study is provided. Then, the calculation of the adjustment factors used to determine the overall impacts of key factors on travel demand variables is explained.
Description of Scenarios
The project team defined four scenarios that reflect forecasted travel demand along Interstate 80 in 2025, 2030 and 2040.
Table B.1 lists the assumptions used for each scenario.
Table B.1. Scenario Assumptions
Note: automated vehicle (AV)
The scenarios differ in the assumptions used for the AV adoption rate (focusing on Level 3 AV and above) and include up to three additional key factors. The combination of Scenarios 1 (Early AV Adopters), 2 (Rise of the AVs) and 4 (AV Domination) represent a future with aggressive AV adoption at different points in time: 2025, 2030 and 2040. They also include the impacts of Millennial travel behavior and an aging population. Alternatively, Scenario 3 (Limited AV Adopters) represents a conservative future in which drivers adopt AV slowly and the impacts of Millennial travel behavior and aging populations are
Key Factors Scenario 1 –
Early AV Adopters
Scenario 2 – Rise of the
AVs
Scenario 3 – Limited AV Adopters
Scenario 4 – AV
Domination
Year of Analysis 2025 2030 2040 2040
Passenger Vehicle: Level 3+ AV Adoption 25% 50% 20% 85%
Commercial Vehicle: Level 3+ AV Adoption 25% 50% 20% 85%
Millennial Travel Behavior Included Included Not Included Included
Aging Population Included Included Not Included Included
Smart Truck Parking Included Included Included Included

Office of Location and Environment Automated Corridors
June 2017
Automated Corridors B6
assumed to trend back toward today’s norms for travel demand. All four scenarios include the impact of smart truck parking.
Estimated Capacity, Speed and Crash Adjustment Factors by Scenario
Adjustment factors determine the impact of key factors on travel pattern and travel performance variables including trips, VMT, capacity and crash frequency. The adjustment factors were developed in two steps. First, the expected impacts of key factors on the travel pattern and travel performance variables were determined using the values identified in the literature review. Second, the weighted average impact of the key factors on each travel pattern and travel performance variable was calculated to determine the overall impact. Table B.2 presents the adjustment factors synthesized from the literature for each scenario.
The purpose of these adjustment factors is to provide Iowa DOT with a quick estimation reference for determining future transportation impacts of these high-level future scenarios in system planning activities. However, for the study of Interstate 80 needs, a more in-depth analysis of traffic impacts was completed. The predominant adjustment factor used as an input in detailed traffic, safety and reliability analyses was the increase in number of trips. The increased capacity and reduced crash frequency for Interstate 80 were independently calculated in Appendix C – Corridor Traffic Capacity Methodology and Results and Appendix D – Corridor Safety Methodology and Results, respectively. Research indicated increases in VMT represent a key finding for future planning and conceptual analysis of freeway segments. In this study, traffic volumes were considered only at spot locations along Interstate 80, so trip increase were assumed to be inclusive of the VMT increases. However, if the number of trips increase and the length of trips increase on a per trip basis, then individual segments of long distance corridors will experience higher traffic volumes than estimated in this study.
Table B.2. Adjustment Factors Synthesized from Literature Review
Travel Demand Variables
Scenario 1 – Early AV Adopters
Scenario 2 – Rise of the AVs
Scenario 3 – Limited AV Adopters
Scenario 4 – AV Domination
Trips 6% 14% 6% 19%
Vehicle Miles Traveled 9% 16% 11% 34%
Capacity 4% 22% 4% 64%
Crash Frequencya -21% -43% -17% -72%
Notes: automated vehicle (AV) a. Effectiveness measure based on impact of forward collision warning (FCW) and cooperative adaptive cruise control (CACC) on reducing rear end crashes.

Office of Location and Environment Automated Corridors
June 2017
Automated Corridors C1
Appendix C – Traffic Capacity Methodology and Results
C.1 - METHODOLOGY The traffic capacity methodology for this study involved: 1) preparing traffic input data, 2) incorporating the research findings from Appendix B into a customized traffic microsimulation analysis tool, 3) developing and running the traffic microsimulation models and 4) selecting and collecting simulation-based measures of effectiveness.
Traffic Input Data Daily traffic volumes were developed and provided by Iowa Department of Transportation (DOT) Systems Planning group for 2014 conditions, 2040 No-Build conditions and 2040 Build conditions with Interstate 80 at six lanes for the entire Interstate 80 corridor. Further refinement for traffic capacity analysis was conducted for five representative segments, shown in Figure C.1.
Figure C.1. Automated Vehicle Study Segments Map
For this study, traffic data from 2013 to 2015 at automatic traffic recorder (ATR) stations was used to identify the design hour volumes for the five analysis segments (Segments 1 through 5). Design hour volume is typically taken to be the 30th highest observed hourly volume. The 30th highest observed hourly volume for each of the 3 years was identified and then averaged to develop a representative design volume for the 2013 to 2015 period. The highest design hour, and thus the hour used for capacity analysis, was 1 hour from either 4 to 5 p.m. or 5 to 6 p.m. that the project team allowed to vary between

Office of Location and Environment Automated Corridors
June 2017
Automated Corridors C2
analysis segments. Both eastbound and westbound traffic were found to peak within the same hour, so analyzing a single hour was sufficient for this traffic analysis (see Table C.1).
Table C.1. Segment Design Hour Traffic Volumes
Segment Volume Eastbound / Westbound
Segment 1 1,160 / 1,180 Segment 2 1,015 / 1,020 Segment 3 1,325 / 1,440 Segment 4 1,570 / 1,640 Segment 5 1,695 / 1,515
Traffic conditions for the 30th highest observed hourly volume were also investigated to determine peaking characteristics and mix of vehicle types. Peak 15-minute data was available for the months of May to December 2015 and that 15-minute data was used to establish peaking characteristics within the design hourly volume. Unlike urban conditions, traffic data for rural portions of Interstate 80 showed that traffic flow over the 1-hour peak period is nearly uniform for each 15-minute time period. Accordingly, the traffic analysis used a peak hour factor of 1.0.
ATR data was also used to establish the mix of vehicle types in the design hour. In traffic operations, a variety of approaches can be used to classify vehicles to capture their capabilities and/or overall impact on the traffic stream. Trucks, in particular, have significantly different operating characteristics when compared to light duty or passenger vehicles. The ATR data was used to break down traffic volumes into three classes: passenger cars, single-unit trucks and combo trucks (see Table C.2).
Table C.2. Traffic Volumes by Vehicle Class
Segment Passenger Cars Single-unit Trucks Combo Trucks
Segment 1 65% 15% 20% Segment 2 65% 15% 20% Segment 3 68% 15% 17% Segment 4 68% 15% 17% Segment 5 68% 15% 17%
Customizing the Traffic Microsimulation Analysis Tool On development of the traffic input data, the project team looked to develop a traffic analysis tool that would properly represent the influence of automated vehicles (AVs) on traffic flow. To address study needs, the project team selected a traffic microsimulation model for this project that is commercially available, well respected (PTV’s Vissim) and capable of custom programming.
The challenge with Vissim and similar traffic microsimulation models is that the models move vehicles through the network based on individual driver behavior only (with respect for the rules of the road and traffic control devices). Once AV technology is in the traffic fleet, vehicles will be able to make driving maneuvers with better awareness of their own surroundings and in cooperation with other vehicles that are communications-enabled. To assess AV impacts appropriately, this cooperative behavior must be

Office of Location and Environment Automated Corridors
June 2017
Automated Corridors C3
accounted for. The solution was to use Vissim’s flexibility in allowing model developers to let other software have access to the Vissim model during the model run time. More specifically, while Vissim cannot tell an AV that it should cooperate with the vehicle in front of it, Vissim lets the modeler tell another program what is going on in the Vissim model and then that program can send information back to the AV being simulated in Vissim to change its behavior to account for cooperation.
The Automated Corridors Technical Memorandum describes the flow of a vehicle in the Vissim model using customization. The combination of the custom programming and Vissim run the entire analysis period operating to provide that extra information to each AV. The custom programming also manages situations when vehicles would want to leave a platoon and how that might affect their preferred speed.
One of the key assumptions in developing this differentiation of manual vehicle following versus AV following behavior is in the Vissim driver behavior parameters. The driver behavior model used for this project was based on the traffic behavior model developed by Wiedemann in 1999 (standard within Vissim and called the Wiedemann 99 model). While the custom code dynamically directs the simulation that AVs in the simulation are in a platoon state, the project team specified to Vissim that the following vehicle classes always use the same research-based driver behavior parameters developed from work by researchers at the University of California at Berkeley (Cal-Berkeley; Shladover et al. [2014]). The Cal-Berkeley work was modified to apply the relative improvement in following time and following variation to the standard Wiedemann 99 car following parameters. The resultant Vissim driver behavior parameters are shown in Figure C.2.
Figure C.2. Vissim Driver Behavior Parameters
Another change in the common Vissim vehicle behavior was customization that represented a mixed environment between manually driven and AV traffic. Instead of using the Freeway (free lane selection) default driving behavior the project team went with the Right-side rule (motorized) driving behavior. The key change here is that vehicles strongly prefer to pass on the left side with slower vehicles having a tendency to move out of the fast lane if a faster, trailing vehicle approaches. The use of this lane change model was a simplification to account for the tendency of AVs and AV platoons operating at consistent high speeds compared to a portion of the manual vehicle fleet. Future enhancements to the custom AV

Office of Location and Environment Automated Corridors
June 2017
Automated Corridors C4
code could address this lane changing behavior in a more sophisticated set of rules should they be necessary.
Additional future analysis of AV traffic may consider the impact of AV awareness of downstream conditions, especially considering lane selection, and AV platoon effects of ramp entrances and exits. The current analysis methodology focuses on a rural freeway facility with very low ramp volumes. For that reason, the Vissim model was customized to address a facility where lane selection is based solely on preferred speeds.
The resulting custom AV modeling tool appeared to be well suited to capture AV influence for a number of performance metrics when combined with locally specific model parameters. To confirm the model’s capabilities, microsimulation model runs were conducted using the custom-programmed Vissim model to see if the project assumptions for AVs would show a capacity benefit similar to those identified in prior research. Capacity runs required a separate, iterative set of model runs under a variety of demand conditions before the true maximum achievable traffic volume was identified. The capacity model runs ignored the distinction between passenger cars and trucks, because capacity is typically estimated for the number of passenger cars that could pass through a lane in 1 hour.
After completing the capacity model runs, the resulting simulation-derived capacities were compared to the Cal-Berkeley research findings previously introduced, as shown in Figure C.3. The Interstate 80 project model shows a bias from Cal-Berkeley results due to the project model’s uncalibrated state that uses ideal assumptions for capacity and the contrasting, calibrated nature of the Cal-Berkeley study. However, the results of this test show a similar trend between the project model and the Cal-Berkeley results between AV adoption rates of 25% and 85%. Above 85%, the Cal-Berkeley results show a significant benefit to AV efficiency that was beyond the scope of the project model.
Looking at the project model results compared to the AV adoption levels tested (see Table C.3); the results show an 11% capacity increase per lane at 50% AV adoption and a 26% capacity increase per lane at 85% AV adoption. The project findings show that AVs and other studied factors increase travel demand by 14% at 50% AV adoption and by 19% at 85% AV adoption. Thus, some of the increased capacity will be used to serve induced AV travelers. Yet, those increases in travel demand are dispersed over all travel lanes, while capacity benefits are shown as an increase per lane. The result is that with high levels of AV adoption, the six-lane widening of Interstate 80 was analyzed as providing total capacity at nearly the same level as an eight-lane freeway without AV technology.

Office of Location and Environment Automated Corridors
June 2017
Automated Corridors C5
Figure C.3. Simulated Freeway Capacity versus Automated Vehicle Adoption
Table C.3. Traffic Capacity Increase
% Automated Vehicle Adoption
Capacity (passenger car/mile/lane)
Percent increase in capacity per lane
0% 2,410 +0% 20% 2,440 +1% 25% 2,450 +2% 50% 2,670 +11% 85% 3,030 +26%
Microsimulation Model Development In conjunction with development and testing of the Vissim customization, the existing conditions roadway network was developed in Vissim. Creation of the existing conditions network involved the use of links and connectors drawn on an aerial background to represent the four-lane freeway. Network links used for evaluation were drawn from the entrance ramp gore to the successive exit ramp gore. The alignment of these evaluation areas was drawn to match the horizontal alignment of the freeway. Though some curves exist in the freeway alignment, no curves were deemed to require a reduced speed area.
Upstream of the freeway links for evaluation, a set of long, straight freeway links was created to allow for vehicle positioning and vehicle platoon formation prior to reaching the evaluation area. These upstream freeway links were connected to the evaluation links via a short connector that uses Vissim defaults for lane change distance and emergency stopping distance. Even though the upstream positioning/platooning area passes ramp gore points, the project team consciously chose not to model ramp connections. Given the very low volume experienced on these rural ramps during the analysis period, the impact of the ramps was deemed negligible.
0
500
1000
1500
2000
2500
3000
3500
4000
4500
0% 20% 40% 60% 80% 100%
Cap
acity
(pas
seng
er c
ar/h
our/l
ane)
AV Adoption %
University of CaliforniaBerkeley Research
I-80 Automated Corridor

Office of Location and Environment Automated Corridors
June 2017
Automated Corridors C6
After the development of the simulation network, traffic controls were specified in the model. Given the nature of this simulation model as a set of isolated freeway links, traffic control was minimal, and mostly consisted of providing vehicles with the speed limit of 70 miles per hour (mph) in study segments. Vissim does not specifically utilize speed limits or speed limit signs as model elements, so the speed limit given to simulated vehicles was in the form of desired speed decisions. The desired speed for vehicles was specified as a distribution for different vehicle types. The desired speed distributions were developed based on INRIX XD data purchased as a yearly profile by Iowa DOT along with some supplemental data on truck speed distributions from Iowa DOT sensors. Passenger cars were given a desired distribution of speeds ranging from 58 to 83 mph and heavy trucks were given desired speeds ranging from 51 to 76 mph, which were consistent across all five segments. A different set of speed controls were given to AVs, which represent a lower level of speed variability. In the absence of surrounding AVs, an AV was given the range of desired speed distribution between 65 and 70 mph. If an AV was near another AV, then the platooning logic would modify the AVs desired speed. Approaching a platoon, the AV could utilize a 5% increase in desired speed to catch the platoon. Upon joining the platoon, AV desired speeds are set to create a single platoon-wide desired speed based on platoon leader’s preference. No other traffic controls were used in the model.
Vehicle inputs, previously described, needed to be supplemented to account for Vissim’s more detailed understanding of vehicle type and size. The 13-class FHWA system was used to identify size variation in vehicles and provided additional granularity over the three-class system previously discussed as part of the traffic input development. The Vissim model vehicle types were originally based on the PTV North American standard vehicle mix, but data from the 13-class counts was used to update the relative proportions of each vehicle type to match conditions on Interstate 80. For three of the five simulated segments, only three-class data was available. Where only three-class data was available, the relative proportion of vehicles within the passenger vehicle, single-unit truck and combo truck classes were assumed to resemble locations with the 13-class data, but the proportion of those three classes relative to each other was adjusted based on ATR data specific to that segment.
The final element of a base Vissim model is underlying driver behavior. Driving behavior defaults in Vissim are often calibrated to match existing roadway performance data. In this proof-of-concept model for testing the impacts of AVs, calibration was not undertaken. As shown previously, by not including calibration, the project model likely overstates the capacity of low AV adoption conditions. However, the model showed appropriate sensitivity to relative improvements in capacity at levels of AV adoption between 25% and 85%. Also, at higher levels of AV adoption, the benefits of calibration are reduced due to fewer human drivers in the traffic mix. Thus, the use of an uncalibrated model for this particular planning study likely provides a conservative analysis of the capacity benefits of AV traffic. Use of a calibrated model would be recommended to support detailed AV technology corridor design.
To convert the existing conditions Vissim model to represent other scenarios, Vissim’s built-in scenario management tools were used. The scenario management tools let one master input file act as the basis for multiple scenario input files where each of the scenario input files could be modified from the base to represent changes in input data and network geometry. Specific modifications of each scenario, aside from existing conditions, are documented in the scenario sub-sections of the following section. Due to the high level nature of the future forecasting for this project, many of the patterns from the existing conditions model were expected to remain the same in each scenario, including:
• Design hourly traffic volume peaking characteristics as they relate to daily traffic volumes • Peaking characteristics within the peak hour of traffic

Office of Location and Environment Automated Corridors
June 2017
Automated Corridors C7
• Proportions of heavy vehicles compared to total daily truck volume • Desired speeds (outside those that change during the model runtime due to the custom scripting)
Traffic Analysis Performance Measures Simulated conditions were assessed for each of the analysis segments based on measures of effectiveness pulled from the custom-programed Vissim model. Measures of effectiveness considered for this study include:
• Density • Capacity (maximum achievable traffic volume) • Demand-to-capacity ratio • Travel time and speed
Metrics considered are briefly described below.
Density is the measure of vehicle crowding that has long been used to assess the level of service (LOS) of freeway facilities. Density is measured as the number of vehicles in a lane in a 1-mile segment. Density is very sensitive to traffic volume and also considers the speed that traffic volume moves at. AVs will encourage greater densities, but the research findings show that density is not as undesirable for AVs as it is to manual drivers.
Capacity is a measure of mobility that most frequently considers a roadway’s adequacy to handle traffic demand at peak conditions. Consider an empty freeway; if the road conditions and weather do not pose an issue, the first vehicle on the empty freeway is going to travel at the speed that feels most comfortable to them. If they are on their way to work, school, an appointment or a delivery, that driver will probably travel at the speed limit or above. Then consider more vehicles joining that first vehicle on the roadway. As the number of vehicles increase, each individual driver has to moderate their behavior and speed to avoid getting too close to the other vehicles. For certain levels of traffic, vehicles are spread out enough that travelers can all maintain high speeds, but eventually all vehicles start to have to slow a noticeable amount. If the number of vehicles on the freeway keeps increasing, individual vehicles face greater strain in traveling the roadway until the steady, slowing flow of vehicles eventually breaks down, a traffic jam forms, and everyone stuck in the traffic jam experiences stop-and-go conditions.
Capacity is typically defined as the threshold just before the traffic jam forms where the maximum number of vehicles can traverse a section of roadway. Thus, if any additional vehicles try to traverse a roadway that is already at capacity, then the flow of traffic starts to jam up and not all vehicles wishing to use the roadway will be able to get to their destination until the traffic jam clears. Technology and AVs have been postulated to significantly increase capacity.
Demand-to-capacity ratio is a metric commonly used in planning-level applications to compare the adequacy of multiple facilities that do not share the same number of lanes or functional classification. By normalizing the traffic demand by the capacity, or maximum volume that can be served, the analysis can draw comparisons between the need of two different locations or project alternatives.
In analyzing transportation technology impacts, demand-to-capacity ratio can be an insightful metric because technology can cause variations in both the demand and supply for travel. The potential being that in some future technology cases, the demand for travel may grow at a much greater rate than the increase in transportation capacity. The demand-to-capacity ratio inherently compares both factors,
Office of Location and Environment Automated Corridors
June 2017
Automated Corridors C8
informing the analysis as to whether the capacity is adequate and if any reserve or unused capacity remains that could serve latent demand should it materialize.
Demand-to-capacity ratio is also a pseudo-density metric. If your demand-to-capacity ratio is 1.0 then all the space that can be used is full. While density, as traditionally defined, does not account for some of the impacts of AV traffic, demand-to-capacity ratio does take those factors into account. The trouble with using demand-to-capacity ratio is that the transportation industry has rarely defined acceptable levels of demand-to-capacity ratio for similar types of study as this one.
Travel time and speed are straightforward, intuitive and user-centric metrics that capture the average time it takes travelers to traverse a freeway segment or the average speed at which the segment is traversed. Travel time under typical conditions is a product of the facility’s free-flow or natural speed and the traffic volume the facility carries. At higher traffic volumes, speeds begin to drop as the slowest vehicles in the traffic stream start to impact more vehicles due to limits in the opportunity to pass.
It is assumed that the target speeds of AVs will be programmed to be near the average speeds for a segment in consideration of safety. If the AVs are then going to mirror human operated vehicle behavior, the question becomes whether having AVs in the fleet mix increase or decrease average vehicle speeds, and correspondingly, travel times. Because capacity is likely increasing due to technology, the impact of AVs may be that speeds do not decrease until higher volume levels. However, there is a potential that the AV benefits can only be realized if AVs are given their own separate lanes or if the slowest vehicles are restricted from certain travel lanes.
Microsimulation runs were setup to capture average vehicles speeds across the studied freeway segments. An average travel time can be estimated from the known length of the segment and the average speeds collected. The microsimulation results are provided as average speeds due to the nature of this study not making assumptions about the trip length of vehicles on the freeway segment. However, if a performance threshold were to be set based on user expectations, travel time or the travel time per mile (known as travel rate) could be established through a user survey or synthesis of existing research and surveys on traveler’s value of time.
C.2 - TRAFFIC CAPACITY RESULTS
Existing Conditions The count-based traffic volumes described in the existing model development were simulated. The existing conditions simulation assumed 0% AV traffic because AVs are considered a future technology. The results show that the east side of the state has densities in the LOS C or D range, which would be below the preferable standard of LOS B. This density based indication of vehicle crowding partially confirms the need for improvements to Interstate 80.

Office of Location and Environment Automated Corridors
June 2017
Automated Corridors C9
Future Baseline (2040 No-Build) Conditions Traffic volumes for 2040 No-Build conditions were developed using a growth ratio from comparing 2040 No-Build projected average daily traffic volumes to 2014 existing average daily traffic volumes. No modifications were made to the model geometry or traffic control (i.e., no Interstate 80 widening was assumed in the baseline scenario). For 2040 No-Build conditions, 0% AV traffic was modeled for this scenario to act as a baseline for comparison against the four future AV scenarios.
The results show significant degradation of traffic service at all locations based on density and speed, with traffic performance exhibiting LOS E and LOS F in the study locations east of Des Moines, Iowa. Without improvements to Interstate 80, even rural travel may experience traffic jams due to extreme crowding.
Scenario 1 – Early AV Adopters (2025 25% AV) Traffic volumes for 2025 daily conditions for a six-lane Interstate 80 were estimated by straight-line interpolation between 2014 and forecasted 2040 Build daily volumes. Traffic volumes for 2025 peak hour Build conditions were developed using a growth ratio from comparing 2025 Build projected
average daily traffic volumes to 2014 existing average daily traffic volumes. The design hour volumes were then inflated by the research-based trip increase factor of 1.06 based on 25% AV adoption, Millennial travel behavior and impact of aging population.
Modifications were necessary to turn the existing roadway model into a build condition. An interior, third lane was added to the model and was treated as a passenger car and passenger AV only lane based on the current line of planning for Interstate 80 that would only allow trucks in the right two lanes after Interstate 80 expansion. For the Early AV Adopters scenario, 25% of all simulated vehicles were coded as either AV cars or AV trucks.
The results show the combined effect of widening of Interstate 80 and 25% AV adoption. Compared to existing conditions, speeds are higher in all locations, which would be expected due to the freeway widening. The significance in the context of AV technology is that some early studies have raised the concern that safety-focused early AV operations may lead to overly cautious driving and lower vehicle speeds. At this time, the custom Vissim and underlying research do not suggest a speed drop at lower levels of adoption.
Scenario 2 – Rise of the AVs (2030 50% AV) Traffic volumes for 2030 daily conditions for six-lane Interstate 80 were estimated by straight-line interpolation between 2014 and 2040 Build daily volumes. Traffic volumes for 2030 peak hour Build conditions were developed using a growth ratio from comparing 2030 Build projected average daily traffic
volumes to 2014 existing average daily traffic volumes. The design hour volumes were then inflated by the research-based trip increase factor of 1.14 based on 50% AV adoption, Millennial travel behavior and impact of aging population.
Modifications were necessary to turn the existing roadway model into a build condition. As with Scenario 1, an interior, third lane was added to the model and was treated as a passenger car and passenger AV only lane. For the Rise of the AVs scenario, 50% of all simulated vehicles were coded as either AV cars or AV trucks.

Office of Location and Environment Automated Corridors
June 2017
Automated Corridors C10
The results show that the 5 years of additional traffic growth and induced traffic from the doubling in AV adoption has led to limited increases in average speeds. The spread in speeds between the least congested and most congested segments is less than 1 mph, reflecting that in the Rise of the AVs scenario, traffic is flowing smoothly though more of that traffic is in vehicle platoons.
Scenario 3 – Limited AV Adopters (2040 20% AV) Daily traffic volumes for 2040 Build conditions were developed and provided by Iowa DOT Systems Planning. Traffic volumes for 2040 peak hour Build conditions were developed using a growth ratio comparing 2040 Build projected average daily traffic volumes to 2014 existing average daily traffic
volumes. The design hour volumes were then inflated by the research-based trip increase factor of 1.06 based on 20% AV adoption as the only factor considered.
Modifications were necessary to turn the existing roadway model into a build condition. As with Scenarios 1 and 2, an interior, third lane was added to the model and was treated as a passenger car and passenger AV only lane. For the Limited AV Adopters scenario, 20% of all simulated vehicles were coded as either AV cars or AV trucks.
The results show that 10 additional years of traffic growth since the Rise of the AVs scenario have started a small decline in speeds on the east side of the state. Traffic is more crowded, but only 20% of vehicles can leverage platooning technology to reduce the negative effects of crowding.
Scenario 4 – AV Domination (2040 85% AV) Daily traffic volumes for 2040 Build conditions were developed and provided by Iowa DOT Systems Planning. Traffic volumes for 2040 peak hour Build conditions were developed using a growth ratio from comparing 2040 Build projected average daily traffic volumes to 2014 existing average daily traffic
volumes. The design hour volumes were then inflated by the research-based trip increase factor of 1.19 based on 85% AV adoption, impact of aging population, and Millennial travel behavior.
Modifications were necessary to turn the existing roadway model into a build condition. As with the previous three scenarios, an interior, third lane was added to the model and was treated as a passenger car and passenger AV only lane. For the AV Domination scenario, 85% of all simulated vehicles were coded as either AV cars or AV trucks.
The results show that speeds have stayed nearly constant to the Rise of the AVs scenario even though the analysis periods are 10 years apart. The growth in vehicle crowding (demand-to-capacity ratio) in that last 10 years is obvious, but most vehicles are AV in this scenario, so crowding is a limited concern. The AV Domination scenario results indicate a trend that traffic operations appear stable well beyond the traditional traffic breakdown point.
Conclusions/Comparison of Scenarios Results from the existing conditions simulation, future 2040 No-Build simulation, and the four scenarios are summarized in Tables C.4 through C.8 providing focus on contrasts between the varying scenarios for individual segments. Density is shown for all scenarios for reference.

Office of Location and Environment Automated Corridors
June 2017
Automated Corridors C11
Table C.4. Summary of Segment Results – Segment 1
Eastbound / Westbound
Volume (passenger
car equivalents)
AV % Average Speed (mph)
Average Density
(passenger car / mile / lane)
Demand to Capacity Ratio
Existing 1,395 / 1,395 0% 66.4 / 66.3 19.2 / 19.7 0.29 / 0.29
2025 Scenario 1 Early AV Adopters 1,735 / 1,735 25% 67.4 / 67.3 23.5 / 24.0 0.23 / 0.23
2030 Scenario 2 Rise of the AVs 1,990 / 1,990 50% 67.3 / 67.3 27.0 / 27.6 0.25 / 0.25
2040 No-Build 1,930 / 1,935 0% 65.2 / 65.1 27.1 / 27.8 0.40 / 0.40
2040 Scenario 3 Limited AV Adopters 2,085 / 2,085 20% 67.2 / 67.1 28.2 / 28.9 0.28 / 0.28
2040 Scenario 4 AV Domination 2,340 / 2,340 85% 67.3 / 67.3 31.7 / 32.3 0.26 / 0.26
Notes: automated vehicle (AV); miles per hour (mph)
Volumes through Segment 1 (Table C.4) and Segment 2 (Table C.5) are lower than the other three segments, between 20% and 40% of available capacity and speeds see an increase over existing in all four build scenarios. For these segments, the widening of Interstate 80 has a much larger impact on the demand-to-capacity ratio than AV technology based on a comparison of the No-Build, Limited AV Adopters, and AV Domination scenarios that share the common analysis year of 2040.
Table C.5. Summary of Segment Results – Segment 2
Eastbound / Westbound
Volume (passenger
car equivalents)
AV % Average Speed (mph)
Average Density
(passenger car / mile / lane)
Demand to Capacity Ratio
Existing 1,240 / 1,220 0% 66.7 / 66.7 16.7 / 16.9 0.26 / 0.25
2025 Scenario 1 Early AV Adopters 1,580 / 1,555 25% 67.4 / 67.4 21.1 / 21.0 0.21 / 0.21
2030 Scenario 2 Rise of the AVs 1,830 / 1,795 50% 67.3 / 67.4 24.5 / 24.3 0.23 / 0.23
2040 No-Build 1,790 / 1,760 0% 65.6 / 65.7 24.5 / 24.5 0.37 / 0.37
2040 Scenario 3 Limited AV Adopters 1,940 / 1,905 20% 67.2 / 67.2 25.9 / 25.9 0.26 / 0.26
2040 Scenario 4 AV Domination 2,175 / 2,140 85% 67.3 / 67.4 29.1 / 29.0 0.24 / 0.23
Notes: automated vehicle (AV); miles per hour (mph)

Office of Location and Environment Automated Corridors
June 2017
Automated Corridors C12
Table C.6. Summary of Segment Results – Segment 3
Eastbound / Westbound
Volume (passenger
car equivalents)
AV % Average Speed (mph)
Average Density
(passenger car / mile / lane)
Demand to Capacity
Ratio
Existing 1,535 / 1,630 0% 66.2 / 65.6 21.8 / 23.8 0.32 / 0.34
2025 Scenario 1 Early AV Adopters 2,105 / 2,240 25% 67.2 / 67.2 29.5 / 32.1 0.28 / 0.30
2030 Scenario 2 Rise of the AVs 2,500 / 2,660 50% 67.2 / 67.1 35.0 / 38.1 0.31 / 0.33
2040 No-Build 2,295 / 2,440 0% 64.4 / 63.6 33.4 / 36.9 0.48 / 0.51
2040 Scenario 3 Limited AV Adopters 2,760 / 2,935 20% 66.8 / 66.6 38.9 / 42.4 0.38 / 0.40
2040 Scenario 4 AV Domination 3,100 / 3,295 85% 67.0 / 67.0 43.6 / 47.2 0.34 / 0.36
Notes: automated vehicle (AV); miles per hour (mph)
Segment 3 (Table C.6) experiences traffic volumes between 25% and 50% of available capacity. This segment exhibits higher levels of vehicle crowding in existing conditions than Segments 1 and 2 west of Des Moines. Further, this segment experiences more rapid growth than the segments on the west half of the state, which suggests a more pressing need for improvements to Interstate 80 in this part of the corridor. The Interstate 80 widening provides a major improvement in this segment, by decreasing the demand-to-capacity ratio by 10%. The influence of high-levels of AV adoption is an additional 4% decrease in demand-to-capacity ratio and average speeds higher than existing conditions.
Table C.7. Summary of Segment Results – Segment 4
Eastbound / Westbound
Volume (passenger
car equivalents)
AV % Average Speed (mph)
Average Density
(passenger car / mile / lane)
Demand to Capacity Ratio
Existing 1,795 / 1,845 0% 65.7 / 65.4 25.9 / 27.1 0.37 / 0.38
2025 Scenario 1 Early AV Adopters 2,480 / 2,550 25% 67.1 / 67.0 35.2 / 36.6 0.33 / 0.34
2030 Scenario 2 Rise of the AVs 2,950 / 3,035 50% 67.0 / 66.9 41.9 / 43.6 0.37 / 0.38
2040 No-Build 2,690 / 2,770 0% 63.2 / 62.9 40.4 / 42.3 0.56 / 0.57
2040 Scenario 3 Limited AV Adopters 3,265 / 3,360 20% 66.5 / 66.3 46.8 / 48.7 0.44 / 0.46
2040 Scenario 4 AV Domination 3,665 / 3,770 85% 66.9 / 66.9 52.2 / 54.2 0.40 / 0.41
Notes: automated vehicle (AV); miles per hour (mph)

Office of Location and Environment Automated Corridors
June 2017
Automated Corridors C13
Segment 4 (Table C.7) and Segment 5 (Table C.8) experience traffic volumes between 33% and 65% of available capacity. This is the highest of the five study segments. The Interstate 80 widening provides a major improvement in these segments, by decreasing the demand-to-capacity ratio by 6% to 12%. The influence of high-levels of AV adoption is an additional 4% to 6% decrease in demand-to-capacity ratio and average speeds higher than existing conditions.
Segments 4 and 5 represent locations that may have required widening from six lanes to eight lanes to accommodate traffic density thresholds customary for freeway planning. The segment’s simulated speeds at low levels of automation (Limited AV Adopters) still show high freeway speeds even though densities have reached an unacceptable LOS. The project team recommends a six-lane freeway section for all five studied segments, including Segment 5, for the 2040 design year.
Compared to the lower-volume Segments 1 through 4, the Segment 5 results indicate a higher level of benefit of AV adoption in highly congested or crowded corridors. Future study may provide more detail on how beneficial AV can be within a freeway corridor with more congestion or under unimproved conditions. A visual comparison of the traffic behavior with and without AV is found in Figures C.4 and C.5.
Figure C.4. Interstate 80 without Automated Vehicles – Example from Segment 5
Figure C.5. Interstate 80 with Automated Vehicles – Example from Segment 5

Office of Location and Environment Automated Corridors
June 2017
Automated Corridors C14
Table C.8. Summary of Segment Results – Segment 5
Eastbound / Westbound
Volume (passenger
car equivalents)
AV % Average Speed (mph)
Average Density
(passenger car / mile / lane)
Demand to Capacity Ratio
Existing 2,030 / 1,800 0% 65.4 / 65.7 28.1 / 24.9 0.42 / 0.37
2025 Scenario 1 Early AV Adopters 3,005 / 2,660 25% 66.8 / 66.6 40.6 / 36.5 0.41 / 0.36
2030 Scenario 2 Rise of the AVs 3,645 / 3,230 50% 66.6 / 66.6 49.5 / 44.4 0.46 / 0.40
2040 No-Build 3,150 / 2,785 0% 62.3 / 63.4 45.8 / 40.1 0.65 / 0.58
2040 Scenario 3 Limited AV Adopters
4,165 / 3,685 20% 65.8 / 65.7 57.1 / 51.2 0.57 / 0.50
2040 Scenario 4 AV Domination 4,675 / 4,140 85% 66.7 / 66.6 63.3 / 56.6 0.51 / 0.45
Notes: automated vehicle (AV); miles per hour (mph)
Overall, the traffic capacity analysis identified several key elements of the challenges facing Interstate 80 and concerning AV operations in mixed traffic with manually operated vehicles.
1. The existing conditions analysis for Interstate 80 showed average traffic speeds decreasing based on increasing traffic density. Because AV technology is not expected to reach high levels of adoption for more than a decade, a more traditional capacity improvement is necessary to improve the operations on Interstate 80, particularly from the Iowa City area to Iowa’s eastern border.
2. The evaluation of low adoption levels of AV in mixed traffic with manual vehicles shows that the introduction of AVs leads to higher average speeds due to more free space for the manual vehicles and harmonized speeds between AVs.
3. The high levels of AV adoption show the extreme benefit of high speeds even in very crowded conditions due to the 26% capacity gain per lane identified at 85% AV adoption.
Collectively, these findings suggest Iowa DOT can experience major traffic operational improvements on Interstate 80 through enabling the Interstate 80 corridor to support AV.

Office of Location and Environment Automated Corridors
June 2017
Automated Corridors D1
Appendix D – Corridor Safety Methodology and Results
D.1 - METHODOLOGY This section describes the methodology used to assess the impact of the four AV scenarios on safety. Two sections of rural Interstate 80 in Iowa were selected for the analysis. Historic crash data, recent AV safety research and newly released safety performance functions for Iowa interstates were used to forecast the expected crashes for each of the future scenarios. Predictions were also developed for no AV adoption conditions for comparison purposes.
Interstate 80 Study Segments The safety evaluation considered the impact of AV adoption on two typical rural segments of Interstate 80; one in the western part of the state near the Interstate 80 and Interstate 680 interchange (Segment 1) and the other in the eastern part of the state east of Iowa City (Segment 5). Segment 1 is located in Pottawatomie County between L66 (335th Street) and M16 (385th Street). It is 4.2 miles long and generally straight, with limited elevation change. It contains two bridges, but no interchange ramps. It contains a truck rest area in each direction (without facilities). Based on data from the Iowa DOT Office of Systems Planning, the 2014 average annual daily traffic (AADT) on this segment is 23,500 with 37% trucks.
Segment 5 is located in Cedar County between X40 (Garfield Ave) and X46 (Atalissa Road). This segment is 4.7 miles long and has some horizontal curvature with limited elevation change. This segment contains a cable median barrier, which was installed in 2011. There are no ramps or interchanges within the segment. Based on data from the Iowa DOT Office of Systems Planning, the 2014 AADT on this segment is 33,500 with 37% trucks.
Safety Performance Functions Safety performance functions (SPFs) were used to predict the number of crashes on the two study segments. Initially, the team considered using the equations published in the Highway Safety Manual (HSM) 2014 Supplement; however, Iowa State University (ISU) recently developed SPFs specifically for the Iowa interstate highway system. The new ISU equations were used for this study to facilitate compatibility with future work in the Interstate 80 corridor.
A test was conducted to compare the ISU crash predictions with historical crash data for 2011 through 2015. The test showed that the ISU method resulted in crash predictions that were within approximately 8% of the observed total crashes for the two segments and within 33% for the observed fatal and major injury crashes (which is a much smaller and harder to predict number).
The ISU team developed several interstate SPFs. For this project, the SPF for total crashes and the SPF for fatal and major injury crashes were used. The fatal and major injury categories correspond to the Fatal (K) and Incapacitating Injury (A) categories in the KABCO crash classification system (K = Killed, A = Injury-incapacitating, B = Non-incapacitating Injury; C = Possible Injury; O = Property Damage Only). The form and variables included in these two equations are shown below. The site specific constant takes into account the unique physical characteristics of each analysis segment. Segments 1 and 5 were composed of several smaller ISU equation sections. The results from these smaller sections were aggregated to yield the number of total crashes and number of fatal and major injury crashes for each safety analysis segment.

Office of Location and Environment Automated Corridors
June 2017
Automated Corridors D2
Iowa Interstate Safety Performance Function: Total Crashes
𝑒𝑒�−0.22+0.27∗ln(𝑉𝑉𝑉𝑉𝑉𝑉)+0.22∗𝑉𝑉𝐿𝐿+0.14∗𝑀𝑀𝑀𝑀−0.19∗ln(𝑀𝑀𝑀𝑀)−0.06∗𝑆𝑆𝑀𝑀+0.51∗𝑆𝑆𝑆𝑆𝑆𝑆+𝑢𝑢𝑝𝑝𝑝𝑝𝑝𝑝𝑠𝑠𝑣𝑣� ∗ 𝐿𝐿𝑒𝑒𝐿𝐿𝐿𝐿𝐿𝐿ℎ
VOL = AADT/2 (vehicles/day) LN = Lanes (1 if ≥ 6, otherwise 0) MT = Median Type (1 if barrier present, otherwise 0) MW = Median Width (width in feet) ST = Surface Type (1 if concrete drive surface, otherwise 0) SPD = Speed Limit (1if <70 mph, otherwise 0) uplusv = segment specific constant Length = Segment Length (miles)
Iowa Interstate Safety Performance Function: Fatal and Major Injury Crashes
𝑒𝑒�−0.1−0.07∗ln(𝑉𝑉𝑉𝑉𝑉𝑉)+0.18∗𝑉𝑉𝐿𝐿−0.12∗𝑀𝑀𝑀𝑀−0.25∗ln(𝑀𝑀𝑀𝑀)+0.32∗𝑆𝑆𝑆𝑆𝑆𝑆+𝑢𝑢𝑝𝑝𝑝𝑝𝑝𝑝𝑠𝑠𝑣𝑣� ∗ 𝐿𝐿𝑒𝑒𝐿𝐿𝐿𝐿𝐿𝐿ℎ
VOL = AADT/2 (vehicles/day) LN = Lanes (1 if ≥ 6, otherwise 0) MT = Median Type (1 if barrier present, otherwise 0) MW = Median Width (width in feet) SPD = Speed Limit (1if <70 mph, otherwise 0) uplusv = segment specific constant Length = Segment Length (miles)
Two adjustments were made to the crash predictions for the two analysis segments. First, the ISU equations predicted a higher number of crashes for six-lane freeways compared to four-lane freeways, when all other factors remain constant. This result is likely due to the grouping of rural and urban freeway segments of various volumes in the development of the SPFs. It was decided in coordination with Iowa DOT staff that the four-lane results would be used, because, based on other research, an increase to six-lanes in these rural areas was not expected by itself to increase the number of crashes. Also, the equations developed for Segment 5 assumed no barrier; however, a cable median barrier was installed in 2011. Therefore the results assume a cable median barrier.
AV Safety Research and Crash Modification Factors Recent research related to AV safety was examined and a recent research document was identified, which showed promise for predicting the safety benefits of AV safety technologies: Implications of Connected and Automated Vehicles on the Safety and Operations of Roadway Networks: A Final Report (Kockelman, Avery, Bansal et al. 2016). This report used the 2013 National Automotive Sampling System (NASS) General Estimates System (GES) crash database and mapped pre-crash events to specific safety technologies.

Office of Location and Environment Automated Corridors
June 2017
Automated Corridors D3
The AV safety technologies in the research cover applications such as Forward Collision Warning (FCW), Cooperative Adaptive Cruise Control (CACC), and Lane Change Warning (LCW) as illustrated in Figure D.1. A FCW “system has forward-looking vehicle detection capability, using sensing technologies such as cameras, radar, and Lidar. Sensor data are processed and analyzed, and alerts are provided if a collision with another vehicle is imminent.” When combined with automatic electronic braking (AEB) and/or automated steering this system could slow or stop a vehicle or shift it laterally; thereby reducing many common crash types such as rear-end crashes (Kockleman, Avery, Bansal et al. 2016 pgs. 7 and 79).
CACC is a system that involves vehicles communicating with other vehicles behind them regarding speed and lane assignment. The technology can improve both safety and traffic flow. The safety benefits are due in part to the ability to communicate and act on that communication nearly instantaneously. The brake reaction time for a CACC equipped vehicle following another CACC equipped vehicle has been estimated at 0.1 second. This is substantially faster than the fastest human brake reaction time of 0.47 second (Kockleman, Avery, Bansal et al. 2016 pg. 9).
LCW and Lane Departure Warning (LDW) technologies use sensors to detect the position and trajectory of surrounding vehicles and will warn the driver and/or take action if another vehicle poses a safety threat. It will also warn the driver and/or take action if the subject vehicle itself is leaving its current lane in a manner that presents a safety threat. This technology is related to blind-spot monitoring and has the potential to reduce many common multi-vehicle crashes. The Road Departure Crash Warning (RDCW) technology has similarities to the LDW system and is important for reducing many single-vehicle crashes. The RDCW system could be very benefit rural interstates such as the two segments of Interstate 80 evaluated in this study.
Table D.1 shows which rural freeway-related pre-crash events were mapped to each of the safety technologies. For example, on Segment 5 there were 25 crashes that were identified as “ran off road – straight” crashes. These crashes were mapped to the RDCW and Lane-Keeping Assistance (LKA) technologies, which would have engaged if present to attempt to prevent those crashes. On Segment 1 there were 21 animal crashes. Those crashes were mapped to the AEB and Electronic Stability Control (ESC) technologies that would have engaged to attempt to prevent those crashes. While the crash mapping in the Kockelman, Avery, Bansal et al. 2016 study was completed using light-duty vehicle crashes only, the results were applied to all crashes in this Interstate 80 study. Non rural freeway pre-crash events such as running a red light or pedalcyclist crashes have been removed to simplify the table.
Figure D.1. Automated Vehicle Safety Technologies
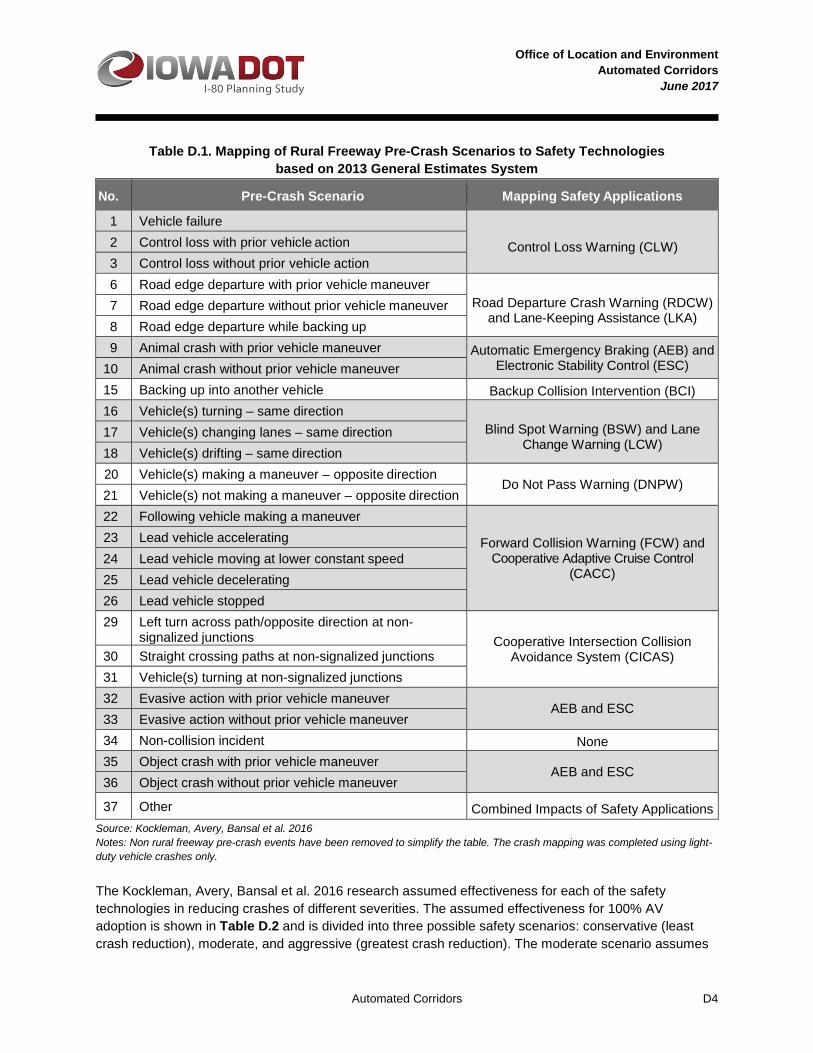
Office of Location and Environment Automated Corridors
June 2017
Automated Corridors D4
Table D.1. Mapping of Rural Freeway Pre-Crash Scenarios to Safety Technologies based on 2013 General Estimates System
No. Pre-Crash Scenario Mapping Safety Applications
1 Vehicle failure
Control Loss Warning (CLW) 2 Control loss with prior vehicle action 3 Control loss without prior vehicle action 6 Road edge departure with prior vehicle maneuver
Road Departure Crash Warning (RDCW) and Lane-Keeping Assistance (LKA)
7 Road edge departure without prior vehicle maneuver 8 Road edge departure while backing up 9 Animal crash with prior vehicle maneuver Automatic Emergency Braking (AEB) and
Electronic Stability Control (ESC) 10 Animal crash without prior vehicle maneuver 15 Backing up into another vehicle Backup Collision Intervention (BCI) 16 Vehicle(s) turning – same direction
Blind Spot Warning (BSW) and Lane Change Warning (LCW)
17 Vehicle(s) changing lanes – same direction 18 Vehicle(s) drifting – same direction 20 Vehicle(s) making a maneuver – opposite direction
Do Not Pass Warning (DNPW) 21 Vehicle(s) not making a maneuver – opposite direction 22 Following vehicle making a maneuver
Forward Collision Warning (FCW) and Cooperative Adaptive Cruise Control
(CACC)
23 Lead vehicle accelerating 24 Lead vehicle moving at lower constant speed 25 Lead vehicle decelerating 26 Lead vehicle stopped 29 Left turn across path/opposite direction at non-
signalized junctions Cooperative Intersection Collision Avoidance System (CICAS) 30 Straight crossing paths at non-signalized junctions
31 Vehicle(s) turning at non-signalized junctions 32 Evasive action with prior vehicle maneuver
AEB and ESC 33 Evasive action without prior vehicle maneuver 34 Non-collision incident None 35 Object crash with prior vehicle maneuver
AEB and ESC 36 Object crash without prior vehicle maneuver
37 Other Combined Impacts of Safety Applications Source: Kockleman, Avery, Bansal et al. 2016 Notes: Non rural freeway pre-crash events have been removed to simplify the table. The crash mapping was completed using light-duty vehicle crashes only.
The Kockleman, Avery, Bansal et al. 2016 research assumed effectiveness for each of the safety technologies in reducing crashes of different severities. The assumed effectiveness for 100% AV adoption is shown in Table D.2 and is divided into three possible safety scenarios: conservative (least crash reduction), moderate, and aggressive (greatest crash reduction). The moderate scenario assumes
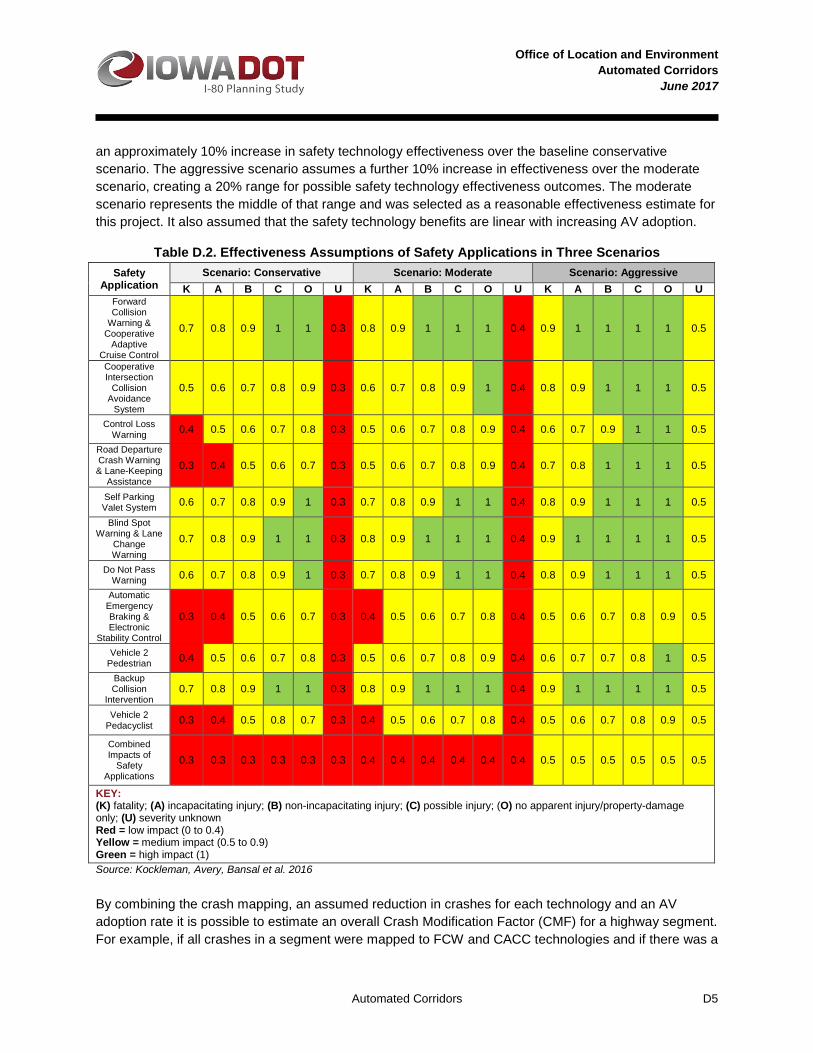
Office of Location and Environment Automated Corridors
June 2017
Automated Corridors D5
an approximately 10% increase in safety technology effectiveness over the baseline conservative scenario. The aggressive scenario assumes a further 10% increase in effectiveness over the moderate scenario, creating a 20% range for possible safety technology effectiveness outcomes. The moderate scenario represents the middle of that range and was selected as a reasonable effectiveness estimate for this project. It also assumed that the safety technology benefits are linear with increasing AV adoption.
Table D.2. Effectiveness Assumptions of Safety Applications in Three Scenarios Safety
Application Scenario: Conservative Scenario: Moderate Scenario: Aggressive
K A B C O U K A B C O U K A B C O U Forward Collision
Warning & Cooperative
Adaptive Cruise Control
0.7 0.8 0.9 1 1 0.3 0.8 0.9 1 1 1 0.4 0.9 1 1 1 1 0.5
Cooperative Intersection
Collision Avoidance
System
0.5 0.6 0.7 0.8 0.9 0.3 0.6 0.7 0.8 0.9 1 0.4 0.8 0.9 1 1 1 0.5
Control Loss Warning 0.4 0.5 0.6 0.7 0.8 0.3 0.5 0.6 0.7 0.8 0.9 0.4 0.6 0.7 0.9 1 1 0.5
Road Departure Crash Warning & Lane-Keeping
Assistance
0.3 0.4 0.5 0.6 0.7 0.3 0.5 0.6 0.7 0.8 0.9 0.4 0.7 0.8 1 1 1 0.5
Self Parking Valet System 0.6 0.7 0.8 0.9 1 0.3 0.7 0.8 0.9 1 1 0.4 0.8 0.9 1 1 1 0.5
Blind Spot Warning & Lane
Change Warning
0.7 0.8 0.9 1 1 0.3 0.8 0.9 1 1 1 0.4 0.9 1 1 1 1 0.5
Do Not Pass Warning 0.6 0.7 0.8 0.9 1 0.3 0.7 0.8 0.9 1 1 0.4 0.8 0.9 1 1 1 0.5
Automatic Emergency Braking & Electronic
Stability Control
0.3 0.4 0.5 0.6 0.7 0.3 0.4 0.5 0.6 0.7 0.8 0.4 0.5 0.6 0.7 0.8 0.9 0.5
Vehicle 2 Pedestrian 0.4 0.5 0.6 0.7 0.8 0.3 0.5 0.6 0.7 0.8 0.9 0.4 0.6 0.7 0.7 0.8 1 0.5
Backup Collision
Intervention 0.7 0.8 0.9 1 1 0.3 0.8 0.9 1 1 1 0.4 0.9 1 1 1 1 0.5
Vehicle 2 Pedacyclist 0.3 0.4 0.5 0.8 0.7 0.3 0.4 0.5 0.6 0.7 0.8 0.4 0.5 0.6 0.7 0.8 0.9 0.5
Combined Impacts of
Safety Applications
0.3 0.3 0.3 0.3 0.3 0.3 0.4 0.4 0.4 0.4 0.4 0.4 0.5 0.5 0.5 0.5 0.5 0.5
KEY: (K) fatality; (A) incapacitating injury; (B) non-incapacitating injury; (C) possible injury; (O) no apparent injury/property-damage only; (U) severity unknown Red = low impact (0 to 0.4) Yellow = medium impact (0.5 to 0.9) Green = high impact (1) Source: Kockleman, Avery, Bansal et al. 2016
By combining the crash mapping, an assumed reduction in crashes for each technology and an AV adoption rate it is possible to estimate an overall Crash Modification Factor (CMF) for a highway segment. For example, if all crashes in a segment were mapped to FCW and CACC technologies and if there was a

Office of Location and Environment Automated Corridors
June 2017
Automated Corridors D6
50% AV adoption, then using the moderate scenario a 40% reduction in fatal crashes, 45% reduction in major injury crashes, and a 50% reduction in all other crashes would be expected. This same approach can be used for all crash causes/technologies and severities to yield a total crash reduction CMF, which can be applied to the predicted crashes for each analysis scenario.
Crash/Technology Mapping and CMFs for Interstate 80 The process used above was applied to the two Interstate 80 study segments studied for safety. The Iowa crash data did not have the exact same pre-crash event information; however, the crash causation information provided a reasonable proxy. Table D.3 shows how the Interstate 80 crash data was mapped to a pre-crash scenario and thereby to a safety application. By using this process the majority of all observed crashes in both segments over the 5-year, 2011 to 2015, time period could be mapped to a technology. For Segment 1, 64 of 69 crashes were mapped to a technology, with 5 unassigned. For Segment 5, 128 of 139 crashes were mapped to a technology, with 11 unassigned. The most common crash causes on the two study segments were: animals, ran-off-road (straight road), swerving/evasive action, following too close, crossed center line, lost control and driving too fast for conditions.
Table D.3. Crash Mapping Major Cause Pre-Crash Scenario Safety Application
Followed too close Leading vehicle/following vehicle actions FCW and CACC
Driving too fast for conditions Loss of control/vehicle failure CLW Lost control Loss of control/vehicle failure CLW Equipment failure Loss of control/vehicle failure CLW Crossed centerline Road edge departure RDCW and LKA Crossed median Road edge departure RDCW and LKA Ran off road – straight Road edge departure RDCW and LKA Ran off road – left Road edge departure RDCW and LKA Illegally parked/unattended Road edge departure RDCW and LKA Failed to yield right-of-way Lane change/drifting BSW and LCW Improper or erratic lane changing Lane change/drifting BSW and LCW Animal Animal AEB and ESC Driver distraction: reaching for object(s) Evasive action AEB and ESC
Driver distraction: inattentive Evasive action AEB and ESC Over correcting/over steering Evasive action AEB and ESC Swerving/evasive action Evasive Action AEB and ESC Improper backing Backing BCI Key: FCW and CACC – Forward Collision Warning and Cooperative Adaptive Cruise Control CLW – Control Loss Warning RDCW and LKA – Road Departure Crash Warning and Lane-Keeping Assistance BSW and LCW – Blind Spot Warning and Lane Change Warning AEB and ESC – Automatic Emergency Braking and Electronic Stability Control BCI – Backup Collision Intervention

Office of Location and Environment Automated Corridors
June 2017
Automated Corridors D7
The CMFs that resulted from the Interstate 80 crash mapping and then assigning a crash reduction factor by severity (using the moderate category from the Kockelman, Avery, Bansal et al. 2016 research) resulted in the CMFs shown in Table D.4 and Figures D.2 and D.3.
Table D.4 Resulting Crash Modification Factors by Scenario for Each Segment
Segment Scenario Year AV Adoption
Crash Reduction by Severity K and A B and C O Total
Segment 1
1: Early AV Adopters 2025 25% 15.0% 16.4% 20.1% 19.3% 2: Rise of the AVs 2030 50% 30.0% 32.9% 40.2% 38.6% 3: Limited AV Adopters 2040 20% 12.0% 13.1% 16.1% 15.4% 4: AV Domination 2040 85% 51.0% 55.9% 68.3% 65.5%
Segment 5
1: Early AV Adopters 2025 25% 13.8% 18.2% 19.9% 19.5% 2: Rise of the AVs 2030 50% 27.5% 36.4% 39.8% 39.0% 3: Limited AV Adopters 2040 20% 11.0% 14.6% 15.9% 15.6% 4: AV Domination 2040 85% 46.8% 61.9% 67.7% 66.2%
Notes: AV = automated vehicle; K=Fatal; A=Incapacitating Injury; B=Non-incapacitating Injury; C=Possible Injury; O=Property Damage Only
Figure D.2. Crash Reductions by Scenario and Severity – Segment 1
0%
10%
20%
30%
40%
50%
60%
70%
80%
Scenario 1 Early AVAdopters (25% AV)
Scenario 2 Rise of theAVs (50% AV)
Scenario 3 Limited AVAdopters (20% AV)
Scenario 4 AVDomination (85% AV)
Fatal & MajorInjury Crashes
Minor & PossibleInjury Crashes
Property DamageOnly Crashes
Total Crashes

Office of Location and Environment Automated Corridors
June 2017
Automated Corridors D8
Figure D.3. Crash Reductions by Scenario and Severity – Segment 5
AV CMF Validation As a validation check for the above analysis, a second recent research document was used: The Potential Benefits and Cost of Connected and Automated Vehicles: A Texas Case Study (Kim, Pourrahmani and Fagnant 2016.). This paper documented the expected statewide crash reduction in Texas based on a different crash reduction methodology from the prior report. These authors assumed crash reduction factors by general crash causes and increased the reduction as AV adoption increased. The predicted crash reduction results from this paper are presented in Figure D.4 along with the average value for the two Interstate 80 segment results. As shown, the predicted Interstate 80 crash reduction numbers are similar to the comparison values at a 25% AV adoption level and below the comparison values at the 85% AV adoption level. These results are due in part to the increased reduction applied at high AV adoption levels in the comparison research. Differences could also be due to several other factors such as the rural nature of the Interstate 80 corridor, the use of the moderate reduction estimate, or the fact that a portion of the crashes could not be easily mapped to a specific technology. Overall, this comparison appears to indicate the Interstate 80 analysis yields reasonable, yet conservative crash reductions by applying the Kockelman, Avery, Basal et al. 2016 methodology.
0%
10%
20%
30%
40%
50%
60%
70%
80%
Scenario 1 EarlyAV Adopters (25%
AV)
Scenario 2 Rise ofthe AVs (50% AV)
Scenario 3 LimitedAV Adopters (20%
AV)
Scenario 4 AVDomination (85%
AV)
Fatal & Major InjuryCrashes
Minor & Possible InjuryCrashes
Property Damage OnlyCrashes
Total Crashes

Office of Location and Environment Automated Corridors
June 2017
Automated Corridors D9
Figure D.4. AV Crash Reduction Validation
Smart Truck Parking A second set of CMFs were applied for the proposed Smart Truck Parking project that is being implemented in Iowa and several other Midwestern states. Smart Truck Parking is a system that uses road signs, smartphone apps, websites, and messaging to inform truck drivers of parking availability in real time. Access to this information will allow truck drivers to better plan their trips and find a place to rest when they are tired. Smart Truck Parking is intended to reduce crashes related to driver fatigue. Several background documents were examined to determine the most appropriate CMF for this improvement. The value selected was an 8% crash reduction applied to all crashes involving a heavy truck (tractor trailers). This value is in line with the overall trend of the data on this topic.
While the 8% CMF was applied to all crashes with one of more trucks involved, it was reduced to account for the percentage of trucks assumed to be automated. Therefore, as the AV adoption increased, the Smart Truck Parking benefit decreased. The benefit also differed for the two analysis segments because the percent of crashes that involved heavy trucks differed between the two segments, with Segment 1 having a higher percentage of truck involved crashes (32%) compared to Segment 5 (18%). The resulting crash modification factors by scenario and AV adoption are shown in Figure D.5.
0%
10%
20%
30%
40%
50%
60%
70%
80%
90%
100%
0% 10% 20% 30% 40% 50% 60% 70% 80% 90% 100%
Cra
sh R
educ
tion
AV Adoption
Comparison Total Crash Reduction
Comparison Fatal & Injury Reduction
I-80 Study Total Crash Reduction
I-80 Study Fatal & Major Injury Crash Reduction
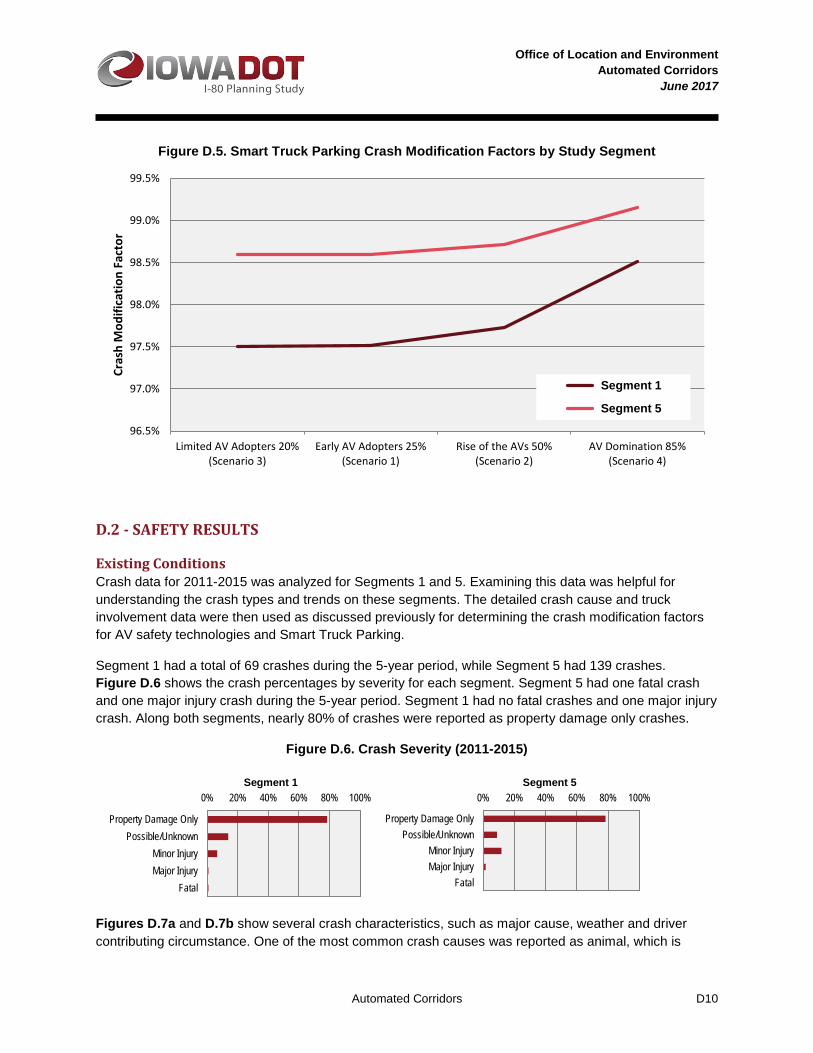
Office of Location and Environment Automated Corridors
June 2017
Automated Corridors D10
Figure D.5. Smart Truck Parking Crash Modification Factors by Study Segment
D.2 - SAFETY RESULTS
Existing Conditions Crash data for 2011-2015 was analyzed for Segments 1 and 5. Examining this data was helpful for understanding the crash types and trends on these segments. The detailed crash cause and truck involvement data were then used as discussed previously for determining the crash modification factors for AV safety technologies and Smart Truck Parking.
Segment 1 had a total of 69 crashes during the 5-year period, while Segment 5 had 139 crashes. Figure D.6 shows the crash percentages by severity for each segment. Segment 5 had one fatal crash and one major injury crash during the 5-year period. Segment 1 had no fatal crashes and one major injury crash. Along both segments, nearly 80% of crashes were reported as property damage only crashes.
Figure D.6. Crash Severity (2011-2015) Segment 1 Segment 5
Figures D.7a and D.7b show several crash characteristics, such as major cause, weather and driver contributing circumstance. One of the most common crash causes was reported as animal, which is
96.5%
97.0%
97.5%
98.0%
98.5%
99.0%
99.5%
Limited AV Adopters 20%(Scenario 3)
Early AV Adopters 25%(Scenario 1)
Rise of the AVs 50%(Scenario 2)
AV Domination 85%(Scenario 4)
Cras
h M
odifi
catio
n Fa
ctor
Safety West
Safety East
0% 20% 40% 60% 80% 100%
FatalMajor InjuryMinor Injury
Possible/UnknownProperty Damage Only
0% 20% 40% 60% 80% 100%
FatalMajor InjuryMinor Injury
Possible/UnknownProperty Damage Only
Segment 1
Segment 5

Office of Location and Environment Automated Corridors
June 2017
Automated Corridors D11
consistent with the rural nature of the segments, and Segment 1 in particular. Other commonly reported causes include ran off road – straight and swerving/evasive action, which are both common crash types for high-speed, limited-access facilities such as Interstate 80. The majority of crashes occurred during clear weather conditions; however, snow-related crashes were also common. Given the amount of snow typically experienced in this area, these snow-related crashes are not unexpected.
In many of the crashes, there was no improper action reported as a contributing circumstance on the part of the first driver (and often only driver) listed as involved in the crash (42% on Segment 1 and 27% on Segment 5). This correlates well with the high percentage of animal and snow-related crashes. The next most common first driver contributing circumstance provided for both analysis segments was the driver lost control (33% west, 39% east). Following too closely and driving too fast for conditions were also near the top of the contributing circumstances reported; although the percentages for those were much lower (10% or less for both segments).
The 69 crashes that occurred on Segment 1 involved a total of 93 vehicles. Of those 93 vehicles, 62% were passenger cars, pick-up trucks, passenger vans, or sport utility vehicles; 26% were tractor-trailers; 6% were motorcycles; and the remaining 6% were other vehicles types. The 139 crashes in Segment 5 involved 186 vehicles. Of those 186 vehicles, 82% were passenger cars, pick-up trucks, passenger vans, or sport utility vehicles; 14% were tractor-trailers or bob-tails; and the remaining 4% were other vehicle types or unreported.
The crash rate (crashes per 100 million vehicle miles travelled [VMT]) for Segment 1 was calculated to be 38.6 for the period from 2011-2015. Along Segment 5 the crash rate was higher, at 49.2 for the 5-year period. Both of these rates are below the statewide average rate for rural interstates, which is 50.0 for the period from 2010-2014, which is the most recent statewide data available. The fatal and major injury crash rate was also calculated. For Segment 1 that rate was calculated to be 0.56, while the rate for Segment 5 was 0.71. Both of these fatal and major injury rates are below the statewide rate of 1.59 for the 5-year period.

Office of Location and Environment Automated Corridors
June 2017
Automated Corridors D12
Figure D.7a. Crash Characteristics Segment 1 Segment 5
Maj
or C
ause
Wea
ther
0% 10% 20% 30% 40%
Animal
Ran off road - straight
Swerving/Evasive Action
Driving too fast for conditions
Lost Control
Followed too close
Crossed centerline (undivided)
Unknown
Other (explain in narrative): Other
Ran off road - left
Over correcting/over steering
Other (explain in narrative): Noimproper action
Failed to Yield Right-of-Way
Crossed median (divided)
Equipment failure
Driver Distraction: Reaching forobject(s)/fallen object(s)
Improper or erratic lane changing
Improper Backing
Driver Distraction: Inattentive/lost inthought
Illegally Parked/Unattended
0% 10% 20% 30% 40%
Animal
Ran off road - straight
Swerving/Evasive Action
Driving too fast for conditions
Lost Control
Followed too close
Crossed centerline (undivided)
Unknown
Other (explain in narrative): Other
Ran off road - left
Over correcting/over steering
Other (explain in narrative): No improperaction
Failed to Yield Right-of-Way
Crossed median (divided)
Equipment failure
Driver Distraction: Reaching forobject(s)/fallen object(s)
Improper or erratic lane changing
Improper Backing
Driver Distraction: Inattentive/lost inthought
Illegally Parked/Unattended
0% 10% 20% 30% 40%
Clear
Not Reported
Snow
Cloudy
Rain
Freezing rain/drizzle
Severe winds
Sleet, hail
Blowing sand, soil, dirt
Fog, smoke, smog
Blowing snow
0% 10% 20% 30% 40%
Clear
Not Reported
Snow
Cloudy
Rain
Freezing rain/drizzle
Severe winds
Sleet, hail
Blowing sand, soil, dirt
Fog, smoke, smog
Blowing snow

Office of Location and Environment Automated Corridors
June 2017
Automated Corridors D13
Figure D.7b. Crash Characteristics (cont.) Segment 1 Segment 5
Driv
er C
ontr
ibut
ing
Circ
umst
ance
Vehi
cle
Con
figur
atio
n
Future Baseline Conditions The 2040 No-Build scenario assumes no freeway widening and 0% AV adoption. Using the ISU method, the baseline predicted crashes in 2040 for the No-Build scenario was 17.0 total crashes (0.4 fatal and major injury crashes) on Segment 1 and 28.6 total crashes (0.4 fatal and major injury crashes) on Segment 5 as shown in Figure D.8, alongside the four AV scenarios. The resulting crash rates were in the range of 32 to 34 total crashes per 100 million VMT and 0.5 to 0.7 fatal and major injury crashes per 100 MVM as shown in Table D.5.
0% 10% 20% 30% 40% 50%
No improper action
Lost Control
Followed too close
Unknown
Driving too fast for conditions
Other
Swerved to avoid: vehicle/object, etc.
Over-correcting/over-steering
Failed to keep in proper lane
Failed to Yield Right-of-Way
Starting or backing improperly
Operating vehicle in areckless/negligent manner, etc.
0% 10% 20% 30% 40% 50%
No improper action
Lost Control
Followed too close
Unknown
Driving too fast for conditions
Other
Swerved to avoid: vehicle/object, etc.
Over-correcting/over-steering
Failed to keep in proper lane
Failed to Yield Right-of-Way
Starting or backing improperly
Operating vehicle in a reckless/negligentmanner, etc.
0% 10% 20% 30% 40% 50%
Passenger car
Tractor/semi-trailer
Sport utility vehicle
Four-tire truck (pick-up)
Passenger van (seats <9)
Motorcycle
Single-unit truck (>= 3 axles)
Unknown
Single-unit truck (2-axle/6-tire)
Motor home/recreational vehicle
Tractor/doubles
Cargo/panel van
Other bus (seats > 15)
Truck tractor (bobtail)
Not Reported

Office of Location and Environment Automated Corridors
June 2017
Automated Corridors D14
Table D.5. Predicted Crash Results Segment 1 Total Predicted Crashes - ISU Method
2040 No-Build (4 Lanes)
2025 Scenario 1 (6 Lanes)
2030 Scenario 2 (6 Lanes)
2040 Scenario 3 (6 Lanes)
2040 Scenario 4 (6 Lanes)
ADT Total Crashes
Fatal & Maj. Inj.
ADT Total Crashes
Fatal & Maj. Inj.
ADT Total Crashes
Fatal & Maj. Inj.
ADT Total Crashes
Fatal & Maj. Inj.
ADT Total Crashes
Fatal & Maj. Inj.
Baseline (0% AV) 32,548 17.0 0.4 27,563 16.3 0.4 29,410 16.6 0.4 33,103 17.1 0.4 33,103 17.1 0.4
Predicted (w/ AV) 29,217 13.3 0.3 33,527 10.6 0.3 35,089 14.7 0.3 39,393 6.2 0.2
Crashes Eliminated 2.9 0.1 6.0 0.1 2.4 0.0 10.8 0.2
% Reduction 18% 15% 36% 30% 14% 12% 63% 51%
Segment 5 Total Predicted Crashes - ISU Method
2040 No-Build (4 Lanes)
2025 Scenario 1 (6 Lanes)
2030 Scenario 2 (6 Lanes)
2040 Scenario 3 (6 Lanes)
2040 Scenario 4 (6 Lanes)
ADT Total Crashes
Fatal & Maj. Inj.
ADT Total Crashes
Fatal & Maj. Inj.
ADT Total Crashes
Fatal & Maj. Inj.
ADT Total Crashes
Fatal & Maj. Inj.
ADT Total Crashes
Fatal & Maj. Inj.
Baseline (0% AV) 51,925 28.6 0.4 46,731 27.8 0.4 52,745 28.7 0.4 64,774 30.3 0.4 64,774 30.3 0.4
Predicted (w/ AV) 49,535 22.7 0.4 60,130 18.2 0.3 68,660 26.0 0.4 77,081 10.8 0.2
Crashes Eliminated 5.0 0.1 10.5 0.1 4.3 0.0 19.5 0.2 % Reduction 18% 14% 37% 28% 14% 11% 64% 47%
Notes: AV = automated vehicle; ADT = average daily traffic
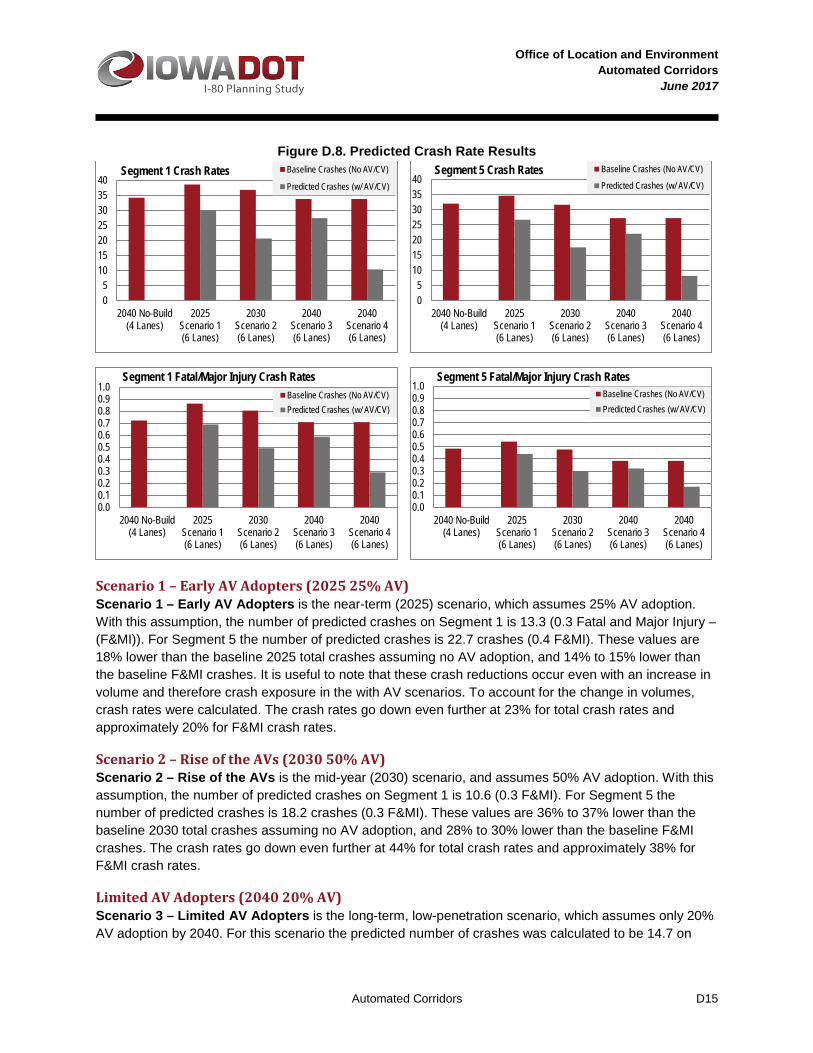
Office of Location and Environment Automated Corridors
June 2017
Automated Corridors D15
Figure D.8. Predicted Crash Rate Results
Scenario 1 – Early AV Adopters (2025 25% AV) Scenario 1 – Early AV Adopters is the near-term (2025) scenario, which assumes 25% AV adoption. With this assumption, the number of predicted crashes on Segment 1 is 13.3 (0.3 Fatal and Major Injury – (F&MI)). For Segment 5 the number of predicted crashes is 22.7 crashes (0.4 F&MI). These values are 18% lower than the baseline 2025 total crashes assuming no AV adoption, and 14% to 15% lower than the baseline F&MI crashes. It is useful to note that these crash reductions occur even with an increase in volume and therefore crash exposure in the with AV scenarios. To account for the change in volumes, crash rates were calculated. The crash rates go down even further at 23% for total crash rates and approximately 20% for F&MI crash rates.
Scenario 2 – Rise of the AVs (2030 50% AV) Scenario 2 – Rise of the AVs is the mid-year (2030) scenario, and assumes 50% AV adoption. With this assumption, the number of predicted crashes on Segment 1 is 10.6 (0.3 F&MI). For Segment 5 the number of predicted crashes is 18.2 crashes (0.3 F&MI). These values are 36% to 37% lower than the baseline 2030 total crashes assuming no AV adoption, and 28% to 30% lower than the baseline F&MI crashes. The crash rates go down even further at 44% for total crash rates and approximately 38% for F&MI crash rates.
Limited AV Adopters (2040 20% AV) Scenario 3 – Limited AV Adopters is the long-term, low-penetration scenario, which assumes only 20% AV adoption by 2040. For this scenario the predicted number of crashes was calculated to be 14.7 on
05
10152025303540
2040 No-Build(4 Lanes)
2025Scenario 1(6 Lanes)
2030Scenario 2(6 Lanes)
2040Scenario 3(6 Lanes)
2040Scenario 4(6 Lanes)
Segment 1 Crash Rates Baseline Crashes (No AV/CV)
Predicted Crashes (w/ AV/CV)
05
10152025303540
2040 No-Build(4 Lanes)
2025Scenario 1(6 Lanes)
2030Scenario 2(6 Lanes)
2040Scenario 3(6 Lanes)
2040Scenario 4(6 Lanes)
Segment 5 Crash Rates Baseline Crashes (No AV/CV)
Predicted Crashes (w/ AV/CV)
0.00.10.20.30.40.50.60.70.80.91.0
2040 No-Build(4 Lanes)
2025Scenario 1(6 Lanes)
2030Scenario 2(6 Lanes)
2040Scenario 3(6 Lanes)
2040Scenario 4(6 Lanes)
Segment 1 Fatal/Major Injury Crash Rates Baseline Crashes (No AV/CV)Predicted Crashes (w/ AV/CV)
0.00.10.20.30.40.50.60.70.80.91.0
2040 No-Build(4 Lanes)
2025Scenario 1(6 Lanes)
2030Scenario 2(6 Lanes)
2040Scenario 3(6 Lanes)
2040Scenario 4(6 Lanes)
Segment 5 Fatal/Major Injury Crash Rates Baseline Crashes (No AV/CV)Predicted Crashes (w/ AV/CV)

Office of Location and Environment Automated Corridors
June 2017
Automated Corridors D16
Segment 1 and 26.0 crashes on Segment 5. This is a 14% reduction on each segment in comparison to the 2040 baseline numbers. The F&MI crashes decrease by approximately 11% to 12%. The total crash rates improve by 19% in this scenario, when compared to the baseline and the F&MI rates improve by 16% to 17%, when compared to the baseline.
Scenario 4 – AV Domination (2040 85% AV) Scenario 4 – AV Domination is the long-term, high-penetration scenario, which assumes 85% AV adoption by 2040. This scenario yields the highest safety benefits, as the number of total predicted crashes decreases from 17.1 to 6.2 (63% reduction) on Segment 1 and from 30.3 to 10.8 (64% reduction) on Segment 5. The F&MI crashes decrease by 47% to 51%.Crash rates are also significantly improved in this scenario. In the west, the rate improves from 33.8 total crashes per 100 million VMT to 10.4 total crashes per 100 million VMT in the east (69% reduction) and from 27.3 total crashes per 100 million VMT to 8.2 total crashes per 100 million VMT in the west (70% reduction). The F&MI rates improve by 56% to 59%.
Safety Summary Interstate 80 experiences substantial crash activity today as is typical for a high-volume, high-speed corridor. With worsening congestion, 2040 No-Build conditions are predicted to experience 30 to 35 crashes per 100 million VMT. Based on the four scenarios analyzed, widening of I-80 alone would bring more traffic to the corridor, yielding more predicted crashes. While the widening does show an improvement of No-Build conditions in 2040 crash rates, the analysis still points to between 25 and 33 crashes per 100 million VMT. However, with AVs, the analysis shows a drastic reduction in crash rates. Specifically, the crash reduction at low levels of automation (Scenarios 1 and 3) is in the ballpark of 20% improvement. For Scenario 4, the high level of AVs reduces crash rates by roughly 70-75%.
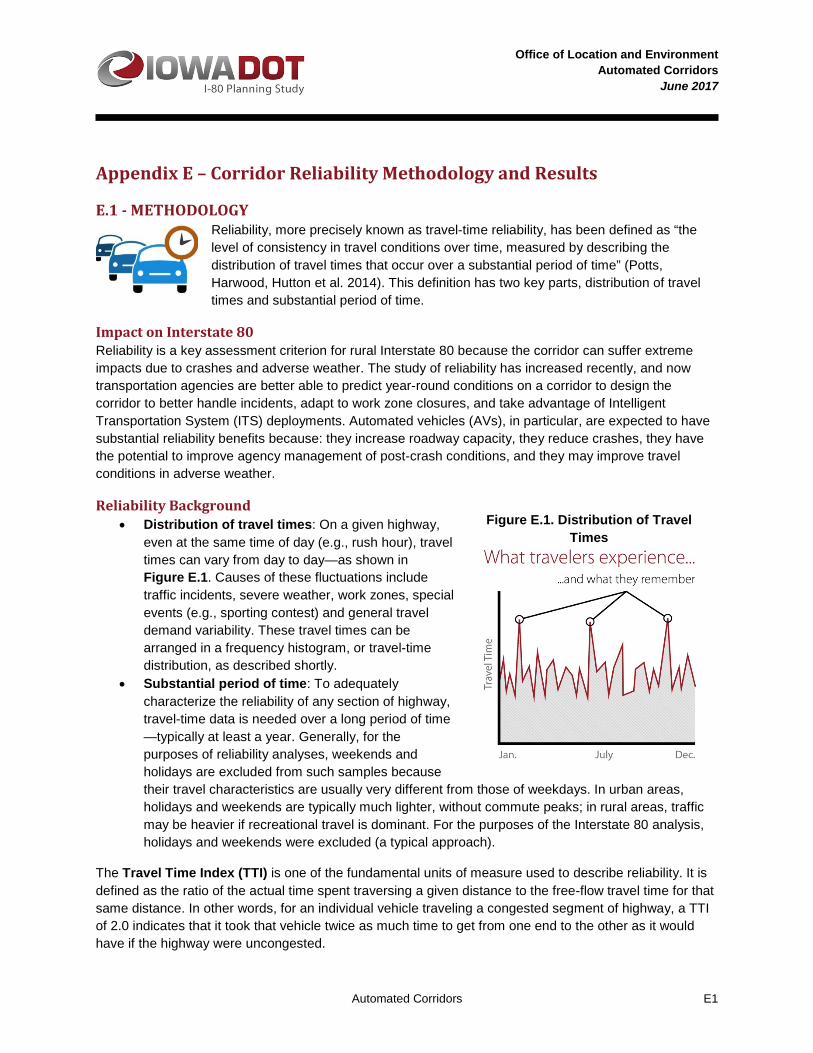
Office of Location and Environment Automated Corridors
June 2017
Automated Corridors E1
Appendix E – Corridor Reliability Methodology and Results
E.1 - METHODOLOGY Reliability, more precisely known as travel-time reliability, has been defined as “the level of consistency in travel conditions over time, measured by describing the distribution of travel times that occur over a substantial period of time” (Potts, Harwood, Hutton et al. 2014). This definition has two key parts, distribution of travel times and substantial period of time.
Impact on Interstate 80 Reliability is a key assessment criterion for rural Interstate 80 because the corridor can suffer extreme impacts due to crashes and adverse weather. The study of reliability has increased recently, and now transportation agencies are better able to predict year-round conditions on a corridor to design the corridor to better handle incidents, adapt to work zone closures, and take advantage of Intelligent Transportation System (ITS) deployments. Automated vehicles (AVs), in particular, are expected to have substantial reliability benefits because: they increase roadway capacity, they reduce crashes, they have the potential to improve agency management of post-crash conditions, and they may improve travel conditions in adverse weather.
Reliability Background • Distribution of travel times: On a given highway,
even at the same time of day (e.g., rush hour), travel times can vary from day to day—as shown in Figure E.1. Causes of these fluctuations include traffic incidents, severe weather, work zones, special events (e.g., sporting contest) and general travel demand variability. These travel times can be arranged in a frequency histogram, or travel-time distribution, as described shortly.
• Substantial period of time: To adequately characterize the reliability of any section of highway, travel-time data is needed over a long period of time —typically at least a year. Generally, for the purposes of reliability analyses, weekends and holidays are excluded from such samples because their travel characteristics are usually very different from those of weekdays. In urban areas, holidays and weekends are typically much lighter, without commute peaks; in rural areas, traffic may be heavier if recreational travel is dominant. For the purposes of the Interstate 80 analysis, holidays and weekends were excluded (a typical approach).
The Travel Time Index (TTI) is one of the fundamental units of measure used to describe reliability. It is defined as the ratio of the actual time spent traversing a given distance to the free-flow travel time for that same distance. In other words, for an individual vehicle traveling a congested segment of highway, a TTI of 2.0 indicates that it took that vehicle twice as much time to get from one end to the other as it would have if the highway were uncongested.
Source: FHWA
Figure E.1. Distribution of Travel Times

Office of Location and Environment Automated Corridors
June 2017
Automated Corridors E2
A travel–time distribution is a frequency histogram of the travel times along a segment of highway. Figure E.2 shows the transformation of this curve into a cumulative TTI curve, which is the basis for the reliability analysis of the Interstate 80 corridor. The unitless nature of this curve is helpful in that it allows segments to be compared on the same basis regardless of their length or free-flow speed.
Figure E.2. Construction of the Cumulative Travel Time Index Curve
The nature of the cumulative TTI curve is such that the more forward it leans, the less reliable the facility is. A perfectly vertical TTI curve would reflect a perfectly reliable facility (see Figure E.3). The diagram at right illustrates this general principle. It should be noted that the curve labeled reliable still has a tail at the very top of the distribution. This shape is very characteristic of rural facilities. Even though such facilities typically do not experience recurring congestion, it is often the case that during a handful of hours during the year, major congestion-inducing events, such as catastrophic incidents, cause significant delays to motorists.
Reliability Performance Measures Because reliability is characterized by a travel-time distribution, it is difficult to characterize a facility’s reliability with a single numerical value. A number of performance measures are used—some based on the mean of the TTI distribution, some based on the variance, some based on single points along the curve, some based on regimes along the curve and some that characterize key aspects of the curve’s shape. For the Interstate 80 corridor, three measures were chosen to characterize reliability (although various other measures could also be extracted from the cumulative TTI curve:
0%
5%
10%
15%
0 5 10 15 20 25
travel-time distribution (minutes)
0%
20%
40%
60%
80%
100%
0 5 10 15 20 25
cumulative travel-time distribution (minutes)
0%
20%
40%
60%
80%
100%
1.0 2.0 3.0 4.0 5.0
cumulative TTI distribution (unitless)
Shows the percentage of vehicles (y-axis) that experienced a given travel time (x-axis). In this example, just under 10% of vehicles experienced a 10-minute travel time, and about 4% experienced a 5-minute travel time.
Shows the percentage of vehicles (y-axis) whose travel time was equal to or less than the x-axis value. In this example, about 70% of vehicles experienced a travel time of 10 minutes or less.
Shows the percentage of vehicles (y-axis) whose Travel Time Index (TTI) was equal to or less than the x-axis value. In this example, about 50% of vehicles experienced a TTI of 2.0 or less.
0%
20%
40%
60%
80%
100%
1.0 2.0 3.0 4.0 5.0
reliable
unreliable
Figure E.3. Cumulative Travel Time Index Curve

Office of Location and Environment Automated Corridors
June 2017
Automated Corridors E3
• The Misery Index is the average TTI for the worst 5 percent of travel times, and is especially suited to rural facilities that are uncongested and reliable most hours of the year. The more reliable a facility is, the lower its Misery Index.
• The Reliability Rating introduced in the Sixth Edition of the Highway Capacity Manual (HCM), measures the percentage of vehicles (usually vehicle miles) experiencing a TTI less than 1.33 (for freeways). The more reliable a facility is, the higher its Reliability Rating.
• The Lateness Index, introduced in the Strategic Highway Research Program 2 (SHRP2) L07 project, is a unitless index measuring delay to all vehicles over the entire year—the area to the left of the cumulative TTI curve. The Lateness Index can be converted to a vehicle-delay measure. The more reliable a facility is, the lower its Lateness Index.
Figure E.4 illustrates these three performance measures in relation to the cumulative TTI curve.
Figure E.4. Reliability Performance Measures Used for Interstate 80 Corridor Analysis
Field Measurement of Reliability Reliability data for existing conditions on the study segments of Interstate 80 was collected and analyzed by the Iowa State University Center for Transportation Research and Education (CTRE). Based on probe vehicle data from Interstate 80, CTRE extracted vehicular travel speeds over a 3-year period. From this speed data, CTRE imputed travel times and derived TTI percentiles in 5% increments for each of the 24 hours of the day. The resulting travel-time distributions and reliability performance measures are further described in Section E.2.
Prediction of Reliability The Interstate 80 corridor analysis used the prediction methods of the SHRP2 L03 project, as subsequently refined and enhanced by the SHRP2 L07 project. Other methods are emerging for predicting reliability, such as the scenario-generation method described in the HCM, but the L03/L07 method was chosen as a suitable planning-level methodology commensurate with the level of detail at which the other highway performance elements (operations and capacity) were analyzed.
The L03/L07 method predicts points along the cumulative TTI distribution curve. For each segment and scenario, curves were developed for each of the 24 hours of the day. The L03/L07 predictions are based
1.33
Misery Index = Average TTI in this area
95% Reliability Rating
Lateness Index = shaded area
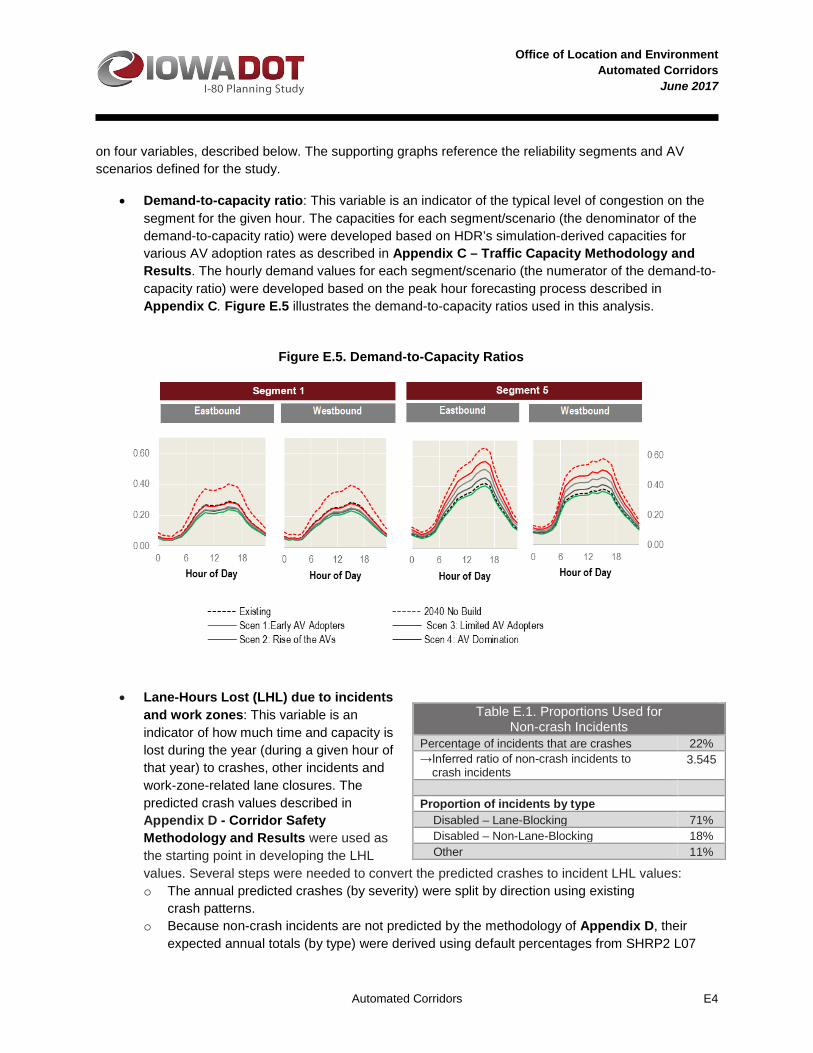
Office of Location and Environment Automated Corridors
June 2017
Automated Corridors E4
on four variables, described below. The supporting graphs reference the reliability segments and AV scenarios defined for the study.
• Demand-to-capacity ratio: This variable is an indicator of the typical level of congestion on the segment for the given hour. The capacities for each segment/scenario (the denominator of the demand-to-capacity ratio) were developed based on HDR’s simulation-derived capacities for various AV adoption rates as described in Appendix C – Traffic Capacity Methodology and Results. The hourly demand values for each segment/scenario (the numerator of the demand-to-capacity ratio) were developed based on the peak hour forecasting process described in Appendix C. Figure E.5 illustrates the demand-to-capacity ratios used in this analysis.
• Lane-Hours Lost (LHL) due to incidents and work zones: This variable is an indicator of how much time and capacity is lost during the year (during a given hour of that year) to crashes, other incidents and work-zone-related lane closures. The predicted crash values described in Appendix D - Corridor Safety Methodology and Results were used as the starting point in developing the LHL values. Several steps were needed to convert the predicted crashes to incident LHL values: o The annual predicted crashes (by severity) were split by direction using existing
crash patterns. o Because non-crash incidents are not predicted by the methodology of Appendix D, their
expected annual totals (by type) were derived using default percentages from SHRP2 L07
Table E.1. Proportions Used for Non-crash Incidents
Percentage of incidents that are crashes 22% →Inferred ratio of non-crash incidents to
crash incidents 3.545
Proportion of incidents by type Disabled – Lane-Blocking 71% Disabled – Non-Lane-Blocking 18% Other 11%
Figure E.5. Demand-to-Capacity Ratios

Office of Location and Environment Automated Corridors
June 2017
Automated Corridors E5
project as shown in Table E.1. Because non-crash incidents are more difficult to track, these default values were used.
o For the purposes of this analysis, work zones were not included. The specifics of work zones for any given year on either of the two study segments were assumed to be unknowable (but completely within Iowa DOT’s control).
o For each hour, and for each incident type i (including both crash and non-crash incidents), LHL was calculated from the above parameters using the following formula:
•
Figure E.6 illustrates the resulting LHL values for the study segments and scenarios.
• Weather: Number of hours over the year with rain exceeding 0.05 inches (R05”) and number of hours over the year with snow exceeding 0.01 inches (S01”). These variables are indicators of the number of hours per year that experience more than trace amounts of rain or snow. Weather stations nearest the two study segments, as compiled in the SHRP2 L07 databases, were used to obtain precipitation estimates. It was assumed that precipitation patterns would be similar over the study horizon (through 2040). Figure E.7 illustrates the annual rainfall and snowfall assumptions stratified by hour of day. These assumptions are not expected to vary by scenario.
𝐿𝐿𝐿𝐿𝐿𝐿 = 1
60� (# 𝑜𝑜𝑜𝑜 𝑖𝑖𝐿𝐿𝑖𝑖𝑖𝑖𝑖𝑖𝑒𝑒𝐿𝐿𝐿𝐿𝑖𝑖) × (# 𝑜𝑜𝑜𝑜 𝑙𝑙𝑙𝑙𝐿𝐿𝑒𝑒𝑖𝑖 𝑏𝑏𝑙𝑙𝑜𝑜𝑖𝑖𝑏𝑏𝑒𝑒𝑖𝑖) × (𝑙𝑙𝑎𝑎𝑒𝑒𝑎𝑎𝑙𝑙𝐿𝐿𝑒𝑒 𝑖𝑖𝐿𝐿𝑖𝑖𝑖𝑖𝑖𝑖𝑒𝑒𝐿𝐿𝐿𝐿 𝑖𝑖𝑑𝑑𝑎𝑎𝑙𝑙𝐿𝐿𝑖𝑖𝑜𝑜𝐿𝐿,𝑚𝑚𝑖𝑖𝐿𝐿𝑑𝑑𝐿𝐿𝑒𝑒𝑖𝑖)
𝑖𝑖
Figure E.6. Lane-Hours Lost due to Incidents
Segment 1 Segment 5
Eastbound Westbound Eastbound Westbound
0.00
0.50
1.00
1.50
0 6 12 18Hour of Day
0 6 12 18Hour of Day
0.00
0.50
1.00
1.50
0 6 12 18Hour of Day
0 6 12 18Hour of Day
Existing 2025 Scen 1 2030 Scen 22040 No Build 2040 Scen 3 2040 Scen 4

Office of Location and Environment Automated Corridors
June 2017
Automated Corridors E6
The SHRP2 L07 research used for this study developed two reliability prediction equations—one for facilities with demand-to-capacity values above 0.8, and one for facilities with demand-to-capacity values below 0.8. As previously shown in Figure E.7, in no scenario did any demand-to-capacity value exceed 0.8, so only one equation was needed to develop the cumulative TTI curves:
Where TTIn is the TTI value for percentile n, the four
variables (demand-to-capacity [d/c], LHL, R05” and S01”) are as described above, and the four coefficients (an, bn, cn, dn) are continuous functions of the percentile value n as shown in Figure E.8.
The resulting cumulative TTI curves, and the performance measures extracted from them for each scenario, are discussed in Section E.2.
It should be noted that the rainfall and snowfall coefficients used in the SHRP2 L07 equations (cn and dn) reflect human driver behavior under severe weather conditions. Although there is an expectation that AVs will be less susceptible to the driving hazards caused by severe weather, these coefficients were not modified for the future scenarios involving AV because there was not enough research available to justify modifying the values. Therefore, the analysis is likely conservative in this regard.
0.00
0.01
0.02
0.03
0.04
0.05
0.06
0 0.5 1percentile
bn cn
dn
0.0
0.1
0.2
0.3
0.4
0.5
0.6
0.7
0 0.5 1percentile
an
Figure E.8. SHRP2 L07 Travel Time Index Prediction Coefficients
𝑇𝑇𝑇𝑇𝑇𝑇𝑛𝑛 = 𝑒𝑒�𝑎𝑎𝑛𝑛𝑑𝑑 𝑐𝑐� + 𝑏𝑏𝑛𝑛𝑉𝑉𝐿𝐿𝑉𝑉 + 𝑐𝑐𝑛𝑛𝑅𝑅05"+𝑑𝑑𝑛𝑛𝑆𝑆01"�
Figure E.7. Annual Hours with Precipitation Exceeding Thresholds
Segment 1 Segment 5
0123456789
0 6 12 18Hour of Day
R05"
S01"
0
2
4
6
8
10
0 6 12 18Hour of Day
R05"
S01"

Office of Location and Environment Automated Corridors
June 2017
Automated Corridors E7
Scope of Interstate 80 Reliability Analysis Because reliability predictions rely on predictions of demand, capacity and crashes, reliability predictions for the Interstate 80 corridor could only be developed for the segments on which forecasts for all three of these variables were also developed—the Segments 1 and 5.
E.2 - RELIABILITY RESULTS
Existing Conditions As mentioned previously, existing travel times were extracted from probe vehicle data for the two reliability study segments. Figure E.9 illustrates the existing families of cumulative travel-time curves for each direction on each segment. As the figure illustrates, Interstate 80 exhibits a travel-time signature that is fairly characteristic for rural highway corridors (as discussed in Section E.1). The curve is fairly vertical until the very highest percentiles, meaning drivers might experience one or two bad days per month. In fact, since the curves were provided in 5% intervals, and only the 100th percentile values exhibited high TTIs, it is possible that the bad days were restricted to one or two per year. Figure E.10 indicates the 100th percentile (worst) TTI values for each segment by direction.
0
2
4
6
8
10
12
0 6 12 18 24W
orst
TTI
Hour of Day
EB EB WB WB
Segment 1 Segment 5
Figure E.9. Worst Time Travel Index per Segment by Time of Day
Figure E.10. Existing (Field-Measured) Cumulative Time Travel Index Curves

Office of Location and Environment Automated Corridors
June 2017
Automated Corridors E8
Model Calibration to Existing Conditions In order to develop reasonable forecasts for future conditions, the SHRP2 L07 prediction models were calibrated to existing conditions. It was found that the raw models predicted curves that leaned forward more (i.e., overstated unreliable conditions) than the field data indicated. Adjustments that shifted the predictions to the left by a TTI of 0.08 to 0.10 produced a much better fit. This was the case for TTI percentiles of 95% and below. Figure E.11 shows an example of the predicted-versus-observed fit after these adjustments. Results were similar for the other three segment/direction combinations.
Note that the graph shows an artifact of the CTRE data. The observed TTI values are quantized into linear bins, probably based on rounding within the process of converting field data to TTIs. The predicted TTI values, because they are based on a continuous mathematical equation, do not exhibit this binning.
The wild field variations in TTIs above the 95th percentile led the team to develop a differing method for predicting values in these upper ranges. For future prediction scenarios, the team decided to factor the existing field data by the ratio of predicted future to predicted existing, i.e.:
This method provides an indication of the magnitude of change. It is fairly simplistic, in that it essentially assumes that the duration of the longest TTIs will extend, rather than those further down the TTI curve.
Future Baseline Conditions The calibrated SHRP2 L07 model was used to predict the expected hourly cumulative TTI curves for the 2040 No-Build scenario, which assumed approximately 25 years of forecasted traffic growth, no widening, and no significant market penetration of AV. Figure E.12 illustrates the upper portions of these curves, and in comparison with the curves of Figure E.9, shows lengthened travel times and degraded reliability.
Figure E.12. 2040 No-Build Cumulative Travel Time Index Curves Five percentile increments; 24 curves per graph (one for each hour of the day)
1.00
1.05
1.10
1.15
1.20
1.00 1.05 1.10 1.15 1.20
Cali
brat
ed P
redi
cted
TTI
Observed TTI
TTI10 TTI20 TTI30 TTI40 TTI50 TTI60 TTI70TTI80TTI90
adjusted predicted value = existing field value ×raw predicted future value
raw predicted existing value
Figure E.11. Post-Calibration Fit for Segment 1, Eastbound
Segment 1 Segment 5
Eastbound Westbound Eastbound Westbound

Office of Location and Environment Automated Corridors
June 2017
Automated Corridors E9
As discussed in Section E.1, three reliability performance measures were compared for the Interstate 80 corridor analyses: the Misery Index (representing the worst 5% of travel times), the Reliability Rating (representing the proportion of motorists experiencing reasonable travel times), and the Lateness Index (representing the delays experienced by all motorists). To develop a single value of each of these measures for comparison, HDR developed volume-weighted averages across the 24 hours of the day, shown in Table E.2. As the table indicates, in the 2040 No-Build condition the Misery Index is projected to increase by 6% to 12%, and the Lateness Index is projected to increase by 8% to 19%. The Reliability Rating, which focuses on lower TTI percentiles, is not expected to change much—as might be expected for rural facility types.
Table 25: Reliability Performance Measures – Existing vs. No-Build Misery Index Reliability
Rating Lateness Index
Segment 1 Eastbound
Existing Conditions
2.44 95.5% 4.32
2040 No Build 2.63 95.1% 5.12 % change +7.7% -0.4% +18.5% Segment 1 Westbound
Existing Conditions
1.71 95.9% 3.44
2040 No Build 1.81 95.5% 3.72 % change +6.1% -0.4% +8.3% Segment 5 Eastbound
Existing Conditions
1.85 95.7% 3.38
2040 No Build 2.06 95.2% 3.85 % change +11.3% -0.5% +13.9% Segment 5 Westbound
Existing Conditions
3.71 95.8% 5.22
2040 No Build 4.16 95.1% 5.90 % change +12.0% -0.2% +13.0%
Table E.2. Reliability Performance Measures – Existing vs. No-Build

Office of Location and Environment Automated Corridors
June 2017
Automated Corridors E10
Alternative Future AV Scenarios HDR evaluated the four project scenarios with respect to the three study reliability performance measures. Table E.3 compares the results for these alternative scenarios against existing conditions and the 2040 No-Build scenario. Figure E.13 provides a graphical view of the percentage changes of each scenario compared to existing conditions. As the table and figure indicate, after increasing from existing conditions to 2040 No Build, the Misery Index would be projected to decrease as AV adoption increases—to levels close to, or even less than, today’s values—in the AV Domination scenario. The Lateness Index projections generally follow a similar trend. The Reliability Rating projections continue to exhibit very little variation, because the areas of the cumulative TTI curve they address are not subject to much variation in this case.
In summary, the analysis found that the implementation of AV could make noticeable impacts on reliability, especially in performance measures that are sensitive to the worst days (catastrophic incidents, severe weather, etc.). Research that could improve the accuracy of these results includes:
• Refined reliability prediction methods for rural areas, in the upper 5 to 10 percentiles of the travel-time distribution.
• The degree of superior performance that can be expected from AVs in severe weather.
• The degree to which incident durations could be shortened by the communications abilities of AVs.
Misery Index
Reliability Rating
Lateness Index
Segment 1 - Eastbound Existing Conditions 2.44 95.5% 4.32 2025 Scenario 1 (25%) 2.43 95.2% 4.76 2030 Scenario 2 (50%) 2.43 95.2% 4.76 2040 No Build 2.63 95.1% 5.12 2040 Scenario 3 (20%) 2.49 95.2% 4.87 2040 Scenario 4 (85%) 2.41 95.2% 4.73 Segment 1 - Westbound Existing Conditions 1.71 95.9% 3.44 2025 Scenario 1 (25%) 1.70 95.8% 3.43 2030 Scenario 2 (50%) 1.71 95.7% 3.44 2040 No Build 1.81 95.5% 3.72 2040 Scenario 3 (20%) 1.74 95.7% 3.52 2040 Scenario 4 (85%) 1.70 95.8% 3.43 Segment 5 - Eastbound Existing Conditions 1.85 95.7% 3.38 2025 Scenario 1 (25%) 1.87 95.5% 3.42 2030 Scenario 2 (50%) 1.89 95.4% 3.48 2040 No Build 2.06 95.2% 3.85 2040 Scenario 3 (20%) 1.98 95.3% 3.70 2040 Scenario 4 (85%) 1.91 95.4% 3.53 Segment 5 - Westbound Existing Conditions 3.71 95.4% 5.22 2025 Scenario 1 (25%) 3.68 95.3% 5.20 2030 Scenario 2 (50%) 3.71 95.2% 5.26 2040 No Build 4.16 95.1% 5.90 2040 Scenario 3 (20%) 3.98 95.2% 5.64 2040 Scenario 4 (85%) 3.73 95.2% 5.30 *Scenarios include: 1 – Early AV Adopters, 2 – Rise of the AVs, 3 – Limited AV Adopters, and 4 – AV Domination
Table E.3. Reliability Performance Measures All Scenarios

Office of Location and Environment Automated Corridors
June 2017
Automated Corridors E11
Figure E.13. Reliability Measures: Percentage Change from Existing
Segm
ent:
Rel
iabi
lity
Wes
t Se
gmen
t 1
Wes
tbou
nd
East
boun
d
Segm
ent 5
Wes
tbou
nd
East
boun
d
Misery Index Lateness Index
*Scenarios include: 1 – Early AV Adopters, 2 – Rise of the AVs, 3 – Limited AV Adopters, and 4 – AV Domination

Office of Location and Environment Automated Corridors
June 2017
Automated Corridors F1
Appendix F – Future Proofing and Design Considerations To future-proof a rural interstate corridor, the project team identified four main focus areas:
• Mobility needs and expandability • Automated vehicle (AV) infrastructure needs • Construction methods and materials • Right of way needs
The baseline to consider these future-proofing focus areas against was the proposed Interstate 80 cross section identified in the Interstate 80 Planning Study guiding principles document (see Figure F.1).
Figure F.1. Interstate 80 Planning Study Guiding Principles Cross Section
The proposed concept has the following features:
• 12-foot-wide outside shoulder • Three 12-foot-wide travel lanes • 12-foot-wide inside shoulder that could be converted to a fourth travel lane in the future • Space for a future inside shoulder to be paved during a later expansion • 82-foot-wide median from the inside of travel lanes in each direction.
Based on this baseline concept, the project team considered design modifications that meet the traffic and safety analysis needs previously defined while providing greater flexibility to the Iowa Department of Transportation (DOT).
F.1 - MOBILITY NEEDS AND EXPANDABILITY Today, portions of Interstate 80 are already experiencing vehicle crowding or density at levels exceeding desirable guidelines. By 2040, a traditional density analysis of the eastern segment between Iowa City and the Quad Cities shows the need to expand to eight lanes. With that level of expansion needed even by the project horizon year for parts of the state, Iowa DOT developed an Interstate 80 cross section that reserves space in the median for expansion to the inside. Under this template cross section, the initial major construction to widen Interstate 80 to six lanes (including replacing existing overhead bridges with longer structures) can be accomplished so that an eventual transition to eight lanes requires only placing a future inside shoulder section.
As identified in the traffic capacity section, traffic capacity analysis of mixed manual and AV was assessed for performance based on average freeway speeds and demand-to-capacity ratio. Review of the five segments analyzed show no section having a demand-to-capacity ratio greater than 0.51. At that level of congestion, average segment speeds under high-levels of automation are still high higher than

Office of Location and Environment Automated Corridors
June 2017
Automated Corridors F2
existing conditions. Based on these performance measures, the project team suggests mixed manual and AV traffic can operate efficiently on the proposed six-lane section.
The project team sought to identify how far beyond the year 2040 the facility could still operate efficiently without additional lanes (beyond the lanes recommended for the build condition). To develop this estimate, the project team assumed traffic volumes would grow linearly each year and developed a threshold for acceptable performance of demand-to-capacity ratio equal to 0.80. The following list details approximately when each segment would potentially exceed the threshold of acceptable operations.
• Segment 1 – Beyond 2100 • Segment 2 – Beyond 2100 • Segment 3 – 2090-2100 • Segment 4 – 2080-2090 • Segment 5 – 2060-2070
Based on this distant year where Interstate 80 conditions would be expected to reach an unacceptable level, the idea of providing future expandability within this design may not be as important as providing future lane flexibility. By looking at lane flexibility, the issue becomes whether the proposed pavement can handle traffic under diverse conditions, such as lane width and shoulder need and use. The key components to lane flexibility are:
Lane Width AVs and trucks are designed to lane center. That means whether the lane is 10 feet wide or 12 feet wide, the vehicles run in a track down the center of the lane, minimizing vehicle oscillation and related safety concerns. The primary determining factor in lane width for AVs only would be vehicle width though other factors may apply, especially in the case of retrofitting an existing lane to AV only traffic.
With future-proofing, the design flexibility must consider conservative scenarios that will accommodate lane widths suitable to AVs and manually driven vehicles. The project team recommends a design that uses 12-foot-wide lanes for the three opening day travel lanes in each direction. In the future, lane widths may narrow if lane-centering were to become standard, potentially as low as 10 feet wide while still accommodating some oversized trucks.
Shoulder Need and Use A growing number of agencies nationally and internationally have begun to utilize shoulders for some active traffic in highly monitored urban areas instead of reserving the shoulder area exclusively for vehicle breakdowns. With AV capabilities, the future may lead to more conditional use of rural shoulders through the built-in communications abilities of AV traffic.
With active traffic on the shoulders, the pavement design of the shoulders should provide more pavement depth than would be needed on a refuge-only type of shoulder. The project team evaluated whether both shoulders would need this type of more robust pavement design. The key factor was that manual truck traffic would be the most likely user of the right or outside-most travel lane. Given the potential safety risk of a truck breakdown and likelihood that traffic in the right lane will not be capable receiving active traffic communications, the project team recommends keeping the right shoulder as a refuge area only.

Office of Location and Environment Automated Corridors
June 2017
Automated Corridors F3
On the other hand, AV traffic will operate most efficiently in lanes other than the right or outside-most lane. Because that will put AV traffic closer to the inside shoulder, the inside shoulder is a better choice for conditional use. Because no special lane use signs will be provided, the occupants of the shoulder when conditionally open would be AVs. AVs will still have the potential to breakdown, but AVs also can respond to unexpected breakdowns more readily, which means that the left shoulder’s use could become much more like a traffic lane than a shoulder, except when there is a vehicle breakdown. In that case, the inside shoulder could eventually be striped, signed and designated as an AV only lane.
Considering the distant time frame for expandability needs and the discussion on the flexibility benefits of AVs on lane width and shoulder need and use, the project team recommends that Iowa DOT consider providing future expandability (beyond 2040) by utilizing the inside shoulder as a AV dedicated travel lane, providing a total of eight lanes on Interstate 80. Iowa DOT confirmed that the proposed typical median width for Interstate 80 was based on constructability, and will remain as proposed in the Interstate 80 Planning Study guiding principles.
F.2 - AUTOMATED VEHICLE INFRASTRUCTURE NEEDS AVs are being developed within the confined conditions of car manufacturing facilities and private testing grounds. Outside those private testing grounds, public agencies invest in and maintain the transportation system that AVs will need to operate on. Consequently, agencies are preparing for and making investments in technology upgrades with AVs in mind, setting the stage for smart corridors. The project team reviewed what future-proofing items are needed in the design of the Interstate 80 expansion to help the AVs achieve their potential.
The first AV-supportive design consideration is providing Global Positioning System (GPS) reference markers. GPS as a technology has grown over the years in its capabilities, such that a reliable position of a GPS unit in a person’s cell phone can be estimated within 10 to 20 feet without any additional equipment. While that level of accuracy is noteworthy, it is not accurate enough for maintaining a vehicle’s position within a lane. To improve upon that individual GPS unit’s accuracy, a GPS unit’s
position can be triangulated using one additional known location. Iowa is at an advantage because the Iowa Real Time Network already provides highly (sub-meter) accurate GPS information across the state. Outside of Iowa, the industry is looking at the highway roadside as a location that could be used to place additional GPS reference markers that agencies could certify to very high levels of accuracy. With the GPS reference marker locations known, AVs could simply calculate their distance from a reference marker as part of their navigation and steering. The GPS reference markers would then act as the primary guide to AVs positioning for brief periods when connectivity to satellites was obstructed.
The project team recommends that Iowa DOT design space for GPS reference markers within the median of Interstate 80 as a supplement for the Iowa Real Time Network and standard GPS. GPS reference markers would be constructed at approximately 0.25 mile spacing, 10 feet inside of the left edge of the
median-side shoulder. The project team suggests coordination with the automaker industry on the exact specification and spacing for designing GPS reference markers. The GPS reference markers are anticipated to be the size of a small sign.
Another AV-supportive design consideration is machine-readable signs. The current use of signage on public roadways is optimized for human comprehension and design of signs follows the guidance of the Manual on Uniform Traffic Control

Office of Location and Environment Automated Corridors
June 2017
Automated Corridors F4
Devices (MUTCD). For AVs, the use of signs may still be appropriate to inform the AV of upcoming changes in roadway nature or traits. However, signs likely cannot be optimized for human users and AVs simultaneously given how differently the two process information. Because signs will still be needed for human users on the road, the project team recommends using signs designed with hidden, machine-readable content under the more typical, MUTCD compliant sign message. Determining how to add this machine-readable content to signs will take cooperation with the automaker industry and sign fabricators. The project team at this early stage did not identify any specific need for additional, AV-only signs as part of this work. Iowa DOT design of signage plans can focus on choosing sign locations that meet their traditional criteria, but will have to consider the new AV messaging that will be added to typical signage.
The final AV-supportive design element is roadside equipment (RSE). RSE is agency-owned communications and processing infrastructure that help the agency monitor local traffic operating conditions and provide safety information to AVs. RSE house vehicle-to-infrastructure (V2I) communications devices, like dedicated short range communications (DSRC) radio and computer processing power to turn raw data from passing AVs into information that can be acted upon by automated processes in the RSE
or sent to the traffic management center (TMC). For example, RSE will be collecting information like the number of AV signals in a period of time, which helps Iowa DOT understand if the roadway is experiencing crowding. Further, RSE could gather messages from AVs that signify that a vehicle is disabled in the roadway. That message could then lead to the actions, such as contacting the proper emergency medical services (EMS) and instructing vehicles approaching the blocked lane to move to the next open lane.
RSE was originally thought to be physical infrastructure. Advances in computing power, storage in the cloud and evolving cellular communication strength and speed are challenging that thought. By the time agencies act upon widespread use of RSE, the RSE could be all virtual infrastructure. The project team suggests a plan for RSE be developed that allows flexibility for use of either virtual or physical RSE.
The infrastructure elements recommended to support this smart corridor are continuous fiber optic lines and continuous power lines. Including these two lines continuously during the initial construction of Interstate 80 would provide that base layer for future RSE and minimize later disruption to Interstate 80 traffic for supplying communications and power. Consideration during design should also be given to providing advanced cellular capabilities, cameras and sensors. The specific needs and design of infrastructure for certain sections of the Interstate 80 corridor will vary and should be determined through the systems engineering process.
F.3 - CONSTRUCTION METHODS AND MATERIALS The project team looked at construction methods and materials from an AV perspective. The biggest challenge in the area of construction materials is how AVs may increase the burden on pavement and material strength. The project team believes that impact of AVs on pavement design is an understudied future-proofing issue in the study’s literature review. The project team’s best course of action for capturing impacts of AVs on pavement design was through coordination with Iowa DOT’s materials and pavement engineers.
While AVs may prove challenging to pavement and material design, AVs could bring agency savings and efficiency in how they impact construction methods. The project team did not identify any key

Office of Location and Environment Automated Corridors
June 2017
Automated Corridors F5
recommendations for construction methods during the initial construction of Interstate 80 because AVs are still limited, but future road work could be streamlined to take advantage of AVs ability to receive dynamic information and fit within narrower lanes.
Pavement Design Based on the project team’s analysis findings and literature review, Iowa DOT’s pavement design and materials engineer provided the project team with considerations from a materials point of view. One primary takeaway for the project team was how including pavement design in the future-proofing process leads to an even larger range of uncertain futures. This is because pavements are typically designed to accommodate a 40-year design life. From the aggressive and conservative AV trends identified in the literature, that would mean by the time the pavement’s useful life is complete the facility may handle between 65% and 100% AV traffic. Iowa DOT’s perspective on that increased uncertainty is that the pavement design for Interstate 80 should aim toward higher projections of future traffic to avoid designing the pavement to a lower assumed level of traffic and having pavement deteriorate prematurely. Also, Iowa DOT recommended typical assumptions on lane distribution of vehicles and trucks should be re-visited. The current assumption for a design lane is that it carries 60% of the total trucks for a six-lane freeway. For AVs, it is recommended that the design lane be analyzed assuming 70% to 80% of all trucks utilize a single lane. Additionally, a review of truck only facilities could be conducted as a future activity to assess if the design of those facilities is consistent with Iowa DOT’s experience and assumed impact of AVs.
Iowa DOT thinks that AVs may provide a benefit in concrete pavement design in the consistency of vehicle wheel paths. Because concrete pavements tend to fail due to edge stress, vehicle wheel paths that never wander to the pavement edge would reduce that edge stress. However, more study may be needed on the topic because vehicles with zero wander may create a new critical location for material failure. Even with the potential benefits to edge stress due to AVs paths, a conservative pavement design might provide a 12-foot-wide lane for a 10-foot-wide left travel lane without an adjacent shoulder. This is consistent with earlier lane width recommendations developed by the project team due to mobility needs and expandability.
The pavement design discussion also focused on the concept that AVs may lead to active use of both travel lanes and shoulder areas. The conservative materials design strategy to account for that variability in lane use would be a consistent base design under the full width of the travel lane and shoulder pavement. Also, under the base, Iowa DOT would likely use geogrid for the full width across the travel lanes and shoulders. The use of geogrid would increase pavement strength, but may require added drainage expense to make sure subdrains were properly placed.
An additional set of pavement design considerations related to how future AVs lanes were placed. With AVs, there can be great flexibility in lane use because updates to lane use can be communicated directly to the vehicle. Yet, that freedom to virtually re-establish the lane lines at varying locations runs into a problem with pavement wear. Concrete pavements wear especially at the joints, so moving a lane in a way that placed the vehicle wheel path over a joint line would be a detriment to the pavement life. Likewise, the placement of future lanes in comparison to rumble strip locations is critical in concrete pavements, so a future lane change does not require passing over the rumble strips.
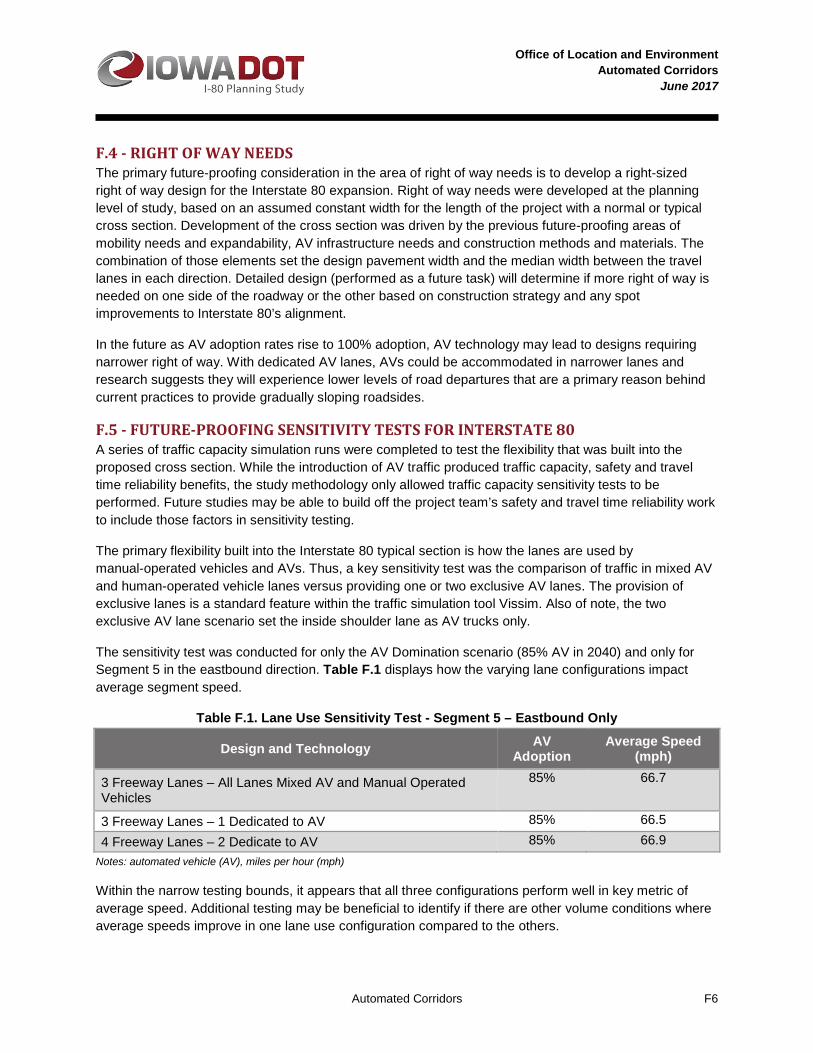
Office of Location and Environment Automated Corridors
June 2017
Automated Corridors F6
F.4 - RIGHT OF WAY NEEDS The primary future-proofing consideration in the area of right of way needs is to develop a right-sized right of way design for the Interstate 80 expansion. Right of way needs were developed at the planning level of study, based on an assumed constant width for the length of the project with a normal or typical cross section. Development of the cross section was driven by the previous future-proofing areas of mobility needs and expandability, AV infrastructure needs and construction methods and materials. The combination of those elements set the design pavement width and the median width between the travel lanes in each direction. Detailed design (performed as a future task) will determine if more right of way is needed on one side of the roadway or the other based on construction strategy and any spot improvements to Interstate 80’s alignment.
In the future as AV adoption rates rise to 100% adoption, AV technology may lead to designs requiring narrower right of way. With dedicated AV lanes, AVs could be accommodated in narrower lanes and research suggests they will experience lower levels of road departures that are a primary reason behind current practices to provide gradually sloping roadsides.
F.5 - FUTURE-PROOFING SENSITIVITY TESTS FOR INTERSTATE 80 A series of traffic capacity simulation runs were completed to test the flexibility that was built into the proposed cross section. While the introduction of AV traffic produced traffic capacity, safety and travel time reliability benefits, the study methodology only allowed traffic capacity sensitivity tests to be performed. Future studies may be able to build off the project team’s safety and travel time reliability work to include those factors in sensitivity testing.
The primary flexibility built into the Interstate 80 typical section is how the lanes are used by manual-operated vehicles and AVs. Thus, a key sensitivity test was the comparison of traffic in mixed AV and human-operated vehicle lanes versus providing one or two exclusive AV lanes. The provision of exclusive lanes is a standard feature within the traffic simulation tool Vissim. Also of note, the two exclusive AV lane scenario set the inside shoulder lane as AV trucks only.
The sensitivity test was conducted for only the AV Domination scenario (85% AV in 2040) and only for Segment 5 in the eastbound direction. Table F.1 displays how the varying lane configurations impact average segment speed.
Table F.1. Lane Use Sensitivity Test - Segment 5 – Eastbound Only
Design and Technology AV Adoption
Average Speed (mph)
3 Freeway Lanes – All Lanes Mixed AV and Manual Operated Vehicles
85% 66.7
3 Freeway Lanes – 1 Dedicated to AV 85% 66.5
4 Freeway Lanes – 2 Dedicate to AV 85% 66.9 Notes: automated vehicle (AV), miles per hour (mph)
Within the narrow testing bounds, it appears that all three configurations perform well in key metric of average speed. Additional testing may be beneficial to identify if there are other volume conditions where average speeds improve in one lane use configuration compared to the others.

Office of Location and Environment Automated Corridors
June 2017
Automated Corridors F7
The project team considered whether lane use configurations were sensitive to travel on steep upgrades. Many agencies use truck climbing lanes on mountainous terrain to separate the crawling trucks from the speeding cars.
The Vissim simulation test of this possible case built upon the previous lane configuration sensitivity test. Here, the project team needed only to change the network links to provide grade information. The test grade was uphill at 3% in the direction of travel for 0.5 mile. This grade represents a moderate increase in truck influence to traffic flow based on the HCM. The project team looked at Iowa DOT as-built plans for Interstate 80 when assessing the grade sensitivity test. Based on a sample of the as-built plan sets this upgrade condition modeled is a conservative case that likely only applies to between 10% and 20% of the vertical curves on rural Interstate 80.
The sensitivity simulation run results are shown in Table F.2. Speeds reported are the average of the freeway segment in the vicinity of the top of the upgrade. Also reported is the percent decrease in speed from the beginning of the upgrade section to the top of the upgrade.
Table F.2. Grade Sensitivity Test - Segment 5 – Eastbound Only
Design and Location AV Adoption %
Average Speed (mph)
Speed Decrease (%)
from Beginning to
Top of Upgrade
3 Freeway Lanes – All Lanes Mixed AV and Human-Operated Vehicles
85% 66.5 -4.4%
3 Freeway Lanes – 1 Dedicated to AV 85% 66.2 -5.0%
4 Freeway Lanes – 2 Dedicate to AV 85% 66.5 -4.3% Notes: automated vehicle (AV), miles per hour (mph)
Again, the speed difference between the contrasted lane configurations is small. That result is partially attributable to the small sample of possible conditions considered for this scenario test. Future study under a more robust number of scenarios may yield more certain and varied results. Additionally, the upgrade sensitivity test is somewhat surprising in that the alternative with four travel lanes in each direction does not substantially outperform the two alternatives with three travel lanes in each direction. This result suggests that future iterations of AV modeling with exclusive AV lanes may need to consider new lane selection models to properly split the modeled traffic into the lanes most beneficial to the traveler and the freeway corridor overall.
F.6 - POTENTIAL STATEWIDE FUTURE-PROOFING APPLICATIONS In order to determine future-proofing applications for rural Interstate 80, the project team conducted a high-level review of potential future-proofing applications. The list of applications is provided to document the findings of this high-level review. Corridor planning in urban areas, or high-level agency planning that tracks emerging trends, should consider further development of this list.
Management Strategies • Speed harmonization/Variable speed limits • Dynamic shoulder lanes

Office of Location and Environment Automated Corridors
June 2017
Automated Corridors F8
• Dynamic passing lanes • Variable lane restrictions • Dynamic striping • Flexible striping • En-route traveler information • Highway Helper • End-of-Queue warning
Pavement Strategies • Full depth shoulders • Higher density pavements for truck lanes • Pavement health monitoring systems • Self-healing pavements • Solar roadways • Wi-Fi enabled pavements
Design Strategies • Median crossovers • Animal crossings • Snow fences
AV Strategies • Communications backhaul (e.g., fiber) • Enhanced cellular coverage • Roadside equipment • Continuous power along the corridor • Map-supportive infrastructure
o GPS reference markers o Lane-level work zone database o Lane-level incident database
F.7 - FUTURE-PROOFING SUMMARY The design of roadways will change significantly as roadways have to support AV use. Because the future is unclear on how AVs will enter the existing vehicle mix, the best current strategy is to maintain flexibility. Additionally, agencies can make smart corridor investments, including cameras, sensors and communications equipment to prepare for the future where vehicles, infrastructure and agency traffic managers more seamlessly communicate and adjust to changing roadway conditions. The project team’s future-proofing recommendations lay out key design considerations that may improve Iowa DOT’s flexibility to safely and efficiently move both manual-operated cars and trucks and their AV counterparts.